Vienna in Figures 2010 - IMPACTS
Vienna in Figures 2010 - IMPACTS
Vienna in Figures 2010 - IMPACTS

Create successful ePaper yourself
Turn your PDF publications into a flip-book with our unique Google optimized e-Paper software.
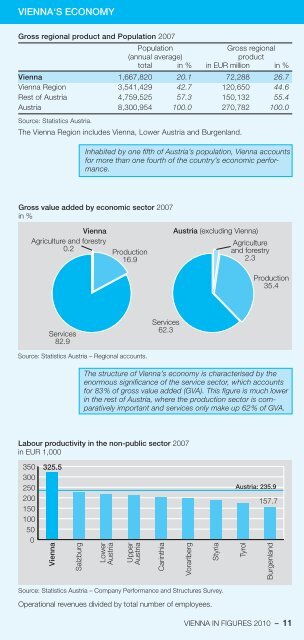
VIENNA‘S ECONOMY<br />
Gross regional product and Population 2007<br />
Population<br />
Gross regional<br />
(annual average)<br />
product<br />
total <strong>in</strong> % <strong>in</strong> EUR million i n %<br />
<strong>Vienna</strong> 1,667,820 20.1 72,288 26.7<br />
<strong>Vienna</strong> Region 3,541,429 42.7 120,650 44.6<br />
Rest of Austria 4,759,525 57.3 150,132 55.4<br />
Austria 8,300,954 100.0 270,782 100.0<br />
Source: Statistics Austria.<br />
The <strong>Vienna</strong> Region <strong>in</strong>cludes <strong>Vienna</strong>, Lower Austria and Burgenland.<br />
Inhabited by one fifth of Austria’s population, <strong>Vienna</strong> accounts<br />
for more than one fourth of the country’s economic performance.<br />
Gross value added by economic sector 2007<br />
<strong>in</strong> %<br />
<strong>Vienna</strong><br />
Agriculture and forestry<br />
0.2<br />
Production<br />
16.9<br />
Austria (exclud<strong>in</strong>g <strong>Vienna</strong>)<br />
Agriculture<br />
and forestry<br />
2.3<br />
Production<br />
35.4<br />
Services<br />
82.9<br />
Services<br />
62.3<br />
Source: Statistics Austria – Regional accounts.<br />
The structure of <strong>Vienna</strong>’s economy is characterised by the<br />
enormous significance of the service sector, which accounts<br />
for 83% of gross value added (GVA). This figure is much lower<br />
<strong>in</strong> the rest of Austria, where the production sector is comparatively<br />
important and services only make up 62% of GVA.<br />
Labour productivity <strong>in</strong> the non-public sector 2007<br />
<strong>in</strong> EUR 1,000<br />
350<br />
300<br />
250<br />
200<br />
150<br />
100<br />
50<br />
0<br />
325.5<br />
<strong>Vienna</strong><br />
Salzburg<br />
Lower<br />
Austria<br />
Upper<br />
Austria<br />
Car<strong>in</strong>thia<br />
Vorarlberg<br />
Styria<br />
Austria: 235.9<br />
157.7<br />
Tyrol<br />
Burgenland<br />
Source: Statistics Austria – Company Performance and Structures Survey.<br />
Operational revenues divided by total number of employees.<br />
VIENNA IN FIGURES <strong>2010</strong> 2009 – 11