1. Introduction - IMP Group
1. Introduction - IMP Group
1. Introduction - IMP Group

Create successful ePaper yourself
Turn your PDF publications into a flip-book with our unique Google optimized e-Paper software.
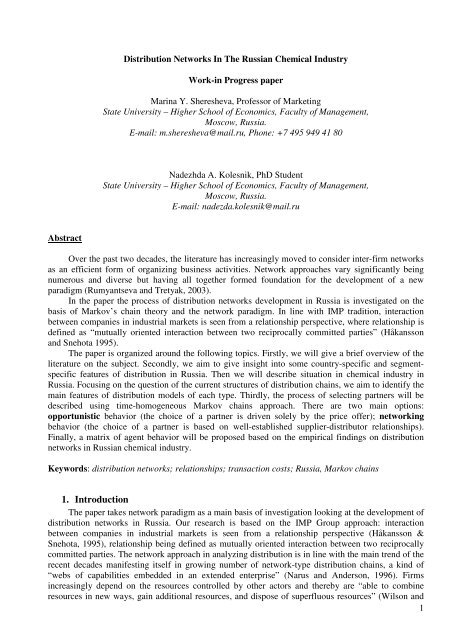
Distribution Networks In The Russian Chemical Industry<br />
Work-in Progress paper<br />
Marina Y. Sheresheva, Professor of Marketing<br />
State University – Higher School of Economics, Faculty of Management,<br />
Moscow, Russia.<br />
E-mail: m.sheresheva@mail.ru, Phone: +7 495 949 41 80<br />
Nadezhda A. Kolesnik, PhD Student<br />
State University – Higher School of Economics, Faculty of Management,<br />
Moscow, Russia.<br />
E-mail: nadezda.kolesnik@mail.ru<br />
Abstract<br />
Over the past two decades, the literature has increasingly moved to consider inter-firm networks<br />
as an efficient form of organizing business activities. Network approaches vary significantly being<br />
numerous and diverse but having all together formed foundation for the development of a new<br />
paradigm (Rumyantseva and Tretyak, 2003).<br />
In the paper the process of distribution networks development in Russia is investigated on the<br />
basis of Markov’s chain theory and the network paradigm. In line with <strong>IMP</strong> tradition, interaction<br />
between companies in industrial markets is seen from a relationship perspective, where relationship is<br />
defined as “mutually oriented interaction between two reciprocally committed parties” (Håkansson<br />
and Snehota 1995).<br />
The paper is organized around the following topics. Firstly, we will give a brief overview of the<br />
literature on the subject. Secondly, we aim to give insight into some country-specific and segmentspecific<br />
features of distribution in Russia. Then we will describe situation in chemical industry in<br />
Russia. Focusing on the question of the current structures of distribution chains, we aim to identify the<br />
main features of distribution models of each type. Thirdly, the process of selecting partners will be<br />
described using time-homogeneous Markov chains approach. There are two main options:<br />
opportunistic behavior (the choice of a partner is driven solely by the price offer); networking<br />
behavior (the choice of a partner is based on well-established supplier-distributor relationships).<br />
Finally, a matrix of agent behavior will be proposed based on the empirical findings on distribution<br />
networks in Russian chemical industry.<br />
Keywords: distribution networks; relationships; transaction costs; Russia, Markov chains<br />
<strong>1.</strong> <strong>Introduction</strong><br />
The paper takes network paradigm as a main basis of investigation looking at the development of<br />
distribution networks in Russia. Our research is based on the <strong>IMP</strong> <strong>Group</strong> approach: interaction<br />
between companies in industrial markets is seen from a relationship perspective (Håkansson &<br />
Snehota, 1995), relationship being defined as mutually oriented interaction between two reciprocally<br />
committed parties. The network approach in analyzing distribution is in line with the main trend of the<br />
recent decades manifesting itself in growing number of network-type distribution chains, a kind of<br />
“webs of capabilities embedded in an extended enterprise” (Narus and Anderson, 1996). Firms<br />
increasingly depend on the resources controlled by other actors and thereby are “able to combine<br />
resources in new ways, gain additional resources, and dispose of superfluous resources” (Wilson and<br />
1
Daniel, 2007). Such distribution practice allows tailoring to individual end-user requirements (Gadde<br />
and Ford, 2008).<br />
In this paper Markov chain model is suggested to examine distributors’ behavior in a network.<br />
The model makes it possible to take into account the focal network agent (distributor) switching over<br />
between the company and its competitors. The delivery is optimized by this agent at each decisionmaking<br />
node. Therefore a probabilistic way of the network formation process can be used.<br />
The empirical study draws on the case method (Eisenhardt & Graebner 2007; Flyvbjerg 2006).<br />
As a matter of fact, single case often provides better theoretical insights than multiple-case research<br />
based on creating good constructs (Dyer and Wilkins, 1991). The case study approach implies the<br />
detailed examination of a single example of a class of phenomena.<br />
2. Literature review<br />
2.<strong>1.</strong> Distribution networks: a relationship perspective<br />
Over the past two decades, the literature has increasingly moved to consider inter-firm networks<br />
as an efficient form of organizing business activities (Rumyantseva and Tretyak, 2003). Business<br />
networks can be viewed as inter-firm exchange relationships or as interconnections between<br />
autonomous business units, either initiated by the supplier or the buyer, whereby both parties<br />
recognize their mutual dependence and interest in each others resources (Cunningham, 1980). The<br />
involved parties are free to enter into, maintain or dissolve these relationships and networks (Camp,<br />
2004).<br />
B2B distribution is considered to have been undergoing a process of significant evolution<br />
(Gadde, 2000; Gadde, Snehota, 2001; Frauendorf et al, 2007; Tretyak, Sheresheva, 2005; Vaskin,<br />
2008). Distribution strategy is recognized as a key factor for enhancing customer satisfaction which is<br />
crucial for inter-firm network success. Distributor being not long ago considered mainly as a passive<br />
collector of orders is now an agent having the core position in the supply chain. First of all, distributor<br />
is an agent selecting appropriate partners in order to decrease business risk and improve efficiency. It<br />
is one of the most important managerial decisions in networking (Tallura and Backer, 1996; Jagdev<br />
and Browne, 1998; Mikhailov, 2002). Distributor’s efforts to integrate manufacturers, suppliers of<br />
different services and customers in the supply network help to cope with the issues of optimal<br />
quantity, cost, and quality.<br />
J.A.Weber was quite right to admit that resource sharing in distribution serves as foundation for<br />
building sustainable competitive advantage, due to the increase of resource body available to the<br />
company and increase of flexibility (Weber, 2001). The role of distributor in supply chain is now<br />
considered to be crucial for establishing relations with numerous agents specializing in specific<br />
distribution functions: transport companies, finance organizations, custom brokers etc. The<br />
interconnection of firms’ activities generates, and is increased by, interconnected relationships that<br />
outline the network approach within the supply chain (Cantu et al, 2009).<br />
Russia as an economy in transition provides a unique opportunity to investigate changing and<br />
adapting network structures, stakeholder interaction and relationship constellations (Smirnova et al.,<br />
2009). The nature of the relationships in Russia analyzed recently in a couple of papers (e.g. Davis et<br />
al, 1994; Johanson, 2007; Smirnova, Kousch, 2007; Tretyak, Sheresheva, 2005) proved to have some<br />
specifics due to overall specifics of the emerging Russian economy, including instability of the<br />
market, lack of information on potential partners, higher propensity to opportunistic behavior (Ford et<br />
al, 2006, Johanson 2007, Halinen, Salmi, 1996). Distribituon in Russia is characterized by some trends<br />
including shift in distribution channels’ structure, cutting number of distributors in many industries,<br />
internalization of distribution networks, and growing role of information infrastructure (Sheresheva,<br />
2005; Vaskin, 2008). Still, there is a need in more research, since the empirical data is scarce,<br />
especially on networking in particular branches of Russian economy.<br />
2
2.2. Markov’s chain theory<br />
Research on network formation is generally motivated by the observation that social structure is<br />
important in a wide range of interactions, including buying and selling of many goods and services.<br />
Very popular tools in modeling networks are those of the graph theory. Network is considered as<br />
either a non-directed or a directed graph; the type of graph is chosen depending on the context.<br />
There are two main types of network formation models. The first type is derived from random<br />
graph theory considering economic or social relationship as a random variable. The other uses game<br />
theory tools and examines actors (people, or firms, or other actors involved) as exercising discretion in<br />
forming their relationships.<br />
In this paper we will focus on the random graphs as formal models used to understand the<br />
network formation: a good example is pure Bernoulli process of link formation (see Erdös and Rényi,<br />
1960). Let’s consider a network where the (non-directed) link between any two nodes is formed with<br />
some probability p (where 1>p>0), and this process occurs independently across pairs of nodes. Such<br />
random method of forming links potentially allows emergence of any network, still some networks are<br />
much more likely to emerge. Moreover, as the number of nodes becomes larger, there is much to be<br />
deduced what the structure the network is likely to be, as a function of p. As Erdös and Rényi had<br />
shown, such a random graph exhibits a number of ‘phase’ transitions as the probability of forming<br />
links, p, is varied in relation to the number of nodes, n; that is, resulting networks exhibit different<br />
characteristics depending on the relative sizes of p and n.<br />
Whether or not such a random graph model is recognized to be a good fit as a model of network<br />
formation, it is still of definite interest. It indicates that networks having different densities of links<br />
tend to have different structures. The model also provides comparisons for network formation<br />
processes. Some of the basic traits of random graph are as follows. When p is small in relation to n, so<br />
that p1/n, then a single ‘giant<br />
component’ emerges; that is, with a probability approaching 1 the graph consists of one large<br />
component, which contains a nontrivial fraction of the nodes, and all other components are<br />
vanishingly small in comparison.<br />
Advanced random-based models of networks take into consideration the most basic network<br />
property that the presence of links tends to be correlated. On an intuitive level, models of network<br />
formation where links are formed independently tend to look too much like ‘trees’, while observed<br />
social and economic networks tend to exhibit substantial clustering, with many more cycles than<br />
would be generated at random (Watts, 1999).<br />
Frank and Strauss (1986) identified a class of random graphs that generalize Bernoulli random<br />
graphs, which they called ‘Markov graphs’ (also referred to as p* networks). Their idea was to allow<br />
the chance that a given link forms to be dependent on whether or not neighboring links are formed.<br />
Specific interdependencies require special structures, because, for instance, making one link dependent<br />
on a second, and the second on the third, can imply some interdependencies between the first and<br />
third. These sorts of dependencies are difficult to analyze in a tractable manner, but nevertheless some<br />
special versions of such models have been useful in statistical estimation of networks (Jackson, 2008)/<br />
Formally, a Markov chain is a discrete random process with the Markov property (Markov,<br />
1906; Markov, 1971). A discrete random process means a system which can be in various states, and<br />
which changes randomly in discrete steps. It can be helpful to think of the system as evolving through<br />
discrete steps in time, although strictly speaking the "step" may have nothing to do with time. The<br />
Markov property states that the probability distribution for the system at the next step (and in fact at all<br />
future steps) only depends on the current state of the system, and not additionally on the state of the<br />
system at previous steps. Since the system changes randomly, it is generally impossible to predict the<br />
exact state of the system in the future. However, the statistical properties of the system at a great many<br />
3
steps in the future can often be described. In some applications these statistical properties are<br />
important.<br />
The changes of state of the system are called transitions, and the probabilities associated with<br />
various state-changes are called transition probabilities.<br />
Formal definition<br />
A Markov chain concerns about a sequence of random variables (X1, X2, X3, ...) which<br />
corresponds to the state of a certain system, in such a way that the state at one time horizon depends<br />
only on the one in the previous time horizon. Independence of the present state, the future and past<br />
states is the basic propriety of Markov chain. Formally,<br />
The possible values of Xi form a countable set S called the state space of the chain.<br />
Markov chains are often described by a directed graph, where the edges are labeled by the<br />
probabilities of going from one state to the other states.<br />
Variations<br />
• Continuous-time Markov processes have a continuous index.<br />
• Time-homogeneous Markov chains (or stationary Markov chains) are processes where<br />
for all n. The probability of the transition is independent of n.<br />
• A Markov chain of order m (or a Markov chain with memory m) where m is finite, is a process<br />
satisfying<br />
In other words, the future state depends on the past m states. It is possible to construct a chain<br />
(Yn) from (Xn) which has the 'classical' Markov property as follows:<br />
Let Yn = (Xn, Xn−1, ..., Xn−m+1), the ordered m-tuple of X values. Then Yn is a Markov<br />
chain with state space Sm and has the classical Markov property.<br />
An additive Markov chain of order m where m is finite, is where<br />
Markov chains<br />
The probability of going from state i to state j in n time steps is<br />
and the single-step transition is<br />
For a time-homogeneous Markov chain:<br />
and<br />
4
so, the n-step transition satisfies the Chapman–Kolmogorov equation, that for any k such that<br />
0 < k < n,<br />
where S is the state space of the Markov chain.<br />
The marginal distribution Pr(X n = x) is the distribution over states at time n. The initial distribution is<br />
Pr(X 0 = x). The evolution of the process through one time step is described by<br />
Note: The superscript (n) is an index and not an exponent. (Sokolov, Chistykova, 2005).<br />
3. Distribution chains in Russia: evidence from chemical industry<br />
There are three main stages of distribution channel formation in Russia which correlate with<br />
the drastic changes in economic and social environment. Distribution chains in the USSR were<br />
hieratical structures strictly managed by government under conditions of non-market economy. Over<br />
the post-Soviet decades, the Russian market has undergone numerous changes, with distribution<br />
chains being at first badly destroyed. During the first post-Soviet decade demand exceeded supply in<br />
almost all segments of Russian market. In the highly uncertain and unstable political and economic<br />
environment, long-term relations were almost impossible. A lot of “fly-by-night companies”<br />
established in 1990s purchased and distributed goods without any commitment. The 1998 default<br />
leaded to decreased number of international trade contacts and impressive slump of import. Still,<br />
during the next decade the basic economic infrastructure had been formed and then distribution chains<br />
restored step by step at a new voluntary basis. Due to ICT intensively spread in Moscow and then in<br />
other regions of Russia, building of inter-firm networks became less costly, and a number of<br />
sustainable distribution networks started to grow. It is precisely this last decade developments that will<br />
be the main focus of our research based on the data on chemical distribution channels of western part<br />
of Russian Federation.<br />
The chosen market segment is polymerized vinyl chloride (PVC) market. Traditionally this<br />
market includes three main groups of row materials for PVC production:<br />
1) PVC resins – the basic component;<br />
2) PVC plasticizer – which is added to the resins in order to get necessary viscosity of plastic<br />
mass (such as DOP, DINP);<br />
3) Additives – which are added to the plastic mass to improve the production process and for<br />
giving necessary proprieties to manufactured goods. This group includes thermo stabilizers, lubricants,<br />
flame retardants, coloring agents, etc.<br />
PVC market in Russia had an impressive dynamics during the decade having grown 2.4 times in years<br />
2000-2007. In 2008-2009 the dynamics became slower due to crisis but some companies including<br />
Ruskhimset still managed further growth. In 2009 there was a remarkable reduction of PVC<br />
consumption in Russia. In the first half of the year the consumption of PVC was 40 % in comparison<br />
with 2008. In summer 2009 the highest prices were fixed due to unprecedented deficit; PVC prices<br />
increase in January- June 2009 was about 48,5 %. So, the market has obtained seasonality in the last<br />
years. It is also important to mention a 27 % increase of PVC price in Europe and that of 14,8 % in<br />
Asia.<br />
Average price for domestic PVC resin remained at the level of <strong>1.</strong>05 euro while the price for<br />
import PVC resin did not exceed 0.7–1 euro per kg on the terms Ex Works storehouse in Europe. The<br />
Russian domestic market volume is estimated by 974.4 thousand tons in 2008. About a half of this<br />
amount (578.6 thousand tones) counts for domestic production, the rest was imported. Russian<br />
5
government takes measures protecting local producers in spite of the fact that domestic production<br />
capacities are unable to satisfy demand for PVC row materials. The custom duty for PVC resin is 15<br />
%, and in October 2009 the additional euro compound was brought in (0,12 euro per Kg). Volatility of<br />
prices and inability of production capacities to supply the demand by domestic row product are the<br />
main difficulties facing Russian market of PVC products.<br />
There are numerous actors at the market, including large producers, small trade companies and<br />
a lot of consumers. The range of PVC products is rapidly increasing. As a result, it is very difficult to<br />
reach any consensus within the PVC market community. Under these circumstances networking may<br />
be crucial for obtaining stability and predictability of the market.<br />
4. «Ruskhimset» company<br />
The Join Stock Company Russian Chemical Net («Ruskhimset») chosen for the case study<br />
started its operations in 2000. The company provides following services: delivery, information<br />
support, storage, etc. Its annual turnover is now more than 50 million USD. There is about 30<br />
employees in Moscow office and about 100 in regional representative offices. The main goal is to<br />
provide wide range of chemicals for small and medium producers which are the target market of the<br />
company.<br />
Considering huge territory of Russian Federation, there is a need for establishing regional<br />
infrastructure. JSC «Ruskhimset» has sales representative offices and specialized warehouses in a<br />
number of regions including Moscow, Saint-Petersburg, Tambov, Volgograd, Kazan, Yekaterinburg,<br />
Yaroslavl, Ivanovo, Rostov-on-Don, Perm, Minsk (Belarus).<br />
In order to understand the structure of value creation chain of «Ruskhimset» we aim to analyze<br />
the actors of network: 1) Suppliers (Domestic, External suppliers); 2) Transport companies (Internal,<br />
International); 3) Financial agents (Banks, Insurance agents); 4) Distribution network of<br />
representations.<br />
The starting point of analysis is to construct graphs of distribution channels. As a matter of<br />
fact, actors of channels have their own goals, producers being keen on promoting the product and<br />
expanding geographically, transport companies being interested in stable volume of cargo, consumers<br />
seeking for the best quality for less money, etc. Still, every actor is interested in gaining sustainable<br />
competitiveness and profit. Building the network and interact on the long-range basis is a way to raise<br />
their ability to create value and thus benefit from their position in the network.<br />
Distribution chain of PVC chemicals we describe in terms of five essential networking<br />
principles include establishing a clear purpose and creating communication links (Stamps, Lipnack,<br />
1994). «Ruskhimset» has established relationships with suppliers from all over the world. Actually,<br />
there are three types of supply chains managed by it:<br />
1) Russian – purchasing of goods from domestic producers.<br />
2) European - purchasing of goods from the European suppliers: Germany, Hungary, Italy,<br />
Switzerland, Belgium, Holland and including USA.<br />
3) Asian - purchasing of goods of Asian origin: China, Taiwan, South Korea, and India.<br />
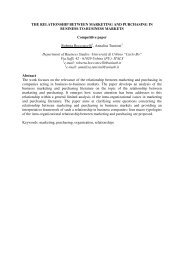
The Chart 1 below shows annual increase of import goods share:<br />
Product structure dynamics<br />
100%<br />
75%<br />
10%<br />
5%<br />
15%<br />
15%<br />
15%<br />
50%<br />
25%<br />
90%<br />
80%<br />
70%<br />
Asian suppliers<br />
European suppliers<br />
Domestic suppliers<br />
0%<br />
2007 2008 2009<br />
Year<br />
6
Our point of view is that such an increase is widely stimulated by higher profitability of import<br />
goods. It is probably due to the shortage in financial and human resources necessary for<br />
internationalizing relationships which is typical of Russian market.<br />
.<br />
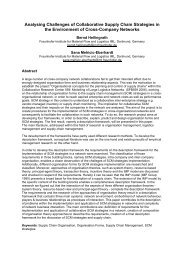
The Chart 2 below shows average profitability of sales:<br />
Average profitability of product sales<br />
10%<br />
10%<br />
5%<br />
5%<br />
7%<br />
Products of Russian<br />
production<br />
Products of European<br />
production<br />
Products of Asian<br />
production<br />
0%<br />
Relationships built by «Ruskhimset» will be described hereinafter using ARA model. We aim<br />
to analyze these relationships by means of describing resources available, interaction parties involved,<br />
and interaction process and activities.<br />
4.<strong>1.</strong> Distribution on the domestic market<br />
Initially in 2000 year «Ruskhimset» started its business with domestic producers. So first of all<br />
we are going to describe a supply chain between domestic market actors. The majority of domestic<br />
suppliers have got common characteristic: most of them are built during the Soviet history, their<br />
production’ quality is rather poor due to low tech and the outdated equipment. Obsolete facilities lead<br />
to the regular suspension of production and increased risk. The competitiveness is preserved mostly by<br />
setting lower prices. Since Russian government protects local producers by means of import duties<br />
regulation, it helps such companies to survive but prevent them from developing skills and inventing<br />
innovations. They also have no real stimulus to improve promotion of their products. Production of<br />
goods is the main concern, not logistics nor marketing. Products are sold on the Ex Works terms.<br />
The graph of distribution channel is as follows:<br />
Consumer A<br />
Producer<br />
Distributor<br />
Consumer B<br />
Consumer C<br />
Producer is interested in more “transactional” than “relational” ties seeking for distributors able<br />
to purchase in bulk and guarantee payment in time. Distributor organizes transportation using its own<br />
transport facilities or service of carrier for delivery goods to the warehouse in Moscow region.<br />
The chain may be even shorter if factory ships the goods directly to the final consumer.<br />
Let’s illustrate this type of relationships by giving an example of Roshalskiy factory of<br />
plasticizers which is one of the main partners of «Ruskhimset». This factory was established in 1960s<br />
with the aim to produce plasticizer - dioctyl phthalate (DOF). Now the factory is privately owned.<br />
«Ruskhimset» started to work with this factory as distributor in 2000. Since the partners had<br />
complementary skills and competences, cooperation was acknowledged as mutually beneficial.<br />
7
Interaction between companies is now quite intensive, being based mainly on monthly agreements on<br />
schedule of delivery and price. While negotiating the factory captures dominant position. It seeks to<br />
dictate prices, volumes, and terms of delivery. Still, well established social contacts between staff of<br />
both companies always help to come to the mutually beneficial agreement. So, the channel is stable<br />
under turbulent environment and hard economic conditions mostly due to extensive social interaction.<br />
The relationships between partners faced recently a serious challenge: Roshalskiy factory of<br />
plasticizers ceased the production for several months due to Energy Company refuse to provide energy<br />
(as a matter of fact, the factory had a huge debt at the time). In order to fill in the gap «Ruskhimset»<br />
had to diversify suppliers, and the additional supply from European companies was considered a best<br />
decision.<br />
4.2. European partners<br />
Cooperation with foreign suppliers is a good opportunity to extend product line and thus to<br />
attract more consumers. It is important to mention that international relations have positive impact on<br />
the image. In 2006 «Ruskhimset» had started to develop international business. Organizational<br />
structure was supplemented by the International relation department.<br />
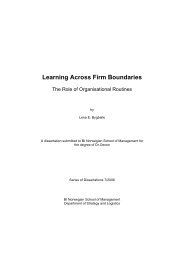
The distribution channel is rather complex as it is shown at the graph below; products going<br />
through the chain are usually unique, branded, of high quality and thus expensive.<br />
Storehouse<br />
Third party logistic<br />
supplier<br />
Customs broker<br />
Ultimate supplier<br />
– producer<br />
Sales office<br />
Representative office<br />
Distributor<br />
Ultimate consumer<br />
Financial provider<br />
Large European chemical producers provide financial support, e.g. postponement of payment,<br />
to the reliable partners but it takes certain time and efforts to prove the reliability.<br />
European suppliers consider the BRIC markets to be very perspective and thus are intended to<br />
expand looking for further projects. As a result, transactions tend to increase constantly being quite<br />
regular and stable. The well-known European companies are open to the cooperation, and most of<br />
them have got representative offices in Moscow which are good help to facilitate development of<br />
relationships.<br />
Communications in this chain are to a certain extent formalized and poorly developed. On the<br />
one hand, formalizing communications seem quite sound in terms of some business processes, such as<br />
placement of orders, arrangement of shipment receipt of shipping documents, payment etc. On the<br />
other hand, underdeveloped communications prevent taking into account special demands and requests<br />
of consumer. Exchange of information occurs mainly between representative working in Russian<br />
office and customer care manager in the point of shipment. Therefore the distribution efficiency<br />
strongly depends on personal relationships and individual qualities of certain persons. As to strategic<br />
issues of business relationships, they are usually defined on the CEO level.<br />
European products are not yet well known for Russian companies. The overall demand for<br />
these products is quite modest. It appears to be one of the important obstacles in development of<br />
interactions. But in fact the main obstacle for effective development of relations with European<br />
companies is high price of the goods. The lower price could be provided by Asian suppliers.<br />
8
4.3. Asian partners<br />
In search for cheaper supply «Ruskhimset» started to establish contacts with Asian suppliers,<br />
since Asian countries have recently gained quite good competitive positions as producers of chemical<br />
row materials. Now production capacities of Asian region account for 20 mln. tones of PVC (about 50<br />
% of worldwide capacities). Price-quality relationship for PVC from Asia is quite appropriate, and<br />
there are numerous suppliers. Still they have some common disadvantages, and the main problem is<br />
long period of delivery (45 to 60 days). The main way to start relationships with Asian companies is to<br />
take part in the exhibition. The interaction process between Russian and Asian firms is very intensive<br />
now but not very effective due to the language and culture differences.<br />
The main problem in collaborating with Asia is long lead time. Working on the prepayment<br />
conditions «Ruskhimset» has to tie finance for 2-3 months. Another disadvantage is alteration of<br />
prices occurring almost every week. The final consumer price correlates strongly with fluctuations of<br />
rubble to dollar exchange rate. Price of the offer depends on stock exchange price and demand on the<br />
local (e.g. Chinese) market. Due to mentioned reasons transactions with Asian producers are quite<br />
risky. Aiming to decrease the uncertainty and to create mutual trust «Ruskhimset» facilitates<br />
development of distribution network with some partners from Asia. The chain of distribution in that<br />
third case usually is as follows:<br />
Third party logistic supplier<br />
Custom broker<br />
Customs broker<br />
Ultimate supplier –<br />
producer<br />
Distributor<br />
Ultimate consumer<br />
Financial provider<br />
5. Time-homogeneous Markov chains in distribution<br />
Let’s now try to apply the mathematical tool of Markov’s chain theory to the process of<br />
distribution network creation, presuming that time-homogeneous Markov chain has got numerous<br />
similarities with the process due to the following:<br />
1) Probabilities of future states of the process depend only on the present state. This can be used<br />
for description of opportunistic behavior of actors. It is applicable for description of network’s agent<br />
behavior in case of inletting the permanent state which will be set indisputably (i.e. with probability<br />
one).<br />
2) Existence of steps. Markov theory is applicable for description of process in discrete time. In<br />
our case it can be represented by sequence of transactions between economic agents.<br />
We aim to describe the process of choosing a partner from the set of homogenous agents<br />
providing similar goods or services for distributor (product, credit, transport, storehouse, etc.).<br />
Let the set of system’s statuses ( i 1<br />
, i 2<br />
,..., i N<br />
) be the set of homogenous agents. Each step is one<br />
transaction with one of the agents. There are two options: opportunistic behavior (the choice driven<br />
solely by the price offer) and networking behavior (based on well-established supplier-distributor<br />
relationships).<br />
At each decision-making node distributor make a choice aiming to optimize the delivery. In<br />
order to simplify process of decision making it chooses not among all participants of the market, but<br />
among those who are in its network. In the network there may be several suppliers of one product,<br />
several 3PL providers, etc. Distributor can link any partner from the network with some probability.<br />
9
Suppliers<br />
Financial<br />
support<br />
3 PL Distributor Ultimate consumer<br />
S<br />
T<br />
D<br />
F<br />
In the case of opportunistic behavior we assign probabilities according to prices. For example:<br />
if a<br />
1<br />
, a2<br />
,..., aN<br />
- prices that offer appropriate actors i 1<br />
, i 2<br />
,..., iN<br />
and ξ is random variables that adopts<br />
the values i 1<br />
, i 2<br />
,..., iN<br />
, then probability of choice actor i k<br />
(distribution of ξ ) can be set as<br />
P( ξ = i ) =<br />
The probabilities of transition are for example<br />
k<br />
( a )<br />
N<br />
∑<br />
j=<br />
1<br />
−1<br />
k<br />
( a )<br />
−1<br />
j<br />
.<br />
⎛<br />
⎞<br />
−1<br />
⎜ ( a<br />
j<br />
) ⎟<br />
Pr( ξn+ 1<br />
= j ξn = i) = pij = I( a<br />
j<br />
≤ ai<br />
) ⋅ ⎜ −1<br />
( ak<br />
) ⎟ ,<br />
⎜ ∑ ⎟<br />
⎝ ( k: ak<br />
≤ai<br />
) ⎠<br />
where I( a ≤ a ) is an indicator function.<br />
j<br />
i<br />
Then the one-step transition matrix is given by<br />
P =<br />
⎛<br />
⎜<br />
⎜<br />
P P P<br />
⎜ P P P<br />
⎜<br />
⎜... ... ...<br />
⎜<br />
⎝ P P P<br />
11 12 1m<br />
21 22 2m<br />
m1 m2<br />
mm<br />
⎞<br />
⎟<br />
⎟<br />
⎟<br />
⎟<br />
⎟<br />
⎟<br />
⎠<br />
For example, there are three transport companies (i1,i2,i3) which provide third party logistic (3PL)<br />
services. In actual practice the choice of a 3PL provider depends on a variety of factors which differ<br />
from shipment to shipment. In order to eliminate these factors we have made a request for delivery of<br />
20 tones of the product from the storehouse of supplier (A) to the store house of distributor (B).<br />
We consider a sequence of tree transportation services rates from our 3PL suppliers (m=3) given<br />
by: {3500,3650,3700}<br />
10
The matrix of transition probabilities (P ij ) will be the following<br />
⎛ 1 0 0 ⎞<br />
⎜<br />
⎟<br />
0,51773 0,48227 0<br />
⎜ 0,350825 0,326796 0,32238⎟<br />
⎝<br />
⎠<br />
The matrix shows probability of moving from one partner to another. We see that probability is<br />
higher for the transport company with the lower price. But there is always probability that we will not<br />
choose an agent with the best price offer.<br />
The lower row of the matrix shows that all companies may have equal chances. This situation is<br />
possible due to two reasons. At first, in our case the price difference is insignificant. Secondly, there is<br />
price does not play the key role in all relations.<br />
The same approach could be applied to a choice process of other partners in the network.<br />
In the case of networking behavior we can equal to the highest value, for example 1, the<br />
probability of choice of established partner. Then probabilities to choose another partner are equal to<br />
0.<br />
p = 1; = 0 , j ≠ k , if i k is our established partner.<br />
ik<br />
p ij<br />
For example, the second transport company is a partner in supply chain. Then the most probable<br />
choice will be that company. That is matrix of transition probabilities is the following one<br />
⎛ 0 1 0⎞<br />
⎜ ⎟<br />
0 1 0<br />
⎜ 0 1 0⎟<br />
⎝ ⎠<br />
This matrix shows probability, that probability of choosing of our permanent partner is equals to<br />
100 %. In that case it does not matter for company how cheaper other transportation services rates are.<br />
Appliance of Markov Chain theory is mostly convenient for step-by-step processes. Moreover<br />
some of the processes can be managed or controlled. In this case we have an optimization problem<br />
with some objective function. In our case we could try to control the supply chain formation by<br />
choosing partners that would provide an optimal value of this function.<br />
Explicit benefits, which could be expressed in money value, are rather obvious. At the same<br />
time, it is rather difficult to estimate implicit benefits of transaction. Still, once we have calculated<br />
probabilities according to prices, we are able to compare them with empirical probabilities. The<br />
difference between transition and empirical probabilities could help us to evaluate implicit benefits<br />
which we get from the relations with partner in terms of probability theory.<br />
The problem is trivial when the objective function is oriented only on product or service price.<br />
Then the minimal price would provide the optimal value of wealthy objective function. Situation<br />
becomes nontrivial when the hazard component appears. Then we could try to apply some results from<br />
optimal control theory. It allows us to compare an opportunistic behavior that has no implicit profit (or<br />
implicit hazard) and networking behavior that may provide a compensation for lost profit.<br />
We can formalize our value creation chain with the following criterion function:<br />
C dist = Tr E dist + Ma E dist + Fn E dist + S E I<br />
dist + Ma dist , where:<br />
C dist - cost in distribution network<br />
E –<br />
Tr dist transport, explicit costs<br />
E<br />
Ma dist - marketing, explicit costs<br />
E<br />
Fn dist - finance, explicit costs<br />
E<br />
S dist - storage, explicit costs<br />
I<br />
Ma dist -marketing, implicit costs (BTL)<br />
The first attempt will be applying Controlled Markov chain model that allows us to find an<br />
optimal strategy in terms of appliance opportunistic or networking strategy. Each transition is provided<br />
here by a profit (positive or negative) and we can choose some transition probabilities on each time<br />
step from special set.<br />
11
The existing algorithms of optimization of Controlled Markov chains are quite complex even in<br />
small problem dimensions. In our case the simple “brute force” comparison is more compatible.<br />
Markov Chain theory describes the model quite well, so the direction of the further researches is<br />
in searching more adequate and simple ways of comparison 2 models of behavior within the Markov<br />
Chain theory.<br />
6. Conclusions<br />
Emerging distribution networks of chemicals in Russia being already identifiable are yet<br />
characterized by instability relationships. These dynamic networks are headed by focal firm ("chain<br />
captain") regulating distribution in commercial terms.<br />
There are many small and medium producers of PVC in Russia filling mainly special orders<br />
concerning rather small quantities. As a result, individual client approach has to be applied and thus<br />
development of network relationships is reinforced.<br />
Social contacts being the main base of business relations, close to the network type described<br />
by M.Granovetter (Granovetter, 1983; Granovetter 1985), build the main specifics of "entirely<br />
domestic" chains. As to distribution networks including foreign partners, the main concern is the<br />
reputation of partners and their goods. Still, in case of «Ruskhimset» there is also an obvious search<br />
for partners providing fair prices.<br />
Distribution network including European partners usually becomes a part of already existing<br />
European distribution chain while cooperation with Asian partners, though regarded as prospective, is<br />
not yet well developed.<br />
Companies on the market of chemicals are turning their hierarchical supply chains into<br />
strategic networks of partnerships but still fragmented. Networks are based on pooling complementary<br />
skills and resources by a huge number of actors whose activities are coordinated and synchronized by<br />
distributors. In our case a focal company «Ruskhimset» initiated cooperation and establishing network<br />
relationships and managed to coordinate the flow of information and goods quite successfully.<br />
Distribution chain stability and flexibility gained through networking helped the company to survive<br />
the crisis. Long term cooperation served as a base for trust within the network and thus made it<br />
possible to get some agent’s payments postponed. It is important to underline that some competitors<br />
had to leave the market while the «Ruskhimset» company’s profit increased rapidly in 2009. So, the<br />
main conclusion is: Network approach to distribution of chemical products is helpful in terms of<br />
sustainability and competitive advantage. Networking does matter – moreover, it is of great<br />
importance in unstable environment. In Breyer’s words, “The channel group is obviously more than<br />
mere collection of individual channels – it is in the nature of a network” (Breyer, 1964).<br />
In this paper network formation process is described in a probabilistic way. Markov chain model<br />
distributor optimizes the delivery at each decision-making node. One of the benefits to the network<br />
management is then as follows: once we have calculated probabilities according to prices we can<br />
compare them with empirical probabilities. The difference between transition and empirical<br />
probabilities could help us to evaluate implicit benefits which we get from the relations with partner in<br />
terms of probability theory.<br />
Markov Chain theory describes the model of network formation quite well, so the direction of<br />
the further research will be searching more adequate and simple ways of comparing two models of<br />
behavior with the Markov Chain theory tool.<br />
References<br />
Achrol, R.S. (1997) ‘Changes in the theory of interorganizational relations in marketing: toward<br />
a network paradigm’, Journal of the Academy of Marketing Science, Vol. 25, No.1, pp. 56-7<strong>1.</strong><br />
Breyer, R. (1964) ‘Some observations on structural formation and the growth of marketing<br />
channels’, in: Alderson, W., Shapiro, S. (Eds), Richard D. Irwin, Homewood, IL.<br />
Cantu, C., Montagnini, F., and Sebastiani, R. (2009), ‘The Connection of Knowledge in a<br />
Network Distribution Perspective.MC Elettrici and Farmintesa’. Proceedings of the 25th <strong>IMP</strong><br />
Conference, Marceilles.<br />
12
Christopher, M., Payen, A., and Ballantyne, D. (1991). Relationship Marketing: Bringing<br />
Quality, Customer Service and Marketing Together. Oxford: Betterworth-Heineman.<br />
Cunningham, M.T. (1980) International marketing and purchasing of industrial goods – Features<br />
of a European research project. European Journal of Marketing, 14:5/6, pp. 322 – 338.<br />
Davis, J. H., Patterson, J. D. and Grazin, I. (1996) ‘The Collapse and Remergence of Networks<br />
within and between Republics of the Former Soviet Union’, International Business Review, Vol.5, No.<br />
1, pp. 1-2<strong>1.</strong><br />
Eisenhardt, K. M., and Graebner, M. E. (2007), "Theory Building from Cases: Opportunities and<br />
Challenges", Academy of Management Journal, Vol. 50, No.1, 25-32.<br />
Erdös, P. and Rényi, A. 1960. On the evolution of random graphs. Publication of the<br />
Mathematical Institute of the Hungarian Academy of Sciences 5, pp.17–6<strong>1.</strong><br />
Flyvbjerg, B. (2006), "Five Misunderstandings About Case-Study Research", Qualitative<br />
Inquiry, Vol. 12, No. 2, pp.219-245.<br />
Ford, D., Gadde, L.-E., Håkansson, H., and Snehota, I. (2006) The Business Marketing Course:<br />
Managing in Complex Networks, 2nd ed., John Wiley & Sons, Chichester.<br />
Ford, D.,Gadde, L-E.(2008). Distribution Reaserch and the Industrial Network Approach, <strong>IMP</strong><br />
Journal, 2 (3), pp.36 -52.<br />
Frank, O. and Strauss, D. 1986. Markov graphs. Journal of the American Statistical Association<br />
81, pp. 832–42.<br />
Frauendorf, J., Kaehm, E., and Kleinaltenkamp, M. (2007). ‘Business to business markets –<br />
status quo and future trends’. Journal of Business Market Management. Vol. 1, No.1, pp.7-39.<br />
Gadde L.E., & Snehota I (2001), ‘Rethinking the Role of Middlemen’, Paper for <strong>IMP</strong> BI, Oslo.<br />
Gadde, L.E. (2000), ‘From Marketing Channels to Differentiated Networks - distribution<br />
dynamics in a historical perspective’, in: Dahiya, S. (ed), The Current State of Business Disciplines,<br />
Vol. VI: 2641-2662, Rohtak: Spellbound Publications.<br />
Granovetter, M. (1983). The strength of weak ties: A network theory revisited. In R. Collins<br />
(Ed.),<br />
Håkansson H., and Snehota I. (1995), ‘Developing Relationships in Business Networks‘.<br />
London: Routledge.<br />
<strong>IMP</strong> <strong>Group</strong> (1982) ‘An Interaction Approach’, in: International Marketing and Purchasing of<br />
Industrial Goods, Wiley, Chichester, pp. 10-27.<br />
Jackson, M.O. (2008) "Network formation." The New Palgrave Dictionary of Economics.<br />
Second Edition. Eds. S. N. Durlauf and L. E. Blume. Palgrave Macmillan.<br />
Jagdev H. and Browne J. (1998). The extended enterprise – a context for manufacturing. Prod<br />
Plan Control 9, pp. 216 – 229.<br />
Johanson, M. (2007) ‘Networks in Transition’, Proceedings of the 23th <strong>IMP</strong> Conference,<br />
Manchester.<br />
Kamp, B. (2004). Formation and evolution of buyer-supplier relationships: conceiving<br />
dynamism in actor composition of international business networks, Proceedings of the 20th <strong>IMP</strong><br />
Conference, Copenhagen.<br />
Markov, A.A. (1971) ‘Extension of the limit theorems of probability theory to a sum of variables<br />
connected in a chain‘. reprinted in Appendix B of: R. Howard. Dynamic Probabilistic Systems, volume<br />
1: Markov Chains. John Wiley and Sons,.<br />
Markov, A.A. ‘Rasprostranenie zakona bol'shih chisel na velichiny, zavisyaschie drug ot druga‘.<br />
Izvestiya Fiziko-matematicheskogo obschestva pri Kazanskom universitete, 2 ser. t.15, 135–156, 1906.<br />
Mikhailov L. (2002). Fuzzy analytical approach to the partnership selection in formation of<br />
virtual enterprises. Omega – Int J Mndt Sci 30: 393 – 40<strong>1.</strong><br />
Narus, J., Anderson, J. (1996). Rethinking distribution – Adaptive Channels. Harvard Businrss<br />
Review, July – August, 112 – 120.<br />
Olsen N.V. (2004), ‘Development of Distributor Brands vs. Development Manufacturer Brands’,<br />
Proceedings of the 20th <strong>IMP</strong> Conference, Copenhagen.<br />
Rumyantseva, M., and Tretyak, O. (2003), "What is a Network: An Overview of Theoretical<br />
Explanations of Inter-Firm Cooperation", Proceedings of the 19 th <strong>IMP</strong> Conference, Lugano.<br />
13
Sheresheva, M. (2005) Informatsionnaya Infrastruktura Roznitchnykh s’etey v Rossii, Russian<br />
Journal of Management, Vol. 3, No. 1, pp. 53-74.<br />
Smirnova, M., and Kouchtch, S. (2007) ‘Relationship Value Creation in Key Supplier<br />
Relationships: Empirical Evidence from Russian Markets’, Proceedings Academy of Marketing<br />
Confrence, Kingston.<br />
Sokolov G., and Chistykova N. (2005) ‘Probability theory. Controlled Markov chains in<br />
economics’, FIZMATLIT, 121-178.<br />
Tallura S. and Backer R. (1996). Quantitative framework for designing efficient business<br />
process alliances. Proccedings of 1996 International Conference on Engineering and Technology<br />
Management Piscataway, pp 526 – 53<strong>1.</strong><br />
Tretyak, O., and Sheresheva, M. (2005) ‘Russian Retail Chains vs. Foreign Retailers: Changes<br />
within the Industry and Supplier-Retailer Relationships’, Proceedings of the 20th <strong>IMP</strong> Conference<br />
proceedings, Copenhagen.<br />
Vaskin, Y. (2008) ‘Distributor’s Transition to Marketing-Oriented Model’, in; Sovremienny<br />
Menedzment: Voprosy Teorii I Praktiki, pp.140-152.<br />
Watts, A. (2001) A dynamic model of network formation. Games and Economic Behavior 34,<br />
pp.331–4<strong>1.</strong><br />
Watts, D.J. (1999) Small Worlds: The Dynamics of Networks between Order and Randomness.<br />
Princeton: Princeton University Press.<br />
Weber J.A. (2001)"Partnering with Resellers in Business Markets," Journal of Business and<br />
Industrial Marketing, 30, No 2, pp. 87-99.<br />
Wilson H. and Daniel, E. (2007) The Multi Channel Challenge: A dynamics capability approach.<br />
Industrial Marketing Management, 36, No 1, pp.10-20.<br />
14