IFMR (ESI) Chapter Wrapper.indd - India Environment Portal
IFMR (ESI) Chapter Wrapper.indd - India Environment Portal
IFMR (ESI) Chapter Wrapper.indd - India Environment Portal

Create successful ePaper yourself
Turn your PDF publications into a flip-book with our unique Google optimized e-Paper software.
E<br />
S I<br />
I S<br />
Informing <strong>Environment</strong>al Action<br />
2<br />
0<br />
0<br />
8<br />
Jammu & Kashmir<br />
Punjab<br />
Himachal Pradesh<br />
Uttaranchal<br />
Haryana<br />
Arunachal Pradesh<br />
Rajasthan<br />
Uttar Pradesh<br />
Bihar<br />
Sikkim<br />
Meghalaya<br />
Assam<br />
Nagaland<br />
Manipur<br />
Gujarat<br />
Madhya Pradesh<br />
Jharkhand<br />
West<br />
Bengal<br />
Tripura<br />
Mizoram<br />
Maharashtra<br />
Chhattisgarh<br />
Orissa<br />
Goa<br />
Andhra Pradesh<br />
Karnataka<br />
Kerala<br />
Tamil Nadu<br />
CDF<br />
<br />
<br />
RUPANWITA DASH
E<br />
S I<br />
I S<br />
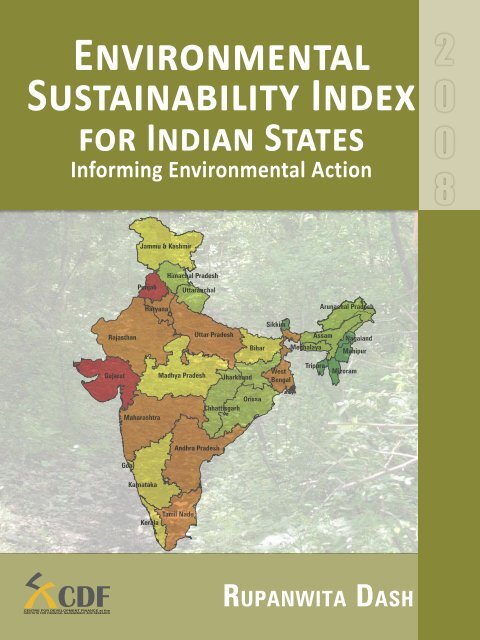
A policy Tool to Measure the environmental Sustainability<br />
of the 28 States of <strong>India</strong><br />
2<br />
0<br />
0<br />
8<br />
RUPANWITA DASH<br />
CDF
Table of Contents<br />
EXECUTIVE SUMMARY<br />
CHAPTER 1<br />
The Concept of <strong>Environment</strong>al Sustainability<br />
Index (<strong>ESI</strong>) for <strong>India</strong>n States ............................................1<br />
The <strong>ESI</strong> Framework ..............................................................3<br />
Interpretation of <strong>ESI</strong> ............................................................5<br />
CHAPTER 2<br />
Key Findings: Sustainability scenario in States .......7<br />
Beyond the Summary: State Profiles ..........................11<br />
Inter-State Comparisons: Across Indicators ............40<br />
CHAPTER 3<br />
Conclusions and Policy Recommendations ..............49<br />
CHAPTER 4<br />
Detailed Methodology .......................................................51<br />
REFERENCES
EXECUTIVE SUMMARY<br />
The <strong>Environment</strong>al sustainability index tracks the environment performance of 28 states of<br />
<strong>India</strong> and projects the ability of the states to protect their environment in the coming years.<br />
Collating secondary data from published and credible sources, <strong>ESI</strong> measures the state of<br />
environment along multiple dimensions, aggregates it into a single index that is interpretable<br />
and comparable across all the states. Sub-indices (Indicators and Policy Components) enable<br />
states to get a more nuanced picture of their performance. The rankings are relative and done<br />
on a scale of 0 to 100, allowing for states to see how well they are doing in comparison to<br />
other states.<br />
The best performing state in the 2008 ranking is Manipur, followed by Sikkim and Tripura.<br />
The lowest ranking states are Punjab, Gujarat and Haryana. A state with higher <strong>ESI</strong> ranking<br />
means it has managed its natural resource stock judiciously; face less stress on it environment<br />
systems and less impact on human health. On the contrary, a state with lower <strong>ESI</strong> indicates<br />
that it has depleted its stock of natural resources and has accumulated waste and pollution<br />
which has created stress on ecosystem and human health. The <strong>ESI</strong> scores and ranks of all the<br />
28 states are as follows:<br />
States <strong>ESI</strong> Scores <strong>ESI</strong> Rank States <strong>ESI</strong> Scores <strong>ESI</strong> Rank<br />
Manipur 100.00 1 Kerala 53.71 15<br />
Sikkim 90.99 2 Bihar 51.98 16<br />
Tripura 85.81 3 Jammu & Kashmir 48.73 17<br />
Nagaland 82.08 4 Goa 45.16 18<br />
Mizoram 81.58 5 Madhya Pradesh 43.01 19<br />
Arunachal Pradesh 75.45 6 Maharashtra 37.28 20<br />
Chhattisgarh 74.09 7 West Bengal 35.72 21<br />
Orissa 71.88 8 Tamil Nadu 33.75 22<br />
Uttaranchal 71.18 9 Andhra Pradesh 32.55 23<br />
Assam 70.15 10 Rajasthan 26.52 24<br />
Meghalaya 66.79 11 Haryana 25.59 25<br />
Jharkhand 64.33 12 Uttar Pradesh 21.40 26<br />
Himachal Pradesh 61.26 13 Gujarat 10.46 27<br />
Karnataka 55.79 14 Punjab 0.00 28<br />
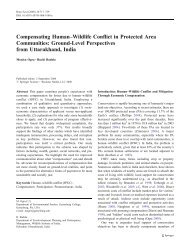
Most North-eastern states such as Manipur, Sikkim, Tripura, Nagaland and Mizoram are ranked<br />
higher and are on a sustainable trajectory than most other states. The next cluster is formed<br />
by Arunachal Pradesh, Chhattisgarh, Orissa, Uttaranchal, Assam, Meghalaya, Jharkhand and<br />
Himachal Pradesh; these states have <strong>ESI</strong> score in 60.01 to 80.00 range and show moderate<br />
sustainability. Six states (Karnataka, Kerala, Bihar, Jammu & Kashmir, Goa and Madhya<br />
Pradesh) are among the average performer with <strong>ESI</strong> scores between 40.01 -60.00; these states<br />
might face serious concerns in terms of sustainability. <strong>ESI</strong> Score below 40 projects alarming<br />
picture for majority of the states like Maharashtra, West Bengal, Tamil Nadu, Andhra Pradesh,<br />
Rajasthan, Haryana and Uttar Pradesh. Gujarat and Punjab (<strong>ESI</strong> scores of 10.46 and 0.00<br />
respectively) are in the extremely alarming range.
Jammu & Kashmir<br />
Punjab<br />
Himachal Pradesh<br />
Uttaranchal<br />
Haryana<br />
Arunachal Pradesh<br />
Rajasthan<br />
Gujarat<br />
Maharashtra<br />
Madhya Pradesh<br />
Uttar Pradesh<br />
Jharkhand<br />
Orissa<br />
Chhattisgarh<br />
Sikkim<br />
Assam<br />
Bihar Meghalaya<br />
West<br />
Bengal<br />
Tripura<br />
Nagaland<br />
Manipur<br />
Mizoram<br />
<strong>ESI</strong> Rating<br />
0 – 20<br />
21 – 40<br />
Goa<br />
Andhra Pradesh<br />
41 – 60<br />
Karnataka<br />
61 – 80<br />
Tamil Nadu<br />
Kerala<br />
81 – 100<br />
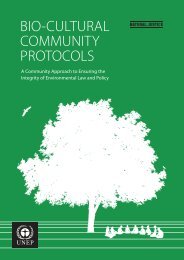
The <strong>ESI</strong> for <strong>India</strong>n States reveals that none of the state is on a sustainable trajectory; at the same time none of the<br />
states have performed very poor on all dimensions. Most states have done well in some areas and need to improve<br />
a lot in many other issues. Most of the larger states and high-growth states with concentration of industrial and<br />
agricultural activities are featured at the bottom of the ranking. The states which are relatively greener are going<br />
to face the challenge of integrating growth into sustainability; customized policies need to be drafted taking such<br />
concerns into account. <strong>ESI</strong> is designed to help the policymakers in:<br />
• Understand a state’s sustainability in terms of natural resource management, pollution load, vulnerability<br />
and institutional capacity<br />
• Identify priority environmental issues and areas of action<br />
• Create a baseline for cross-state and cross-sectoral performance comparisons and categorize states along<br />
multiple environmental indicators<br />
• Identify best practices and successful policy models; evaluate adequacy and sufficiency of current policies<br />
• Reinforce the economy-environment linkage and importance of integrated policy making<br />
<strong>ESI</strong> is policy tool; it also is informative. It is designed to inform environmental action by quantifying environmental<br />
sustainability into simple interpretable index and facilitating benchmarking for cross-state comparison. It should<br />
complement Human Development Index and Per-capita Income, as a tool to map sustainable development along<br />
social, economic and ecological well-being. The <strong>ESI</strong> is not designed to provide an exhaustive picture of a state’s<br />
environmental issues, but rather to help reveal trends and draw attention to phenomena that require further<br />
analysis and possible action.
CHAPTER 1<br />
THE CONCEPT OF<br />
ENVIRONMENTAL SUSTAINABILITY INDEX (<strong>ESI</strong>)<br />
FOR INDIAN STATES<br />
The <strong>Environment</strong>al Sustainability Index (<strong>ESI</strong>) is a ranking tool which maps the environment performance of 28 states<br />
of <strong>India</strong> and projects the ability of the states to protect their environment in the coming years. A state with higher<br />
<strong>ESI</strong> ranking means it has managed its natural resource stock judiciously; face less stress on it environment systems<br />
and less impact on human health. On the contrary, a state with lower <strong>ESI</strong> indicates that it has depleted its stock<br />
of natural resources and has accumulated waste and pollution which has created stress on ecosystem and human<br />
health. It is a relatively new concept and a pioneer effort with regard to <strong>India</strong>n states.<br />
Given the fact that most economic activities require extractive use of natural resources, rapid economic growth is<br />
often associated with unsustainable level of resource consumption and pollution leading to serious environmental<br />
challenges. Therefore <strong>ESI</strong> holds much more importance in the context of developing economies. Since economic<br />
growth gives an incomplete picture of a country or state’s development, as it does not reflect the impacts on<br />
ecological and natural systems. Incorporating such impacts requires a different kind of framework—one that<br />
gauges a state’s overall performance. From a sustainable development perspective it is essential to link ecological<br />
sustainability in relation to economic and social development. Hence the <strong>Environment</strong>al Sustainability Index (<strong>ESI</strong>)<br />
for <strong>India</strong>n states is an effort to link environmental sustainability and development activities by measuring a state’s<br />
performance over the years. Such exercises can serve as a background resource for policy planning and formulation<br />
and budgetary allocation and should be useful for decision-makers, especially at the state level.<br />
The level of environmental degradation of a state varies with its development activities and environmental policies<br />
implemented. As the <strong>ESI</strong> is constructed on the basis of multiple environmental parameters, it should help in<br />
identifying the issues that deserve more attention and thus prioritizing policy interventions and investment for a<br />
particular state. It should also help to identify best practices from the better performing states. Thus the index<br />
should contribute to better understanding of the most significant issues a state faces, examples from states that<br />
have successfully addressed such issues and the consequences that will result from suboptimal environmental<br />
choices. The comparative nature of analysis will help in deciding benchmarks and creating peer pressure.<br />
The index will give a comparative picture of the environmental conditions in each state in terms of water, air, soil,<br />
forest and other natural resources, thereby enabling governments to prioritize budgetary allocations in favour of<br />
areas where intervention is most urgently required. At the same time it will show the magnitude of pollution and<br />
depletion of resources, which should be a signal for <strong>India</strong>n industries to pay more attention to their environmental<br />
footprints and should create competitive pressure for improved performance.<br />
The <strong>ESI</strong> gives an indication of a state’s general environmental conditions, which has implications for future regulations<br />
as well as investment opportunities and risks. The report accumulates information from a wide range of sectors<br />
related to the environment and ecology, and compresses this information into a simple and actionable format. The<br />
<strong>ESI</strong> should be informative for all individuals and institutions working in environment-related sectors.<br />
… 1 …
HOW <strong>ESI</strong> IS CONSTRUCTED<br />
THE FRAMEWORK<br />
Developing <strong>ESI</strong> involves conceptual clarity at both<br />
the theoretical and empirical levels. <strong>ESI</strong> is based on<br />
a well established and simple theoretical framework,<br />
employing statistical procedures to calculate the <strong>ESI</strong><br />
scores. The following section elaborates on all the<br />
methods and procedures involved in developing the <strong>ESI</strong><br />
for <strong>India</strong>n States.<br />
<strong>ESI</strong> is a composite index assembled from 15 indicators<br />
that are derived from 44 variables or datasets, which<br />
cover a wide range of issues such as population, air and<br />
water pollution, waste management, land use pattern,<br />
forest and other natural resources, air and water<br />
quality, environment degradation, impacts on health,<br />
energy management, GHG emission, and governance.<br />
The selection of these variables was based on its<br />
relevance, extensive literature review, the availability<br />
and reliability of data.<br />
The <strong>ESI</strong> score is the equally weighted average of these<br />
15 indicators. Each of the indicators is in turn an<br />
aggregate of 2 to 4 underlying variables. For example,<br />
to measure the indicator ‘air quality’ the underlying<br />
variables chosen are annual concentration levels of<br />
SO2, NO2, suspended particulate matter (SPM) and<br />
repairable suspended particulate matter (RSPM). Data<br />
are collected for each of these 4 variables across 28<br />
states. The average of the underlying variables is taken<br />
as the indicator ‘air quality’ for a state. In this manner<br />
15 such indicators are calculated, equally weighted<br />
and the average is taken as the <strong>ESI</strong> score of that<br />
particular state. Likewise the <strong>ESI</strong> scores for 28 states<br />
are calculated and the highest and lowest scores are<br />
calibrated to 100 and 0 respectively. The states are<br />
then ranked accordingly.<br />
44 Variables 15 Indicators<br />
5 Policy<br />
Components<br />
<strong>ESI</strong><br />
Variables are the basic unit that<br />
Each Indicator is constructed<br />
Policy Components are thematic<br />
<strong>ESI</strong> is equally weighted average of<br />
measure the state of environment<br />
by aggregating 2-4 underlying<br />
categories composed of few<br />
15 underlying Indicators<br />
variables<br />
indicators<br />
… 2 …
<strong>ESI</strong> FRAMEWORK<br />
Sl No. 44 Variables Sl No. 15 Indicators Sl No. 5 Policy Components<br />
1 Population density<br />
2 Population growth<br />
1 Population Pressure 1 Population Pressure<br />
3 Total fertility rate<br />
4 % Change in forest area<br />
5 % of Forest land encroached<br />
6 Annual ground water draft<br />
7 NOx emission per capita<br />
8 SO2 emission per capita<br />
9 CO2 emission per capita<br />
10 Number of motorized vehicles<br />
11 Untreated waste water discharged<br />
12 Fertilizer consumption<br />
13 Pesticide consumption<br />
14 Per capita municipal solid waste<br />
15 Per capita hazardous waste<br />
16 % of protected area to forest<br />
17 % of land under grazing to total land<br />
18 % of land under agriculture to total land<br />
19 Total replenishable ground water<br />
2 Natural Resource Endowment<br />
3 Air Pollution<br />
4 Water Pollution<br />
5 Waste Generation<br />
6 Land Use<br />
2 <strong>Environment</strong>al Stress<br />
20 Average annual rainfall<br />
21 % of Wetland area to total land<br />
22 % of state under forest cover<br />
23 Annual concentration of SO2 levels<br />
24 Annual concentration of NO2 levels<br />
25 Annual concentration of SPM levels<br />
26 Annual concentration of RSPM levels<br />
7 Natural Resource Endowment<br />
8 Air Quality<br />
3<br />
<strong>Environment</strong>al<br />
Systems<br />
27 Biological Oxygen Demand<br />
28 Electrical Conductivity<br />
29 Total Suspended Solids<br />
9 Water Quality<br />
30 % of degraded area<br />
31 Area affected by flood and heavy rains<br />
32 % of total districts affected by drought<br />
33 Hazard prone area<br />
34 Incidence of acute respiratory diseases<br />
35 Incidence of acute water diseases<br />
36 Per capita energy consumed<br />
37 % of renewable energy in total energy<br />
38 Energy-GDP ratio<br />
10 Disaster Management<br />
11 Health Vulnerability<br />
12 Energy Management<br />
4 Health Vulnerability<br />
39 Area under joint forest management<br />
40 Presence of environmental NGOs<br />
13 People’s Initiative<br />
41 % of defaulting industries<br />
42 Fund allocation by Union government<br />
14 Government’s Initiative<br />
43 Fund allocation by state government<br />
44 % Change in total GHG emissions 15 GHG emissions<br />
5<br />
<strong>Environment</strong>al<br />
Governance<br />
… 3 …
44 VARIABLES<br />
1. Population density<br />
2. Population growth<br />
3. Total fertility rate<br />
4. % Change in forest area<br />
5. % of Forest land encroached<br />
6. Change In ground water<br />
7. NOx emission per capita<br />
8. SO2 emission per capita<br />
9. CO2 emission per capita<br />
10. Number of motorized vehicles<br />
11. untreated waste water discharge<br />
12. Fertilizer consumption<br />
13. Pesticide consumption<br />
14. Municipal solid waste<br />
15. Hazardous waste<br />
16. Protected area<br />
17. Wetland area<br />
18. Grazing Land<br />
19. Agricultural land<br />
20. Replenishable ground water<br />
21. Average annual rainfall<br />
22. Forest cover<br />
23. Annual concentration of SO2 levels<br />
24. Annual concentration of NO2 levels<br />
25. Annual concentration of SPM levels<br />
26. Annual concentration of RSPM levels<br />
27. Biological Oxygen Demand<br />
28. Electrical Conductivity<br />
29. Total Suspended Solids<br />
30. Degraded & wastelands<br />
31. Flood affected area<br />
32. Arid/drought prone area<br />
33. Hazard-prone districts<br />
34. Incidence of acute respiratory<br />
diseases<br />
35. Incidence of water borne diseases<br />
36. Annual per capita power consumed<br />
37. Renewable Energy as % of total<br />
Energy<br />
38. Energy/GSDP ratio<br />
39. Area under Joint Forest Management<br />
40. Presence of <strong>Environment</strong>al NGOs<br />
41. Defaulting and closed industries<br />
42. State government’s revenue<br />
expenditure on environment<br />
43. Centre government’s outlayexpenditure<br />
ratio on environment<br />
15 INDICATORS<br />
1. Population pressure<br />
2. Natural resource depletion<br />
3. Air pollution<br />
4. Water pollution<br />
5. Waste generation<br />
6. Land use<br />
7. Natural resources<br />
8. Air quality<br />
9. Water quality<br />
10. Natural disaster<br />
11. Health<br />
12. Energy<br />
13. People’s initiatives<br />
14. Government’s initiatives<br />
15. GHG Emission<br />
5 POLICY COMPONENTS<br />
1. Population Pressure<br />
2. <strong>Environment</strong>al Stress<br />
3. <strong>Environment</strong>al Systems<br />
4. Impact on Human Health<br />
5. <strong>Environment</strong>al Governance<br />
… 4 …
INTERPRETATION OF<br />
<strong>ESI</strong> FOR INDIAN STATES<br />
The <strong>ESI</strong> is an aggregate index of 15 underlying indicators,<br />
adjusted from 0 to 100. It is to be noted that higher the<br />
score, better is the state’s performance on environmental<br />
dimensions. All the 28 states are ranked (from 1 to 28)<br />
based on this <strong>ESI</strong> scores; Rank 1 depicting the ‘relatively<br />
most sustainable’ and Rank 28 is the ‘relatively least<br />
sustainable’ state. Thus the state with rank 1 has score<br />
of 100 whereas the state which ranks 28 has a score of<br />
0.<br />
It is essential to note that <strong>ESI</strong> is a relative measurement<br />
among the 28 states across select environmental<br />
indicators aimed at facilitating inter-state and acrossindicator<br />
comparisons. Thus a score of 100 does not<br />
necessarily mean that the state has achieved highest<br />
level sustainability, it rather indicates that among the 28<br />
states this particular state has performed the best.<br />
<strong>ESI</strong> is also a multidimensional index, composed of 15<br />
indicators and 5 important policy categories. There are<br />
states doing well in some aspects in spite of low overall<br />
score, states with high overall score yet below-average<br />
sub-scores.<br />
This multidimensional approach to calculating the <strong>ESI</strong><br />
helps in capturing various aspects of environmental<br />
sustainability in a single index and presents a quantifiable<br />
and quick overview of a qualitative and complex issue.<br />
… 5 …
The 5 Policy Component Scores<br />
Each states relative performance in 5 main policy components (such as pressure on the ecosystem, <strong>Environment</strong>al<br />
stress, <strong>Environment</strong>al system, Human vulnerability and <strong>Environment</strong>al governance) are measured. The 5 Policy<br />
scores are equally weighted in scale of 0 (worst) to 100 (best), on<br />
a comparative scale for 28 states. Thus if a state scores 0 in policy<br />
component “population pressure’ it means it has the lowest score for<br />
population pressure which means maximum pressure on the ecosystem.<br />
A State’s score of 100 in ‘environment system’ means it has the best<br />
air and water quality, most favourable land use and favourable natural<br />
resource endowment. The ideal state will have 100 scores in all the 5<br />
components and the least desirable is to have scores close to 0 in all the<br />
5 components.<br />
When all the 5 components are shown a spider graph, values farther<br />
from the centre indicate better performance and more shadow area covered means good performance by the state<br />
in all 5 dimensions. Thus this 5 scores show the relative break-up of good and bad performance for each state.<br />
The 15 Indicator Scores<br />
The 15 indicators are the main building blocks of the <strong>ESI</strong> which shows relative performance of a state in each of<br />
these 15 areas of equal weight. Plotted in a scale of -3 (worst) to +3 (best) and 0 means average. The bars going<br />
upwards shows better than average (of all 28 states) performance and the bars going downwards shows less than<br />
the average (of all 28 states). More number of longer bars going in upward direction is desirable and indicates good<br />
performances.<br />
The indicator profile identifies the areas of strength and weakness for a state. A state might have high overall<br />
scores yet very low scores for some indicators and vice-versa. Also for some states the bars are close to 0 indicating<br />
balanced performance across indicators and for some states the values vary greatly which means the good or poor<br />
<strong>ESI</strong> score is driven by few indicators.<br />
… 6 …
CHAPTER 2<br />
KEY FINDINGS:<br />
MAPPING SUSTAINABILITY IN<br />
STATES<br />
The <strong>ESI</strong> score for all the states when compared shows that most<br />
states have moderate scores. Manipur tops the list followed<br />
by Sikkim and Tripura. Uttar Pradesh, Gujarat and Haryana<br />
features at the bottom of the ranking. The ranks are scores of<br />
all the states are shown in the following table.<br />
States <strong>ESI</strong> Scores <strong>ESI</strong> Rank<br />
Manipur 100.00 1<br />
Sikkim 90.99 2<br />
Tripura 85.81 3<br />
Nagaland 82.08 4<br />
Mizoram 81.58 5<br />
Arunachal Pradesh 75.45 6<br />
Chhattisgarh 74.09 7<br />
Orissa 71.88 8<br />
Uttaranchal 71.18 9<br />
Assam 70.15 10<br />
Meghalaya 66.79 11<br />
Jharkhand 64.33 12<br />
Himachal Pradesh 61.26 13<br />
Karnataka 55.79 14<br />
Kerala 53.71 15<br />
Bihar 51.98 16<br />
Jammu & Kashmir 48.73 17<br />
Goa 45.16 18<br />
Madhya Pradesh 43.01 19<br />
Maharashtra 37.28 20<br />
West Bengal 35.72 21<br />
Tamil Nadu 33.75 22<br />
Andhra Pradesh 32.55 23<br />
Rajasthan 26.52 24<br />
Haryana 25.59 25<br />
Uttar Pradesh 21.40 26<br />
Gujarat 10.46 27<br />
Punjab 0.00 28<br />
Most North-eastern states such as Manipur,<br />
Sikkim, Tripura, Nagaland and Mizoram are<br />
ranked higher and are on a sustainable<br />
trajectory than most other states.<br />
The next cluster is formed by Arunachal<br />
Pradesh, Chhattisgarh, Orissa, Uttaranchal,<br />
Assam, Meghalaya, Jharkhand and Himachal<br />
Pradesh; these states have <strong>ESI</strong> score in<br />
60.01 to 80.00 range and show moderate<br />
sustainability.<br />
6 states (Karnataka, Kerala, Bihar, Jammu<br />
& Kashmir, Goa and Madhya Pradesh) are<br />
among the average performer with <strong>ESI</strong><br />
scores between 40.01 – 60.00; these states<br />
might face serious concerns in terms of<br />
sustainability.<br />
<strong>ESI</strong> Score below 40 projects alarming picture<br />
for majority of the states like Maharashtra,<br />
West Bengal, Tamil Nadu, Andhra Pradesh,<br />
Rajasthan, Haryana and Uttar Pradesh.<br />
Gujarat and Punjab (<strong>ESI</strong> scores of 10.46<br />
and 0.00 respectively) are in the extremely<br />
alarming range.<br />
… 7 …
Though the <strong>ESI</strong> scores and ranks compare all the states, the heterogeneity and variations among states should be<br />
considered. For example, comparing Manipur and Gujarat is difficult, since there is a huge difference between them<br />
in terms of industrial activities, population and geography. Taking this into account, the 14 most important states,<br />
which together account for 90 % of <strong>India</strong>’s GDP and 88 % of its total population, have been chosen for more specific<br />
comparisons. The 14 states are again grouped into 3 categories: low income states, middle income states and high<br />
income states. Though the categorization has been done based on income, the states in each sub-group are more or<br />
less similar in terms of socio-economic development, thus making comparison easier and more meaningful. Table 6<br />
presents the three sub-groups, each state’s contribution to <strong>India</strong>’s overall GDP and population, per capita SGDP, <strong>ESI</strong><br />
ranks and respective <strong>ESI</strong> peer ranks.<br />
In the ranking table, each state is treated as one entity hence assumes equal importance. However in reality, the<br />
states vary in geographical areas and therefore the performance of larger states has relatively more significance<br />
while interpreting the sustainability picture of <strong>India</strong> as a whole. For example: 7 states in the alarming category (<strong>ESI</strong><br />
score 20-40) capture almost half of the country’s geographical area. Whereas 5 states in the sustainable category<br />
occupy only 2% of <strong>India</strong>’s geographical area.<br />
… 8 …
Jammu & Kashmir<br />
Punjab<br />
Himachal Pradesh<br />
Uttaranchal<br />
Rajasthan<br />
Gujarat<br />
Goa<br />
Haryana<br />
Maharashtra<br />
Karnataka<br />
Madhya Pradesh<br />
Uttar Pradesh<br />
Andhra Pradesh<br />
Jharkhand<br />
Orissa<br />
Chhattisgarh<br />
Sikkim<br />
Assam<br />
Bihar Meghalaya<br />
West<br />
Bengal<br />
Tripura<br />
Arunachal Pradesh<br />
Nagaland<br />
Manipur<br />
Mizoram<br />
<strong>ESI</strong> Rating<br />
0 – 20<br />
21 – 40<br />
41 – 60<br />
61 – 80<br />
Tamil Nadu<br />
Kerala<br />
81 – 100<br />
It can be seen that large part of the country is either on an unsustainable path or is already facing alarming<br />
level of environmental stress. The relatively sustainable parts are clustered around the north-eastern, eastern and<br />
Himalayan region; which are also the states in fragile ecosystem and less developed. This poses serious questions<br />
on long term sustainability since the environment in these states is likely to degrade with increasing economic<br />
activity.<br />
Interestingly the <strong>ESI</strong> 2008 revealed that most states with high per capita SGDP have not performed well on the<br />
environmental front. It was observed that the high per capita SGDP rankings states like Haryana, Maharashtra,<br />
Punjab and Gujarat all perform poorly in the<br />
<strong>ESI</strong> ranking.<br />
Taking the median per capita GSDP along<br />
horizontal axis and <strong>ESI</strong> performance along<br />
vertical axis all the states 1 are placed in 4<br />
quadrants such as: Higher <strong>ESI</strong> - Lower GDP,<br />
Higher <strong>ESI</strong> - Higher GDP, Lower <strong>ESI</strong> - Higher<br />
GDP, Lower <strong>ESI</strong> - Lower GDP.<br />
States like Punjab, Gujarat, and Haryana<br />
which have higher than median per capita<br />
income have fared low in <strong>ESI</strong>. These states<br />
have exhausted much of its resources and the<br />
pollution load on ecosystem is also high. On<br />
the hand, states like Orissa, Bihar, Assam and<br />
1 Except Jammu & Kashmir and Nagaland, since the GSDP/capita (2006) is not available for these two states<br />
… 9 …
Karnataka have demonstrated better environmental performance despite the lower per-capita GDP. As these state’s<br />
economies grow, controlling pollution and conserving resources is going to be an important challenge. The greatest<br />
challenge is for the Low <strong>ESI</strong> - Low GDP states such as Uttar Pradesh, Madhya Pradesh and Rajasthan. It is desirable<br />
to have more states in Higher <strong>ESI</strong> - Higher GDP, at present only 2 states (Kerala and Himachal) are in this segment.<br />
A deeper and better understanding of the past and current actions and policies in these two states may provide<br />
useful insights. It is noteworthy that all the high income states have low <strong>ESI</strong> scores. This raises a number of critical<br />
questions regarding the linkages between the environment, economy and poverty and points to the challenges for<br />
maintaining growth vis-à-vis sustainability.<br />
Sustainable development takes into account the economic, social and environmental aspects of development. GDP<br />
(Gross Domestic Product) and HDI (Human Development Index) are the commonly accepted measure of economic<br />
growth and social wellbeing respectively. The <strong>ESI</strong> will serve as a measure of the environmental aspects which is<br />
missing at present. Combining these 3 indicators such as the per capita SGDP, the HDI and the <strong>ESI</strong> can throw light<br />
on how sustainable a state is growing or is likely to grow.<br />
The performance of the 14 major states along per capita SGDP, the HDI and the <strong>ESI</strong> is mapped in the following graph. The<br />
sizes of the bubbles represent the amount of per-capita income in respective states; thus bigger bubbles mean richer<br />
states. The Vertical axis shows the <strong>ESI</strong>, higher the state is located more sustainable it is. The horizontal axis is for the HDI,<br />
thus a state which is located towards right has better human development than the states located close to centre of origin.<br />
States which scores well on all the 3 parameters such as GDP, HDI and <strong>ESI</strong> will have higher per capita GDP (bigger<br />
bubble sizes) are greener (located higher) with more human development (located towards right), are the most<br />
sustainably growing states.<br />
… 10 …
CHAPTER 2<br />
BEYOND THE SUMMARY<br />
STATE PROFILES<br />
The <strong>ESI</strong> scores and ranks of each state is only a summary picture of<br />
environmental sustainability of the state. While a single score or rank<br />
is useful as a summary; the real policy and action value is driven by<br />
the underlying policy categories and indicators used to construct the<br />
<strong>ESI</strong> for <strong>India</strong>n states. Hence each state’s performance was studied<br />
in detail along these building blocks of <strong>ESI</strong> and the environmental<br />
profiles were prepared.<br />
When each state profile is analyzed, the identification of factors which<br />
contribute to good/poor environmental performance becomes easier.<br />
For example in case of Tamil Nadu the low scores in GHG emission, air<br />
pollution and waste generation has lowered its overall score despite<br />
few positive indicators; which elucidates the priority areas of action<br />
and policy focus. Population pressure in Bihar and Uttar Pradesh is<br />
so high that the negative scores in this indicator have pulled down its<br />
overall scores. Bihar’s good scores on energy management, health,<br />
water quality and GHG emission helps in neutralizing the low scores in<br />
population pressure, land use, air quality and people’s initiative and<br />
places it around the middle of the ranking.<br />
It is to be noted that none of the states have scored positive and high<br />
on all indicators. The highest ranked state Manipur has comfortable<br />
scores in most of the sub-indices, but it is not without problems. It<br />
scores much below the average in disaster management and population<br />
pressure indicating there are areas where it needs improvement.<br />
Punjab ranks lowest when overall score is compared, but not in all the<br />
indicators. In fact it ranks highest in disaster management, and has<br />
better than average scores in 5 indicators out of 15; which indicates<br />
every state has unique environmental dynamics.<br />
In-depth analysis of the<br />
individual policy categories<br />
and the indicators yields<br />
interesting insights on<br />
each state’s performance<br />
in much more detail.<br />
The sub-scores and<br />
indicators measure the<br />
magnitude of pollution and<br />
depletion of resources and<br />
give a comparative picture<br />
of the environmental<br />
conditions in each state<br />
in terms of water, air, soil,<br />
forest and other natural<br />
resources.<br />
Consequently, it can help<br />
in hereby identifying the<br />
most significant issues<br />
faced by the states and<br />
enabling governments<br />
to prioritize policy and<br />
budgetary allocations in<br />
favour of areas where<br />
intervention is most<br />
urgently required.<br />
… 11 …
<strong>ESI</strong> Score: 32.55<br />
<strong>ESI</strong> Rank: 23<br />
GSDP/capita: Rs. 28722 per year<br />
ANDHRA PRADESH<br />
State Profiles<br />
How to Interpret:<br />
Values farther from the<br />
centre indicates better<br />
performance; Values are<br />
calibrated in a scale of 0<br />
(worst) to 100 (best). More<br />
the area occupied by the<br />
chart in the spider indicates<br />
better performance by the<br />
state in all components.<br />
Performance across 15 indicators<br />
How to Interpret: Values are<br />
in a scale of -3 (worst) to +3<br />
(best) and 0 means average.<br />
The bars going upwards shows<br />
better than average (of all 28<br />
states) performance and the<br />
bars going downwards shows<br />
less than the average (of<br />
all 28 states).More number<br />
of longer upward bars is<br />
desirable and indicates good<br />
performances.<br />
Indicator Value Indicator Value Indicator Value<br />
Population Pressure 0.70 Land Use -0.13<br />
Natural Resource<br />
Depletion<br />
-0.58<br />
Natural Resource<br />
Endowment<br />
-0.29<br />
Health<br />
Vulnerability<br />
Energy<br />
Management<br />
0.16<br />
-0.23<br />
Air Pollution -0.59 Air Quality 0.23 People Initiative 0.15<br />
Water Pollution -0.46 Water Quality -0.32<br />
Government<br />
Initiative<br />
0.23<br />
Waste Generation -0.68 Disaster Management -0.06 GHG Emission -1.08<br />
… 12 …
<strong>ESI</strong> Score: 75.45<br />
<strong>ESI</strong> Rank: 6<br />
GSDP/capita: Rs. 24892 per year<br />
ARUNACHAL PRADESH<br />
State Profiles<br />
How to Interpret:<br />
Values farther from the<br />
centre indicates better<br />
performance; Values are<br />
calibrated in a scale of 0<br />
(worst) to 100 (best). More<br />
the area occupied by the<br />
chart in the spider indicates<br />
better performance by the<br />
state in all components.<br />
Performance across 15 indicators<br />
How to Interpret: Values are<br />
in a scale of -3 (worst) to +3<br />
(best) and 0 means average.<br />
The bars going upwards shows<br />
better than average (of all 28<br />
states) performance and the<br />
bars going downwards shows<br />
less than the average (of<br />
all 28 states).More number<br />
of longer upward bars is<br />
desirable and indicates good<br />
performances.<br />
Indicator Value Indicator Value Indicator Value<br />
Population Pressure 0.37 Land Use 1.07<br />
Natural Resource<br />
Depletion<br />
0.54<br />
Natural Resource<br />
Endowment<br />
0.28<br />
Health<br />
Vulnerability<br />
Energy<br />
Management<br />
-0.18<br />
1.32<br />
Air Pollution 0.58 Air Quality 0.83 People Initiative -0.43<br />
Water Pollution -0.26 Water Quality 0.29<br />
Government<br />
Initiative<br />
-0.41<br />
Waste Generation 0.15 Disaster Management -0.02 GHG Emission -0.68<br />
… 13 …
<strong>ESI</strong> Score: 70.15<br />
<strong>ESI</strong> Rank: 10<br />
GSDP/capita: Rs. 19227 per year<br />
ASSAM<br />
State Profiles<br />
How to Interpret:<br />
Values farther from the<br />
centre indicates better<br />
performance; Values are<br />
calibrated in a scale of 0<br />
(worst) to 100 (best). More<br />
the area occupied by the<br />
chart in the spider indicates<br />
better performance by the<br />
state in all components.<br />
Performance across 15 indicators<br />
How to Interpret: Values are<br />
in a scale of -3 (worst) to +3<br />
(best) and 0 means average.<br />
The bars going upwards shows<br />
better than average (of all 28<br />
states) performance and the<br />
bars going downwards shows<br />
less than the average (of<br />
all 28 states).More number<br />
of longer upward bars is<br />
desirable and indicates good<br />
performances.<br />
Indicator Value Indicator Value Indicator Value<br />
Population Pressure -0.02 Land Use 0.08<br />
Natural Resource<br />
Depletion<br />
-0.98<br />
Natural Resource<br />
Endowment<br />
0.19<br />
Health<br />
Vulnerability<br />
Energy<br />
Management<br />
-0.10<br />
0.47<br />
Air Pollution 0.95 Air Quality 0.82 People Initiative -0.53<br />
Water Pollution 0.31 Water Quality 0.44<br />
Government<br />
Initiative<br />
-0.73<br />
Waste Generation 1.04 Disaster Management -0.06 GHG Emission 0.79<br />
… 14 …
<strong>ESI</strong> Score: 51.98<br />
<strong>ESI</strong> Rank: 16<br />
GSDP/capita: Rs. 8493 per year<br />
BIHAR<br />
State Profiles<br />
How to Interpret:<br />
Values farther from the<br />
centre indicates better<br />
performance; Values are<br />
calibrated in a scale of 0<br />
(worst) to 100 (best). More<br />
the area occupied by the<br />
chart in the spider indicates<br />
better performance by the<br />
state in all components.<br />
Performance across 15 indicators<br />
How to Interpret: Values are<br />
in a scale of -3 (worst) to +3<br />
(best) and 0 means average.<br />
The bars going upwards shows<br />
better than average (of all 28<br />
states) performance and the<br />
bars going downwards shows<br />
less than the average (of<br />
all 28 states).More number<br />
of longer upward bars is<br />
desirable and indicates good<br />
performances.<br />
Indicator Value Indicator Value Indicator Value<br />
Population Pressure -1.58 Land Use -0.33<br />
Natural Resource<br />
Depletion<br />
0.27<br />
Natural Resource<br />
Endowment<br />
0.02<br />
Health<br />
Vulnerability<br />
Energy<br />
Management<br />
0.69<br />
0.66<br />
Air Pollution 0.20 Air Quality -0.58 People Initiative -0.55<br />
Water Pollution -0.19 Water Quality 0.49<br />
Government<br />
Initiative<br />
0.21<br />
Waste Generation 0.30 Disaster Management -0.33 GHG Emission 0.66<br />
… 15 …
<strong>ESI</strong> Score: 74.09<br />
<strong>ESI</strong> Rank: 7<br />
GSDP/capita: Rs. 21958 per year<br />
CHATTISGARH<br />
State Profiles<br />
How to Interpret:<br />
Values farther from the<br />
centre indicates better<br />
performance; Values are<br />
calibrated in a scale of 0<br />
(worst) to 100 (best). More<br />
the area occupied by the<br />
chart in the spider indicates<br />
better performance by the<br />
state in all components.<br />
Performance across 15 indicators<br />
How to Interpret: Values are<br />
in a scale of -3 (worst) to +3<br />
(best) and 0 means average.<br />
The bars going upwards shows<br />
better than average (of all 28<br />
states) performance and the<br />
bars going downwards shows<br />
less than the average (of<br />
all 28 states).More number<br />
of longer upward bars is<br />
desirable and indicates good<br />
performances.<br />
Indicator Value Indicator Value Indicator Value<br />
Population Pressure 0.03 Land Use -0.21<br />
Natural Resource<br />
Depletion<br />
0.08<br />
Natural Resource<br />
Endowment<br />
0.09<br />
Health<br />
Vulnerability<br />
Energy<br />
Management<br />
0.57<br />
-0.20<br />
Air Pollution -0.31 Air Quality -0.53 People Initiative 0.87<br />
Water Pollution 0.76 Water Quality 0.29<br />
Government<br />
Initiative<br />
1.15<br />
Waste Generation 0.52 Disaster Management 0.21 GHG Emission -0.09<br />
… 16 …
<strong>ESI</strong> Score: 45.16<br />
<strong>ESI</strong> Rank: 18<br />
GSDP/capita: Rs. 76167 per year<br />
GOA<br />
State Profiles<br />
How to Interpret:<br />
Values farther from the<br />
centre indicates better<br />
performance; Values are<br />
calibrated in a scale of 0<br />
(worst) to 100 (best). More<br />
the area occupied by the<br />
chart in the spider indicates<br />
better performance by the<br />
state in all components.<br />
Performance across 15 indicators<br />
How to Interpret: Values are<br />
in a scale of -3 (worst) to +3<br />
(best) and 0 means average.<br />
The bars going upwards shows<br />
better than average (of all 28<br />
states) performance and the<br />
bars going downwards shows<br />
less than the average (of<br />
all 28 states).More number<br />
of longer upward bars is<br />
desirable and indicates good<br />
performances.<br />
Indicator Value Indicator Value Indicator Value<br />
Population Pressure -0.42 Land Use 0.81<br />
Natural Resource<br />
Depletion<br />
0.17<br />
Natural Resource<br />
Endowment<br />
0.69<br />
Health<br />
Vulnerability<br />
Energy<br />
Management<br />
0.41<br />
-1.28<br />
Air Pollution -2.60 Air Quality 0.69 People Initiative -0.05<br />
Water Pollution 0.44 Water Quality 0.67<br />
Government<br />
Initiative<br />
0.68<br />
Waste Generation -0.63 Disaster Management 0.15 GHG Emission -0.82<br />
… 17 …
<strong>ESI</strong> Score: 10.46<br />
<strong>ESI</strong> Rank: 27<br />
GSDP/capita: Rs. 38408<br />
GUJARAT<br />
State Profiles<br />
How to Interpret:<br />
Values farther from the<br />
centre indicates better<br />
performance; Values are<br />
calibrated in a scale of 0<br />
(worst) to 100 (best). More<br />
the area occupied by the<br />
chart in the spider indicates<br />
better performance by the<br />
state in all components.<br />
Performance across 15 indicators<br />
How to Interpret: Values are<br />
in a scale of -3 (worst) to +3<br />
(best) and 0 means average.<br />
The bars going upwards shows<br />
better than average (of all 28<br />
states) performance and the<br />
bars going downwards shows<br />
less than the average (of<br />
all 28 states).More number<br />
of longer upward bars is<br />
desirable and indicates good<br />
performances.<br />
Indicator Value Indicator Value Indicator Value<br />
Population Pressure 0.20 Land Use -0.19<br />
Natural Resource<br />
Depletion<br />
-1.27<br />
Natural Resource<br />
Endowment<br />
-0.31<br />
Health<br />
Vulnerability<br />
Energy<br />
Management<br />
0.52<br />
-0.74<br />
Air Pollution -1.10 Air Quality -0.37 People Initiative -0.48<br />
Water Pollution 0.26 Water Quality -1.92<br />
Government<br />
Initiative<br />
0.35<br />
Waste Generation -0.27 Disaster Management 0.18 GHG Emission -1.12<br />
… 18 …
<strong>ESI</strong> Score: 25.59<br />
<strong>ESI</strong> Rank: 25<br />
GSDP/capita: Rs. 44752 per year<br />
HARYANA<br />
State Profiles<br />
How to Interpret:<br />
Values farther from the<br />
centre indicates better<br />
performance; Values are<br />
calibrated in a scale of 0<br />
(worst) to 100 (best). More<br />
the area occupied by the<br />
chart in the spider indicates<br />
better performance by the<br />
state in all components.<br />
Performance across 15 indicators<br />
How to Interpret: Values are<br />
in a scale of -3 (worst) to +3<br />
(best) and 0 means average.<br />
The bars going upwards shows<br />
better than average (of all 28<br />
states) performance and the<br />
bars going downwards shows<br />
less than the average (of<br />
all 28 states).More number<br />
of longer upward bars is<br />
desirable and indicates good<br />
performances.<br />
Indicator Value Indicator Value Indicator Value<br />
Population Pressure -0.33 Land Use -0.66<br />
Natural Resource<br />
Depletion<br />
-0.56<br />
Natural Resource<br />
Endowment<br />
-0.71<br />
Health<br />
Vulnerability<br />
Energy<br />
Management<br />
0.25<br />
-0.69<br />
Air Pollution -0.61 Air Quality -0.53 People Initiative -0.64<br />
Water Pollution -0.17 Water Quality -1.32<br />
Government<br />
Initiative<br />
-0.28<br />
Waste Generation 0.10 Disaster Management 0.62 GHG Emission 1.54<br />
… 19 …
<strong>ESI</strong> Score: 61.26<br />
<strong>ESI</strong> Rank: 13<br />
GSDP/capita: Rs. 38832 per year<br />
HIMACHAL PRADESH<br />
State Profiles<br />
How to Interpret:<br />
Values farther from the<br />
centre indicates better<br />
performance; Values are<br />
calibrated in a scale of 0<br />
(worst) to 100 (best). More<br />
the area occupied by the<br />
chart in the spider indicates<br />
better performance by the<br />
state in all components.<br />
Performance across 15 indicators<br />
How to Interpret: Values are<br />
in a scale of -3 (worst) to +3<br />
(best) and 0 means average.<br />
The bars going upwards shows<br />
better than average (of all 28<br />
states) performance and the<br />
bars going downwards shows<br />
less than the average (of<br />
all 28 states).More number<br />
of longer upward bars is<br />
desirable and indicates good<br />
performances.<br />
Indicator Value Indicator Value Indicator Value<br />
Population Pressure 0.90 Land Use -0.78<br />
Natural Resource<br />
Depletion<br />
0.06<br />
Natural Resource<br />
Endowment<br />
-0.51<br />
Health<br />
Vulnerability<br />
Energy<br />
Management<br />
-2.35<br />
-0.31<br />
Air Pollution 0.45 Air Quality 0.27 People Initiative 0.83<br />
Water Pollution 0.28 Water Quality -0.28<br />
Government<br />
Initiative<br />
2.37<br />
Waste Generation 0.59 Disaster Management -0.37 GHG Emission 0.17<br />
… 20 …
<strong>ESI</strong> Score: 48.73<br />
<strong>ESI</strong> Rank: 17<br />
GSDP/capita: Not Available<br />
JAMMU AND KASHMIR<br />
State Profiles<br />
How to Interpret:<br />
Values farther from the<br />
centre indicates better<br />
performance; Values are<br />
calibrated in a scale of 0<br />
(worst) to 100 (best). More<br />
the area occupied by the<br />
chart in the spider indicates<br />
better performance by the<br />
state in all components.<br />
Performance across 15 indicators<br />
How to Interpret: Values are<br />
in a scale of -3 (worst) to +3<br />
(best) and 0 means average.<br />
The bars going upwards shows<br />
better than average (of all 28<br />
states) performance and the<br />
bars going downwards shows<br />
less than the average (of<br />
all 28 states).More number<br />
of longer upward bars is<br />
desirable and indicates good<br />
performances.<br />
Indicator Value Indicator Value Indicator Value<br />
Population Pressure -0.32 Land Use 0.75<br />
Natural Resource<br />
Depletion<br />
0.38<br />
Natural Resource<br />
Endowment<br />
-0.71<br />
Health<br />
Vulnerability<br />
Energy<br />
Management<br />
-0.50<br />
-0.47<br />
Air Pollution 1.14 Air Quality 0.35 People Initiative -0.34<br />
Water Pollution -0.12 Water Quality -0.61<br />
Government<br />
Initiative<br />
0.34<br />
Waste Generation -0.39 Disaster Management -0.44 GHG Emission 0.38<br />
… 21 …
<strong>ESI</strong> Score: 64.33<br />
<strong>ESI</strong> Rank: 12<br />
GSDP/capita: Rs. 20976 per year<br />
JHARKHAND<br />
State Profiles<br />
How to Interpret:<br />
Values farther from the<br />
centre indicates better<br />
performance; Values are<br />
calibrated in a scale of 0<br />
(worst) to 100 (best). More<br />
the area occupied by the<br />
chart in the spider indicates<br />
better performance by the<br />
state in all components.<br />
Performance across 15 indicators<br />
How to Interpret: Values are<br />
in a scale of -3 (worst) to +3<br />
(best) and 0 means average.<br />
The bars going upwards shows<br />
better than average (of all 28<br />
states) performance and the<br />
bars going downwards shows<br />
less than the average (of<br />
all 28 states).More number<br />
of longer upward bars is<br />
desirable and indicates good<br />
performances.<br />
Indicator Value Indicator Value Indicator Value<br />
Population Pressure -0.37 Land Use -0.14<br />
Natural Resource<br />
Depletion<br />
0.16<br />
Natural Resource<br />
Endowment<br />
-0.20<br />
Health<br />
Vulnerability<br />
Energy<br />
Management<br />
0.74<br />
0.43<br />
Air Pollution 0.10 Air Quality -1.59 People Initiative 1.30<br />
Water Pollution 0.70 Water Quality 0.57<br />
Government<br />
Initiative<br />
-0.82<br />
Waste Generation 0.49 Disaster Management -0.20 GHG Emission 0.60<br />
… 22 …
<strong>ESI</strong> Score: 55.79<br />
<strong>ESI</strong> Rank: 14<br />
GSDP/capita: Rs. 29746 per year<br />
KARNATAKA<br />
State Profiles<br />
How to Interpret:<br />
Values farther from the<br />
centre indicates better<br />
performance; Values are<br />
calibrated in a scale of 0<br />
(worst) to 100 (best). More<br />
the area occupied by the<br />
chart in the spider indicates<br />
better performance by the<br />
state in all components.<br />
Performance across 15 indicators<br />
How to Interpret: Values are<br />
in a scale of -3 (worst) to +3<br />
(best) and 0 means average.<br />
The bars going upwards shows<br />
better than average (of all 28<br />
states) performance and the<br />
bars going downwards shows<br />
less than the average (of<br />
all 28 states).More number<br />
of longer upward bars is<br />
desirable and indicates good<br />
performances.<br />
Indicator Value Indicator Value Indicator Value<br />
Population Pressure 0.52 Land Use -0.55<br />
Natural Resource<br />
Depletion<br />
-0.28<br />
Natural Resource<br />
Endowment<br />
-0.10<br />
Health<br />
Vulnerability<br />
Energy<br />
Management<br />
0.11<br />
0.08<br />
Air Pollution 0.29 Air Quality 0.02 People Initiative -0.54<br />
Water Pollution 0.47 Water Quality 0.54<br />
Government<br />
Initiative<br />
-0.29<br />
Waste Generation 0.20 Disaster Management 0.09 GHG Emission -0.05<br />
… 23 …
<strong>ESI</strong> Score: 53.71<br />
<strong>ESI</strong> Rank: 15<br />
GSDP/capita: Rs. 36919 per year<br />
KERALA<br />
State Profiles<br />
How to Interpret:<br />
Values farther from the<br />
centre indicates better<br />
performance; Values are<br />
calibrated in a scale of 0<br />
(worst) to 100 (best). More<br />
the area occupied by the<br />
chart in the spider indicates<br />
better performance by the<br />
state in all components.<br />
Performance across 15 indicators<br />
How to Interpret: Values are<br />
in a scale of -3 (worst) to +3<br />
(best) and 0 means average.<br />
The bars going upwards shows<br />
better than average (of all 28<br />
states) performance and the<br />
bars going downwards shows<br />
less than the average (of<br />
all 28 states).More number<br />
of longer upward bars is<br />
desirable and indicates good<br />
performances.<br />
Indicator Value Indicator Value Indicator Value<br />
Population Pressure 0.51 Land Use -0.04<br />
Natural Resource<br />
Depletion<br />
0.10<br />
Natural Resource<br />
Endowment<br />
1.11<br />
Health<br />
Vulnerability<br />
Energy<br />
Management<br />
-1.58<br />
0.15<br />
Air Pollution 0.44 Air Quality 0.72 People Initiative -0.47<br />
Water Pollution 0.02 Water Quality -0.85<br />
Government<br />
Initiative<br />
-0.77<br />
Waste Generation -0.01 Disaster Management 0.27 GHG Emission 0.60<br />
… 24 …
<strong>ESI</strong> Score: 43.01<br />
<strong>ESI</strong> Rank: 19<br />
GSDP/capita: Rs. 16790 per year<br />
MADHYA PRADESH<br />
State Profiles<br />
How to Interpret:<br />
Values farther from the<br />
centre indicates better<br />
performance; Values are<br />
calibrated in a scale of 0<br />
(worst) to 100 (best). More<br />
the area occupied by the<br />
chart in the spider indicates<br />
better performance by the<br />
state in all components.<br />
Performance across 15 indicators<br />
How to Interpret: Values are<br />
in a scale of -3 (worst) to +3<br />
(best) and 0 means average.<br />
The bars going upwards shows<br />
better than average (of all 28<br />
states) performance and the<br />
bars going downwards shows<br />
less than the average (of<br />
all 28 states).More number<br />
of longer upward bars is<br />
desirable and indicates good<br />
performances.<br />
Indicator Value Indicator Value Indicator Value<br />
Population Pressure -0.35 Land Use -0.35<br />
Natural Resource<br />
Depletion<br />
-0.08<br />
Natural Resource<br />
Endowment<br />
-0.42<br />
Health<br />
Vulnerability<br />
Energy<br />
Management<br />
0.54<br />
-1.27<br />
Air Pollution -1.33 Air Quality 0.12 People Initiative 0.51<br />
Water Pollution 0.57 Water Quality 0.20<br />
Government<br />
Initiative<br />
0.12<br />
Waste Generation 0.36 Disaster Management 0.07 GHG Emission -0.09<br />
… 25 …
<strong>ESI</strong> Score: 37.28<br />
<strong>ESI</strong> Rank: 20<br />
GSDP/capita: Rs. 40453 per year<br />
MAHARASHTRA<br />
State Profiles<br />
How to Interpret:<br />
Values farther from the<br />
centre indicates better<br />
performance; Values are<br />
calibrated in a scale of 0<br />
(worst) to 100 (best). More<br />
the area occupied by the<br />
chart in the spider indicates<br />
better performance by the<br />
state in all components.<br />
Performance across 15 indicators<br />
How to Interpret: Values are<br />
in a scale of -3 (worst) to +3<br />
(best) and 0 means average.<br />
The bars going upwards shows<br />
better than average (of all 28<br />
states) performance and the<br />
bars going downwards shows<br />
less than the average (of<br />
all 28 states).More number<br />
of longer upward bars is<br />
desirable and indicates good<br />
performances.<br />
Indicator Value Indicator Value Indicator Value<br />
Population Pressure 0.34 Land Use -0.43<br />
Natural Resource<br />
Depletion<br />
-0.09<br />
Natural Resource<br />
Endowment<br />
-0.44<br />
Health<br />
Vulnerability<br />
Energy<br />
Management<br />
0.55<br />
-0.22<br />
Air Pollution -0.53 Air Quality -0.18 People Initiative -0.22<br />
Water Pollution 0.04 Water Quality -0.48<br />
Government<br />
Initiative<br />
0.19<br />
Waste Generation -0.25 Disaster Management -0.34 GHG Emission -0.18<br />
… 26 …
<strong>ESI</strong> Score: 100.00<br />
<strong>ESI</strong> Rank: 1<br />
GSDP/capita: Rs. 21751 per year<br />
MANIPUR<br />
State Profiles<br />
How to Interpret:<br />
Values farther from the<br />
centre indicates better<br />
performance; Values are<br />
calibrated in a scale of 0<br />
(worst) to 100 (best). More<br />
the area occupied by the<br />
chart in the spider indicates<br />
better performance by the<br />
state in all components.<br />
Performance across 15 indicators<br />
How to Interpret: Values are<br />
in a scale of -3 (worst) to +3<br />
(best) and 0 means average.<br />
The bars going upwards shows<br />
better than average (of all 28<br />
states) performance and the<br />
bars going downwards shows<br />
less than the average (of<br />
all 28 states).More number<br />
of longer upward bars is<br />
desirable and indicates good<br />
performances.<br />
Indicator Value Indicator Value Indicator Value<br />
Population Pressure -0.59 Land Use 0.42<br />
Natural Resource<br />
Depletion<br />
0.69<br />
Natural Resource<br />
Endowment<br />
0.11<br />
Health<br />
Vulnerability<br />
Energy<br />
Management<br />
0.56<br />
0.67<br />
Air Pollution 0.99 Air Quality 0.25 People Initiative 1.86<br />
Water Pollution -0.07 Water Quality 0.17<br />
Government<br />
Initiative<br />
0.04<br />
Waste Generation 0.96 Disaster Management -0.63 GHG Emission 1.67<br />
… 27 …
<strong>ESI</strong> Score: 66.79<br />
<strong>ESI</strong> Rank: 11<br />
GSDP/capita: Rs. 25513 per year<br />
MEGHALAYA<br />
State Profiles<br />
How to Interpret:<br />
Values farther from the<br />
centre indicates better<br />
performance; Values are<br />
calibrated in a scale of 0<br />
(worst) to 100 (best). More<br />
the area occupied by the<br />
chart in the spider indicates<br />
better performance by the<br />
state in all components.<br />
Performance across 15 indicators<br />
How to Interpret: Values are<br />
in a scale of -3 (worst) to +3<br />
(best) and 0 means average.<br />
The bars going upwards shows<br />
better than average (of all 28<br />
states) performance and the<br />
bars going downwards shows<br />
less than the average (of<br />
all 28 states).More number<br />
of longer upward bars is<br />
desirable and indicates good<br />
performances.<br />
Indicator Value Indicator Value Indicator Value<br />
Population Pressure -0.14 Land Use -0.07<br />
Natural Resource<br />
Depletion<br />
0.50<br />
Natural Resource<br />
Endowment<br />
1.19<br />
Health<br />
Vulnerability<br />
Energy<br />
Management<br />
-1.11<br />
-0.02<br />
Air Pollution 0.72 Air Quality 1.11 People Initiative -0.61<br />
Water Pollution 0.01 Water Quality 0.67<br />
Government<br />
Initiative<br />
0.39<br />
Waste Generation -1.59 Disaster Management 0.00 GHG Emission 1.10<br />
… 28 …
<strong>ESI</strong> Score: 81.58<br />
<strong>ESI</strong> Rank: 5<br />
GSDP/capita: Rs. 27520 per year<br />
MIZORAM<br />
State Profiles<br />
How to Interpret:<br />
Values farther from the<br />
centre indicates better<br />
performance; Values are<br />
calibrated in a scale of 0<br />
(worst) to 100 (best). More<br />
the area occupied by the<br />
chart in the spider indicates<br />
better performance by the<br />
state in all components.<br />
Performance across 15 indicators<br />
How to Interpret: Values are<br />
in a scale of -3 (worst) to +3<br />
(best) and 0 means average.<br />
The bars going upwards shows<br />
better than average (of all 28<br />
states) performance and the<br />
bars going downwards shows<br />
less than the average (of<br />
all 28 states).More number<br />
of longer upward bars is<br />
desirable and indicates good<br />
performances.<br />
Indicator Value Indicator Value Indicator Value<br />
Population Pressure 0.31 Land Use 0.52<br />
Natural Resource<br />
Depletion<br />
0.40<br />
Natural Resource<br />
Endowment<br />
0.33<br />
Health<br />
Vulnerability<br />
Energy<br />
Management<br />
0.01<br />
1.01<br />
Air Pollution 0.91 Air Quality 1.06 People Initiative 0.25<br />
Water Pollution -0.31 Water Quality 0.45<br />
Government<br />
Initiative<br />
0.55<br />
Waste Generation -0.07 Disaster Management -0.08 GHG Emission -0.98<br />
… 29 …
<strong>ESI</strong> Score: 82.08<br />
<strong>ESI</strong> Rank: 4<br />
GSDP/capita: Not Available<br />
NAGALAND<br />
State Profiles<br />
How to Interpret:<br />
Values farther from the<br />
centre indicates better<br />
performance; Values are<br />
calibrated in a scale of 0<br />
(worst) to 100 (best). More<br />
the area occupied by the<br />
chart in the spider indicates<br />
better performance by the<br />
state in all components.<br />
Performance across 15 indicators<br />
How to Interpret: Values are<br />
in a scale of -3 (worst) to +3<br />
(best) and 0 means average.<br />
The bars going upwards shows<br />
better than average (of all 28<br />
states) performance and the<br />
bars going downwards shows<br />
less than the average (of<br />
all 28 states).More number<br />
of longer upward bars is<br />
desirable and indicates good<br />
performances.<br />
Indicator Value Indicator Value Indicator Value<br />
Population Pressure -0.08 Land Use -0.15<br />
Natural Resource<br />
Depletion<br />
0.59<br />
Natural Resource<br />
Endowment<br />
0.06<br />
Health<br />
Vulnerability<br />
Energy<br />
Management<br />
0.56<br />
0.40<br />
Air Pollution 0.76 Air Quality 0.55 People Initiative -0.11<br />
Water Pollution 0.12 Water Quality 0.61<br />
Government<br />
Initiative<br />
0.98<br />
Waste Generation 1.21 Disaster Management 0.17 GHG Emission -1.24<br />
… 30 …
<strong>ESI</strong> Score: 71.88<br />
<strong>ESI</strong> Rank: 8<br />
GSDP/capita: Rs. 19684 per year<br />
ORISSA<br />
State Profiles<br />
How to Interpret:<br />
Values farther from the<br />
centre indicates better<br />
performance; Values are<br />
calibrated in a scale of 0<br />
(worst) to 100 (best). More<br />
the area occupied by the<br />
chart in the spider indicates<br />
better performance by the<br />
state in all components.<br />
Performance across 15 indicators<br />
How to Interpret: Values are<br />
in a scale of -3 (worst) to +3<br />
(best) and 0 means average.<br />
The bars going upwards shows<br />
better than average (of all 28<br />
states) performance and the<br />
bars going downwards shows<br />
less than the average (of<br />
all 28 states).More number<br />
of longer upward bars is<br />
desirable and indicates good<br />
performances.<br />
Indicator Value Indicator Value Indicator Value<br />
Population Pressure 0.43 Land Use -0.06<br />
Natural Resource<br />
Depletion<br />
0.31<br />
Natural Resource<br />
Endowment<br />
-0.05<br />
Health<br />
Vulnerability<br />
Energy<br />
Management<br />
0.39<br />
-0.40<br />
Air Pollution -0.43 Air Quality 0.65 People Initiative -0.02<br />
Water Pollution 0.25 Water Quality 0.35<br />
Government<br />
Initiative<br />
0.43<br />
Waste Generation 0.30 Disaster Management 0.15 GHG Emission 0.61<br />
… 31 …
<strong>ESI</strong> Score: 0.00<br />
<strong>ESI</strong> Rank: 28<br />
GSDP/capita: Rs. 41268 per year<br />
PUNJAB<br />
State Profiles<br />
How to Interpret:<br />
Values farther from the<br />
centre indicates better<br />
performance; Values are<br />
calibrated in a scale of 0<br />
(worst) to 100 (best). More<br />
the area occupied by the<br />
chart in the spider indicates<br />
better performance by the<br />
state in all components.<br />
Performance across 15 indicators<br />
How to Interpret: Values are<br />
in a scale of -3 (worst) to +3<br />
(best) and 0 means average.<br />
The bars going upwards shows<br />
better than average (of all 28<br />
states) performance and the<br />
bars going downwards shows<br />
less than the average (of<br />
all 28 states).More number<br />
of longer upward bars is<br />
desirable and indicates good<br />
performances.<br />
Indicator Value Indicator Value Indicator Value<br />
Population Pressure 0.26 Land Use -0.62<br />
Natural Resource<br />
Depletion<br />
-1.13<br />
Natural Resource<br />
Endowment<br />
-0.40<br />
Health<br />
Vulnerability<br />
Energy<br />
Management<br />
0.43<br />
-1.19<br />
Air Pollution -1.28 Air Quality -1.15 People Initiative -0.51<br />
Water Pollution -1.90 Water Quality 0.07<br />
Government<br />
Initiative<br />
-0.68<br />
Waste Generation -0.26 Disaster Management 0.62 GHG Emission -0.09<br />
… 32 …
<strong>ESI</strong> Score: 26.52<br />
<strong>ESI</strong> Rank: 24<br />
GSDP/capita: Rs. 19218 per year<br />
RAJASTHAN<br />
State Profiles<br />
How to Interpret:<br />
Values farther from the<br />
centre indicates better<br />
performance; Values are<br />
calibrated in a scale of 0<br />
(worst) to 100 (best). More<br />
the area occupied by the<br />
chart in the spider indicates<br />
better performance by the<br />
state in all components.<br />
Performance across 15 indicators<br />
How to Interpret: Values are<br />
in a scale of -3 (worst) to +3<br />
(best) and 0 means average.<br />
The bars going upwards shows<br />
better than average (of all 28<br />
states) performance and the<br />
bars going downwards shows<br />
less than the average (of<br />
all 28 states).More number<br />
of longer upward bars is<br />
desirable and indicates good<br />
performances.<br />
Indicator Value Indicator Value Indicator Value<br />
Population Pressure -0.31 Land Use -0.69<br />
Natural Resource<br />
Depletion<br />
-0.55<br />
Natural Resource<br />
Endowment<br />
-0.84<br />
Health<br />
Vulnerability<br />
Energy<br />
Management<br />
0.59<br />
0.10<br />
Air Pollution 0.23 Air Quality -0.42 People Initiative -0.60<br />
Water Pollution 0.39 Water Quality -0.56<br />
Government<br />
Initiative<br />
1.06<br />
Waste Generation -1.45 Disaster Management 0.43 GHG Emission -1.23<br />
… 33 …
<strong>ESI</strong> Score: 90.99<br />
<strong>ESI</strong> Rank: 2<br />
GSDP/capita: Rs. 30354 per year<br />
SIKKIM<br />
State Profiles<br />
How to Interpret:<br />
Values farther from the<br />
centre indicates better<br />
performance; Values are<br />
calibrated in a scale of 0<br />
(worst) to 100 (best). More<br />
the area occupied by the<br />
chart in the spider indicates<br />
better performance by the<br />
state in all components.<br />
Performance across 15 indicators<br />
How to Interpret: Values are<br />
in a scale of -3 (worst) to +3<br />
(best) and 0 means average.<br />
The bars going upwards shows<br />
better than average (of all 28<br />
states) performance and the<br />
bars going downwards shows<br />
less than the average (of<br />
all 28 states).More number<br />
of longer upward bars is<br />
desirable and indicates good<br />
performances.<br />
Indicator Value Indicator Value Indicator Value<br />
Population Pressure 0.79 Land Use 1.75<br />
Natural Resource<br />
Depletion<br />
1.58<br />
Natural Resource<br />
Endowment<br />
-0.03<br />
Health<br />
Vulnerability<br />
Energy<br />
Management<br />
-2.11<br />
0.50<br />
Air Pollution 0.83 Air Quality -0.04 People Initiative 0.43<br />
Water Pollution 0.20 Water Quality 0.55<br />
Government<br />
Initiative<br />
0.80<br />
Waste Generation -0.03 Disaster Management -0.54 GHG Emission 1.10<br />
… 34 …
<strong>ESI</strong> Score: 33.75<br />
<strong>ESI</strong> Rank: 22<br />
GSDP/capita: Rs. 33666 per year<br />
TAMIL NADU<br />
State Profiles<br />
How to Interpret:<br />
Values farther from the<br />
centre indicates better<br />
performance; Values are<br />
calibrated in a scale of 0<br />
(worst) to 100 (best). More<br />
the area occupied by the<br />
chart in the spider indicates<br />
better performance by the<br />
state in all components.<br />
Performance across 15 indicators<br />
How to Interpret: Values are<br />
in a scale of -3 (worst) to +3<br />
(best) and 0 means average.<br />
The bars going upwards shows<br />
better than average (of all 28<br />
states) performance and the<br />
bars going downwards shows<br />
less than the average (of<br />
all 28 states).More number<br />
of longer upward bars is<br />
desirable and indicates good<br />
performances.<br />
Indicator Value Indicator Value Indicator Value<br />
Population Pressure 0.6 Land Use -0.2<br />
Natural Resource<br />
Depletion<br />
-0.3<br />
Natural Resource<br />
Endowment<br />
-0.2<br />
Health<br />
Vulnerability<br />
Energy<br />
Management<br />
0.7<br />
0.6<br />
Air Pollution -1.2 Air Quality 0.6 People Initiative -0.3<br />
Water Pollution -0.5 Water Quality 0.6<br />
Government<br />
Initiative<br />
0.0<br />
Waste Generation -0.9 Disaster Management 0.5 GHG Emission -2.7<br />
… 35 …
<strong>ESI</strong> Score: 85.81<br />
<strong>ESI</strong> Rank: 3<br />
GSDP/capita: Rs. 25994 per year<br />
TRIPURA<br />
State Profiles<br />
How to Interpret:<br />
Values farther from the<br />
centre indicates better<br />
performance; Values are<br />
calibrated in a scale of 0<br />
(worst) to 100 (best). More<br />
the area occupied by the<br />
chart in the spider indicates<br />
better performance by the<br />
state in all components.<br />
Performance across 15 indicators<br />
How to Interpret: Values are<br />
in a scale of -3 (worst) to +3<br />
(best) and 0 means average.<br />
The bars going upwards shows<br />
better than average (of all 28<br />
states) performance and the<br />
bars going downwards shows<br />
less than the average (of<br />
all 28 states).More number<br />
of longer upward bars is<br />
desirable and indicates good<br />
performances.<br />
Indicator Value Indicator Value Indicator Value<br />
Population Pressure 0.31 Land Use 0.37<br />
Natural Resource<br />
Depletion<br />
-0.34<br />
Natural Resource<br />
Endowment<br />
0.36<br />
Health<br />
Vulnerability<br />
Energy<br />
Management<br />
-0.87<br />
0.51<br />
Air Pollution 1.06 Air Quality 0.35 People Initiative 0.54<br />
Water Pollution -0.03 Water Quality 0.43<br />
Government<br />
Initiative<br />
0.68<br />
Waste Generation 0.16 Disaster Management -0.02 GHG Emission 1.47<br />
… 36 …
<strong>ESI</strong> Score: 21.40<br />
<strong>ESI</strong> Rank: 26<br />
GSDP/capita: Rs. 14656 per year<br />
UTTAR PRAESH<br />
State Profiles<br />
How to Interpret:<br />
Values farther from the<br />
centre indicates better<br />
performance; Values are<br />
calibrated in a scale of 0<br />
(worst) to 100 (best). More<br />
the area occupied by the<br />
chart in the spider indicates<br />
better performance by the<br />
state in all components.<br />
Performance across 15 indicators<br />
How to Interpret: Values are<br />
in a scale of -3 (worst) to +3<br />
(best) and 0 means average.<br />
The bars going upwards shows<br />
better than average (of all 28<br />
states) performance and the<br />
bars going downwards shows<br />
less than the average (of<br />
all 28 states).More number<br />
of longer upward bars is<br />
desirable and indicates good<br />
performances.<br />
Indicator Value Indicator Value Indicator Value<br />
Population Pressure -1.38 Land Use -0.48<br />
Natural Resource<br />
Depletion<br />
-0.80<br />
Natural Resource<br />
Endowment<br />
-0.65<br />
Health<br />
Vulnerability<br />
Energy<br />
Management<br />
0.67<br />
0.14<br />
Air Pollution 0.31 Air Quality -1.34 People Initiative -0.71<br />
Water Pollution -0.15 Water Quality -0.49<br />
Government<br />
Initiative<br />
-0.05<br />
Waste Generation 0.17 Disaster Management 0.47 GHG Emission -0.33<br />
… 37 …
<strong>ESI</strong> Score: 71.18<br />
<strong>ESI</strong> Rank: 9<br />
GSDP/capita: Rs. 27141 per year<br />
UTTARANCHAL<br />
State Profiles<br />
How to Interpret:<br />
Values farther from the<br />
centre indicates better<br />
performance; Values are<br />
calibrated in a scale of 0<br />
(worst) to 100 (best). More<br />
the area occupied by the<br />
chart in the spider indicates<br />
better performance by the<br />
state in all components.<br />
Performance across 15 indicators<br />
How to Interpret: Values are<br />
in a scale of -3 (worst) to +3<br />
(best) and 0 means average.<br />
The bars going upwards shows<br />
better than average (of all 28<br />
states) performance and the<br />
bars going downwards shows<br />
less than the average (of<br />
all 28 states).More number<br />
of longer upward bars is<br />
desirable and indicates good<br />
performances.<br />
Indicator Value Indicator Value Indicator Value<br />
Population Pressure 0.17 Land Use 0.53<br />
Natural Resource<br />
Depletion<br />
1.02<br />
Natural Resource<br />
Endowment<br />
1.04<br />
Health<br />
Vulnerability<br />
Energy<br />
Management<br />
0.41<br />
-0.26<br />
Air Pollution -0.01 Air Quality -1.06 People Initiative 0.57<br />
Water Pollution 0.01 Water Quality 0.19<br />
Government<br />
Initiative<br />
0.30<br />
Waste Generation 0.58 Disaster Management -0.35 GHG Emission -0.33<br />
… 38 …
<strong>ESI</strong> Score: 35.72<br />
<strong>ESI</strong> Rank: 21<br />
GSDP/capita: Rs. 26863 per year<br />
WEST BENGAL<br />
State Profiles<br />
How to Interpret:<br />
Values farther from the<br />
centre indicates better<br />
performance; Values are<br />
calibrated in a scale of 0<br />
(worst) to 100 (best). More<br />
the area occupied by the<br />
chart in the spider indicates<br />
better performance by the<br />
state in all components.<br />
Performance across 15 indicators<br />
How to Interpret: Values are<br />
in a scale of -3 (worst) to +3<br />
(best) and 0 means average.<br />
The bars going upwards shows<br />
better than average (of all 28<br />
states) performance and the<br />
bars going downwards shows<br />
less than the average (of<br />
all 28 states).More number<br />
of longer upward bars is<br />
desirable and indicates good<br />
performances.<br />
Indicator Value Indicator Value Indicator Value<br />
Population Pressure -0.50 Land Use -0.21<br />
Natural Resource<br />
Depletion<br />
0.06<br />
Natural Resource<br />
Endowment<br />
0.39<br />
Health<br />
Vulnerability<br />
Energy<br />
Management<br />
-0.06<br />
0.25<br />
Air Pollution 0.12 Air Quality -0.77 People Initiative 0.34<br />
Water Pollution -0.64 Water Quality -0.71<br />
Government<br />
Initiative<br />
0.10<br />
Waste Generation -0.63 Disaster Management -0.48 GHG Emission 0.26<br />
… 39 …
CHAPTER 2<br />
INTER-STATE COMPARISONS<br />
ACROSS INDICATORS<br />
While the state <strong>ESI</strong> profiles demonstrate the uniqueness of each state’s<br />
environmental dynamics; the cross-state comparison elucidates the<br />
distribution of positive and negative performances and identifies<br />
the leaders and the laggards. For example: Assam and Orissa have<br />
comparable <strong>ESI</strong> scores of 71.88 and 70.15 respectively. When studied in<br />
detail, it can be seen that Orissa’s scores are better distributed along<br />
all indicators than Assam where few extreme positive and negative<br />
values have influenced the rankings. Similarly Tamil Nadu (22nd rank)<br />
and Andhra Pradesh (23rd rank) are similar in overall score yet show<br />
considerable difference across policy categories.<br />
The graphs below present state-wise performance in the 15 indicators<br />
in standardized z-scores ranging from -3 to 3; greater distance from<br />
the centre means better performance. For example, in Indicator 1,<br />
Bihar and Uttar Pradesh scores are very close to the centre indicating<br />
a very high population pressure which is a negative sign. Greener bars<br />
(0 to +3) indicate better than average performance whereas states<br />
with less than average (-3 to 0) performance are shown in orange.<br />
INDICATOR 1: POPULATION PRESSURE<br />
Underlying Variables: Population density, Population growth, Total<br />
fertility rate<br />
<strong>Environment</strong>al Sustainability<br />
Index is a comparison<br />
tool meant to relatively<br />
review the environmental<br />
performance of the 28<br />
states.<br />
There is no absolute<br />
standards used for assigning<br />
ranks and each state is<br />
ranked against each other<br />
on a relative scale. Such<br />
comparisons emphasize the<br />
fact that no state dominates<br />
on all indicators therefore<br />
promoting creative<br />
competition and each state<br />
has something to learn from<br />
the other states.<br />
Population density has an impact on per capita natural resource<br />
availability and environmental conditions. High population density<br />
is often associated with poverty and unsustainable use of resources.<br />
Since the natural resources in an ecosystem and its carrying capacities<br />
are finite, increased population means more extractive resource use.<br />
Population density shows the level of direct pressure on resources;<br />
population growth and fertility rate indicate the pattern of change and<br />
affect the volume of demands on natural resources and implications<br />
for environmental degradation. Hence lower the population pressure,<br />
better chances of achieving sustainability.<br />
… 40 …
Best among 28 states<br />
Himachal Pradesh & Sikkim<br />
Least among 28 states<br />
Bihar & Uttar Pradesh<br />
INDICATOR 2: NATURAL RESOURCE DEPLETION<br />
Underlying Variables: % Change in forest area, % of Forest land encroached, Annual ground water draft as % of<br />
annual net groundwater available<br />
Due to severe degradation or loss of forest, their capacity to function as regulators for the environment is lost,<br />
thereby increasing floods, soil erosion, and change in soil fertility, less rainfall etc. leading to the loss of plant<br />
and animal life. Moreover, forest are important resources in terms of timber, NTFP, medicinal plants etc. Because<br />
of loss of forests, the sustainability of resources from forest is also lost. The encroached forest land signals human<br />
interference and potential loss of forest and biodiversity and also the lack of efficient implementation and regulation<br />
to protect forest resource. States with least depletion are more sustainable.<br />
Best among 28 states<br />
Sikkim & Uttaranchal<br />
Least among 28 states<br />
Gujarat & Punjab<br />
INDICATOR 3: AIR POLLUTION<br />
Underlying Variables: Nox emission per capita, So2 emission per capita, Co2 emission per capita, Number of<br />
motorized vehicles used per million people<br />
Air pollution is one of the most important indicators of clean environment. Nox, SO2, CO2 emissions create harmful<br />
particulate matter, ground-level ozone (smog) and acid rain and project the pollution load sate is going to face.<br />
The number of motor vehicles is a good indicator of air pollution from transport sector, which is a large proportion<br />
of the total air pollution.<br />
… 41 …
Best among 28 states<br />
Jammu & Kashmir, Tripura<br />
Least among 28 states<br />
Goa & Madhya Pradesh<br />
INDICATOR 4: WATER POLLUTION<br />
Underlying Variables: % of untreated waste water discharged, Fertilizer and Pesticide consumption per hectare of<br />
agricultural land<br />
Through untreated waste water toxic substances enter water bodies deteriorating its utility. Excessive use of<br />
fertilizers has negative impact on soil, water, humans and wildlife. Pesticides are highly poisonous substances,<br />
through drainage and seepage it enters the ecosystems and food chain. Continued water pollution has serious<br />
implication for availability of usable water and sustaining human life.<br />
Best among 28 states<br />
Chhattisgarh & Jharkhand<br />
Least among 28 states<br />
Punjab & West Bengal<br />
INDICATOR 5: WASTE GENERATION<br />
Underlying Variables: Per capita Municipal solid waste generated, Per capita hazardous waste generated<br />
Waste generation is important to consider since it shows the lifestyle and consumption patter of a society. More<br />
waste generated means higher ecosystem service extraction rate and thus less sustainability. States which generate<br />
less per-capita waste are more likely to manage their environment well.<br />
… 42 …
Best among 28 states<br />
Nagaland & Assam<br />
Least among 28 states<br />
Meghalaya & Rajasthan<br />
INDICATOR 6: LAND USE<br />
Underlying Variables: % of protected area, % of grazing and % of agriculture land<br />
Land use practices determine the long term ecosystem vitality of a state. Agricultural and grazing lane puts pressure<br />
on ecosystem and makes it fragile and unsustainable. Protected areas are a measure of the degree to which natural<br />
environment has been maintained and conserved.<br />
Best among 28 states<br />
Sikkim & Arunachal Pradesh<br />
Least among 28 states<br />
Himachal Pradesh & Rajasthan<br />
INDICATOR 7: NATURAL RESOURCE ENDOWMENT<br />
Underlying Variables: annual replenishable ground water, average annual rainfall, wetland as % of total geographic<br />
area and forest cover as % of total geographical area<br />
Greater endowment of natural resources such as forest, water and biodiversity equips the state to grow more<br />
sustainably. Ground water and Rainfall are important water resources and wetland is a good proxy of biodiversity.<br />
Forest cover is a good indicator of availability of natural resources like timber, NTFP, biodiversity etc. Forests also<br />
act as regulators of environment by preventing soil erosion, bringing rainfall and giving shelter to biodiversity.<br />
… 43 …
Best among 28 states<br />
Meghalaya & Kerala<br />
Least among 28 states<br />
Rajasthan & Haryana<br />
INDICATOR 8: AIR QUALITY<br />
Underlying Variables: Annual concentration of SO2 levels, Annual concentration of NO2 levels, Annual concentration<br />
of SPM levels, Annual concentration of RSPM levels<br />
Atmospheric concentration of SO2, NO2 and particulate matters measure the quality of air of a particular place at<br />
a given time. Higher concentration negatively affects both human and ecosystem health causing serious respiratory<br />
diseases. The presence of particulate matter reduces visibility. The deposition of particulate matter can change<br />
composition of soil and surface water and affects the ecosystem<br />
Best among 28 states<br />
Meghalaya & Mizoram<br />
Least among 28 states<br />
Jharkhand & Uttar Pradesh<br />
INDICATOR 9: WATER QUALITY<br />
Underlying Variables: Biological oxygen demand, Electrical conductivity, Total suspended solids<br />
Water quality is another important constituent of environment systems. Biological oxygen demand, electrical<br />
conductivity and total soluble solids are considered for <strong>ESI</strong> among the many parameter used to measure the quality<br />
of water. High levels of Electrical conductivity correspond to high concentrations of metals. Large number of<br />
suspended solids affects the aquatic life due to unavailability of light. They also make water unfit for drinking. BOD<br />
affects the amount of dissolved oxygen in the river and the streams, higher BOD leads to rapid depletion of oxygen<br />
which in turn creates more stress.<br />
… 44 …
Best among 28 states<br />
Goa & Meghalaya<br />
Least among 28 states<br />
Gujarat & Haryana<br />
INDICATOR 10: DISASTER MANAGEMENT<br />
Underlying Variables: % of degraded/wastelands, % of flood affected area, % of arid/drought prone and hazard prone<br />
area<br />
Disaster management is important for sustainable habitat creation. Drought and flood are stress situations, affect<br />
wealth and wellbeing and disturbs the ecological balance. More area under degraded category means there is less<br />
productive area and thus the pressure on environment becomes high. Similarly hazard prone areas cannot grow<br />
sustainably and make the ecosystem fragile. Disaster exposure increases vulnerability and reduces productivity.<br />
Best among 28 states<br />
Punjab & Haryana<br />
Least among 28 states<br />
Manipur & Sikkim<br />
INDICATOR 11: HUMAN HEALTH VULNERABILITY<br />
Underlying Variables: Incidence of acute respiratory and water borne diseases<br />
Reducing health problems caused by environmental pollution is a priority recognized by every society. Clean<br />
environment enhances health and well being and can reduce child mortality rate, increase life expectancy and<br />
quality of life. Inadequate sanitation, lack of quality drinking water, clean environment leads to respiratory and<br />
water borne disease.<br />
… 45 …
Best among 28 states<br />
Jharkhand & Tamil Nadu<br />
Least among 28 states<br />
Himachal Pradesh & Sikkim<br />
INDICATOR 12: ENERGY MANAGEMENT<br />
Underlying Variables: Per capita power consumed, share of renewable energy and energy-GDP ratio<br />
Energy and environment are highly interlinked, better energy management enhances sustainable growth. Renewable<br />
energy is clean and eco-friendly, more share of renewable in a state’s portfolio is a good indication of its future<br />
environment management. Higher power consumption leads to more demand for power leading to burning of fossil<br />
fuels and emission. Economic growth process of a state is more efficient if less energy is needed to produce a<br />
given set of goods and services. Hence such states have higher capacity to grow and at the same time preserve its<br />
environment.<br />
Best among 28 states<br />
Arunachal Pradesh & Mizoram<br />
Least among 28 states<br />
Goa & Madhya Pradesh<br />
INDICATOR 13: PEOPLES INITIATIVE<br />
Underlying Variables: Presence of environmental NGOs and joint forest management initiative<br />
Since environment is a public good, people’s initiative in preserving it is essential. Presence of environmental NGOs<br />
indicates better awareness and initiative in the state to preserve the ecosystem. Joint forest management is a<br />
good parameter to measure a society’s involvement in protecting its environment since it is a community initiative<br />
to protect and conserve the forest. Such indicators are important in judging a state’s ability to take care of its<br />
environment in the coming decades.<br />
… 46 …
Best among 28 states<br />
Manipur & Jharkhand<br />
Least among 28 states<br />
Uttar Pradesh & Haryana<br />
INDICATOR 14: GOVERNMENTS INITIATIVE<br />
Underlying Variables: % of industries defaulting and closed, state government’s expenditure on environment as % of<br />
total revenue expenditure, union government’s funds actual expenditure as % of agreed outlay for environment<br />
Resource endowment, depletion, pollution might vary among states due to historical conditions, economic growth<br />
and efficiency. When it comes to proactive government all states are on equal footing to start and promote<br />
better environment. Government’s action towards promoting sustainability can come through stricter regulation<br />
and increased funding. Closure of defaulting industries indicates transparent governance. The amount of funds<br />
released for environment issues in a state measures the degree to which government is concerned about the states<br />
environment.<br />
Best among 28 states<br />
Himachal Pradesh & Chhattisgarh<br />
Least among 28 states<br />
Jharkhand & Kerala<br />
INDICATOR 15: GHG EMISSION<br />
Underlying Variables: % change in green house gas emissions<br />
Green house gases are generated dues to anthropogenic activities like burning fossil fuels, industrial emission,<br />
methane release from livestock and agriculture. The GHG gases are the most important reason for global warming<br />
and climate change. The states are going to face the biggest environmental challenge arising from climate change<br />
in terms of change in temperature, monsoon pattern, crop yield, increased incidence of extreme weather events<br />
and loss of human life and wealth. GHG emission changes as a single indicator encapsulate changes in multiple<br />
environmental dimensions towards better governance.<br />
… 47 …
Best among 28 states<br />
Manipur & Haryana<br />
Least among 28 states<br />
Tamil Nadu & Nagaland<br />
… 48 …
CHAPTER 3<br />
CONCLUSIONS<br />
AND POLICY RECOMMENDATIONS<br />
<strong>ESI</strong> is a quantitative measure of the condition of the environment in<br />
each <strong>India</strong>n state. The <strong>ESI</strong> results demonstrate that indicators can, to a<br />
large extent, quantify heterogeneous information into measurable and<br />
manageable units that can aid in better policy making. Such information can<br />
help to measure and calibrate progress towards sustainable development<br />
goals.<br />
While quantification of environment is challenging both theoretically and<br />
in policy context; <strong>ESI</strong> can provide a platform for empirical, analytical<br />
and data-driven policy making. <strong>ESI</strong> is a powerful policy tool that can be<br />
used to identify priorities; a state might be facing several environmental<br />
challenges such as water pollution, air pollution and loss of forest and<br />
biodiversity. Using <strong>ESI</strong> it can be determined which of these issues needs<br />
the most urgent attention. It can be effectively used to formulate targeted<br />
policies and to allocate funds more rationally, within states and within<br />
sectors. Governments can benchmark their performance to peer states or<br />
with the best performing state to identify what are the historical and manmade<br />
factors that have created the difference in ranking and how best it<br />
can be changed.<br />
<strong>ESI</strong> is designed to help the policy makers understand a state’s sustainability<br />
in terms of natural resource management, pollution load, vulnerability and<br />
institutional capacity. It creates a baseline for cross-state and cross-sectoral<br />
performance comparisons and identifies priority environmental issues and<br />
areas of action. The historic resource endowments, past policies, extraction<br />
intensity and institutional capacities determine the future sustainability<br />
to a great extent. <strong>ESI</strong> has limited utility in suggestive of specific policy<br />
actions to be taken by states, its effectiveness lies in categorizing greener<br />
states and states in danger zones along multiple environmental indicators,<br />
analysing strengths and areas that need improvement, identifying best<br />
practices and successful policy models and evaluating adequacy and<br />
sufficiency of current policies. Through these analysis supplemented by<br />
data and peer comparisons, <strong>ESI</strong> can reinforce the economy-environment<br />
linkage and importance of integrated policy making. Complementing HDI<br />
Ranking of the states across<br />
different environmental<br />
indicators shows that each<br />
state has managed various<br />
aspects of its environment<br />
with unique strengths<br />
and weaknesses. Thus the<br />
future policies should be<br />
customized according to the<br />
requirements and conditions<br />
of each state, which has<br />
been one of the primary<br />
focuses of this study.<br />
The <strong>ESI</strong> is fundamentally a<br />
policy tool designed to make<br />
environmental decision<br />
making more empirical<br />
and analytically rigorous.<br />
The comparative nature of<br />
analysis aids in developing<br />
benchmarks and creating<br />
peer pressure.<br />
… 49 …
and GDP measures, <strong>ESI</strong> also provides a third dimension of ecological sustainability to evaluate the effectiveness of<br />
government policies.<br />
<strong>ESI</strong> uses the state as the unit of measurement. Each state has different ecological, geographical, social, economic<br />
and institutional structures. Beyond inter-state differences, variation within states, especially large states, can be<br />
quite high. While large states like Uttar Pradesh or Maharashtra are heterogeneous with unequal wealth and resource<br />
distribution, smaller states like Sikkim and Goa are more homogenous with a small population and geographical area.<br />
Although these differences may have some impact on <strong>ESI</strong> scores, the state was chosen as the unit of measurement<br />
as most of the resources in <strong>India</strong> are measured at the state level, and hence data are available at the state level<br />
only. Moreover, as the state is the key unit for policy formulation and implementation, the choice of the state as<br />
the unit of measurement is relevant for policy makers.<br />
<strong>ESI</strong> reveals that most of the richer states with high per capita GDP (Punjab, Haryana and Gujarat) have fared poorly<br />
in <strong>ESI</strong> whereas Orissa, Assam, Bihar scores high on sustainability despite low per capita GDP. Most states show mixed<br />
results, Himachal and Kerala are the states which have managed to grow sustainably. The relationship between<br />
economic growth and the environment is complex and controversial and is likely to remain so. The <strong>Environment</strong>al<br />
Kuznet’s Curve (EKC Hypothesis 1 ) is the most popular and widely accepted model in this regard. Extending EKC and<br />
Brock and Taylor hypothesis (2003)2, it can be assumed that most of the <strong>India</strong>n states are likely to cause further<br />
damage to the environment in the growth process and then after a certain point of economic growth, the states<br />
will be able to invest in pollution control and environment friendly technologies. Given the fact that most of the<br />
states are growing rapidly, environmental challenges in the future is most likely to remain a key policy concern.<br />
The experience of rapidly growing countries has been to grow first and clean up later. However, this neglect of<br />
the environment has resulted in irreversible losses and high cleanup costs. <strong>India</strong>n states have to learn from these<br />
experiences, and the best way forward is to focus on “green growth” strategies by promoting renewable energy,<br />
investing in pollution control and waste management practices, environmental taxes, conservation of natural<br />
resources and raising public awareness.<br />
<strong>ESI</strong> for <strong>India</strong>n state is a pioneer effort in establishing the linkages between data and decisions in environmental<br />
sectors. Its robustness is limited by data inadequacy, conceptual questions on measuring sustainability, methodological<br />
short-comings and necessary interpretations of relative rankings. The <strong>ESI</strong> is particularly suitable in cross-state and<br />
cross-sector comparisons which drive better policy focus. Given robust data sets and analytical framework, using<br />
proximity-to-target method a better sustainability performance measurement can be developed to be used in timeseries<br />
comparisons.<br />
The state of the environment is multidimensional and is difficult to capture in a single index. The <strong>ESI</strong> is not designed<br />
to provide an exhaustive picture of a state’s environmental issues, but rather to help reveal trends and draw<br />
attention to phenomena that require further analysis and possible action. It can be used to create baseline data<br />
of the environmental performance of states, which can then be used in the future to analyze trends and patterns.<br />
It aims to create awareness among policy makers, researchers and practitioners and should guide policy makers in<br />
setting achievable sustainable development standards and strategies for the states.<br />
1 For a comprehensive review of literature on EKC hypothesis see Dinda (2004) and Stern (1998). Working Paper: Economic Growth and the<br />
<strong>Environment</strong>: Matching the Stylized Facts, 2003. William Brock and M. Scott Taylor, Department of Economics, University of Wisconsin-<br />
Madison.<br />
… 50 …
CHAPTER 4<br />
<strong>ESI</strong> FOR INDIAN STATES 2008<br />
DETAILED METHODOLOGY<br />
Selection of the variables in <strong>ESI</strong><br />
In calculating <strong>ESI</strong>, data covering a wide range of environmental factors were sought. The variables were chosen<br />
according to their relevance, accuracy and reliability. For some variables, as was the case for air and water pollution,<br />
data for each state were not available. Thus datasets had to be customized with data gathered from multiple<br />
sources. If the chosen datasets were relevant, they were further scrutinized for accuracy and reliability. In most<br />
cases, data were sought from the most recent available government sources and reports. In <strong>India</strong>, government data<br />
are the most reliable and are collected using a standard methodology. For example, all data related to forest cover,<br />
total geographical area, etc. was taken from the Forest Survey Report, 2005. In certain cases proxy variables were<br />
used to capture important measures. For biodiversity, since data for threatened species of mammals, birds and<br />
reptiles as a percentage of total known breeding species were not available at the state level, the proxy variables<br />
of total percentage of wetland area and total percentage of protected area were used instead. The percentage of<br />
untreated waste water discharged to total waste water generated was taken as a proxy for water pollution.<br />
Standardization of the variables for comparisons across states<br />
To use data for calculating the <strong>ESI</strong> score for each state, the raw data should be on a comparable scale; therefore<br />
suitable denominators were chosen to transform data into a comparable scale. For example, data like forest<br />
cover was made comparable by taking total geographic area as the denominator, while data like incidence of<br />
respiratory disease was made comparable by taking total population as the denominator. The most commonly used<br />
denominators were GDP, total population and total geographical area. This process ensured that no state was given<br />
undue advantage or disadvantage because of its geographical size or population. Also the percentage change of a<br />
variable was taken into account in some cases to capture the rate of flow of resources or the rate of accumulation<br />
of waste. In doing so, a state’s relative performance over the years is gauged; this procedure further mitigates<br />
differences arising from area or population size. The standardization for each variable is listed in Table 2.<br />
Transformation of the variables for the imputation and aggregation procedures<br />
After adjusting the data for comparisons across states, the data were then aggregated. In order to adjust for<br />
the different units of the different variables and the need to assign a relative score to each state, the data were<br />
transformed into Z-scores, which represent standardized deviations from the mean. These Z-scores have a mean of<br />
0 and a standard deviation equal to 1. The Z-score is calculated from the following formula:<br />
Z = (x - µ)/σ<br />
Where, X = value of the variable; µ = mean; σ = standard deviation<br />
Z-scores computed from datasets with different units can be directly compared since these numbers do not express<br />
the original unit of measurement. As the Z-score represents the number of standard deviations from x to the<br />
mean, it gives a relative score for all variables. In the cases where a state’s performance on either extreme of the<br />
… 51 …
spectrum might have skewed its overall score, logarithmic transformation was performed to reduce the impact of<br />
outliers. All variables that had a skewness value less than 2.5 were transformed using the Z-score transformations<br />
and the rest were transformed using the logarithmic transformations. The latter were then again converted into<br />
Z-scores such that they can be aggregated.<br />
Substituting values for missing data<br />
There were many instances where no value was available for the variable in the current dataset. As discussed<br />
earlier, this is a serious constraint of the study, as no values for a particular state may affect its <strong>ESI</strong> score. Missing<br />
data may also reduce the precision of a calculated <strong>ESI</strong> score because there is less information than originally<br />
planned. The regression imputation method was used to impute the missing values. It is based on the assumptions<br />
that the marginal distributions of the data are normal and that linear relationships between variables exist that can<br />
be utilized for building linear regression models that predict the missing data.<br />
Changing direction of the Z-Score according to the <strong>ESI</strong><br />
Since there were both positive and negative variables among the chosen ones, the computed Z-score for all variables<br />
lie within the range +3 to -3. For example, in the case of the variable % change in forest cover, a positive Z-score<br />
would highlight a change in a favourable direction and a negative Z-score would highlight a change in an unfavorable<br />
direction. Here, the interpretation of Z-score is the same as that of the <strong>ESI</strong> score. So in such cases Z-score can be<br />
used directly without recoding it for direction. But in the case of the variable population density, a more positive<br />
deviation from the mean (i.e., a higher Z-score), would mean a higher absolute value for a state. Thus a higher<br />
positive Z-Score would mean a high population density, which is not in a favorable direction for the <strong>ESI</strong> of that State.<br />
The Z-score should therefore be recoded for its direction. This was done by simply changing the sign of the z-score<br />
while keeping the magnitude of the Z-score same. Thus, all higher positive Z- scores would get converted into lower<br />
negative Z-scores and vice versa. Information about the recoding done to make all the indicators unidirectional is<br />
listed as below:<br />
Winsorization of the data<br />
Winsorization is an imputation rule limiting the influence of the largest and smallest observations in the available<br />
data (OECD, Definition). It does so by shifting the observations in the tails of the distribution to specified percentiles.<br />
For each variable, the values exceeding the 95 th percentile are lowered to the 95 th percentile and the values smaller<br />
than the 5 th percentile are raised to the 5 th percentile. This was done so that a few very large or very small values<br />
do not bias the <strong>ESI</strong> score for a state. Though extreme outliers had already been reduced by the means of data<br />
transformation, Winsorization further reduced the affect of outliers.<br />
Aggregation of the data to indicator scores and the final <strong>ESI</strong> score<br />
Out of the multiple methods of aggregation; the equal weighted average has been used to compute the <strong>ESI</strong>. There<br />
were 44 underlying variables, which were aggregated into the 15 indicators that were used to calculate the final <strong>ESI</strong><br />
score. While taking the aggregate, equal weight was given to the each variable. The score for all the 15 indicators<br />
was combined to give the final <strong>ESI</strong> score. The <strong>ESI</strong> score was made comparable by rescaling the scores from a low of 0<br />
to a high of100. The states were ranked according to their <strong>ESI</strong> score. The higher the <strong>ESI</strong> score the better the state’s<br />
performance and the higher its ranking.<br />
… 52 …
REFERENCES<br />
2005 <strong>Environment</strong>al Sustainability Index (<strong>ESI</strong>), 2005 <strong>Environment</strong>al Sustainability Index. New Haven, Conn.: Yale<br />
Center for <strong>Environment</strong>al Law & Policy, World Economic Forum<br />
2006 Pilot <strong>Environment</strong>al Performance Index (EPI), 2006 <strong>Environment</strong>al Performance Index. New Haven, Conn.:<br />
Yale Center for <strong>Environment</strong>al Law & Policy, World Economic Forum<br />
Ahmed K. A, Ferring A. And Ruizmanual L.I, 2003, <strong>Environment</strong>al Health Indicators and Benchmarks: Human<br />
Rights Perspectives, Science and Human Rights Program, American Association for The Advancement Of Science<br />
International Institute for Sustainable Development (IISD), et al., 2004, Compendium of Sustainable Development<br />
Indicators, Winnipeg: IISD<br />
Jha R., Murthy K.V. Bhanu, 2003, A Critique of The <strong>Environment</strong>al Sustainability Index<br />
Jochen Jesinghaus, Rosemary Montgomery, Et Al 1999, Towards <strong>Environment</strong>al Pressure Indicators for The<br />
European Union<br />
Keeping Score - <strong>ESI</strong> - ‘2001 <strong>Environment</strong>al Sustainability Index’ - Statistical Data Included The Ecologist, April<br />
2001<br />
Lefevre B., 2005, Urban Energetic Signature: A New Approach for Indicators, ERP Sustainable Development<br />
Research Conference<br />
Levy M.A., 2002, 2002 <strong>Environment</strong>al Sustainability Index: Lessons and Prospects, Argentina<br />
Marc Levy, 2006, Experiments In Measuring Sustainability - The <strong>Environment</strong>al Sustainability Index and Its Critics,<br />
CI<strong>ESI</strong>N, Earth Institute, Columbia University<br />
Mohanraj R. And Azeez P. A., 2004, Health Effects Of Airborne Particulate Matter and The <strong>India</strong>n Scenario,<br />
Current 742 Science, Vol. 87, No. 6, 25 September 2004<br />
Nardo M., Saisana M. et al (OECD), 2005, Handbook on Constructing Composite Indicators: Methodology and User<br />
Guide, OECD Statistics Working Paper<br />
OECD-China Seminar on <strong>Environment</strong>al Indicators Proceedings, Programme Of Dialogue and Co-Operation with<br />
China, Organization for Economic Co-Operation and Development (OECD), 2005<br />
SEDAC Compendium of <strong>Environment</strong>al Sustainability Indicator Collections Version 1 – Metadata<br />
Shortcomings of the <strong>Environment</strong>al Sustainability Index, Notes By Mathis Wackernagel, Redefining Progress,<br />
February 10, 2001<br />
Sors J. C., 2001, Measuring Progress towards Sustainable Development in Venice: A Comparative Assessment of<br />
Methods and Approaches<br />
The Working Group on <strong>Environment</strong>al Information and Outlooks (WGEIO), 2001, Aggregated <strong>Environment</strong>al<br />
Indices Review of Aggregation Methodologies in Use OECD Programme on <strong>Environment</strong>al Indicators<br />
Unescap, 2007, Handout Summary of Indicator Initiatives<br />
United Nations Division for Sustainable Development, 2001, Indicators of Sustainable Development: Guidelines<br />
and Methodologies. New York: United Nations Division for Sustainable Development<br />
… 53 …
… 54 …
Jammu & Kashmir<br />
Punjab<br />
Himachal Pradesh<br />
Uttaranchal<br />
Haryana<br />
Arunachal Pradesh<br />
Rajasthan<br />
Uttar Pradesh<br />
Bihar<br />
Sikkim<br />
Meghalaya<br />
Assam<br />
Nagaland<br />
Manipur<br />
Gujarat<br />
Madhya Pradesh<br />
Jharkhand<br />
West<br />
Bengal<br />
Tripura<br />
Mizoram<br />
Maharashtra<br />
Chhattisgarh<br />
Orissa<br />
Goa<br />
Andhra Pradesh<br />
Karnataka<br />
Kerala<br />
Tamil Nadu<br />
C F D F<br />
I F F M A R<br />
24, Kothari Road, Nungambakkam, Chennai 600 034, <strong>India</strong>.<br />
Online <strong>Portal</strong> : www.greenindiastandards.com • www.ifmr.ac.in/cdf<br />
COMPUPRINT • 2811 6768