performance evaluation of hyundai motor india limited: an overview
performance evaluation of hyundai motor india limited: an overview
performance evaluation of hyundai motor india limited: an overview

Create successful ePaper yourself
Turn your PDF publications into a flip-book with our unique Google optimized e-Paper software.
International Journal <strong>of</strong> Marketing, Fin<strong>an</strong>cial Services & M<strong>an</strong>agement Research________________________ ISSN 2277- 3622<br />
Vol.2, No. 3, March (2013)<br />
Online available at www.<strong>india</strong>nresearchjournals.com<br />
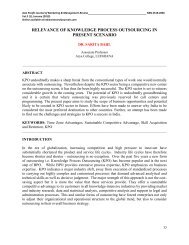
Graph 1.1<br />
Sales <strong>of</strong> Hyundai Motor India Limited<br />
Source: CMIE Prowess Database, 2009<br />
From the above pie chart it is revealed that the sales <strong>of</strong> Hyundai Motor India Limited in year March 1999<br />
was 509.73 crore whereas in year 2000, Hyundai‟s total sales was 2333.86 crore. In 2002, the comp<strong>an</strong>y‟s<br />
sale was 3,385 crore i.e in this year the comp<strong>an</strong>y registered growth <strong>of</strong> 11.56 percent over 2001. In year<br />
2007, the comp<strong>an</strong>y registered growth <strong>of</strong> 16.53 percent over 2006. In this year Hyundai‟s sales was 10,353<br />
crore whereas the sale in 2006 was 8,898 crore.<br />
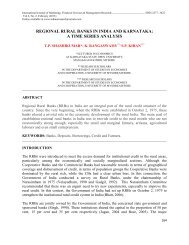
The following pie chart describes the domestic sales <strong>of</strong> Hyundai Motors during 1998 to 2010.<br />
Graph 1.2<br />
Domestic Sales <strong>of</strong> Hyundai Motor India Ltd<br />
Source: http://www.<strong>hyundai</strong>.com<br />
117