997.4 KB - San Francisco Bay Area Independent Media Center
997.4 KB - San Francisco Bay Area Independent Media Center
997.4 KB - San Francisco Bay Area Independent Media Center

You also want an ePaper? Increase the reach of your titles
YUMPU automatically turns print PDFs into web optimized ePapers that Google loves.
Key Issues for Seawater Desalination in California: Cost and Financing<br />
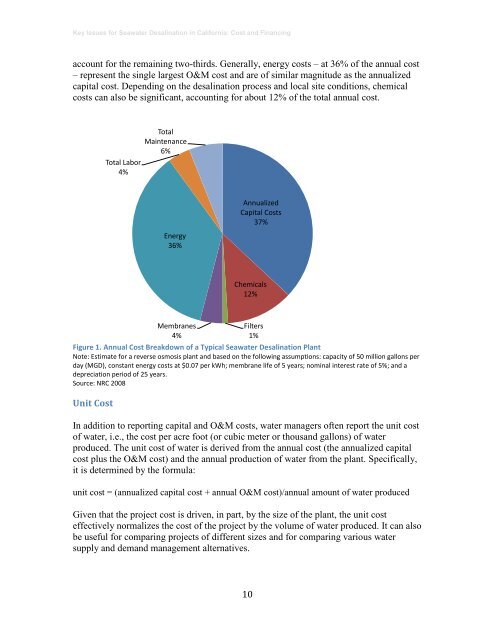
account for the remaining two-thirds. Generally, energy costs – at 36% of the annual cost<br />
– represent the single largest O&M cost and are of similar magnitude as the annualized<br />
capital cost. Depending on the desalination process and local site conditions, chemical<br />
costs can also be significant, accounting for about 12% of the total annual cost.<br />
Total Labor<br />
4%<br />
Total<br />
Maintenance<br />
6%<br />
Energy<br />
36%<br />
Annualized<br />
Capital Costs<br />
37%<br />
Chemicals<br />
12%<br />
Figure 1. Annual Cost Breakdown of a Typical Seawater Desalination Plant<br />
Note: Estimate for a reverse osmosis plant and based on the following assumptions: capacity of 50 million gallons per<br />
day (MGD), constant energy costs at $0.07 per kWh; membrane life of 5 years; nominal interest rate of 5%; and a<br />
depreciation period of 25 years.<br />
Source: NRC 2008<br />
Unit Cost<br />
Membranes<br />
4%<br />
Filters<br />
1%<br />
In addition to reporting capital and O&M costs, water managers often report the unit cost<br />
of water, i.e., the cost per acre foot (or cubic meter or thousand gallons) of water<br />
produced. The unit cost of water is derived from the annual cost (the annualized capital<br />
cost plus the O&M cost) and the annual production of water from the plant. Specifically,<br />
it is determined by the formula:<br />
unit cost = (annualized capital cost + annual O&M cost)/annual amount of water produced<br />
Given that the project cost is driven, in part, by the size of the plant, the unit cost<br />
effectively normalizes the cost of the project by the volume of water produced. It can also<br />
be useful for comparing projects of different sizes and for comparing various water<br />
supply and demand management alternatives.<br />
10