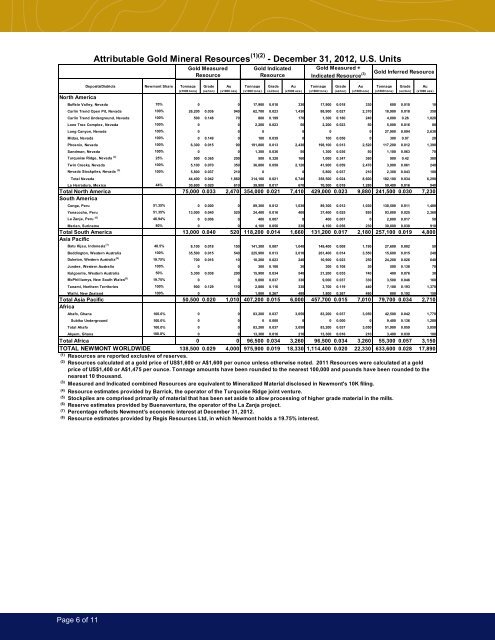
North America Attributable Gold Mineral Resources (1)(2) - December 31, 2012, U.S. Units Deposits/Districts Newmont Share Gold Measured Resource Gold Indicated Resource Newmont Mining Corporation 6363 South Fiddlers Green Circle Gold Measured + Greenwood Village, CO 80111 Indicated Resource T 303.863.7414 (3) Gold Inferred Resource F 303.837.5837 www.newmont.com Tonnage Grade Au Tonnage Grade Au Tonnage Grade Au Tonnage Grade Au (x1000 tons) (oz/ton) (x1000 ozs) (x1000 tons) (oz/ton) (x1000 ozs) (x1000 tons) (oz/ton) (x1000 ozs) (x1000 tons) (oz/ton) (x1000 ozs) Buffalo Valley, Nevada 70% 0 0 17,900 0.018 330 17,900 0.018 330 600 0.010 10 Carlin Trend Open Pit, Nevada 100% 26,200 0.036 940 62,700 0.023 1,430 88,900 0.027 2,370 18,900 0.018 350 Carlin Trend Underground, Nevada 100% 500 0.148 70 800 0.199 170 1,300 0.180 240 4,000 0.26 1,020 Lone Tree Complex, Nevada 100% 0 0 2,200 0.023 50 2,200 0.023 50 5,000 0.016 80 Long Canyon, Nevada 100% 0 0 0 0 0 0 27,900 0.094 2,630 Midas, Nevada 100% 0 0.149 0 100 0.039 0 100 0.056 0 300 0.07 20 Phoenix, Nevada 100% 6,300 0.015 90 191,800 0.013 2,430 198,100 0.013 2,520 117,200 0.012 1,390 Sandman, Nevada 100% 0 0 1,300 0.036 50 1,300 0.036 50 1,100 0.063 70 Turquoise Ridge, Nevada (4) 25% 500 0.365 200 500 0.328 160 1,000 0.347 360 900 0.42 380 Twin Creeks, Nevada 100% 5,100 0.070 350 36,800 0.058 2,120 41,900 0.059 2,470 3,900 0.061 240 Nevada Stockpiles, Nevada (5) 100% 5,800 0.037 <strong>21</strong>0 0 0 5,800 0.037 <strong>21</strong>0 2,300 0.043 100 Total Nevada 44,400 0.042 1,860 314,100 0.0<strong>21</strong> 6,740 358,500 0.024 8,600 182,100 0.034 6,290 La Herradura, Mexico 44% 30,600 0.020 610 39,900 0.017 670 70,500 0.018 1,280 59,400 0.016 940 Total North America 75,000 0.033 2,470 354,000 0.0<strong>21</strong> 7,410 429,000 0.023 9,880 241,500 0.030 7,230 South America Conga, Peru 51.35% 0 0.000 0 89,300 0.012 1,030 89,300 0.012 1,030 130,500 0.011 1,480 Yanacocha, Peru 51.35% 13,000 0.040 520 24,400 0.016 400 37,400 0.025 920 93,800 0.025 2,360 La Zanja, Peru (6) 46.94% 0 0.006 0 400 0.007 0 400 0.007 0 2,800 0.017 50 Merian, Suriname 80% 0 0 4,100 0.056 230 4,100 0.056 230 30,000 0.030 910 Total South America 13,000 0.040 520 118,200 0.014 1,660 131,200 0.017 2,180 257,100 0.019 4,800 Asia Pacific Batu Hijau, Indonesia (7) 48.5% 8,100 0.018 150 141,300 0.007 1,040 149,400 0.008 1,190 27,600 0.002 50 Boddington, Western Australia 100% 35,500 0.015 540 225,900 0.013 3,010 261,400 0.014 3,550 15,600 0.015 240 Duketon, Western Australia (8) 19.75% 700 0.016 10 10,200 0.023 240 10,900 0.023 250 24,200 0.026 640 Jundee, Western Australia 100% 0 0 300 0.108 30 300 0.108 30 500 0.138 70 Kalgoorlie, Western Australia 50% 5,300 0.038 200 15,900 0.034 540 <strong>21</strong>,200 0.035 740 400 0.076 30 McPhilliamys, New South Wales (8) 19.75% 0 0 9,000 0.037 330 9,000 0.037 330 3,500 0.046 160 Tanami, Northern Territories 100% 900 0.129 110 2,800 0.116 330 3,700 0.119 440 7,100 0.193 1,370 Waihi, New Zealand 100% 0 0 1,800 0.267 480 1,800 0.267 480 800 0.192 150 Total Asia Pacific 50,500 0.020 1,010 407,200 0.015 6,000 457,700 0.015 7,010 79,700 0.034 2,710 Africa Ahafo, Ghana 100.0% 0 0 83,200 0.037 3,050 83,200 0.037 3,050 42,500 0.042 1,770 Subika Underground 100.0% 0 0 0 0.000 0 0 0.000 0 9,400 0.136 1,280 Total Ahafo 100.0% 0 0 83,200 0.037 3,050 83,200 0.037 3,050 51,900 0.059 3,050 Akyem, Ghana 100.0% 0 0 13,300 0.016 <strong>21</strong>0 13,300 0.016 <strong>21</strong>0 3,400 0.030 100 Total Africa 0 0 96,500 0.034 3,260 96,500 0.034 3,260 55,300 0.057 3,150 TOTAL NEWMONT WORLDWIDE 138,500 0.029 4,000 975,900 0.019 18,330 1,114,400 0.020 22,330 633,600 0.028 17,890 (1) Resources are reported exclusive of reserves. (2) Resources calculated at a gold price of US$1,600 or A$1,600 per ounce unless otherwise noted. 2011 Resources were calculated at a gold price of US$1,400 or A$1,475 per ounce. Tonnage amounts have been rounded to the nearest 100,000 and pounds have been rounded to the nearest 10 thousand. (3) Measured and Indicated combined Resources are equivalent to Mineralized Material disclosed in Newmont's 10K filing. (4) Resource estimates provided by Barrick, the operator of the Turquoise Ridge joint venture. (5) Stockpiles are comprised primarily of material that has been set aside to allow processing of higher grade material in the mills. (6) Reserve estimates provided by Buenaventura, the operator of the La Zanja project. (7) Percentage reflects Newmont’s economic interest at December 31, 2012. (8) Resource estimates provided by Regis Resources Ltd, in which Newmont holds a 19.75% interest. Page 6 of 11
North America Attributable Gold Mineral Resources (1)(2) - December 31, 2012, Metric units Deposits/Districts Newmont Share Gold Measured Resource Gold Indicated Resource Newmont Mining Corporation Gold Measured 6363 + South Fiddlers Green Circle Greenwood Village, CO 80111 Indicated Resource (3) Gold Inferred Resource T 303.863.7414 F 303.837.5837 www.newmont.com Tonnage Grade Au Tonnage Grade Au Tonnage Grade Au Tonnage Grade Au (x1000 tonnes) (g/tonne) (x1000 ozs) (x1000 tonnes) (g/tonne) (x1000 ozs) (x1000 tonnes) (g/tonne) (x1000 ozs) (x1000 tonnes) (g/tonne) (x1000 ozs) Buffalo Valley, Nevada 70% 0 0 16,200 0.63 330 16,200 0.63 330 500 0.35 10 Carlin Trend Open Pit, Nevada 100% 23,800 1.22 940 56,900 0.78 1,430 80,700 0.91 2,370 17,100 0.63 350 Carlin Trend Underground, Nevada 100% 400 5.07 70 800 6.82 170 1,200 6.19 240 3,600 8.75 1,020 Lone Tree Complex, Nevada 100% 0 0 2,000 0.79 50 2,000 0.79 50 4,600 0.55 80 Long Canyon, Nevada 100% 0 0 0 0 0 0 25,400 3.22 2,630 Midas, Nevada 100% 0 5.10 0 100 1.35 0 100 1.93 0 300 2.27 20 Phoenix, Nevada 100% 5,700 0.50 90 174,000 0.43 2,430 179,700 0.44 2,520 106,300 0.41 1,390 Sandman, Nevada 100% 0 0 1,200 1.23 50 1,200 1.23 50 1,000 2.17 70 Turquoise Ridge, Nevada (4) 25% 500 12.51 200 400 11.25 160 900 11.91 360 800 14.28 380 Twin Creeks, Nevada 100% 4,600 2.39 350 33,400 1.98 2,120 38,000 2.03 2,470 3,600 2.10 240 Nevada Stockpiles, Nevada (5) 100% 5,200 1.25 <strong>21</strong>0 0 0 5,200 1.25 <strong>21</strong>0 2,100 1.48 100 Total Nevada 40,200 1.44 1,860 285,000 0.74 6,740 325,200 0.82 8,600 165,300 1.18 6,290 La Herradura, Mexico 44% 27,700 0.69 610 36,200 0.57 670 63,900 0.62 1,280 53,900 0.54 940 Total North America 67,900 1.13 2,470 3<strong>21</strong>,200 0.72 7,410 389,100 0.79 9,880 <strong>21</strong>9,200 1.02 7,230 South America Conga, Peru 51.35% 0 0.00 0 81,000 0.40 1,030 81,000 0.40 1,030 118,400 0.39 1,480 Yanacocha, Peru 51.35% 11,800 1.38 520 22,100 0.56 400 33,900 0.85 920 85,100 0.86 2,360 La Zanja, Peru (6) 46.94% 0 0.20 0 300 0.23 0 300 0.23 0 2,600 0.58 50 Merian, Suriname 80% 0 0 3,700 1.90 230 3,700 1.90 230 27,200 1.04 910 Total South America 11,800 1.38 520 107,100 0.48 1,660 118,900 0.57 2,180 233,300 0.64 4,800 Asia Pacific Batu Hijau, Indonesia (7) 48.5% 7,300 0.62 150 128,200 0.25 1,040 135,500 0.27 1,190 25,000 0.07 50 Boddington, Western Australia 100% 32,200 0.52 540 204,900 0.46 3,010 237,100 0.47 3,550 14,200 0.52 240 Duketon, Western Australia (8) 19.75% 700 0.54 10 9,200 0.80 240 9,900 0.78 250 <strong>21</strong>,900 0.91 640 Jundee, Western Australia 100% 0 0 200 3.69 30 200 3.69 30 500 4.74 70 Kalgoorlie, Western Australia 50% 4,800 1.29 200 14,500 1.16 540 19,300 1.19 740 300 2.61 30 McPhilliamys, New South Wales (8) 19.75% 0 0 8,200 1.27 330 8,200 1.27 330 3,200 1.57 160 Tanami, Northern Territories 100% 800 4.41 110 2,600 3.97 330 3,400 4.08 440 6,500 6.61 1,370 Waihi, New Zealand 100% 0 0 1,600 9.14 480 1,600 9.14 480 700 6.57 150 Total Asia Pacific 45,800 0.69 1,010 369,400 0.51 6,000 415,200 0.53 7,010 72,300 1.17 2,710 Africa Ahafo, Ghana 100.0% 0 0 75,500 1.26 3,050 75,500 1.26 3,050 38,500 1.43 1,770 Subika Underground 100.0% 0 0 0 0.00 0 0 0.00 0 8,500 4.66 1,280 Total Ahafo 100.0% 0 0 75,500 1.26 3,050 75,500 1.26 3,050 47,000 2.02 3,050 Akyem, Ghana 100.0% 0 0 12,000 0.55 <strong>21</strong>0 12,000 0.55 <strong>21</strong>0 3,100 1.01 100 Total Africa 0 0 87,500 1.16 3,260 87,500 1.16 3,260 50,100 1.96 3,150 TOTAL NEWMONT WORLDWIDE 125,500 0.99 4,000 885,200 0.64 18,330 1,010,700 0.69 22,330 574,900 0.97 17,890 See footnotes in Gold Resources U.S. units table. Deposits/Districts North America Newmont Share Proven Reserves Probable Reserves Proven + Probable Reserves Proven + Probable Reserve Tonnage Grade Copper Tonnage Grade Copper Tonnage Grade Copper Metallurgical Tonnage Grade Copper (x1000 tons) Attributable Copper Reserves (1) U.S. Units December 31, 2012 (Cu%) (million pounds) (x1000 tons) (Cu%) (million pounds) (x1000 tons) (Cu%) (million pounds) Recovery (x1000 tons) December 31, 2011 Phoenix, Nevada 100% 22,700 0.15% 70 420,500 0.15% 1,220 443,200 0.15% 1,290 61% 450,300 0.15% 1,300 Phoenix Copper Leach, Nevada (2) 100% 0 0 177,100 0.24% 850 177,100 0.24% 850 58% 170,200 0.22% 740 TOTAL NORTH AMERICA 22,700 0.15% 70 597,600 0.17% 2,070 620,300 0.17% 2,140 59% 620,500 0.16% 2,040 South America Conga, Peru (3) 51.35% 0 0 303,400 0.28% 1,690 303,400 0.28% 1,690 85% 303,400 0.28% 1,690 TOTAL SOUTH AMERICA 0 0 303,400 0.28% 1,690 303,400 0.28% 1,690 85% 303,400 0.28% 1,690 Asia Pacific 48.5% 131,300 0.51% 1,340 166,600 0.36% 1,220 297,900 0.43% 2,560 75% 323,700 0.41% 2,670 Batu Hijau Batu Hijau Stockpiles (4)(5) 48.5% 0 0 140,600 0.33% 940 140,600 0.33% 940 59% 156,900 0.34% 1,060 Batu Hijau, Indonesia 48.5% 131,300 0.51% 1,340 307,200 0.35% 2,160 438,500 0.40% 3,500 71% 480,600 0.39% 3,730 Boddington 100% 117,100 0.10% 230 813,400 0.11% 1,840 930,500 0.11% 2,070 83% 1,053,500 0.11% 2,260 Boddington Stockpiles (5) 100% 32,000 0.10% 60 31,800 0.07% 50 63,800 0.08% 110 83% Boddington, Western Australia 100% 149,100 0.29% 290 845,200 0.18% 1,890 994,300 0.20% 2,180 83% 1,053,500 0.11% 2,260 TOTAL ASIA PACIFIC 280,400 0.29% 1,630 1,152,400 0.18% 4,050 1,432,800 0.20% 5,680 75% 1,534,100 0.20% 5,990 TOTAL NEWMONT WORLDWIDE 303,100 0.28% 1,700 2,053,400 0.19% 7,810 2,356,500 0.20% 9,510 73% 2,458,000 0.20% 9,720 (1) Reserves are calculated at US$3.25 or A$3.25 per pound copper price unless otherwise noted. 2011 reserves were calculated at US$3.00 or A$3.15 per pound copper price unless otherwise noted. Tonnage amounts have been rounded to the nearest 100,000 and pounds have been rounded to the nearest 10 million. (2) Project is under development. Leach reserves are within Phoenix Reserve Pit. (3) Project is under development. (4) Percentage reflects Newmont's economic interest at December 31, 2012. (5) Stockpiles are comprised primarily of material that has been set aside to allow processing of higher grade material. Stockpiles increase or decrease depending on current mine plans. Stockpiles are reported separately where tonnage or contained metal are greater than 5% of the total site reported reserves. (Cu%) (million pounds) Page 7 of 11