February 21, 2013 - InfoMine
February 21, 2013 - InfoMine
February 21, 2013 - InfoMine

Create successful ePaper yourself
Turn your PDF publications into a flip-book with our unique Google optimized e-Paper software.
Million Ounces<br />
Billion Pounds<br />
Newmont Mining Corporation<br />
6363 South Fiddler‟s Green Circle, Suite 800<br />
Greenwood Village, CO<br />
T: 303.863.7414<br />
F: 303.837.5837<br />
www.newmont.com<br />
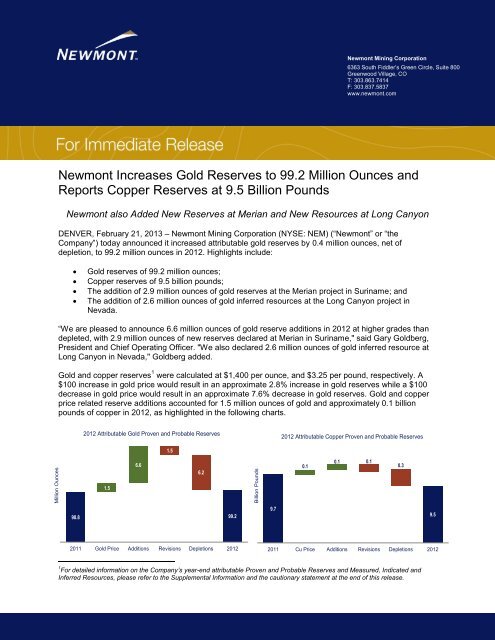
Newmont Increases Gold Reserves to 99.2 Million Ounces and<br />
Reports Copper Reserves at 9.5 Billion Pounds<br />
Newmont also Added New Reserves at Merian and New Resources at Long Canyon<br />
DENVER, <strong>February</strong> <strong>21</strong>, <strong>2013</strong> – Newmont Mining Corporation (NYSE: NEM) (“Newmont” or “the<br />
Company”) today announced it increased attributable gold reserves by 0.4 million ounces, net of<br />
depletion, to 99.2 million ounces in 2012. Highlights include:<br />
<br />
<br />
<br />
<br />
Gold reserves of 99.2 million ounces;<br />
Copper reserves of 9.5 billion pounds;<br />
The addition of 2.9 million ounces of gold reserves at the Merian project in Suriname; and<br />
The addition of 2.6 million ounces of gold inferred resources at the Long Canyon project in<br />
Nevada.<br />
“We are pleased to announce 6.6 million ounces of gold reserve additions in 2012 at higher grades than<br />
depleted, with 2.9 million ounces of new reserves declared at Merian in Suriname," said Gary Goldberg,<br />
President and Chief Operating Officer. "We also declared 2.6 million ounces of gold inferred resource at<br />
Long Canyon in Nevada," Goldberg added.<br />
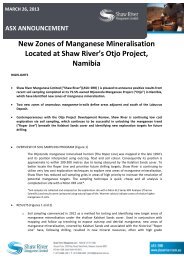
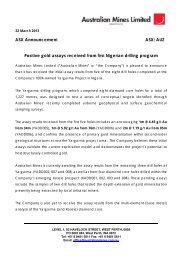
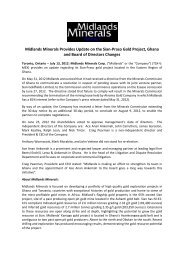
Gold and copper reserves 1 were calculated at $1,400 per ounce, and $3.25 per pound, respectively. A<br />
$100 increase in gold price would result in an approximate 2.8% increase in gold reserves while a $100<br />
decrease in gold price would result in an approximate 7.6% decrease in gold reserves. Gold and copper<br />
price related reserve additions accounted for 1.5 million ounces of gold and approximately 0.1 billion<br />
pounds of copper in 2012, as highlighted in the following charts.<br />
2012 Attributable Gold Proven and Probable Reserves<br />
2012 Attributable Copper Proven and Probable Reserves<br />
1.5<br />
6.6<br />
6.2<br />
0.1<br />
0.1 0.1<br />
0.3<br />
1.5<br />
105.4<br />
98.8 98.8<br />
100.3<br />
99.2 99.2<br />
9.7 9.7<br />
9.8 9.8<br />
9.5 9.5<br />
2011 Gold Price Additions Revisions Depletions 2012<br />
2011 Cu Price Additions Revisions Depletions 2012<br />
1 For detailed information on the Company’s year-end attributable Proven and Probable Reserves and Measured, Indicated and<br />
Inferred Resources, please refer to the Supplemental Information and the cautionary statement at the end of this release.
Attributable measured and indicated gold resources for 2012 were 22.3 million ounces. In addition,<br />
attributable inferred gold resources were 17.9 million ounces. Attributable measured and indicated<br />
copper resources for 2012 were 2.2 billion pounds. In addition, attributable inferred copper resources<br />
were 970 million pounds. Gold and copper resources were calculated using prices of $1,600 per ounce<br />
and $3.50 per pound, respectively.<br />
Newmont Mining Corporation<br />
6363 South Fiddlers Green Circle<br />
Greenwood Village, CO 80111<br />
T 303.863.7414<br />
F 303.837.5837<br />
www.newmont.com<br />
Attributable proven and probable silver reserves for 2012 were 186 million ounces. Attributable<br />
measured and indicated silver resources for 2012 were 53 million ounces, with additional inferred silver<br />
resources of 35 million ounces. Silver reserves and resources were calculated using prices of $30 and<br />
$35 per ounce, respectively.<br />
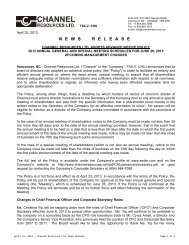
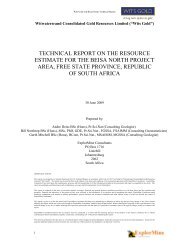
Exploration: <strong>2013</strong> Planned Activity<br />
Newmont‟s <strong>2013</strong> attributable exploration budget is $249 million, with over 40% allocated to North<br />
America, and the balance split between Asia Pacific, Africa, South America, and other strategic programs,<br />
as shown in the chart below. Of the total attributable exploration budget, approximately three quarters is<br />
expected to be focused on brownfields exploration activity, with the balance targeted on greenfields<br />
programs.<br />
2012 Actual (US $M)- $331M<br />
<strong>2013</strong> Budget (US $M)- $249M<br />
$63<br />
(19%)<br />
$55<br />
(17%)<br />
$33 2<br />
(13%)<br />
$36<br />
(15%)<br />
$137<br />
(41%)<br />
$76<br />
(23%)<br />
$36<br />
(14%)<br />
$104<br />
(42%)<br />
$40<br />
(16%)<br />
2 <strong>2013</strong> Opportunity Fund budget to be allocated regionally to the highest ranking projects identified throughout the course of the year,<br />
consistent with prior year practice.<br />
Page 2 of 11
Reserve and Resource Tables<br />
Newmont Mining Corporation<br />
6363 South Fiddlers Green Circle<br />
Proven and Probable reserves are based on extensive drilling, sampling, mine modeling and metallurgical Greenwood testing Village, from which CO 80111 we<br />
determined economic feasibility. Metal price assumptions follow SEC guidance not to exceed a three T year 303.863.7414 trailing average. The<br />
F 303.837.5837<br />
price sensitivity of reserves depends upon several factors including grade, metallurgical recovery, operating cost, waste-to-ore ratio<br />
www.newmont.com<br />
and ore type. Metallurgical recovery rates vary depending on the metallurgical properties of each deposit and the production<br />
process used. The reserve tables included in this release list the average metallurgical recovery rate for each deposit, which takes<br />
into account the relevant processing methods. The cut-off grade, or lowest grade of mineralized material considered economic to<br />
process, varies with material type, price, metallurgical recoveries, operating costs and co- or by-product credits. The Proven and<br />
Probable reserve figures presented herein are estimates based on information available at the time of calculation. No assurance can<br />
be given that the indicated levels of recovery of gold and copper will be realized. Ounces of gold and silver or pounds of copper<br />
included in the proven and probable reserves are calculated without regard to any losses during metallurgical treatment. Reserve<br />
estimates may require revision based on actual production. Market fluctuations in the price of gold and copper, as well as increased<br />
production costs or reduced metallurgical recovery rates, could render certain proven and probable reserves containing relatively<br />
lower grades of mineralization uneconomic to exploit and might result in a reduction of reserves.<br />
The Measured, Indicated, and Inferred resource figures presented herein are estimates based on information available at the time of<br />
calculation and are exclusive of reserves. A „Mineral Resource‟ is a concentration or occurrence of solid material of economic<br />
interest in or on the Earth‟s crust in such form, grade or quality and quantity that there are reasonable prospects for eventual<br />
economic extraction. The location, quantity, grade or quality, continuity and other geological characteristics of a Mineral Resource<br />
are known, estimated or interpreted from specific geological evidence and knowledge, including sampling. Mineral Resources are<br />
sub-divided, in order of increasing geological confidence, into Inferred, Indicated and Measured categories. Ounces of gold and<br />
silver or pounds of copper included in the Measured, Indicated and Inferred resources are calculated without regard to any losses<br />
during metallurgical treatment. Market fluctuations in the price of gold and copper, as well as increased production costs or reduced<br />
metallurgical recovery rates, could change future estimates of resources.<br />
We publish reserves and resources annually, and will recalculate reserves and resources at December 31, <strong>2013</strong>, taking into account<br />
metal prices, changes, if any, in future production and capital costs, divestments and depletion as well as any acquisitions and<br />
additions during <strong>2013</strong>.<br />
Page 3 of 11
Attributable Proven, Probable, and Combined Gold Reserves (1), U.S Newmont Units Mining Corporation<br />
December 31, 2012<br />
6363 South Fiddlers December Green 31, Circle 2011<br />
Proven and Probable Metallurgical Greenwood Village, CO 80111<br />
Proven Reserves<br />
Probable Reserves<br />
Proven + Probable Reserves<br />
Reserves T Recovery 303.863.7414<br />
Deposits/Districts by Reporting Unit<br />
Newmont<br />
F 303.837.5837<br />
Tonnage Grade Gold Tonnage Grade Gold Tonnage Grade Gold Grade Gold<br />
Share<br />
Tonnage<br />
www.newmont.com<br />
(x1000 tons) (oz/ton) (x1000 ozs) (x1000 tons) (oz/ton) (x1000 ozs) (x1000 tons) (oz/ton) (x1000 ozs) (x1000 tons) (oz/ton) (x1000 ozs)<br />
North America<br />
Carlin Open Pits, Nevada 100% 82,100 0.059 4,810 231,100 0.030 6,840 313,200 0.037 11,650 74% 331,700 0.038 12,620<br />
Carlin Underground, Nevada 100% 14,500 0.252 3,650 9,000 0.285 2,580 23,500 0.265 6,230 86% 18,000 0.282 5,090<br />
Midas, Nevada 100% 200 0.191 30 400 0.055 20 600 0.095 50 90% 800 0.226 160<br />
Phoenix, Nevada 100% 22,700 0.019 440 417,200 0.017 6,990 439,900 0.017 7,430 73% 447,100 0.016 7,250<br />
Twin Creeks, Nevada 100% 7,100 0.101 720 51,200 0.052 2,680 58,300 0.058 3,400 80% 48,300 0.078 3,780<br />
Turquoise Ridge, Nevada (2) 25% 2,200 0.396 860 2,900 0.370 1,080 5,100 0.381 1,940 92% 4,000 0.442 1,760<br />
Nevada In-Process (3) 100% 25,500 0.018 450 0 0 25,500 0.018 450 64% 23,000 0.020 460<br />
Nevada Stockpiles (4) 100% 68,900 0.055 3,830 3,400 0.026 90 72,300 0.054 3,920 75% 68,200 0.052 3,530<br />
Total Nevada 223,200 0.066 14,790 715,200 0.028 20,280 938,400 0.037 35,070 77% 941,100 0.037 34,650<br />
La Herradura, Mexico 44% 85,500 0.017 1,470 72,600 0.016 1,140 158,100 0.017 2,610 67% 111,400 0.0<strong>21</strong> 2,330<br />
TOTAL NORTH AMERICA 308,700 0.053 16,260 787,800 0.027 <strong>21</strong>,420 1,096,500 0.034 37,680 77% 1,052,500 0.035 36,980<br />
South America<br />
Conga, Peru (5) 51.35% 0 0 303,400 0.0<strong>21</strong> 6,460 303,400 0.0<strong>21</strong> 6,460 75% 303,400 0.0<strong>21</strong> 6,460<br />
Yanacocha Open Pits (6) 51.35% 23,000 0.057 1,310 73,400 0.014 1,050 96,400 0.024 2,360 73% 119,900 0.030 3,570<br />
Yanacocha In-Process (3) 51.35% 8,600 0.026 220 0 0 8,600 0.026 220 78% 15,200 0.025 390<br />
Yanacocha Stockpiles (4) 51.35% 8,400 0.054 460 0 0 8,400 0.054 460 60% Not Disclosed in 2011<br />
Total Yanacocha, Peru 51.35% 40,000 0.050 1,990 73,400 0.014 1,050 113,400 0.027 3,040 72% 135,100 0.029 3,960<br />
La Zanja, Peru (7) 46.94% 1,700 0.0<strong>21</strong> 40 10,800 0.017 190 12,500 0.018 230 66% <strong>21</strong>,400 0.016 330<br />
Merian, Suriname (8) 80% 0 0 79,800 0.036 2,850 79,800 0.036 2,850 93%<br />
TOTAL SOUTH AMERICA 41,700 0.048 2,030 467,400 0.023 10,550 509,100 0.025 12,580 78% 459,900 0.023 10,750<br />
Asia Pacific<br />
Batu Hijau Open Pit (9) 48.5% 131,300 0.017 2,170 166,600 0.006 940 297,900 0.010 3,110 76% 323,700 0.010 3,150<br />
Batu Hijau Stockpiles (4)(5)(9) 48.5% 0 0 140,600 0.003 440 140,600 0.003 440 70% 156,900 0.003 490<br />
Total Batu Hijau, Indonesia 48.5% 131,300 0.017 2,170 307,200 0.004 1,380 438,500 0.008 3,550 76% 480,600 0.008 3,640<br />
Boddington, Western Australia 100% 117,100 0.020 2,390 813,400 0.019 15,270 930,500 0.019 17,660 81% 1,053,500 0.019 19,490<br />
Boddington Stockpiles 100% 32,000 0.017 540 31,800 0.013 400 63,800 0.015 940 81% 0 0<br />
Total Boddington, Western Australia 100% 149,100 0.020 2,930 845,200 0.019 15,670 994,300 0.019 18,600 81% 1,053,500 0.019 19,490<br />
Duketon, Western Australia (10) 19.75% 1,500 0.044 70 11,100 0.045 500 12,600 0.045 570 95% 10,800 0.045 490<br />
Jundee, Western Australia 100% 2,300 0.090 <strong>21</strong>0 1,600 0.188 300 3,900 0.130 510 91% 3,800 0.174 650<br />
Kalgoorlie Open Pit and Underground 50% 11,700 0.059 690 38,700 0.056 2,180 50,400 0.057 2,870 85% 55,000 0.057 3,140<br />
Kalgoorlie Stockpiles (4)(5) 50% 57,900 0.023 1,330 0 0 57,900 0.023 1,330 83% 53,900 0.023 1,260<br />
Total Kalgoorlie, Western Australia 50% 69,600 0.029 2,020 38,700 0.056 2,180 108,300 0.039 4,200 84% 108,900 0.040 4,400<br />
Tanami, Northern Territory 100% 5,000 0.174 860 8,900 0.153 1,360 13,900 0.161 2,220 95% 16,700 0.152 2,520<br />
Waihi, New Zealand 100% 100 0.175 20 2,900 0.097 280 3,000 0.101 300 89% 3,200 0.112 360<br />
TOTAL ASIA PACIFIC 358,900 0.023 8,280 1,<strong>21</strong>5,600 0.018 <strong>21</strong>,670 1,574,500 0.019 29,950 82% 1,677,500 0.019 31,550<br />
Africa<br />
Ahafo Open Pits (11) 100% 0 0 183,100 0.055 10,150 183,100 0.055 10,150 88% 194,700 0.055 10,790<br />
Ahafo Underground (12) 100% 0 0.000 0 4,900 0.13 630 4,900 0.129 630 92% 5,900 0.112 660<br />
Ahafo Stockpiles (4) 100% 27,200 0.030 800 0 0 27,200 0.030 800 86% <strong>21</strong>,000 0.030 630<br />
Total Ahafo, Ghana 100% 27,200 0.030 800 188,000 0.057 10,780 <strong>21</strong>5,200 0.054 11,580 88% 2<strong>21</strong>,600 0.055 12,080<br />
Akyem, Ghana (13) 100% 300 0.097 20 144,300 0.051 7,360 144,600 0.051 7,380 88% 144,500 0.051 7,390<br />
TOTAL AFRICA 27,500 0.030 820 332,300 0.055 18,140 359,800 0.053 18,960 88% 366,100 0.053 19,470<br />
TOTAL NEWMONT WORLDWIDE 736,800 0.037 27,390 2,803,100 0.026 71,780 3,539,900 0.028 99,170 81% 3,556,000 0.028 98,750<br />
(1)<br />
Reserves are calculated at a a gold price of US$1,400, A$1,400, or NZ$1,800 per ounce unless otherwise noted. 2011 reserves were calculated at a gold price of US$1,200, A$1,250, or<br />
NZ$1,600 per ounce unless otherwise noted. Tonnage amounts have been rounded to the nearest 100,000 unless they are less than 50,000, and gold ounces have been rounded to the<br />
nearest 10,000.<br />
(2) Reserve estimates provided by Barrick, the operator of the Turquoise Ridge Joint Venture.<br />
(3) In-process material is the material on leach pads at the end of each year from which gold remains to be recovered. In-process material reserves are reported separately where tonnage<br />
or contained ounces are greater than 5% of the total site-reported reserves and contained ounces are greater than 100,000.<br />
(4) Stockpiles are comprised primarily of material that has been set aside to allow processing of higher grade material in the mills. Stockpiles increase or decrease depending on current<br />
mine plans. Stockpile reserves are reported separately where tonnage or contained ounces are greater than 5% of the total site-reported reserves and contained ounces are greater<br />
(5) Project is under development.<br />
(6) Reserves include the currently undeveloped deposit at La Quinua Sur and Marleny, which contains reserves of 0.5 million attributable ounces.<br />
(7) Reserves estimates were provided by Buenaventura, the operator of the La Zanja project.<br />
(8) Project has completed Feasibility and awaits construction decision. Percentage reflects Newmont’s economic interest at the time of Reserve declaration. Mineral agreement with the<br />
Government of Suriname allows the government to purchase up to 25% interest in the project within 60 days after exploitation license is issued, which is expected in early <strong>2013</strong>.<br />
(9) Percentage reflects Newmont’s economic interest as of December 31, 2012.<br />
(10) Reserve estimates provided by Regis Resources Ltd, in which Newmont holds a 19.75% interest.<br />
(11) Includes undeveloped reserves at Yamfo South, Yamfo Central, Techire West, Subenso South, Subenso North, Yamfo Northeast, and Susuan totaling 3.2 million ounces.<br />
(12) Subika Underground project is under development.<br />
(13) Project is under development.<br />
Page 4 of 11
Deposits/Districts by Reporting Unit<br />
Attributable Proven, Probable, and Combined Gold Reserves (1) , Metric Newmont Units Mining Corporation<br />
December 31, 2012<br />
6363 South December Fiddlers Green 31, 2011 Circle<br />
Proven Reserves<br />
Probable Reserves<br />
Proven and Probable Metallurgical Greenwood Village, CO 80111<br />
Proven + Probable Reserves<br />
Reserves<br />
Recovery T 303.863.7414<br />
Newmont<br />
F 303.837.5837<br />
Tonnage Tonnage Grade Gold Tonnage Grade Gold Tonnage Grade Gold Grade Gold<br />
Share<br />
www.newmont.com<br />
(x1000 tonnes) (g/tonne) (x1000 ozs) (x1000 tonnes) (g/tonne) (x1000 ozs) (x1000 tonnes) (g/tonne) (x1000 ozs) (x1000 tonnes) (g/tonne) (x1000 ozs)<br />
North America<br />
Carlin Open Pits, Nevada 100% 74,500 2.01 4,810 209,700 1.01 6,840 284,200 1.28 11,650 74% 300,900 1.30 12,620<br />
Carlin Underground, Nevada 100% 13,100 8.66 3,650 8,200 9.78 2,580 <strong>21</strong>,300 9.09 6,230 86% 16,400 9.66 5,090<br />
Midas, Nevada 100% 100 6.54 30 400 1.90 20 500 3.25 50 90% 700 7.76 160<br />
Phoenix, Nevada 100% 20,600 0.66 440 378,400 0.57 6,990 399,000 0.58 7,430 73% 405,700 0.56 7,250<br />
Twin Creeks, Nevada 100% 6,400 3.47 720 46,500 1.79 2,680 52,900 2.00 3,400 80% 43,800 2.69 3,780<br />
Turquoise Ridge, Nevada (2) 25% 2,000 13.59 860 2,700 12.68 1,080 4,700 13.07 1,940 92% 3,600 15.14 1,760<br />
Nevada In-Process (3) 100% 23,200 0.61 450 0 0 23,200 0.61 450 64% 20,800 0.69 460<br />
Nevada Stockpiles (4) 100% 62,500 1.90 3,830 3,000 0.91 90 65,500 1.86 3,920 75% 61,900 1.77 3,530<br />
Total Nevada 202,400 2.27 14,790 648,900 0.97 20,280 851,300 1.28 35,070 77% 853,800 1.26 34,650<br />
La Herradura, Mexico 44% 77,500 0.59 1,470 65,900 0.54 1,140 143,400 0.57 2,610 67% 101,100 0.72 2,330<br />
TOTAL NORTH AMERICA 279,900 1.81 16,260 714,800 0.93 <strong>21</strong>,420 994,700 1.18 37,680 77% 954,900 1.20 36,980<br />
South America<br />
Conga, Peru (5) 51.35% 0 0 275,200 0.73 6,460 275,200 0.73 6,460 75% 275,200 0.73 6,460<br />
Yanacocha Open Pits (6) 51.35% 20,900 1.95 1,310 66,600 0.49 1,050 87,500 0.84 2,360 73% 108,800 1.02 3,570<br />
Yanacocha In-Process (3) 51.35% 7,800 0.88 220 0 0 7,800 0.88 220 78% 13,800 0.87 390<br />
Yanacocha Stockpiles (4) 51.35% 7,600 1.86 460 0 0 7,600 1.86 460 60% Not Disclosed in 2011<br />
Total Yanacocha, Peru 51.35% 36,300 1.70 1,990 66,600 0.49 1,050 102,900 0.92 3,040 72% 122,600 1.00 3,960<br />
La Zanja, Peru (7) 46.94% 1,600 0.71 40 9,800 0.60 190 11,400 0.61 230 66% 19,400 0.54 330<br />
Merian, Suriname (8) 80% 0 0 72,400 1.22 2,850 72,400 1.22 2,850 93% 0 0<br />
TOTAL SOUTH AMERICA 37,900 1.66 2,030 424,000 0.77 10,550 461,900 0.85 12,580 78% 417,200 0.80 10,750<br />
Asia Pacific<br />
Batu Hijau Open Pit (9) 48.5% 119,100 0.57 2,170 151,100 0.19 940 270,200 0.36 3,110 76% 293,600 0.33 3,150<br />
Batu Hijau Stockpiles (5)(9) 48.5% 0 0 127,600 0.11 440 127,600 0.11 440 70% 142,400 0.11 490<br />
Total Batu Hijau, Indonesia 48.5% 119,100 0.57 2,170 278,700 0.15 1,380 397,800 0.28 3,550 76% 436,000 0.26 3,640<br />
Boddington, Western Australia 100% 106,200 0.70 2,390 737,900 0.64 15,270 844,100 0.65 17,660 81% 955,700 0.63 19,490<br />
Boddington Stockpiles 100% 29,000 0.58 540 28,800 0.43 400 57,800 0.50 940 81% Not Disclosed in 2011<br />
Total Boddington, Western Australia 100% 135,200 0.67 2,930 766,700 0.64 15,670 901,900 0.64 18,600 81% 955,700 0.80 19,490<br />
Duketon, Western Australia (10) 19.75% 1,400 1.51 70 10,100 1.53 500 11,500 1.53 570 95% 9,800 1.54 490<br />
Jundee, Western Australia 100% 2,100 3.10 <strong>21</strong>0 1,500 6.43 300 3,600 4.46 510 91% 3,400 5.95 650<br />
Kalgoorlie Open Pit and Underground 50% 10,600 2.02 690 35,100 1.93 2,180 45,700 1.95 2,870 85% 49,900 1.96 3,140<br />
Kalgoorlie Stockpiles (5) 50% 52,500 0.79 1,330 0 0 52,500 0.79 1,330 83% 48,900 0.80 1,260<br />
Total Kalgoorlie, Western Australia 50% 63,100 1.00 2,020 35,100 1.93 2,180 98,200 1.33 4,200 84% 98,800 1.38 4,400<br />
Tanami, Northern Territory 100% 4,500 5.97 860 8,100 5.25 1,360 12,600 5.51 2,220 95% 15,100 5.20 2,520<br />
Waihi, New Zealand 100% 100 6.01 20 2,600 3.34 280 2,700 3.45 300 89% 2,900 3.85 360<br />
TOTAL ASIA PACIFIC 325,500 0.79 8,280 1,102,800 0.61 <strong>21</strong>,670 1,428,300 0.65 29,950 82% 1,5<strong>21</strong>,700 0.65 31,550<br />
Africa<br />
Ahafo Open Pits (11) 100% 0 0 166,100 1.90 10,150 166,100 1.90 10,150 88% 176,600 1.90 10,790<br />
Ahafo Underground (12) 100% 0 0 4,400 4.43 630 4,400 4.43 630 92% 5,300 3.82 660<br />
Ahafo Stockpiles (4) 100% 24,700 1.01 800 0 0 24,700 1.01 800 86% 19,100 1.03 630<br />
Total Ahafo, Ghana 100% 24,700 1.01 800 170,500 1.97 10,780 195,200 1.85 11,580 88% 201,000 1.87 12,080<br />
Akyem, Ghana (13) 100% 200 3.33 20 130,900 1.75 7,360 131,100 1.75 7,380 88% 131,100 1.75 7,390<br />
TOTAL AFRICA 24,900 1.03 820 301,400 1.87 18,140 326,300 1.81 18,960 88% 332,100 1.82 19,470<br />
TOTAL NEWMONT WORLDWIDE 668,200 1.27 27,390 2,543,000 0.88 71,780 3,<strong>21</strong>1,200 0.96 99,170 81% 3,225,900 0.95 98,750<br />
See Footnotes under Gold Reserves U.S. units table.<br />
Page 5 of 11
North America<br />
Attributable Gold Mineral Resources (1)(2) - December 31, 2012, U.S. Units<br />
Deposits/Districts<br />
Newmont Share<br />
Gold Measured<br />
Resource<br />
Gold Indicated<br />
Resource<br />
Newmont Mining Corporation<br />
6363 South Fiddlers Green Circle<br />
Gold Measured +<br />
Greenwood Village, CO 80111<br />
Indicated Resource<br />
T 303.863.7414<br />
(3) Gold Inferred Resource<br />
F 303.837.5837<br />
www.newmont.com<br />
Tonnage Grade Au Tonnage Grade Au Tonnage Grade Au Tonnage Grade Au<br />
(x1000 tons) (oz/ton) (x1000 ozs) (x1000 tons) (oz/ton) (x1000 ozs) (x1000 tons) (oz/ton) (x1000 ozs) (x1000 tons) (oz/ton) (x1000 ozs)<br />
Buffalo Valley, Nevada 70% 0 0 17,900 0.018 330 17,900 0.018 330 600 0.010 10<br />
Carlin Trend Open Pit, Nevada 100% 26,200 0.036 940 62,700 0.023 1,430 88,900 0.027 2,370 18,900 0.018 350<br />
Carlin Trend Underground, Nevada 100% 500 0.148 70 800 0.199 170 1,300 0.180 240 4,000 0.26 1,020<br />
Lone Tree Complex, Nevada 100% 0 0 2,200 0.023 50 2,200 0.023 50 5,000 0.016 80<br />
Long Canyon, Nevada 100% 0 0 0 0 0 0 27,900 0.094 2,630<br />
Midas, Nevada 100% 0 0.149 0 100 0.039 0 100 0.056 0 300 0.07 20<br />
Phoenix, Nevada 100% 6,300 0.015 90 191,800 0.013 2,430 198,100 0.013 2,520 117,200 0.012 1,390<br />
Sandman, Nevada 100% 0 0 1,300 0.036 50 1,300 0.036 50 1,100 0.063 70<br />
Turquoise Ridge, Nevada (4) 25% 500 0.365 200 500 0.328 160 1,000 0.347 360 900 0.42 380<br />
Twin Creeks, Nevada 100% 5,100 0.070 350 36,800 0.058 2,120 41,900 0.059 2,470 3,900 0.061 240<br />
Nevada Stockpiles, Nevada (5) 100% 5,800 0.037 <strong>21</strong>0 0 0 5,800 0.037 <strong>21</strong>0 2,300 0.043 100<br />
Total Nevada 44,400 0.042 1,860 314,100 0.0<strong>21</strong> 6,740 358,500 0.024 8,600 182,100 0.034 6,290<br />
La Herradura, Mexico 44% 30,600 0.020 610 39,900 0.017 670 70,500 0.018 1,280 59,400 0.016 940<br />
Total North America 75,000 0.033 2,470 354,000 0.0<strong>21</strong> 7,410 429,000 0.023 9,880 241,500 0.030 7,230<br />
South America<br />
Conga, Peru 51.35% 0 0.000 0 89,300 0.012 1,030 89,300 0.012 1,030 130,500 0.011 1,480<br />
Yanacocha, Peru 51.35% 13,000 0.040 520 24,400 0.016 400 37,400 0.025 920 93,800 0.025 2,360<br />
La Zanja, Peru (6) 46.94% 0 0.006 0 400 0.007 0 400 0.007 0 2,800 0.017 50<br />
Merian, Suriname 80% 0 0 4,100 0.056 230 4,100 0.056 230 30,000 0.030 910<br />
Total South America 13,000 0.040 520 118,200 0.014 1,660 131,200 0.017 2,180 257,100 0.019 4,800<br />
Asia Pacific<br />
Batu Hijau, Indonesia (7) 48.5% 8,100 0.018 150 141,300 0.007 1,040 149,400 0.008 1,190 27,600 0.002 50<br />
Boddington, Western Australia 100% 35,500 0.015 540 225,900 0.013 3,010 261,400 0.014 3,550 15,600 0.015 240<br />
Duketon, Western Australia (8) 19.75% 700 0.016 10 10,200 0.023 240 10,900 0.023 250 24,200 0.026 640<br />
Jundee, Western Australia 100% 0 0 300 0.108 30 300 0.108 30 500 0.138 70<br />
Kalgoorlie, Western Australia 50% 5,300 0.038 200 15,900 0.034 540 <strong>21</strong>,200 0.035 740 400 0.076 30<br />
McPhilliamys, New South Wales (8) 19.75% 0 0 9,000 0.037 330 9,000 0.037 330 3,500 0.046 160<br />
Tanami, Northern Territories 100% 900 0.129 110 2,800 0.116 330 3,700 0.119 440 7,100 0.193 1,370<br />
Waihi, New Zealand 100% 0 0 1,800 0.267 480 1,800 0.267 480 800 0.192 150<br />
Total Asia Pacific 50,500 0.020 1,010 407,200 0.015 6,000 457,700 0.015 7,010 79,700 0.034 2,710<br />
Africa<br />
Ahafo, Ghana 100.0% 0 0 83,200 0.037 3,050 83,200 0.037 3,050 42,500 0.042 1,770<br />
Subika Underground 100.0% 0 0 0 0.000 0 0 0.000 0 9,400 0.136 1,280<br />
Total Ahafo 100.0% 0 0 83,200 0.037 3,050 83,200 0.037 3,050 51,900 0.059 3,050<br />
Akyem, Ghana 100.0% 0 0 13,300 0.016 <strong>21</strong>0 13,300 0.016 <strong>21</strong>0 3,400 0.030 100<br />
Total Africa 0 0 96,500 0.034 3,260 96,500 0.034 3,260 55,300 0.057 3,150<br />
TOTAL NEWMONT WORLDWIDE 138,500 0.029 4,000 975,900 0.019 18,330 1,114,400 0.020 22,330 633,600 0.028 17,890<br />
(1)<br />
Resources are reported exclusive of reserves.<br />
(2)<br />
Resources calculated at a gold price of US$1,600 or A$1,600 per ounce unless otherwise noted. 2011 Resources were calculated at a gold<br />
price of US$1,400 or A$1,475 per ounce. Tonnage amounts have been rounded to the nearest 100,000 and pounds have been rounded to the<br />
nearest 10 thousand.<br />
(3)<br />
Measured and Indicated combined Resources are equivalent to Mineralized Material disclosed in Newmont's 10K filing.<br />
(4)<br />
Resource estimates provided by Barrick, the operator of the Turquoise Ridge joint venture.<br />
(5)<br />
Stockpiles are comprised primarily of material that has been set aside to allow processing of higher grade material in the mills.<br />
(6)<br />
Reserve estimates provided by Buenaventura, the operator of the La Zanja project.<br />
(7)<br />
Percentage reflects Newmont’s economic interest at December 31, 2012.<br />
(8)<br />
Resource estimates provided by Regis Resources Ltd, in which Newmont holds a 19.75% interest.<br />
Page 6 of 11
North America<br />
Attributable Gold Mineral Resources (1)(2) - December 31, 2012, Metric units<br />
Deposits/Districts<br />
Newmont Share<br />
Gold Measured Resource<br />
Gold Indicated Resource<br />
Newmont Mining Corporation<br />
Gold Measured 6363 + South Fiddlers Green Circle<br />
Greenwood Village, CO 80111<br />
Indicated Resource (3) Gold Inferred Resource<br />
T 303.863.7414<br />
F 303.837.5837<br />
www.newmont.com<br />
Tonnage Grade Au Tonnage Grade Au Tonnage Grade Au Tonnage Grade Au<br />
(x1000 tonnes) (g/tonne) (x1000 ozs) (x1000 tonnes) (g/tonne) (x1000 ozs) (x1000 tonnes) (g/tonne) (x1000 ozs) (x1000 tonnes) (g/tonne) (x1000 ozs)<br />
Buffalo Valley, Nevada 70% 0 0 16,200 0.63 330 16,200 0.63 330 500 0.35 10<br />
Carlin Trend Open Pit, Nevada 100% 23,800 1.22 940 56,900 0.78 1,430 80,700 0.91 2,370 17,100 0.63 350<br />
Carlin Trend Underground, Nevada 100% 400 5.07 70 800 6.82 170 1,200 6.19 240 3,600 8.75 1,020<br />
Lone Tree Complex, Nevada 100% 0 0 2,000 0.79 50 2,000 0.79 50 4,600 0.55 80<br />
Long Canyon, Nevada 100% 0 0 0 0 0 0 25,400 3.22 2,630<br />
Midas, Nevada 100% 0 5.10 0 100 1.35 0 100 1.93 0 300 2.27 20<br />
Phoenix, Nevada 100% 5,700 0.50 90 174,000 0.43 2,430 179,700 0.44 2,520 106,300 0.41 1,390<br />
Sandman, Nevada 100% 0 0 1,200 1.23 50 1,200 1.23 50 1,000 2.17 70<br />
Turquoise Ridge, Nevada (4) 25% 500 12.51 200 400 11.25 160 900 11.91 360 800 14.28 380<br />
Twin Creeks, Nevada 100% 4,600 2.39 350 33,400 1.98 2,120 38,000 2.03 2,470 3,600 2.10 240<br />
Nevada Stockpiles, Nevada (5) 100% 5,200 1.25 <strong>21</strong>0 0 0 5,200 1.25 <strong>21</strong>0 2,100 1.48 100<br />
Total Nevada 40,200 1.44 1,860 285,000 0.74 6,740 325,200 0.82 8,600 165,300 1.18 6,290<br />
La Herradura, Mexico 44% 27,700 0.69 610 36,200 0.57 670 63,900 0.62 1,280 53,900 0.54 940<br />
Total North America 67,900 1.13 2,470 3<strong>21</strong>,200 0.72 7,410 389,100 0.79 9,880 <strong>21</strong>9,200 1.02 7,230<br />
South America<br />
Conga, Peru 51.35% 0 0.00 0 81,000 0.40 1,030 81,000 0.40 1,030 118,400 0.39 1,480<br />
Yanacocha, Peru 51.35% 11,800 1.38 520 22,100 0.56 400 33,900 0.85 920 85,100 0.86 2,360<br />
La Zanja, Peru (6) 46.94% 0 0.20 0 300 0.23 0 300 0.23 0 2,600 0.58 50<br />
Merian, Suriname 80% 0 0 3,700 1.90 230 3,700 1.90 230 27,200 1.04 910<br />
Total South America 11,800 1.38 520 107,100 0.48 1,660 118,900 0.57 2,180 233,300 0.64 4,800<br />
Asia Pacific<br />
Batu Hijau, Indonesia (7) 48.5% 7,300 0.62 150 128,200 0.25 1,040 135,500 0.27 1,190 25,000 0.07 50<br />
Boddington, Western Australia 100% 32,200 0.52 540 204,900 0.46 3,010 237,100 0.47 3,550 14,200 0.52 240<br />
Duketon, Western Australia (8) 19.75% 700 0.54 10 9,200 0.80 240 9,900 0.78 250 <strong>21</strong>,900 0.91 640<br />
Jundee, Western Australia 100% 0 0 200 3.69 30 200 3.69 30 500 4.74 70<br />
Kalgoorlie, Western Australia 50% 4,800 1.29 200 14,500 1.16 540 19,300 1.19 740 300 2.61 30<br />
McPhilliamys, New South Wales (8) 19.75% 0 0 8,200 1.27 330 8,200 1.27 330 3,200 1.57 160<br />
Tanami, Northern Territories 100% 800 4.41 110 2,600 3.97 330 3,400 4.08 440 6,500 6.61 1,370<br />
Waihi, New Zealand 100% 0 0 1,600 9.14 480 1,600 9.14 480 700 6.57 150<br />
Total Asia Pacific 45,800 0.69 1,010 369,400 0.51 6,000 415,200 0.53 7,010 72,300 1.17 2,710<br />
Africa<br />
Ahafo, Ghana 100.0% 0 0 75,500 1.26 3,050 75,500 1.26 3,050 38,500 1.43 1,770<br />
Subika Underground 100.0% 0 0 0 0.00 0 0 0.00 0 8,500 4.66 1,280<br />
Total Ahafo 100.0% 0 0 75,500 1.26 3,050 75,500 1.26 3,050 47,000 2.02 3,050<br />
Akyem, Ghana 100.0% 0 0 12,000 0.55 <strong>21</strong>0 12,000 0.55 <strong>21</strong>0 3,100 1.01 100<br />
Total Africa 0 0 87,500 1.16 3,260 87,500 1.16 3,260 50,100 1.96 3,150<br />
TOTAL NEWMONT WORLDWIDE 125,500 0.99 4,000 885,200 0.64 18,330 1,010,700 0.69 22,330 574,900 0.97 17,890<br />
See footnotes in Gold Resources U.S. units table.<br />
Deposits/Districts<br />
North America<br />
Newmont<br />
Share<br />
Proven Reserves Probable Reserves<br />
Proven + Probable Reserves Proven + Probable Reserve<br />
Tonnage Grade Copper Tonnage Grade Copper Tonnage Grade Copper Metallurgical Tonnage Grade Copper<br />
(x1000<br />
tons)<br />
Attributable Copper Reserves (1) U.S. Units<br />
December 31, 2012<br />
(Cu%)<br />
(million<br />
pounds)<br />
(x1000<br />
tons)<br />
(Cu%)<br />
(million<br />
pounds)<br />
(x1000<br />
tons)<br />
(Cu%)<br />
(million<br />
pounds)<br />
Recovery (x1000<br />
tons)<br />
December 31, 2011<br />
Phoenix, Nevada 100% 22,700 0.15% 70 420,500 0.15% 1,220 443,200 0.15% 1,290 61% 450,300 0.15% 1,300<br />
Phoenix Copper Leach, Nevada (2) 100% 0 0 177,100 0.24% 850 177,100 0.24% 850 58% 170,200 0.22% 740<br />
TOTAL NORTH AMERICA 22,700 0.15% 70 597,600 0.17% 2,070 620,300 0.17% 2,140 59% 620,500 0.16% 2,040<br />
South America<br />
Conga, Peru (3) 51.35% 0 0 303,400 0.28% 1,690 303,400 0.28% 1,690 85% 303,400 0.28% 1,690<br />
TOTAL SOUTH AMERICA 0 0 303,400 0.28% 1,690 303,400 0.28% 1,690 85% 303,400 0.28% 1,690<br />
Asia Pacific<br />
48.5% 131,300 0.51% 1,340 166,600 0.36% 1,220 297,900 0.43% 2,560 75% 323,700 0.41% 2,670<br />
Batu Hijau<br />
Batu Hijau Stockpiles (4)(5) 48.5% 0 0 140,600 0.33% 940 140,600 0.33% 940 59% 156,900 0.34% 1,060<br />
Batu Hijau, Indonesia 48.5% 131,300 0.51% 1,340 307,200 0.35% 2,160 438,500 0.40% 3,500 71% 480,600 0.39% 3,730<br />
Boddington 100% 117,100 0.10% 230 813,400 0.11% 1,840 930,500 0.11% 2,070 83% 1,053,500 0.11% 2,260<br />
Boddington Stockpiles (5) 100% 32,000 0.10% 60 31,800 0.07% 50 63,800 0.08% 110 83%<br />
Boddington, Western Australia 100% 149,100 0.29% 290 845,200 0.18% 1,890 994,300 0.20% 2,180 83% 1,053,500 0.11% 2,260<br />
TOTAL ASIA PACIFIC 280,400 0.29% 1,630 1,152,400 0.18% 4,050 1,432,800 0.20% 5,680 75% 1,534,100 0.20% 5,990<br />
TOTAL NEWMONT WORLDWIDE 303,100 0.28% 1,700 2,053,400 0.19% 7,810 2,356,500 0.20% 9,510 73% 2,458,000 0.20% 9,720<br />
(1) Reserves are calculated at US$3.25 or A$3.25 per pound copper price unless otherwise noted. 2011 reserves were calculated at US$3.00 or A$3.15 per pound copper price unless otherwise noted.<br />
Tonnage amounts have been rounded to the nearest 100,000 and pounds have been rounded to the nearest 10 million.<br />
(2)<br />
Project is under development. Leach reserves are within Phoenix Reserve Pit.<br />
(3) Project is under development.<br />
(4)<br />
Percentage reflects Newmont's economic interest at December 31, 2012.<br />
(5)<br />
Stockpiles are comprised primarily of material that has been set aside to allow processing of higher grade material. Stockpiles increase or decrease depending on current mine plans. Stockpiles are<br />
reported separately where tonnage or contained metal are greater than 5% of the total site reported reserves.<br />
(Cu%)<br />
(million<br />
pounds)<br />
Page 7 of 11
Deposits/Districts<br />
North America<br />
Newmont<br />
Share<br />
Newmont Mining Corporation<br />
6363 South Fiddlers Green Circle<br />
Greenwood Village, December CO 31, 80111 2011<br />
T 303.863.7414<br />
F 303.837.5837<br />
www.newmont.com<br />
Proven Reserves Probable Reserves<br />
Proven + Probable Reserves Proven + Probable Reserve<br />
Tonnage Grade Copper Tonnage Grade Copper Tonnage Grade Copper Metallurgical Tonnage Grade Copper<br />
(x1000<br />
tonnes)<br />
Attributable Copper Reserves (1) Metric Units<br />
December 31, 2012<br />
(Cu%) (Tonnes) (x1000<br />
tonnes)<br />
(Cu%) (Tonnes) (x1000<br />
tonnes)<br />
(Cu%) (Tonnes) Recovery (x1000<br />
tonnes)<br />
Phoenix, Nevada 100% 20,600 0.15% 31,570 381,500 0.15% 554,220 402,100 0.15% 585,790 61% 408,500 0.15% 593,140<br />
Phoenix Copper Leach, Nevada (2) 100% 0 0 160,600 0.24% 384,130 160,600 0.24% 384,130 58% 154,400 0.22% 339,680<br />
TOTAL NORTH AMERICA 20,600 0.15% 31,570 542,100 0.17% 938,350 562,700 0.17% 969,920 59% 562,900 0.16% 932,820<br />
South America<br />
Conga, Peru (3) 51.35% 0 0 275,200 0.28% 767,420 275,200 0.28% 767,420 85% 275,200 0.28% 767,300<br />
TOTAL SOUTH AMERICA 0 0 275,200 0.28% 767,420 275,200 0.28% 767,420 85% 303,400 0.28% 767,300<br />
Asia Pacific<br />
48.5% 119,100 0.51% 606,440 151,100 0.36% 551,440 270,200 0.43% 1,157,880 75% 293,700 0.41% 1,<strong>21</strong>1,990<br />
Batu Hijau<br />
Batu Hijau Stockpiles (4)(5) 48.5% 0 0 127,600 0.33% 425,430 127,600 0.33% 425,430 59% 142,300 0.34% 481,570<br />
Batu Hijau, Indonesia 48.5% 119,100 0.51% 606,440 278,700 0.35% 976,870 397,800 0.40% 1,583,310 71% 436,000 0.39% 1,693,560<br />
Boddington 100% 106,200 0.10% 106,500 737,900 0.11% 832,830 844,100 0.11% 939,330 83% 955,700 0.11% 1,025,450<br />
Boddington Stockpiles (5) 100% 29,000 0.10% 27,930 28,800 0.07% 20,880 57,800 0.08% 48,810 83%<br />
Boddington, Western Australia 100% 135,200 0.10% 134,430 766,700 0.11% 853,710 901,900 0.11% 988,140 83% 955,700 0.11% 1,025,450<br />
TOTAL ASIA PACIFIC 254,300 0.29% 740,870 1,045,400 0.18% 1,830,580 1,299,700 0.20% 2,571,450 75% 1,534,100 0.20% 2,719,010<br />
TOTAL NEWMONT WORLDWIDE 274,900 0.28% 772,440 1,862,700 0.19% 3,536,350 2,137,600 0.20% 4,308,790 73% 2,458,000 0.20% 4,419,130<br />
See Footnotes under Copper Reserves U.S. units table.<br />
(Cu%)<br />
(Tonnes)<br />
Deposits/Districts<br />
Newmont<br />
Share<br />
Measured Resources Indicated Resources Measured + Indicated Resources (3)<br />
Tonnage Grade Copper Tonnage Grade Copper Tonnage Grade Copper Tonnage Grade Copper<br />
(x1000 tons) (Cu%)<br />
(million<br />
Pounds)<br />
(x1000 tons) (Cu%)<br />
(million<br />
Pounds)<br />
(x1000 tons) (Cu%)<br />
(million<br />
Pounds)<br />
(x1000 tons) (Cu%)<br />
North America<br />
Phoenix, Nevada 100% 6,300 0.07% 10 191,800 0.08% 300 198,100 0.08% 310 119,600 0.10% 230<br />
Phoenix Copper Leach, Nevada 100% 1,000 0.34% 10 <strong>21</strong>,300 0.25% 110 22,300 0.25% 120 16,900 0.20% 70<br />
TOTAL NORTH AMERICA 7,300 0.11% 20 <strong>21</strong>3,100 0.09% 410 220,400 0.10% 430 136,500 0.11% 300<br />
South America<br />
Conga, Peru 51.35% 0 0 89,300 0.19% 350 89,300 0.19% 350 130,480 0.19% 490<br />
TOTAL SOUTH AMERICA 0 0 89,300 0.19% 350 89,300 0.19% 350 130,480 0.19% 490<br />
Asia Pacific<br />
Batu Hijau, Indonesia (4) 48.5% 8,100 0.37% 60 141,300 0.34% 970 149,400 0.34% 1,030 27,600 0.27% 150<br />
Boddington, Western Australia 100% 35,500 0.07% 50 225,900 0.08% 360 261,400 0.08% 410 15,600 0.11% 30<br />
TOTAL ASIA PACIFIC 43,600 0.12% 110 367,200 0.18% 1,330 410,800 0.18% 1,440 43,200 0.<strong>21</strong>% 180<br />
TOTAL NEWMONT WORLDWIDE 50,900 0.12% 130 669,600 0.16% 2,090 720,500 0.15% 2,220 310,180 0.16% 970<br />
(4)<br />
Percentage reflects Newmont's economic interest at December 31, 2012.<br />
Attributable Copper Mineral Resources (1)(2)<br />
December 31, 2012<br />
Inferred Resources<br />
(1)<br />
Resources are reported exclusive of reserves.<br />
(2) Resources calculated at a copper price of US$3.50 or A$3.50 per pound unless otherwise noted. 2011 Resources were calculated at a copper price of US$3.50 or A$3.70 per pound. Tonnage<br />
amounts have been rounded to the nearest 100,000 and pounds have been rounded to the nearest 10 million.<br />
(3)<br />
Measured and Indicated combined Resources are equivalent to Mineralized Material disclosed in Newmont's 10K filing.<br />
(million<br />
Pounds)<br />
Deposits/Districts<br />
Newmont<br />
Share<br />
Measured Resources Indicated Resources Measured + Indicated Resources (3)<br />
Tonnage Grade Copper Tonnage Grade Copper Tonnage Grade Copper Tonnage Grade Copper<br />
(x1000<br />
tonnes)<br />
(Cu%)<br />
(tonnes)<br />
(x1000<br />
tonnes)<br />
North America<br />
Phoenix, Nevada 100% 5,700 0.07% 4,110 174,000 0.08% 135,170 179,700 0.08% 139,280 108,500 0.10% 104,570<br />
Phoenix Copper Leach, Nevada 100% 900 0.34% 3,060 19,300 0.25% 48,300 20,200 0.25% 51,360 15,300 0.20% 30,540<br />
TOTAL NORTH AMERICA 6,600 0.11% 7,170 193,300 0.09% 183,470 199,900 0.10% 190,640 123,800 0.11% 135,110<br />
South America<br />
Conga, Peru 51.35% 0 0 81,000 0.19% 156,960 81,000 0.19% 156,960 118,400 0.19% 2<strong>21</strong>,030<br />
TOTAL SOUTH AMERICA 0 0 81,000 0.19% 156,960 81,000 0.19% 156,960 118,400 0.19% 2<strong>21</strong>,030<br />
Asia Pacific<br />
Batu Hijau, Indonesia (3) 48.5% 7,300 0.37% 27,230 128,200 0.34% 440,320 135,500 0.34% 467,550 25,000 0.27% 68,080<br />
Boddington, Western Australia 100% 32,200 0.07% <strong>21</strong>,090 204,900 0.08% 164,200 237,100 0.08% 185,290 14,200 0.11% 15,040<br />
TOTAL ASIA PACIFIC 39,500 0.12% 48,320 333,100 0.18% 604,520 372,600 0.18% 652,840 39,200 0.<strong>21</strong>% 83,120<br />
TOTAL NEWMONT WORLDWIDE 46,100 0.12% 55,490 607,400 0.16% 944,950 653,500 0.15% 1,000,440 281,400 0.16% 439,260<br />
See Footnotes under Copper Resources U.S. units table.<br />
Attributable Copper Mineral Resources (1)(2) Metric Units<br />
December 31, 2012<br />
(Cu%)<br />
(tonnes)<br />
(x1000<br />
tonnes)<br />
(Cu%)<br />
(tonnes)<br />
(x1000<br />
tonnes)<br />
Inferred Resources<br />
(Cu%)<br />
(tonnes)<br />
Page 8 of 11
Deposits/Districts by Reporting Unit<br />
Attributable Proven, Probable, and Combined Silver Reserves (1) U.S. Units<br />
December 31, 2012<br />
Newmont<br />
Share<br />
Proven Reserves Probable Reserves Proven and Probable Reserves<br />
Newmont Mining Corporation<br />
6363 South Fiddlers Green Circle<br />
Greenwood Village, December CO 31, 80111 2011<br />
T 303.863.7414<br />
Metallurgical<br />
F Recovery 303.837.5837 Proven and Probable Reserves<br />
www.newmont.com<br />
Tonnage Grade Silver Tonnage Grade Silver Tonnage Grade Silver Tonnage Grade Silver<br />
(x1000 tons) (oz/ton) (x1000 ozs) (x1000 tons) (oz/ton) (x1000 ozs) (x1000 tons) (oz/ton) (x1000 ozs) (x1000 tons) (oz/ton) (x1000 ozs)<br />
North America<br />
Midas, Nevada 100% 200 3.072 510 400 9.731 3,900 600 7.791 4,410 90% 800 7.201 5,250<br />
Phoenix, Nevada 100% 22,700 0.288 6,540 420,500 0.252 106,040 443,200 0.254 112,580 36% 450,300 0.244 109,980<br />
TOTAL NORTH AMERICA 22,900 0.308 7,050 420,900 0.261 109,940 443,800 0.264 116,990 38% 451,100 0.255 115,230<br />
South America<br />
Conga, Peru 51.35% 0 0 303,400 0.064 19,400 303,400 0.064 19,400 70% 303,400 0.064 19,400<br />
Yanacocha Open Pits, Peru 51.35% 19,700 0.167 3,300 65,700 0.078 5,110 85,400 0.098 8,410 29% 89,600 0.125 11,240<br />
Yanacocha In-Process (2) 51.35% 0 0 71,600 0.257 18,370 71,600 0.257 18,370 10% 59,500 0.485 28,840<br />
Yanacocha Stockpiles (3) 51.35% 8,400 1.235 10,380 0 0 8,400 1.235 10,380 31% 6,100 1.235 7,430<br />
Total Yanacocha, Peru 51.35% 28,100 0.486 13,680 137,300 0.171 23,480 165,400 0.225 37,160 20% 155,200 0.306 47,510<br />
TOTAL SOUTH AMERICA 28,100 0.486 13,680 440,700 0.097 42,880 468,800 0.1<strong>21</strong> 56,560 37% 458,600 0.146 66,910<br />
Asia Pacific<br />
Batu Hijau Open Pit (4) 48.5% 131,300 0.047 6,120 166,600 0.024 3,980 297,900 0.034 10,100 78% 323,700 0.032 10,410<br />
Batu Hijau Stockpiles (3)(4) 48.5% 0 0 140,600 0.015 2,140 140,600 0.015 2,140 72% 156,900 0.015 2,430<br />
Total Batu Hijau, Indonesia 48.5% 131,300 0.047 6,120 307,200 0.020 6,120 438,500 0.028 12,240 77% 480,600 0.027 12,840<br />
TOTAL ASIA PACIFIC 131,300 0.047 6,120 307,200 0.020 6,120 438,500 0.028 12,240 77% 480,600 0.027 12,840<br />
TOTAL NEWMONT WORLDWIDE 182,300 0.147 26,850 1,168,800 0.136 158,940 1,351,100 0.138 185,790 40% 1,390,300 0.140 194,980<br />
(1) Reserves are calculated at a a silver price of US$30.00, A$30.00, or NZ$38.75 per ounce unless otherwise noted. 2011 reserves were calculated at a silver<br />
price of US$22.00, A$23.00, or NZ$29.00 per ounce unless otherwise noted. Tonnage amounts have been rounded to the nearest 100,000 unless they are<br />
less than 50,000, and silver ounces have been rounded to the nearest 10,000.<br />
(2) In-process material is the material on leach pads at the end of each year from which gold remains to be recovered. In-process material reserves are<br />
reported separately where tonnage or contained ounces are greater than 5% of the total site-reported reserves and contained ounces are greater than<br />
(3) Stockpiles are comprised primarily of material that has been set aside to allow processing of higher grade material in the mills. Stockpiles increase or<br />
decrease depending on current mine plans. Stockpile reserves are reported separately where tonnage or contained ounces are greater than 5% of the<br />
(4)<br />
Percentage reflects Newmont’s economic interest at December 31, 2012.<br />
Attributable Proven, Probable, and Combined Silver Reserves (1) Metric Units<br />
December 31, 2012<br />
Deposits/Districts by Reporting Unit<br />
Metallurgical<br />
Proven Reserves Probable Reserves Proven and Probable Reserves Proven and Probable Reserves<br />
Recovery<br />
Newmont Tonnage Grade Silver Tonnage Grade Silver Tonnage Grade Silver Tonnage Grade Silver<br />
(x1000 tonnes) (g/tonne) (x1000 ozs) (x1000 tonnes) (g/tonne) (x1000 ozs) (x1000 tonnes) (g/tonne) (x1000 ozs) (x1000 tonnes) (g/tonne) (x1000 ozs)<br />
North America<br />
Midas, Nevada 100% 100 105.3 510 400 333.6 3,900 500 267.1 4,410 90% 700 246.9 5,250<br />
Phoenix, Nevada 100% 20,600 9.9 6,540 381,500 8.6 106,040 402,100 8.7 112,580 36% 408,500 8.4 109,980<br />
TOTAL NORTH AMERICA 20,700 10.6 7,050 381,900 9.0 109,940 402,600 9.0 116,990 38% 409,200 8.8 115,230<br />
South America<br />
Conga, Peru 51.35% 0 0 275,200 2.2 19,400 275,200 2.2 19,400 70% 275,200 2.2 19,400<br />
Yanacocha Open Pits, Peru 51.35% 17,900 5.7 3,300 59,600 2.7 5,110 77,500 3.4 8,410 29% 81,300 4.3 11,240<br />
Yanacocha In-Process (2) 51.35% 0 0 64,900 8.8 18,370 64,900 8.8 18,370 10% 54,000 16.6 28,840<br />
Yanacocha Stockpiles (3) 51.35% 7,600 42.4 10,380 0 0 7,600 42.4 10,380 31% 5,500 42.3 7,430<br />
Total Yanacocha, Peru 51.35% 25,500 16.7 13,680 124,500 5.9 23,480 150,000 7.7 37,160 20% 140,800 10.5 47,510<br />
TOTAL SOUTH AMERICA 25,500 16.7 13,680 399,700 3.3 42,880 425,200 4.1 56,560 37% 416,000 5.0 66,910<br />
Asia Pacific<br />
Batu Hijau Open Pit (4) 48.5% 119,100 1.6 6,120 151,100 0.8 3,980 270,200 1.2 10,100 78% 293,700 1.1 10,410<br />
Batu Hijau Stockpiles (3)(4) 48.5% 0 0 127,600 0.5 2,140 127,600 0.5 2,140 72% 142,300 0.5 2,430<br />
Total Batu Hijau, Indonesia 48.5% 119,100 1.6 6,120 278,700 0.7 6,120 397,800 1.0 12,240 77% 436,000 0.9 12,840<br />
TOTAL ASIA PACIFIC 119,100 1.6 6,120 278,700 0.7 6,120 397,800 1.0 12,240 77% 436,000 0.9 12,840<br />
TOTAL NEWMONT WORLDWIDE 165,300 5.0 26,850 1,060,300 4.7 158,940 1,225,600 4.7 185,790 40% 1,261,200 4.8 194,980<br />
See Footnotes under Silver Reserves U.S. units table.<br />
December 31, 2011<br />
Deposits/Districts<br />
Attributable Silver Mineral Resources (1)(2) U.S. Units<br />
December 31, 2012<br />
Measured Resources Indicated Resources<br />
Measured + Indicated<br />
Resources (3) Inferred Resources<br />
Newmont<br />
Share Tonnage Grade Ag Tonnage Grade Ag Tonnage Grade Ag Tonnage Grade Ag<br />
(x1000 tons) (oz/ton) (x1000 ozs) (x1000 tons) (oz/ton) (x1000 ozs) (x1000 tons) (oz/ton) (x1000 ozs) (x1000 tons) (oz/ton) (x1000 ozs)<br />
North America<br />
Sandman, Nevada 100% 0 0 1,300 0.199 300 1,300 0.199 300 1,100 0.167 200<br />
Midas, Nevada 100% 0 2.236 40 100 7.717 700 100 6.879 740 300 7.156 2,500<br />
Phoenix, Nevada 100% 6,300 0.185 1,200 191,800 0.186 35,700 198,100 0.186 36,900 117,200 0.202 23,700<br />
Phoenix Stockpiles, Nevada (4) 100% 0 0 0 0 0 0 2,300 0.089 200<br />
TOTAL NORTH AMERICA 6,300 0.190 1,240 193,200 0.190 36,700 199,500 0.190 37,940 120,900 0.220 26,600<br />
South America<br />
Conga, Peru 51.35% 0 0 0 89,300 0.047 4,200 89,300 0.047 4,200 99,100 0.033 3,300<br />
Yanacocha, Peru 51.35% 12,700 0.434 5,500 16,700 0.080 1,300 29,400 0.233 6,800 10,000 0.425 4,300<br />
TOTAL SOUTH AMERICA 12,700 0.434 5,500 106,000 0.052 5,500 118,700 0.093 11,000 109,100 0.069 7,600<br />
Asia Pacific<br />
Batu Hijau, Indonesia (5) 48.5% 8,100 0.038 300 141,300 0.027 3,700 149,400 0.027 4,000 27,600 0.016 400<br />
TOTAL ASIA PACIFIC 8,100 0.038 300 141,300 0.027 3,700 149,400 0.027 4,000 27,600 0.016 400<br />
TOTAL NEWMONT WORLDWIDE 27,100 0.259 7,040 440,500 0.104 45,900 467,600 0.113 52,940 257,600 0.134 34,600<br />
(1)<br />
Mineral Resources reported exclusive of reserves.<br />
(2)<br />
Mineral Resources calculated at a silver price of US$35.00, A$35.00, or NZ$45.00 per ounce unless otherwise noted. 2011 Resources were calculated at a<br />
silver price of US$26.00, A$27.50, or NZ$34.50 per ounce. Tonnage amounts have been rounded to the nearest 100,000.<br />
(3)<br />
Measured and Indicated combined Resources are equivalent to Mineralized Material disclosed in Newmont's 10K filing.<br />
(4) Stockpiles are comprised primarily of material that has been set aside to allow processing of higher grade material in the mills. Stockpiles increase or<br />
decrease depending on current mine plans.<br />
(5) Percentage reflects Newmont's economic interest at December 31, 2012.<br />
Page 9 of 11
Deposits/Districts<br />
Newmont Mining Corporation<br />
Attributable Silver Mineral Resources (1)(2) Metric Units 6363 South Fiddlers Green Circle<br />
Greenwood Village, CO 80111<br />
December 31, 2012<br />
T 303.863.7414<br />
Measured + Indicated<br />
Measured Resources<br />
Indicated Resources<br />
F 303.837.5837<br />
Resources<br />
www.newmont.com<br />
(3) Inferred Resources<br />
Newmont<br />
Share Tonnage Grade Ag Tonnage Grade Ag Tonnage Grade Ag Tonnage Grade Ag<br />
(x1000 tonnes) (g/tonne) (x1000 ozs) (x1000 tonnes) (g/tonne) (x1000 ozs) (x1000 tonnes) (g/tonne) (x1000 ozs) (x1000 tonnes) (g/tonne) (x1000 ozs)<br />
North America<br />
Sandman, Nevada 100% 0 0 1,200 6.8 300 1,200 6.8 300 1,000 5.7 200<br />
Midas, Nevada 100% 0 76.7 40 100 264.6 700 100 235.8 740 300 245.4 2,500<br />
Phoenix, Nevada 100% 5,700 6.3 1,200 174,000 6.4 35,700 179,700 6.4 36,900 106,300 6.9 23,700<br />
Phoenix Stockpiles, Nevada (4) 100% 0 0 0 0 0 0 2,100 3.1 200<br />
TOTAL NORTH AMERICA 5,700 6.5 1,240 175,300 6.5 36,700 181,000 6.5 37,940 109,700 7.5 26,600<br />
South America<br />
Conga, Peru 51.35% 0 0 81,000 1.6 4,200 81,000 1.6 4,200 89,900 1.1 3,300<br />
Yanacocha, Peru 51.35% 11,500 14.9 5,500 15,100 2.7 1,300 26,600 8.0 6,800 9,100 14.6 4,300<br />
TOTAL SOUTH AMERICA 11,500 14.9 5,500 96,100 1.8 5,500 107,600 3.2 11,000 99,000 2.4 7,600<br />
Asia Pacific<br />
Batu Hijau, Indonesia (5) 48.5% 7,300 1.3 300 128,200 0.9 3,700 135,500 0.9 4,000 25,000 0.5 400<br />
TOTAL ASIA PACIFIC 7,300 1.3 300 128,200 0.9 3,700 135,500 0.9 4,000 25,000 0.5 400<br />
TOTAL NEWMONT WORLDWIDE 24,500 8.9 7,040 399,600 3.6 45,900 424,100 3.9 52,940 233,700 4.6 34,600<br />
See Footnotes under Silver Resources U.S. units table.<br />
To view more detailed financial disclosure, including regional mine statistics, Results of Consolidated<br />
Operations, Liquidity and Capital Resources, Management‟s Discussion & Analysis, relevant Risk<br />
Factors, and a complete outline of the 2012 Operating and Financial guidance by region, please see the<br />
Company‟s Annual Report on Form 10-K, filed with the Securities and Exchange Commission on<br />
<strong>February</strong> <strong>21</strong>, <strong>2013</strong>, available at www.newmont.com.<br />
Newmont Mining Corporation (NYSE: NEM) announced it will report Fourth Quarter and Year-End 2012<br />
results after the market closes on Thursday, <strong>February</strong> <strong>21</strong>, <strong>2013</strong>. A conference call will be held on<br />
Friday, <strong>February</strong> 22 at 10:00 a.m. Eastern Time (8:00 a.m. Mountain Time); it will also be carried on<br />
the Company‟s website.<br />
Conference Call Details<br />
Dial-In Number 888.566.1822<br />
Intl Dial-In Number 312.470.7116<br />
Leader<br />
John Seaberg<br />
Passcode<br />
Newmont<br />
Replay Number 866-380-6745<br />
Intl Replay Number 203-369-0348<br />
Replay Passcode <strong>2013</strong><br />
Webcast Details<br />
URL<br />
http://services.choruscall.com/links/newmont130222.html<br />
The Fourth Quarter and Year-End 2012 results and related financial and statistical information will be<br />
available after the market close on Thursday, <strong>February</strong> <strong>21</strong>, <strong>2013</strong> on the “Investor Relations” section of the<br />
Company‟s web site, www.newmont.com. Additionally, the conference call will be archived for a limited<br />
time on the Company‟s website.<br />
Investor Contacts<br />
John Seaberg 303.837.5743 john.seaberg@newmont.com<br />
Karli Anderson 303.837.6049 karli.anderson@newmont.com<br />
Media Contacts<br />
Omar Jabara 303.837.5114 omar.jabara@newmont.com<br />
Diane Reberger 303.967.9455 diane.reberger@newmont.com<br />
Page 10 of 11
Newmont Mining Corporation<br />
6363 South Fiddlers Green Circle<br />
Cautionary Statement Regarding Forward Looking Statements, Including <strong>2013</strong> Outlook:<br />
Greenwood Village, CO 80111<br />
T 303.863.7414<br />
F 303.837.5837<br />
This release contains “forward-looking statements” within the meaning of Section 27A of the Securities www.newmont.com<br />
Act of 1933, as amended,<br />
and Section <strong>21</strong>E of the Securities Exchange Act of 1934, as amended, which are intended to be covered by the safe harbor created<br />
by such sections and other applicable laws. Such forward-looking statements may include, without limitation: (i) estimates of future<br />
production and sales; (ii) estimates of future costs applicable to sales; (iii) estimates of future consolidated and attributable capital<br />
expenditures, CAS, and all-in sustaining cost; (iv) estimates of future exploration spending; and (v) expectations regarding the<br />
development, growth and exploration potential of the Company‟s projects. Estimates or expectations of future events or results are<br />
based upon certain assumptions, which may prove to be incorrect. Such assumptions, include, but are not limited to: (i) there being<br />
no significant change to current geotechnical, metallurgical, hydrological and other physical conditions; (ii) permitting, development,<br />
operations and expansion of the Company‟s projects being consistent with current expectations and mine plans; (iii) political<br />
developments in any jurisdiction in which the Company operates being consistent with its current expectations; (iv) certain exchange<br />
rate assumptions for the Australian dollar to the U.S. dollar, as well as other the exchange rates being approximately consistent with<br />
current levels; (v) certain price assumptions for gold, copper and oil; (vi) prices for key supplies being approximately consistent with<br />
current levels; and (vii) the accuracy of our current mineral reserve and mineral resource estimates. Where the Company expresses<br />
or implies an expectation or belief as to future events or results, such expectation or belief is expressed in good faith and believed to<br />
have a reasonable basis. However, such statements are subject to risks, uncertainties and other factors, which could cause actual<br />
results to differ materially from future results expressed, projected or implied by the “forward-looking statements”. Such risks<br />
include, but are not limited to, gold and other metals price volatility, currency fluctuations, increased production costs and variances<br />
in ore grade or recovery rates from those assumed in mining plans, political and operational risks, community relations, conflict<br />
resolution and outcome of projects or oppositions and governmental regulation and judicial outcomes. For a more detailed<br />
discussion of such risks and other factors, see the Company‟s 2012 Form 10-K, filed on <strong>February</strong> <strong>21</strong>, <strong>2013</strong>, with the Securities and<br />
Exchange Commission, as well as the Company‟s other SEC filings. The Company does not undertake any obligation to release<br />
publicly revisions to any “forward-looking statement,” including, without limitation, outlook, to reflect events or circumstances after<br />
the date of this news release, or to reflect the occurrence of unanticipated events, except as may be required under applicable<br />
securities laws. Investors should not assume that any lack of update to a previously issued “forward-looking statement” constitutes<br />
a reaffirmation of that statement. Continued reliance on “forward-looking statements” is at investors' own risk.<br />
Cautionary Statement regarding Reserves and Resource:<br />
Ian Douglas, Newmont‟s Group Executive of Reserves, is the qualified person responsible for the preparation of the Reserve and<br />
Resource estimates in this presentation. The Reserves disclosed in this presentation have been prepared in compliance with<br />
Industry Guide 7 published by the SEC. As used in this news release, the term “Reserve” means that part of a mineral deposit that<br />
can be economically and legally extracted or produced at the time of the reserve determination. The term “economically,” as used in<br />
this definition, means that profitable extraction or production has been established or analytically demonstrated in a full feasibility<br />
study to be viable and justifiable under reasonable investment and market assumptions. The term “legally,” as used in this definition,<br />
does not imply that all permits needed for mining and processing have been obtained or that other legal issues have been<br />
completely resolved. However, for a reserve to exist, Newmont must have a justifiable expectation, based on applicable laws and<br />
regulations, that issuance of permits or resolution of legal issues necessary for mining and processing at a particular deposit will be<br />
accomplished in the ordinary course and in a timeframe consistent with Newmont‟s current mine plans. Reserves in this news<br />
release may be aggregated from the Proven and Probable classes. The terms ”Mineral Resources” or “Resources” and Measured,<br />
Indicated and Inferred resources are used in this news release. Investors are advised that the SEC does not recognize these terms.<br />
Newmont has determined that such Resources would be substantively the same as those prepared using the Guidelines<br />
established by the Society of Mining, Metallurgy and Exploration and defined as Mineral Resources. Estimates of Resources are<br />
subject to further exploration and development, are subject to additional risks, and no assurance can be given that they will<br />
eventually convert to future Mineral Reserves of the company. Inferred Resources, in particular, have a great amount of uncertainty<br />
as to their existence and their economic and legal feasibility. Investors are cautioned not to assume that any part or all of the<br />
Inferred Resource exists, or is economically or legally mineable. Also, disclosure of contained ounces is permitted under SME and<br />
other regulatory guideline; however, the SEC generally requires mineral resource information to be reported only as in-place<br />
tonnage and grade. In addition, our current or future reserves and exploration and development projects may not result in new<br />
mineral producing operations. Even if significant mineralization is discovered and converted to reserves, it will likely take many years<br />
from the initial phases of exploration to development and ultimately to production, during which time the economic feasibility of<br />
production may change. Additionally, references to “attributable ounces,” “attributable pounds” and “attributable mineralization” in<br />
this news release are intended to mean that portion of gold or copper produced, sold or included in Proven and Probable Reserves<br />
or Resources that is attributable to our ownership or economic interest.<br />
Page 11 of 11