Non-Intrusive High-level SystemC Debugging - Informatik
Non-Intrusive High-level SystemC Debugging - Informatik
Non-Intrusive High-level SystemC Debugging - Informatik

Create successful ePaper yourself
Turn your PDF publications into a flip-book with our unique Google optimized e-Paper software.
So we decided to implement high-<strong>level</strong> <strong>SystemC</strong><br />
debugging as a set of gdb user commands to avoid patching<br />
of gdb source code. C++ routines and shell scripts<br />
collect required data from <strong>SystemC</strong> or gdb runtime,<br />
respectively, and present the information to the designer.<br />
Only minor transparent changes to <strong>SystemC</strong> kernel<br />
source code were made to enhance debugging performance.<br />
The remainder of this paper is organized as follows.<br />
Section 2 proposes our high-<strong>level</strong> <strong>SystemC</strong> debug methodology<br />
derived from the given industrial requirements.<br />
Section 3 introduces implementation details, and explains<br />
modifications made to improve performance. Section 4<br />
presents some practical experiences gained. And section 5<br />
concludes the paper.<br />
2 Methodology<br />
2.1 Requirements and design issues<br />
The most important industrial requirement was the<br />
demand for a non-intrusive debugging facility that fits<br />
seamlessly into the existing design flow. That means, the<br />
solution should work with the available <strong>SystemC</strong> kernel<br />
and avoid any changes to present designs or (third-party)<br />
IP blocks. On the tool side, the already applied GNU<br />
debugger gdb [GDB06] should be extended without any<br />
need for patching its sources. Advantages are a familiar,<br />
intuitive, and unchanged debugging flow combined with a<br />
minimal learning curve for the user. Moreover, maintainance<br />
and customization of the flow are reduced to a minimum.<br />
<strong>Debugging</strong> at system <strong>level</strong> requires various kinds of<br />
high-<strong>level</strong> information that should be retrievable fast and<br />
easily. According to [DSG03], one main information category<br />
is of interest in the debugging context:<br />
Run-time infrastructure information can be divided<br />
into three subcategories. (i) Static simulation information<br />
describes the structure of the architecture that means the<br />
number of modules, the number of processes and signals,<br />
the I/O interfaces and their connections, etc. (ii) Dynamic<br />
simulation information includes among other things the<br />
triggering conditions of processes, the process sensitivity<br />
lists, and the number and types of events in the simulation<br />
queue. (iii) <strong>Debugging</strong> callbacks (here, high-<strong>level</strong> breakpoints)<br />
allow to add callbacks from the simulation environment<br />
to break on certain events such as process<br />
activation, value changes on signals or the ongoing simulation<br />
time.<br />
Studies at AMD indicated several debug patterns typically<br />
used in daily work. A pattern describes the steps (in<br />
gdb) to enquire needed debugging infomation at system<br />
<strong>level</strong>. Based upon characteristic debug patterns, high<strong>level</strong><br />
commands were implemented (table 1). At top <strong>level</strong>,<br />
commands are classified in examining and controlling<br />
types. In a distributed development flow, many designers<br />
are working on different components at the same design.<br />
In case of an error, it is essential to get a fast insight into<br />
external components and their interaction with your own<br />
ones. For this reason, examination commands retrieve<br />
either static or dynamic simulation information. Controlling<br />
commands provide high-<strong>level</strong> breakpoints to reach a<br />
point of failure at system <strong>level</strong> very quickly. They stop<br />
program execution at certain conditions, such as the next<br />
activation of a specific process or all processes which are<br />
sensitive to a given <strong>SystemC</strong> event.<br />
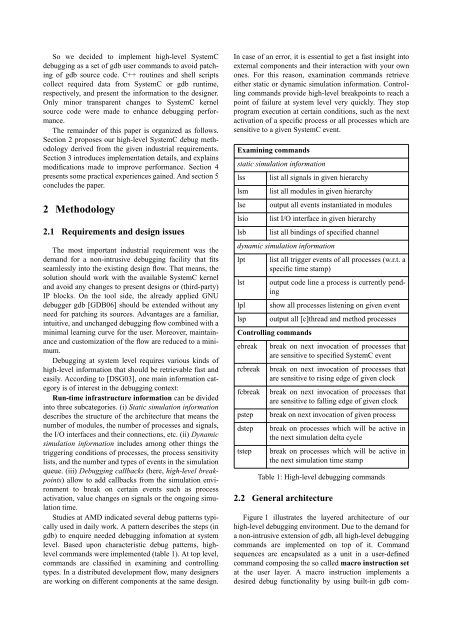
Examining commands<br />
static simulation information<br />
lss list all signals in given hierarchy<br />
lsm list all modules in given hierarchy<br />
lse output all events instantiated in modules<br />
lsio list I/O interface in given hierarchy<br />
lsb list all bindings of specified channel<br />
dynamic simulation information<br />
lpt list all trigger events of all processes (w.r.t. a<br />
specific time stamp)<br />
lst output code line a process is currently pending<br />
lpl show all processes listening on given event<br />
lsp output all [c]thread and method processes<br />
Controlling commands<br />
ebreak break on next invocation of processes that<br />
are sensitive to specified <strong>SystemC</strong> event<br />
rcbreak break on next invocation of processes that<br />
are sensitive to rising edge of given clock<br />
fcbreak break on next invocation of processes that<br />
are sensitive to falling edge of given clock<br />
pstep break on next invocation of given process<br />
dstep break on processes which will be active in<br />
the next simulation delta cycle<br />
tstep break on processes which will be active in<br />
the next simulation time stamp<br />
Table 1: <strong>High</strong>-<strong>level</strong> debugging commands<br />
2.2 General architecture<br />
Figure 1 illustrates the layered architecture of our<br />
high-<strong>level</strong> debugging environment. Due to the demand for<br />
a non-intrusive extension of gdb, all high-<strong>level</strong> debugging<br />
commands are implemented on top of it. Command<br />
sequences are encapsulated as a unit in a user-defined<br />
command composing the so called macro instruction set<br />
at the user layer. A macro instruction implements a<br />
desired debug functionality by using built-in gdb com-