Forecast Visitation to Victoria - Tourism Victoria
Forecast Visitation to Victoria - Tourism Victoria
Forecast Visitation to Victoria - Tourism Victoria

Create successful ePaper yourself
Turn your PDF publications into a flip-book with our unique Google optimized e-Paper software.
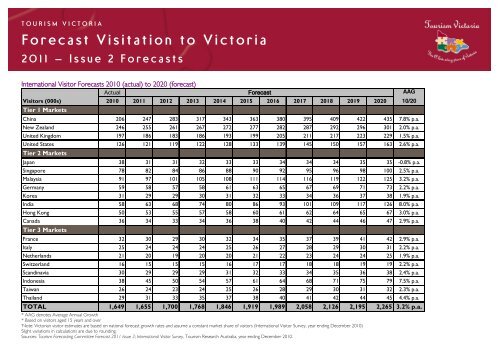
T O U R I S M V I C T O R I A<br />
<strong>Forecast</strong> <strong>Visitation</strong> <strong>to</strong> Vic<strong>to</strong>ria<br />
2 011 ñ Issue 2 <strong>Forecast</strong>s<br />
International Visi<strong>to</strong>r <strong>Forecast</strong>s 2010 (actual) <strong>to</strong> 2020 (forecast)<br />
Actual<br />
Visi<strong>to</strong>rs (000s) 2010 2011 2012 2013 2014 2015 2016 2017 2018 2019 2020 10/20<br />
Tier 1 Markets<br />
China 206 247 283 317 343 363 380 395 409 422 435 7.8% p.a.<br />
New Zealand 246 255 261 267 272 277 282 287 292 296 301 2.0% p.a.<br />
United Kingdom 197 186 183 186 193 199 205 211 217 223 229 1.5% p.a.<br />
United States 126 121 119 122 128 133 139 145 150 157 163 2.6% p.a.<br />
Tier 2 Markets<br />
Japan 38 31 31 32 33 33 34 34 34 35 35 -0.8% p.a.<br />
Singapore 78 82 84 86 88 90 92 95 96 98 100 2.5% p.a.<br />
Malaysia 91 97 101 105 108 111 114 116 119 122 125 3.2% p.a.<br />
Germany 59 58 57 58 61 63 65 67 69 71 73 2.2% p.a.<br />
Korea 31 29 29 30 31 32 33 34 36 37 38 1.9% p.a.<br />
India 58 63 68 74 80 86 93 101 109 117 126 8.0% p.a.<br />
Hong Kong 50 53 55 57 58 60 61 62 64 65 67 3.0% p.a.<br />
Canada 36 34 33 34 36 38 40 42 44 46 47 2.9% p.a.<br />
Tier 3 Markets<br />
<strong>Forecast</strong><br />
France 32 30 29 30 32 34 35 37 39 41 42 2.9% p.a.<br />
Italy 25 24 24 24 25 26 27 28 29 30 31 2.2% p.a.<br />
Netherlands 21 20 19 20 20 21 22 23 24 24 25 1.9% p.a.<br />
Switzerland 16 15 15 15 16 17 17 18 18 19 19 2.2% p.a.<br />
Scandinavia 30 29 29 29 31 32 33 34 35 36 38 2.4% p.a.<br />
Indonesia 38 45 50 54 57 61 64 68 71 75 79 7.5% p.a.<br />
Taiwan 26 24 23 24 25 26 28 29 30 31 32 2.3% p.a.<br />
Thailand 29 31 33 35 37 38 40 41 42 44 45 4.4% p.a.<br />
TOTAL 1,649 1,655 1,700 1,768 1,846 1,919 1,989 2,058 2,126 2,195 2,265 3.2% p.a.<br />
* AAG denotes Average Annual Growth<br />
* Based on visi<strong>to</strong>rs aged 15 years and over<br />
ëNote: Vic<strong>to</strong>rian visi<strong>to</strong>r estimates are based on national forecast growth rates and assume a constant market share of visi<strong>to</strong>rs (International Visi<strong>to</strong>r Survey, year ending December 2010)<br />
Slight variations in calculations are due <strong>to</strong> rounding.<br />
Sources: <strong>Tourism</strong> <strong>Forecast</strong>ing Committee <strong>Forecast</strong> 2011 Issue 2; International Visi<strong>to</strong>r Survey, <strong>Tourism</strong> Research Australia, year ending December 2010.<br />
AAG
T O U R I S M V I C T O R I A<br />
<strong>Forecast</strong> <strong>Visitation</strong> <strong>to</strong> Vic<strong>to</strong>ria<br />
2 011 ñ Issue 2 <strong>Forecast</strong>s<br />
International Visi<strong>to</strong>r Nights <strong>Forecast</strong>s 2010 (actual) <strong>to</strong> 2020 (forecast)<br />
Actual<br />
Visi<strong>to</strong>r Nights ('000) 2010 2011 2012 2013 2014 2015 2016 2017 2018 2019 2020 10/20<br />
Tier 1 Markets<br />
China 7,754 8,821 9,804 10,543 11,087 11,550 11,989 12,408 12,806 13,186 13,557 5.7% p.a.<br />
New Zealand 2,220 2,364 2,435 2,490 2,540 2,588 2,638 2,684 2,731 2,770 2,807 2.4% p.a.<br />
United Kingdom 3,738 3,440 3,379 3,394 3,461 3,517 3,567 3,606 3,645 3,684 3,722 0.0% p.a.<br />
United States 1,630 1,638 1,616 1,635 1,687 1,733 1,780 1,825 1,870 1,914 1,958 1.8% p.a.<br />
Tier 2 Markets<br />
Japan 931 797 759 771 778 772 761 749 737 724 710 -2.7% p.a.<br />
Singapore 1,798 1,856 1,909 1,963 2,013 2,065 2,116 2,168 2,221 2,273 2,328 2.6% p.a.<br />
Malaysia 2,661 2,729 2,870 3,099 3,339 3,593 3,863 4,144 4,446 4,768 5,110 6.7% p.a.<br />
Germany 962 925 917 930 961 993 1,024 1,055 1,086 1,116 1,145 1.8% p.a.<br />
Korea 1,245 1,190 1,155 1,164 1,194 1,224 1,251 1,275 1,299 1,319 1,338 0.7% p.a.<br />
India 3,277 3,790 4,069 4,319 4,582 4,842 5,112 5,393 5,684 5,985 6,304 6.8% p.a.<br />
Hong Kong 928 977 1,024 1,067 1,096 1,119 1,142 1,165 1,187 1,208 1,230 2.9% p.a.<br />
Canada 740 703 713 750 803 858 915 975 1,037 1,100 1,165 4.6% p.a.<br />
Tier 3 Markets<br />
<strong>Forecast</strong><br />
France 797 743 712 714 728 741 751 758 765 770 774 -0.3% p.a.<br />
Italy 555 543 532 539 557 575 590 605 619 632 644 1.5% p.a.<br />
Netherlands 298 275 269 270 276 283 288 293 297 301 305 0.2% p.a.<br />
Switzerland 181 180 181 188 200 212 224 236 248 261 275 4.3% p.a.<br />
Scandinavia 591 583 580 584 603 622 641 658 675 692 707 1.8% p.a.<br />
Indonesia 1,476 1,648 1,789 1,926 2,057 2,184 2,308 2,436 2,565 2,693 2,827 6.7% p.a.<br />
Taiwan 531 515 494 485 489 492 493 492 491 489 486 -0.9% p.a.<br />
Thailand 1,238 1,293 1,348 1,392 1,422 1,444 1,463 1,479 1,493 1,505 1,516 2.0% p.a.<br />
TOTAL 40,662 41,109 42,239 44,062 46,166 48,271 50,325 52,322 54,350 56,397 58,480 3.7% p.a.<br />
* AAG denotes Average Annual Growth<br />
* Based on visi<strong>to</strong>rs aged 15 years and over<br />
Slight variations in calculations are due <strong>to</strong> rounding.<br />
Sources: <strong>Tourism</strong> <strong>Forecast</strong>ing Committee <strong>Forecast</strong> 2011 Issue 2; International Visi<strong>to</strong>r Survey, <strong>Tourism</strong> Research Australia, year ending December 2010.<br />
AAG
T O U R I S M V I C T O R I A<br />
<strong>Forecast</strong> <strong>Visitation</strong> <strong>to</strong> Vic<strong>to</strong>ria<br />
2 011 ñ Issue 2 <strong>Forecast</strong>s<br />
International Visi<strong>to</strong>r Nights <strong>Forecast</strong> 2010 (actual) <strong>to</strong> 2020 (forecast) by purpose and metro/regional<br />
Actual <strong>Forecast</strong><br />
Visi<strong>to</strong>r Nights (000s) 2010 2011 2012 2013 2014 2015 2016 2017 2018 2019 2020 10/20<br />
Melbourne<br />
Business 2,475 2,662 2,798 2,897 2,980 3,056 3,128 3,199 3,268 3,335 3,401 3.2% p.a.<br />
Holiday 6,353 6,633 6,844 7,060 7,275 7,476 7,672 7,862 8,053 8,226 8,398 2.8% p.a.<br />
VFR 9,331 9,975 10,311 10,644 10,990 11,304 11,608 11,910 12,209 12,500 12,788 3.2% p.a.<br />
Other 17,512 17,102 17,514 18,560 19,813 21,123 22,416 23,682 24,991 26,339 27,732 4.7% p.a.<br />
Total Melbourne 35,671 36,371 37,466 39,161 41,058 42,959 44,823 46,654 48,521 50,401 52,318 3.9% p.a.<br />
Regional Vic<strong>to</strong>ria<br />
Business 196 236 248 257 262 267 273 277 281 286 290 4.0% p.a.<br />
Holiday 1,845 1,615 1,622 1,684 1,772 1,853 1,922 1,979 2,033 2,088 2,139 1.5% p.a.<br />
VFR 2,035 1,754 1,755 1,788 1,841 1,897 1,949 1,996 2,042 2,090 2,138 0.5% p.a.<br />
Other 916 1,132 1,147 1,173 1,232 1,295 1,358 1,415 1,472 1,533 1,594 5.7% p.a.<br />
Total regional Vic<strong>to</strong>ria 4,991 4,737 4,773 4,902 5,108 5,312 5,501 5,667 5,829 5,997 6,162 2.1% p.a.<br />
TOTAL VICTORIA 40,662 41,109 42,239 44,062 46,166 48,271 50,325 52,322 54,350 56,397 58,480 3.7% p.a.<br />
AAG<br />
* AAG denotes Average Annual Growth<br />
* Based on visi<strong>to</strong>rs aged 15 years and over<br />
Slight variations in calculations are due <strong>to</strong> rounding.<br />
Note that figures in red italics are below reliable threshold and should be interpreted with caution.<br />
Sources: <strong>Tourism</strong> <strong>Forecast</strong>ing Committee <strong>Forecast</strong> 2011 Issue 2; International Visi<strong>to</strong>r Survey, <strong>Tourism</strong> Research Australia, year ending December 2010.
T O U R I S M V I C T O R I A<br />
<strong>Forecast</strong> <strong>Visitation</strong> <strong>to</strong> Vic<strong>to</strong>ria<br />
2 011 ñ Issue 2 <strong>Forecast</strong>s<br />
Domestic Visi<strong>to</strong>r <strong>Forecast</strong>s 2010 (actual) <strong>to</strong> 2020 (forecast)<br />
Actual<br />
<strong>Forecast</strong><br />
Visi<strong>to</strong>rs (million) 2010 2011 2012 2013 2014 2015 2016 2017 2018 2019 2020 10/20<br />
Business 2.6 2.7 2.7 2.7 2.7 2.7 2.7 2.8 2.8 2.8 2.8<br />
Holiday 7.4 7.5 7.6 7.6 7.7 7.7 7.7 7.8 7.8 7.8 7.8<br />
VFR 5.2 5.3 5.4 5.4 5.4 5.4 5.5 5.5 5.5 5.5 5.5<br />
Other 0.8 0.8 0.8 0.8 0.8 0.8 0.8 0.8 0.8 0.8 0.8<br />
TOTAL# 15.8 16.0 16.2 16.3 16.3 16.4 16.5 16.5 16.6 16.6 16.7 0.5% p.a.<br />
AAG*<br />
Domestic Visi<strong>to</strong>r Nights <strong>Forecast</strong> 2010 (actual) <strong>to</strong> 2020 (forecast) by purpose and Metro Regional<br />
Actual<br />
Visi<strong>to</strong>r Nights (million) 2010 2011 2012 2013 2014 2015 2016 2017 2018 2019 2020 10/20<br />
METRO<br />
Business 4.2 4.5 4.6 4.6 4.7 4.7 4.7 4.8 4.8 4.8 4.8 1.5% p.a.<br />
Holiday 6.1 6.4 6.4 6.4 6.4 6.4 6.4 6.4 6.4 6.4 6.4 0.5% p.a.<br />
VFR 6.6 6.1 6.1 6.1 6.2 6.2 6.2 6.2 6.2 6.3 6.3 -0.4% p.a.<br />
Other 1.4 1.3 1.3 1.3 1.3 1.3 1.3 1.3 1.3 1.3 1.3 -0.3% p.a.<br />
Total Metro 18.2 18.2 18.4 18.4 18.5 18.6 18.6 18.7 18.8 18.8 18.9 0.4% p.a.<br />
REGIONAL<br />
<strong>Forecast</strong><br />
Business 2.6 2.2 2.2 2.2 2.2 2.2 2.2 2.3 2.3 2.3 2.3 -1.3% p.a.<br />
Holiday 18.7 19.0 19.0 19.0 19.0 19.1 19.1 19.1 19.1 19.1 19.1 0.2% p.a.<br />
VFR 8.8 9.0 9.0 9.1 9.1 9.1 9.1 9.1 9.2 9.2 9.2 0.5% p.a.<br />
Other 1.1 1.5 1.5 1.5 1.5 1.5 1.5 1.5 1.5 1.5 1.5 2.6% p.a.<br />
Total Regional 31.2 31.6 31.7 31.8 31.8 31.9 31.9 31.9 32.0 32.0 32.0 0.3% p.a.<br />
TOTAL 49.4 49.9 50.1 50.2 50.3 50.5 50.6 50.7 50.7 50.8 50.9 0.3% p.a.<br />
* AAG denotes Average Annual Growth<br />
* Based on visi<strong>to</strong>rs aged 15 years and over<br />
#ëNote: Vic<strong>to</strong>rian visi<strong>to</strong>r estimates are based on national forecast growth rates and assume a constant market share of visi<strong>to</strong>rs (National Visi<strong>to</strong>r Survey, year ending December 2010)<br />
Slight variations in calculations are due <strong>to</strong> rounding.<br />
Sources: <strong>Tourism</strong> <strong>Forecast</strong>ing Committee <strong>Forecast</strong> 2011 Issue 2; National Visi<strong>to</strong>r Survey, <strong>Tourism</strong> Research Australia, year ending December 2010.<br />
Fact sheet produced by <strong>Tourism</strong> Vic<strong>to</strong>ria Research Unit, Oc<strong>to</strong>ber 2011. For the full report refer <strong>to</strong> http://www.ret.gov.au/<strong>to</strong>urism/tra/traforecasts/publications/Pages/default.aspx<br />
AAG*