Changes in Consumption at Retirement: Evidence ... - WebMeets.com
Changes in Consumption at Retirement: Evidence ... - WebMeets.com
Changes in Consumption at Retirement: Evidence ... - WebMeets.com

You also want an ePaper? Increase the reach of your titles
YUMPU automatically turns print PDFs into web optimized ePapers that Google loves.
<strong>Changes</strong> <strong>in</strong> <strong>Consumption</strong> <strong>at</strong> <strong>Retirement</strong>: <strong>Evidence</strong> from<br />
Panel D<strong>at</strong>a <br />
Emma Aguila y , Orazio Attanasio z , Costas Meghir x<br />
Abstract<br />
Previous empirical liter<strong>at</strong>ure has found a sharp decl<strong>in</strong>e <strong>in</strong> consumption dur<strong>in</strong>g the …rst<br />
years of retirement imply<strong>in</strong>g th<strong>at</strong> <strong>in</strong>dividuals do not save enough for their retirement. This<br />
phenomenon is called the retirement consumption puzzle. We …nd no evidence of the retirement<br />
consumption puzzle us<strong>in</strong>g panel d<strong>at</strong>a from 1980 to 2000. <strong>Consumption</strong> is de…ned as<br />
nondurable expenditure, a more <strong>com</strong>prehensive measure than only food used <strong>in</strong> many of the<br />
previous studies. We …nd food expenditure decl<strong>in</strong>es <strong>at</strong> retirement, which is consistent with<br />
previous studies.<br />
JEL classi…c<strong>at</strong>ion: D91, J26<br />
Keywords: retirement, consumption<br />
1 Introduction<br />
A central implic<strong>at</strong>ion of the life cycle model is th<strong>at</strong> <strong>in</strong>dividuals and households smooth their<br />
consumption over the life cycle to avoid ‡uctu<strong>at</strong>ions <strong>in</strong>duced by predictable changes to <strong>in</strong><strong>com</strong>e.<br />
Out of all life events, retirement is probably the most important predictable change <strong>in</strong> one’s<br />
<strong>in</strong><strong>com</strong>e.<br />
Banks, Blundell and Tanner (1998) was the …rst study to …nd a sharp decl<strong>in</strong>e <strong>in</strong><br />
consumption <strong>at</strong> retirement. While their work concentr<strong>at</strong>ed on consumption <strong>in</strong> the UK, Bernheim,<br />
Sk<strong>in</strong>ner and We<strong>in</strong>berg (2001), us<strong>in</strong>g longitud<strong>in</strong>al d<strong>at</strong>a from the Panel Study of In<strong>com</strong>e Dynamics<br />
(PSID), also found a drop <strong>in</strong> consumption <strong>at</strong> retirement. <strong>Evidence</strong> potentially damag<strong>in</strong>g for the<br />
life cycle model. This conundrum is referred as the retirement consumption puzzle.<br />
We would like to thank James Banks, Richard Blundell, Erik Hurst, and Jon<strong>at</strong>han Sk<strong>in</strong>ner for their valuable<br />
<strong>com</strong>ments. We specially thank Erich B<strong>at</strong>tist<strong>in</strong> for his help us<strong>in</strong>g the d<strong>at</strong>a sets.<br />
y RAND<br />
z University College London and Institute for Fiscal Studies, London<br />
x University College London and Institute for Fiscal Studies, London<br />
1
In this paper, we explore the existence of the retirement consumption puzzle from a variety of<br />
di¤erent consumption c<strong>at</strong>egories us<strong>in</strong>g panel d<strong>at</strong>a. We use the panel <strong>com</strong>ponent of the Consumer<br />
Expenditure Survey (CEX) from 1980 to 2000 to exam<strong>in</strong>e households’ consumption p<strong>at</strong>terns<br />
when the head of household retires. The CEX is the most <strong>com</strong>prehensive survey <strong>in</strong> the U.S. for<br />
expenditure of nondurable and durable goods and allows us to follow households’consumption<br />
and labor transitions for four quarters.<br />
We …nd no evidence of the retirement consumption puzzle.<br />
Nondurable expenditure does<br />
not change <strong>at</strong> retirement, suggest<strong>in</strong>g <strong>in</strong>dividuals smooth consumption dur<strong>in</strong>g the …rst year of<br />
retirement. Moreover, when we focus on food expenditure, as well as some other studies have<br />
done, we do observe a decl<strong>in</strong>e <strong>in</strong> expenditure associ<strong>at</strong>ed with retirement. Our contribution to<br />
exist<strong>in</strong>g liter<strong>at</strong>ure is the use of a panel d<strong>at</strong>a set th<strong>at</strong> o¤ers a more precise expenditure measure to<br />
approxim<strong>at</strong>e consumption. We analyze larger sample sizes of households retir<strong>in</strong>g between 1980<br />
and 2000, mak<strong>in</strong>g this study more robust than the previous liter<strong>at</strong>ure to speci…c year economic<br />
conditions <strong>in</strong> d<strong>at</strong>a sets cover<strong>in</strong>g shorter periods. Moreover, we construct a more accur<strong>at</strong>e measure<br />
of expenditure with the CEX than <strong>in</strong> many of the previous studies, which basically analyze food<br />
expenditure. 1<br />
The rest of the paper is organized as follows. In Section II, we describe the d<strong>at</strong>a we use<br />
and present some descriptive evidence from the CEX on life cycle pro…les for total expenditure<br />
on non durable and services and on food expenditure. In addition, we also present life cycle<br />
pro…les for particip<strong>at</strong>ion r<strong>at</strong>es. In Section III, we present a simple empirical framework to study<br />
the rel<strong>at</strong>ionship between changes <strong>in</strong> retirement st<strong>at</strong>us and changes <strong>in</strong> consumption given the<br />
structure of the CEX sample. Here, we also present the results obta<strong>in</strong>ed apply<strong>in</strong>g this approach.<br />
Section IV o¤ers a short discussion of how our results rel<strong>at</strong>e to the exist<strong>in</strong>g liter<strong>at</strong>ure. F<strong>in</strong>ally,<br />
Section V provides a summary of our …nd<strong>in</strong>gs.<br />
1 Other studies have looked <strong>at</strong> the retirement consumption puzzle us<strong>in</strong>g other approaches and found similar<br />
results. Some of these studies are Hurd and Rohwedder (2005, 2006, 2008), Aguiar and Hurst (2005, 2007), and<br />
Fisher, Johnson, Marchand, Smeed<strong>in</strong>g and Torrey (2008). We will return to this liter<strong>at</strong>ure <strong>in</strong> a discussion section<br />
<strong>at</strong> the end.<br />
2
2 <strong>Consumption</strong> Pro…les Us<strong>in</strong>g Recall and Diary D<strong>at</strong>a<br />
The ma<strong>in</strong> d<strong>at</strong>a source we use is the Bureau of Labor St<strong>at</strong>istics Consumer Expenditure Survey<br />
(CEX) from 1980 to 2000. While the CEX has a long history, go<strong>in</strong>g back to the beg<strong>in</strong>n<strong>in</strong>g of the<br />
20th century, it is only <strong>in</strong> 1980s th<strong>at</strong> the BLS started to collect this <strong>in</strong>form<strong>at</strong>ion, with the ma<strong>in</strong><br />
purpose of <strong>com</strong>put<strong>in</strong>g the weights for the Consumer Price Index, <strong>in</strong> a cont<strong>in</strong>uous and consistent<br />
fashion.<br />
The CEX is made of two di¤erent and <strong>in</strong>dependent samples.<br />
The …rst is the so called<br />
Quarterly Interview survey and is a rot<strong>at</strong><strong>in</strong>g panel. Households are <strong>in</strong>terviewed every quarter over<br />
a period of one year and then dropped out of the sample. In each <strong>in</strong>terview, they answer detailed<br />
and retrospective questions about expenditure on a variety of di¤erent <strong>com</strong>modities dur<strong>in</strong>g each<br />
of the three months preced<strong>in</strong>g the <strong>in</strong>terview. The <strong>in</strong>form<strong>at</strong>ion collected <strong>in</strong> the <strong>in</strong>terview is almost<br />
exhaustive of personal consumption expenditure. However, for some items, notably food, is quite<br />
synthetic. 2 The second <strong>com</strong>ponent of the CEX is known as the Diary sample and is made of a<br />
series of repe<strong>at</strong>ed cross section th<strong>at</strong> have no longitud<strong>in</strong>al dimension. Each household is on the<br />
survey for a two week period, dur<strong>in</strong>g which time they …ll <strong>in</strong> a diary report<strong>in</strong>g the details of their<br />
expenditure. Until 1985, the Diary survey conta<strong>in</strong>ed only <strong>in</strong>form<strong>at</strong>ion on frequently purchased<br />
items, such as food.<br />
S<strong>in</strong>ce 1986, <strong>in</strong>stead, the <strong>in</strong>form<strong>at</strong>ion <strong>in</strong> the diary is, <strong>at</strong> least <strong>in</strong> theory,<br />
exhaustive. However, it should be stressed th<strong>at</strong> the BLS uses the Diary survey to g<strong>at</strong>her high<br />
quality <strong>in</strong>form<strong>at</strong>ion on frequently purchased items, while the <strong>in</strong>terview survey is used to get<br />
<strong>in</strong>form<strong>at</strong>ion on items th<strong>at</strong> are purchased less often. Indeed, when publish<strong>in</strong>g summary st<strong>at</strong>istics<br />
(and for the <strong>com</strong>put<strong>at</strong>ions of the CPI weights), the two di¤erent surveys are used for di¤erent<br />
items. The Diary survey is considerably smaller than the Interview survey.<br />
As the ma<strong>in</strong> purpose of this study is to look <strong>at</strong> changes <strong>in</strong> consumption around retirement,<br />
we will crucially use the longitud<strong>in</strong>al dimension of the Interview survey. However, before delv<strong>in</strong>g<br />
<strong>in</strong> the analysis of the retirement transition, we present some descriptive evidence on the life cycle<br />
pro…le of consumption and particip<strong>at</strong>ion r<strong>at</strong>es. For the former, we will be us<strong>in</strong>g synthetic cohort<br />
d<strong>at</strong>a and decided to use both the Diary and the Interview survey, as suggested <strong>in</strong> Attanasio,<br />
B<strong>at</strong>tist<strong>in</strong> and Ichimura (2007). For a detailed description of the CEX see B<strong>at</strong>tist<strong>in</strong> (2004).<br />
We report pro…les for total nondurable consumption expenditure and for food consumption.<br />
2 In the case of food, the Interview sample conta<strong>in</strong>s only <strong>in</strong>form<strong>at</strong>ion on total food <strong>at</strong> home and total food<br />
outside the home. The only item th<strong>at</strong> is not collected <strong>in</strong> the Interview survey (but is collected <strong>in</strong> the Diary survey)<br />
is ’Personal care’.<br />
3
The former is de…ned as <strong>in</strong> Attanasio and Weber (1995). The de…nition <strong>in</strong>cludes food consumed<br />
<strong>at</strong> home, food consumed away from home, alcohol, tobacco, cloth<strong>in</strong>g, footwear, personal care<br />
products, public and priv<strong>at</strong>e transport, utilities, and services. As the BLS, to <strong>com</strong>pute average<br />
consumption, we use both the <strong>in</strong>terview and the diary samples: <strong>in</strong> particular, food consumption<br />
is constructed us<strong>in</strong>g the diary sample, while the averages for less frequently purchased items are<br />
estim<strong>at</strong>ed from the <strong>in</strong>terview sample.<br />
In addition to durable expenditure, (which clearly di¤ers from the consumption of durables)<br />
we also exclude expenditure on educ<strong>at</strong>ion and health.<br />
Both of these items can be seen as<br />
<strong>in</strong>vestment r<strong>at</strong>her than consumption. Moreover, <strong>in</strong> the case of health, the CEX records out-ofpocket<br />
expenditure and does not report consumption of health services covered by <strong>in</strong>surance.<br />
All expenditure variables are de‡<strong>at</strong>ed with the Consumer Price Index (CPI). The characteristics<br />
of the sample are described <strong>in</strong> the Appendix.<br />
To estim<strong>at</strong>e life cycle pro…le, we …rst have to de…ne year of birth cohorts. We de…ne cohorts<br />
us<strong>in</strong>g the year of birth of the household head, and us<strong>in</strong>g …ve-year <strong>in</strong>tervals. In Table 1 we report<br />
the cohort de…nition, as well as the average cell size <strong>in</strong> the two d<strong>at</strong>a sets. We <strong>in</strong>clude 14 cohorts<br />
<strong>in</strong> total. It should be stressed th<strong>at</strong> cell sizes vary over time. In 1998, for <strong>in</strong>stance, the size of the<br />
Interview sample was <strong>in</strong>creased considerably.<br />
Table 1: Cohorts average cell size us<strong>in</strong>g the CEX 1980-2000<br />
Cohort D<strong>at</strong>e of birth Age <strong>in</strong> 1980 Age <strong>in</strong> 2000 Average cell size<br />
Interview Diary<br />
1 1970-1974 6-10 26-30 419 210<br />
2 1965-1969 11-15 31-35 594 280<br />
3 1960-1964 16-20 36-40 791 363<br />
4 1955-1959 21-25 41-45 1001 427<br />
5 1950-1954 26-30 46-50 1092 421<br />
6 1945-1949 31-35 51-55 1024 367<br />
7 1940-1944 36-40 56-60 809 293<br />
8 1935-1939 41-45 61-65 663 238<br />
9 1930-1934 46-50 66-70 637 222<br />
10 1925-1929 51-55 71-75 633 227<br />
11 1920-1924 56-60 76-80 591 207<br />
12 1915-1919 61-65 81-85 484 171<br />
13 1910-1914 66-70 86-90 405 139<br />
14 1905-1909 71-75 91-95 290 104<br />
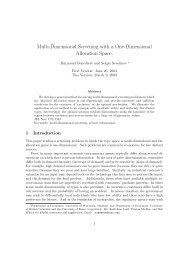
Figure 1 presents cohort age pro…les for total nondurables. Each connected segment represents<br />
the consumption (<strong>in</strong> real terms) of a given cohort, as it is observed from 1980 to 2000.<br />
4
5.8 6 6.2 6.4 6.6 6.8 7 7.2 7.4<br />
5 5.2 5.4 5.6 5.8 6 6.2 6.4 6.6<br />
20 24 28 32 36 40 44 48 52 56 60 64 68 72 76 80<br />
age<br />
20 24 28 32 36 40 44 48 52 56 60 64 68 72 76 80<br />
age<br />
(a) logarithm of nondurables<br />
(b) logarithm of nondurables per<br />
equivalent adult<br />
Figure 1: Cohort age pro…le of nondurable expenditure<br />
Di¤erent cohorts will be observed over di¤erent <strong>in</strong>tervals of their life cycle. Adjacient cohorts<br />
will be observed over overlapp<strong>in</strong>g <strong>in</strong>tervals <strong>at</strong> di¤erent po<strong>in</strong>ts <strong>in</strong> time. Figure 1 (a) shows the<br />
hump shaped pro…le documented <strong>in</strong> previous studies. In Figure 1(b) we de‡<strong>at</strong>e total household<br />
expenditure by the number of adult equivalents, us<strong>in</strong>g the OECD adult equivalence scale (Attanasio,<br />
B<strong>at</strong>tist<strong>in</strong> and Ichimura, 2007). After tak<strong>in</strong>g <strong>in</strong>to account family <strong>com</strong>position, the life<br />
cycle pro…le is much ‡<strong>at</strong>ter.<br />
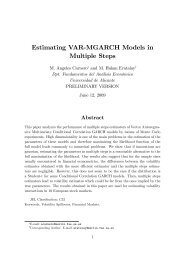
We plot the cohort age pro…le for food expenditure from the Interview and Diary samples <strong>in</strong><br />
Figure 2. In both cases, total food <strong>in</strong>cludes food consumed <strong>at</strong> home and away from home. Figure<br />
2 (a) and Figure 2 (b) were obta<strong>in</strong>ed us<strong>in</strong>g the Interview sample and Figure 2 (c) and Figure 2<br />
(d) the Diary d<strong>at</strong>a.The vertical di¤erences between cohorts appear to be higher when us<strong>in</strong>g the<br />
Interview sample are observed. Also, after correct<strong>in</strong>g for family <strong>com</strong>position the pro…le shows<br />
more vari<strong>at</strong>ion <strong>in</strong> food expenditure than for total nondurables.<br />
The ma<strong>in</strong> purpose of the pro…les reported <strong>in</strong> Figure 1 and 2 for our analysis is to check<br />
whether we can identify sizeable drops <strong>in</strong> consumption after age 60, th<strong>at</strong> is after household heads<br />
start retir<strong>in</strong>g <strong>in</strong> large numbers. Star<strong>in</strong>g <strong>at</strong> Figure 1 and Figure 2, we can observe a smooth drop<br />
for nondurables and total food per equivalent adult after age 60. There are no strong di¤erences<br />
between nondurables and food cohort pro…les.<br />
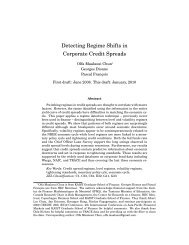
In Figure 3, we analyze the <strong>com</strong>ponents of total food <strong>in</strong> more detail.<br />
Food consumed <strong>at</strong><br />
home obta<strong>in</strong>ed from the Interview and Diary samples is shown <strong>in</strong> Figure 3 (a) and Figure 3<br />
(b), while Food consumed away from home is presented <strong>in</strong> Figure 3 (c) and Figure 3 (d). All<br />
these …gures report consumption per adult equivalent: the left panel refers to Figures from the<br />
Interview survey, while the right -hand side to Diary survey …gures. It is worth highlight<strong>in</strong>g th<strong>at</strong><br />
5
4.6 4.8 5 5.2 5.4 5.6 5.8 6 6.2<br />
4 4.2 4.4 4.6 4.8 5 5.2 5.4<br />
20 24 28 32 36 40 44 48 52 56 60 64 68 72 76 80<br />
age<br />
20 24 28 32 36 40 44 48 52 56 60 64 68 72 76 80<br />
age<br />
(a) logarithm of food us<strong>in</strong>g the Interview<br />
sample<br />
(b) logarithm of food per equivalent adult<br />
us<strong>in</strong>g the Interview sample<br />
4.4 4.6 4.8 5 5.2 5.4 5.6 5.8 6<br />
20 24 28 32 36 40 44 48 52 56 60 64 68 72 76 80<br />
age<br />
3.8 4 4.2 4.4 4.6 4.8 5 5.2 5.4<br />
20 24 28 32 36 40 44 48 52 56 60 64 68 72 76 80<br />
age<br />
(c) logarithm of food us<strong>in</strong>g the Diary<br />
sample<br />
(d) logarithm of food per equivalent adult<br />
us<strong>in</strong>g the Diary sample<br />
Figure 2: Cohort age pro…le of food<br />
some <strong>in</strong>dividuals <strong>in</strong> the sample do not report expenditure of food consumed away from home, so<br />
the cohort pro…le is constructed with the unconditional average expenditure <strong>in</strong>clud<strong>in</strong>g the zeros.<br />
In both samples food out of home shows a clear decl<strong>in</strong>e around retirement age th<strong>at</strong> cont<strong>in</strong>ues<br />
dur<strong>in</strong>g retirement. Food consumed <strong>at</strong> home has a ‡<strong>at</strong>ter pro…le.<br />
In Figure 3 diary d<strong>at</strong>a is <strong>com</strong>pared with recall d<strong>at</strong>a for the same c<strong>at</strong>egories. Diary d<strong>at</strong>a is<br />
<strong>in</strong>tended to provide more accur<strong>at</strong>e <strong>in</strong>form<strong>at</strong>ion on food than the recall d<strong>at</strong>a from the Interview<br />
survey. In both cases, they show similar pro…les valid<strong>at</strong><strong>in</strong>g the use of the <strong>in</strong>terview sample for<br />
the analysis. Moreover, the cohort pro…les suggest th<strong>at</strong> the drop <strong>in</strong> total food around retirement<br />
is ma<strong>in</strong>ly due to the decl<strong>in</strong>e <strong>in</strong> food consumed out of home. Figure 4 presents expenditure per<br />
equivalent adult for other c<strong>at</strong>egories <strong>in</strong>cluded <strong>in</strong> the de…nition of total nondurables.<br />
F<strong>in</strong>ally, <strong>in</strong> Figure 4, we plot the pro…les for di¤erent expenditure c<strong>at</strong>egories. In particular,<br />
<strong>in</strong> Figure 4 (a), we plot household and personal expenditures which <strong>in</strong>cludes utilities, household<br />
ma<strong>in</strong>tenance and repairs, and personal services. This c<strong>at</strong>egory is a <strong>com</strong>plement to leisure, show<strong>in</strong>g<br />
an <strong>in</strong>creas<strong>in</strong>g trend around retirement age. Cloth<strong>in</strong>g and transport<strong>at</strong>ion are shown <strong>in</strong> Figure 4<br />
6
20 40 60 80 100 120 140 160<br />
20 40 60 80 100 120 140 160<br />
20 24 28 32 36 40 44 48 52 56 60 64 68 72 76 80<br />
age<br />
20 24 28 32 36 40 44 48 52 56 60 64 68 72 76 80<br />
age<br />
(a) food <strong>at</strong> home us<strong>in</strong>g the Interview sample<br />
(b) food <strong>at</strong> home us<strong>in</strong>g the Diary sample<br />
10 20 30 40 50 60 70 80 90<br />
20 24 28 32 36 40 44 48 52 56 60 64 68 72 76 80<br />
age<br />
(c) food away us<strong>in</strong>g the Interview sample<br />
10 20 30 40 50 60 70 80 90<br />
20 24 28 32 36 40 44 48 52 56 60 64 68 72 76 80<br />
age<br />
(d) food away us<strong>in</strong>g the Diary sample<br />
Figure 3: Cohort age pro…le of food <strong>at</strong> home and away from home per equivalent<br />
adult<br />
(b) and Figure 4 (c). They are considered work rel<strong>at</strong>ed expenses and present a clear decl<strong>in</strong>e<br />
after age 50. Figure 4 (d) presents enterta<strong>in</strong>ment expenditure which could be a <strong>com</strong>plement to<br />
leisure or work rel<strong>at</strong>ed and shows a decreas<strong>in</strong>g trend. The decl<strong>in</strong>e around retirement age for total<br />
nondurables is ma<strong>in</strong>ly due to the drop <strong>in</strong> food consumed out of home, cloth<strong>in</strong>g, transport<strong>at</strong>ion,<br />
and enterta<strong>in</strong>ment. Household and personal expenditures <strong>in</strong>creases and food consumed <strong>at</strong> home<br />
ma<strong>in</strong>ta<strong>in</strong> constant around retirement age. Aguiar and Hurst (2008) pool<strong>in</strong>g the <strong>in</strong>terview CEX<br />
cross-sectional d<strong>at</strong>a …nd th<strong>at</strong> non-durable and food consumption decl<strong>in</strong>e around retirement age.<br />
They also …nd th<strong>at</strong> other <strong>com</strong>ponents such as transport<strong>at</strong>ion and cloth<strong>in</strong>g decl<strong>in</strong>e, and spend<strong>in</strong>g<br />
on hous<strong>in</strong>g services, utilities, and enterta<strong>in</strong>ment rema<strong>in</strong>s constant or <strong>in</strong>creases slightly.<br />
Hav<strong>in</strong>g documented the ma<strong>in</strong> life cycle trends <strong>in</strong> non durable consumption and some of its<br />
<strong>com</strong>ponents, we now turn to the evidence on particip<strong>at</strong>ion r<strong>at</strong>es, focuss<strong>in</strong>g on household heads.<br />
Figure 5 shows the cohorts labor force particip<strong>at</strong>ion r<strong>at</strong>e, estim<strong>at</strong>ed us<strong>in</strong>g the Interview and<br />
Diary samples.<br />
The vertical di¤erences between cohorts are very small, <strong>in</strong>dic<strong>at</strong><strong>in</strong>g no cohort<br />
e¤ects. The labor force particip<strong>at</strong>ion r<strong>at</strong>e of the Diary sample <strong>in</strong> Figure 5 (b) is similar to the<br />
7
50 100 150 200 250<br />
20 24 28 32 36 40 44 48 52 56 60 64 68 72 76 80<br />
age<br />
10 20 30 40 50 60 70 80<br />
20 24 28 32 36 40 44 48 52 56 60 64 68 72 76 80<br />
age<br />
(a) household and personal services<br />
(b) cloth<strong>in</strong>g<br />
60 80 100 120 140 160 180 200<br />
20 24 28 32 36 40 44 48 52 56 60 64 68 72 76 80<br />
age<br />
10 20 30 40 50 60<br />
20 24 28 32 36 40 44 48 52 56 60 64 68 72 76 80<br />
age<br />
(c) transport<strong>at</strong>ion<br />
(d) enterta<strong>in</strong>ment<br />
Figure 4: Cohort age pro…le of various expenditure c<strong>at</strong>egories per equivalent adult<br />
particip<strong>at</strong>ion r<strong>at</strong>e of the Interview <strong>in</strong> Figure 5 (a). We observe a sharper decl<strong>in</strong>e <strong>in</strong> labor force<br />
particip<strong>at</strong>ion from age 60 to 65.<br />
It is worth notic<strong>in</strong>g th<strong>at</strong> <strong>in</strong> the Interview and Diary samples, some <strong>in</strong>dividuals retire dur<strong>in</strong>g<br />
their …fties as observed <strong>in</strong> Figure 5. The l<strong>at</strong>ter is due to speci…c <strong>in</strong>centives to claim a pension<br />
from occup<strong>at</strong>ional pension schemes and <strong>in</strong>voluntary retirement decisions as a result of neg<strong>at</strong>ive<br />
shocks. Rust and Phelan (1997) …nd th<strong>at</strong> unhealthy <strong>in</strong>dividuals are more than twice likely to<br />
apply for a pension <strong>at</strong> the early retirement age. They also show th<strong>at</strong> most of <strong>in</strong>dividuals retire<br />
<strong>at</strong> age 62 and 65.<br />
Accord<strong>in</strong>g to US Social Security rules, early retirement is possible <strong>at</strong> age 62 and the normal<br />
retirement age is 65.<br />
The early retirement pension represents 80% of the normal retirement<br />
bene…ts. Individuals have <strong>in</strong>centives to reach the normal retirement age because the <strong>in</strong>crease<br />
<strong>in</strong> bene…ts is actuarially fair (Diamond and Gruber, 1999). The pension is <strong>com</strong>puted with the<br />
average wage of the highest 35 years of the worker career (AIME). Pensions are adjusted with<br />
the Consumers Price Index (CPI). Also, most of workers <strong>in</strong> the US are covered by social security<br />
and a grow<strong>in</strong>g number have personal or occup<strong>at</strong>ional pensions.<br />
8
0 .2 .4 .6 .8 1<br />
0 .2 .4 .6 .8 1<br />
40 44 48 52 56 60<br />
age<br />
64 68 72 76 80<br />
40 44 48 52 56 60 64 68 72 76 80<br />
age<br />
(a) labor force particip<strong>at</strong>ion r<strong>at</strong>e us<strong>in</strong>g the<br />
(b) labor force particip<strong>at</strong>ion r<strong>at</strong>e us<strong>in</strong>g the<br />
Interview sample<br />
Diary sample<br />
Figure 5: Labor force particip<strong>at</strong>ion r<strong>at</strong>e<br />
While the …gures we reported so far conta<strong>in</strong> raw cohort means, it may be worth putt<strong>in</strong>g<br />
some structure on the d<strong>at</strong>a to try to identify age pro…les. We therefore proceed to smooth the<br />
observed pro…les by assum<strong>in</strong>g no system<strong>at</strong>ic time e¤ects and some simple cohort e¤ects. We then<br />
estim<strong>at</strong>e smooth age pro…les for consumption and its <strong>com</strong>ponentes (and for particip<strong>at</strong>ion r<strong>at</strong>es)<br />
us<strong>in</strong>g OLS. We report the smoothed pro…le <strong>in</strong> Figure 6. The decl<strong>in</strong>e <strong>in</strong> food consumed out of<br />
home, transport, and cloth<strong>in</strong>g co<strong>in</strong>cides with the drop we observe <strong>in</strong> the labor force particip<strong>at</strong>ion<br />
r<strong>at</strong>e <strong>in</strong> Figure 5. Household and personal services have an <strong>in</strong>creas<strong>in</strong>g trend. Total food and food<br />
consumed <strong>at</strong> home starts decl<strong>in</strong><strong>in</strong>g l<strong>at</strong>er <strong>in</strong> the life cycle after age 62.<br />
200<br />
180<br />
160<br />
140<br />
120<br />
100<br />
80<br />
60<br />
40<br />
20<br />
0<br />
40 42 44 46 48 50 52 54 56 58 60 62 64 66 68 70 72 74 76 78 80<br />
food<br />
food out of home<br />
household and personal services<br />
cloth<strong>in</strong>g<br />
food <strong>at</strong> home<br />
enterta<strong>in</strong>ment<br />
transport<strong>at</strong>ion<br />
Figure 6: Smoothed pro…les of the ma<strong>in</strong> expenditure c<strong>at</strong>egories<br />
In sum, food away from home clearly decl<strong>in</strong>es more than food <strong>at</strong> home. The smooth drop <strong>in</strong><br />
total nondurables is driven by the decl<strong>in</strong>e <strong>in</strong> cloth<strong>in</strong>g, transport and food out of home which are<br />
work rel<strong>at</strong>ed expenses. Household and personal services th<strong>at</strong> are <strong>com</strong>plements to leisure do not<br />
decl<strong>in</strong>e around retirement age. Food consumed <strong>at</strong> home has a smoother decreas<strong>in</strong>g p<strong>at</strong>tern. In<br />
9
the follow<strong>in</strong>g section, the analysis will only focus <strong>in</strong> the Interview sample. The Interview recall<br />
questions for food are <strong>com</strong>parable to the food questions <strong>in</strong> the HRS, RHS and the PSID d<strong>at</strong>a<br />
sets used <strong>in</strong> previous studies.<br />
3 Empirical <strong>Evidence</strong> us<strong>in</strong>g Longitud<strong>in</strong>al D<strong>at</strong>a<br />
In the sample, we …rst observe an <strong>in</strong>dividual (and his/her retirement st<strong>at</strong>us) <strong>in</strong> the …rst of the<br />
four available <strong>in</strong>terviews. The retirement st<strong>at</strong>us is observed aga<strong>in</strong> n<strong>in</strong>e months l<strong>at</strong>er. We have<br />
similar observ<strong>at</strong>ions for all the adults <strong>in</strong> the households, <strong>in</strong>clud<strong>in</strong>g the household head’s spouse.<br />
We can therefore observe the transition <strong>in</strong>to retirement.<br />
Individuals <strong>in</strong> the sample are classi…ed accord<strong>in</strong>g to their labor st<strong>at</strong>us given their number of<br />
work<strong>in</strong>g hours <strong>in</strong> full-time or part-time and retired. We de…ne full-time work for those with more<br />
than 1,500 hours per year and 52 weeks. Part-time work is de…ned as those work<strong>in</strong>g between<br />
500 and 1,500 hours per year and 52 weeks. 3<br />
Several di¤erent de…nitions of retirement are possible. We could de…ne as retired an <strong>in</strong>dividual<br />
who works less than 500 hours per year, or an <strong>in</strong>dividual who receives a pension or an <strong>in</strong>dividual<br />
who declares himself or herself retired. We chose the …rst de…nition, as used by Bernheim, Sk<strong>in</strong>ner<br />
and We<strong>in</strong>berg (2001). However, below we also check the robustness of our results when we use<br />
an altern<strong>at</strong>ive de…nition. Our sample <strong>in</strong>cludes 750 households th<strong>at</strong> transition from work<strong>in</strong>g to<br />
retirement between 50 to 74 years old. It is worth stress<strong>in</strong>g th<strong>at</strong> retirement is far from be<strong>in</strong>g a<br />
…nal st<strong>at</strong>e: we also observe <strong>in</strong>dividuals transit<strong>in</strong>g from retirement to work. The sample <strong>in</strong>cludes<br />
232 head of household th<strong>at</strong> re-enter the labor market.<br />
Head of households th<strong>at</strong> transition from full-time work to retirement represent 89 percent<br />
of the sample. This is consistent with previous empirical evidence th<strong>at</strong> most workers transition<br />
from full-time jobs to retirement as a result of labor market rigidities (Rust and Phelan, 1997).<br />
It is easier to change jobs than to reduce the number of work<strong>in</strong>g hours <strong>in</strong> the current work before<br />
retirement. 4<br />
Also, workers have <strong>in</strong>centives to cont<strong>in</strong>ue with the same number of work<strong>in</strong>g hours<br />
because many De…ned Bene…t occup<strong>at</strong>ional pension schemes are …nal salary.<br />
3 We use the same de…nitions as <strong>in</strong> Bernheim, Sk<strong>in</strong>ner and We<strong>in</strong>berg (2001). Labor st<strong>at</strong>us questions are<br />
only <strong>in</strong>cluded <strong>in</strong> the …rst and last <strong>in</strong>terviews. The response <strong>in</strong> the last <strong>in</strong>terview has an overlapp<strong>in</strong>g period th<strong>at</strong><br />
corresponds to the last quarter of the …rst <strong>in</strong>terview response. Unemployment spells do not a¤ect our classi…c<strong>at</strong>ions<br />
because we only <strong>in</strong>clude <strong>in</strong>dividuals work<strong>in</strong>g full-time or part-time or retired <strong>in</strong> the …rst period and last period.<br />
A detailed description of this classi…c<strong>at</strong>ion is presented <strong>in</strong> the Appendix.<br />
4 An issue th<strong>at</strong> cannot be addressed with this d<strong>at</strong>a set is whether newly retirees move to another city or town<br />
10
logarithm of nondurables<br />
6.25<br />
6.20<br />
6.15<br />
6.10<br />
6.05<br />
6.00<br />
5.95<br />
5.90<br />
5.85<br />
5.10<br />
5.05<br />
5.00<br />
4.95<br />
4.90<br />
4.85<br />
quarter 2<br />
quarter 1<br />
retirement<br />
quarter 1<br />
quarter 2<br />
quarter 2<br />
quarter 1<br />
retirement<br />
quarter 1<br />
quarter 2<br />
logarithm of total food<br />
w/w/nw/nw<br />
w/nw/nw/nw<br />
w/w/nw/nw<br />
w/nw/nw/nw<br />
(a) logarithm of nondurables<br />
(b) logarithm of total food<br />
Note: The signi…cance test F-tests p-value for work<strong>in</strong>g (w)/w/not work<strong>in</strong>g (nw)/nw of nondurable<br />
expenditure between quarter -2 and quarter 1 is 0.5262, and quarter -1 and quarter 1 is 0.4824,<br />
and for w/nw/nw/nw nondurable expenditure between quarter -1 and quarter 2 is 0.4185, and quarter<br />
-1 and quarter 1 is 0.2216. The signi…cance test F-tests p-value for w/w/nw/nw food expenditure<br />
between quarter -2 and quarter 1 is 0.0457, and quarter -1 and quarter 1 is 0.0482, and for w/nw/nw/nw<br />
food expenditure between quarter -1 and quarter 2 is 0.0112, and quarter -1 and quarter 1 is 0.0203.<br />
Figure 7: Expenditure c<strong>at</strong>egories adjusted with equivalence scales around retirement us<strong>in</strong>g the<br />
panel structure of the CEX<br />
Figure 1 shows the average household expenditure two quarters before and two quarters after<br />
the head of family retires. Figure 1(a) shows average nondurable expenditure and Figure 1(b)<br />
presents average total food expenses. We <strong>in</strong>cluded <strong>in</strong>dividuals who were work<strong>in</strong>g two quarters<br />
before retirement, retire, and then we observe one quarter after retirement (w=w=nw=nw). Other<br />
group <strong>in</strong>cluded is those th<strong>at</strong> transition from work<strong>in</strong>g to retirement but we observe them one<br />
quarter before retirement and two quarters after retirement (w=nw=nw=nw).<br />
Nondurable expenditure drops <strong>in</strong> average by 4 percent between quarter -1 and quarter 1. Total<br />
food decl<strong>in</strong>es by 5.3 percent <strong>in</strong> average between quarter -1 and quarter 1. The signi…cance F-tests<br />
where the null hypothesis is th<strong>at</strong> quarter -1 is equal to quarter 1 for nondurable expenditure is<br />
not rejected. This suggests th<strong>at</strong> there is no change <strong>in</strong> nondurable consumption when the head<br />
of household transitions from work<strong>in</strong>g to retirement. In contrast, the signi…cance F-tests null<br />
hypothesis is rejected for total food expenses. This may <strong>in</strong>dic<strong>at</strong>e a change <strong>in</strong> food expenditure<br />
around retirement.<br />
Figure 2 shows the hazard or exit r<strong>at</strong>e for head of households. We can observe a peak <strong>at</strong> age<br />
62. The l<strong>at</strong>ter co<strong>in</strong>cides with eligibility for early retirement. There is also a higher peak around<br />
age 65 which co<strong>in</strong>cides with normal retirement.<br />
The hazard r<strong>at</strong>e is consistent with previous<br />
…nd<strong>in</strong>gs us<strong>in</strong>g the Current Popul<strong>at</strong>ion Survey (CPS) reported <strong>in</strong> Diamond and Gruber (1999).<br />
where they can a¤ord a higher liv<strong>in</strong>g standard, spend<strong>in</strong>g less of their budget. The CEX does not follow <strong>in</strong>dividuals<br />
when they move address.<br />
11
.35<br />
Exit R<strong>at</strong>e<br />
0 .05 .1 .15 .2<br />
.25 .3<br />
45 47 49 51 53 55 57 59 61 63 65<br />
67 69 71 73<br />
age<br />
Figure 8: Exit r<strong>at</strong>e for head of households<br />
The follow<strong>in</strong>g section presents a simple empirical method to analyze consumption p<strong>at</strong>terns for<br />
di¤erent labor market transitions around retirement age.<br />
3.1 Simple Empirical Framework<br />
We use a simple regression method to capture the change <strong>in</strong> household consumption around<br />
retirement age. The model is estim<strong>at</strong>ed with<strong>in</strong> a l<strong>in</strong>ear di¤erence-<strong>in</strong>-di¤erences approach:<br />
ln C = I + G + T + X + u (1)<br />
G is a stacked m<strong>at</strong>rix NT k and k is the total number of variables. The m<strong>at</strong>rix G <strong>in</strong>cludes<br />
dummy variables for each group j of households accord<strong>in</strong>g to their labor st<strong>at</strong>us <strong>in</strong> the …rst and<br />
last <strong>in</strong>terview. Labor st<strong>at</strong>us questions are only applied <strong>in</strong> the …rst and last <strong>in</strong>terview of the panel<br />
span, thus we <strong>in</strong>clude only households th<strong>at</strong> <strong>com</strong>pleted <strong>at</strong> least the …rst and last <strong>in</strong>terviews. The<br />
group j has four options of labor st<strong>at</strong>us: 11 <strong>in</strong>dic<strong>at</strong>es the head of household is work<strong>in</strong>g <strong>in</strong> both<br />
<strong>in</strong>terviews and this is the benchmark, 00 is not work<strong>in</strong>g <strong>in</strong> both <strong>in</strong>terviews, 01 is not work<strong>in</strong>g <strong>in</strong><br />
the …rst <strong>in</strong>terview and work<strong>in</strong>g <strong>in</strong> the last <strong>in</strong>terview, and 10 are households th<strong>at</strong> transition from<br />
work<strong>in</strong>g to retirement. Households <strong>in</strong> the 10 c<strong>at</strong>egory exit the labor market dur<strong>in</strong>g the second<br />
and third <strong>in</strong>terview. Household consumption is analyzed just before retirement th<strong>at</strong> corresponds<br />
to the …rst <strong>in</strong>terview, and after retirement which is the last <strong>in</strong>terview.<br />
I is a dummy variable th<strong>at</strong> <strong>in</strong>dic<strong>at</strong>es the <strong>in</strong>terview period, the …rst or last <strong>in</strong>terview of<br />
household i. In this case, the last <strong>in</strong>terview has value one and the …rst <strong>in</strong>terview value zero. The<br />
m<strong>at</strong>rix T <strong>in</strong>cludes the <strong>in</strong>teraction terms (I G) and show the marg<strong>in</strong>al e¤ect on consumption<br />
12
for each group j with respect to the households whose head worked dur<strong>in</strong>g all the panel span<br />
(j = 11). In particular, the estim<strong>at</strong>e for group j = 10 is the parameter of <strong>in</strong>terest to analyze<br />
changes <strong>in</strong> consumption for transitions from employment to retirement.<br />
The model <strong>in</strong>cludes<br />
a m<strong>at</strong>rix X of household demographic characteristics and time dummies.<br />
The demographic<br />
characteristics are head of household age, age squared, family size, number of children under 18<br />
years old, and a dummy <strong>in</strong>dic<strong>at</strong><strong>in</strong>g couples households.<br />
The limit<strong>at</strong>ion is th<strong>at</strong> this simple method does not dist<strong>in</strong>guish between unexpected shocks and<br />
expected changes. Unexpected events such as health shocks could a¤ect labor supply decisions<br />
and consumption p<strong>at</strong>terns. Unfortun<strong>at</strong>ely, health st<strong>at</strong>us is not reported <strong>in</strong> the CEX and health<br />
expenditure might not be an accur<strong>at</strong>e measure because of di¤erences on health care <strong>in</strong>surance<br />
coverage. An altern<strong>at</strong>ive is to estim<strong>at</strong>e the impact on consumption around retirement age with<br />
Instrumental Variables methods (IV). In this case T = 2 and IV methods cannot be used.<br />
However, previous studies have found th<strong>at</strong> health problems account for a small proportion of<br />
<strong>in</strong>dividuals’retirement decisions. French (2005) …nds th<strong>at</strong> health has a small e¤ect expla<strong>in</strong><strong>in</strong>g<br />
the decl<strong>in</strong>e of labor force particip<strong>at</strong>ion around retirement age.<br />
Us<strong>in</strong>g the PSID, labor force<br />
particip<strong>at</strong>ion decreases by 71 percent between age 55 and 70, bad health expla<strong>in</strong>s only 7 percent<br />
of this decl<strong>in</strong>e. Hurd and Rohwedder (2006) us<strong>in</strong>g the HRS …nd th<strong>at</strong> for 66 percent of <strong>in</strong>dividuals,<br />
health was not a factor th<strong>at</strong> <strong>in</strong>‡uenced their retirement decision. The PSID and HRS th<strong>at</strong> are<br />
the ma<strong>in</strong> panel surveys to analyze retirement behavior, <strong>in</strong>dic<strong>at</strong>e a small proportion of <strong>in</strong>dividuals<br />
retire due to health problems.<br />
3.2 Results<br />
This section presents the results of the simple regression method discussed above. Table 1 shows<br />
the results of the change <strong>in</strong> consumption around retirement age. The sample <strong>in</strong>cludes s<strong>in</strong>gles<br />
and couples households. The reference is head of households th<strong>at</strong> stayed work<strong>in</strong>g dur<strong>in</strong>g the four<br />
<strong>in</strong>terviews (G 11 ). The regressions also <strong>in</strong>clude household demographic characteristics, age and<br />
age squared of the head of household, a dummy to <strong>in</strong>dic<strong>at</strong>e a couple or s<strong>in</strong>gle household, and<br />
time dummies.<br />
The ma<strong>in</strong> …nd<strong>in</strong>g for those <strong>in</strong>dividuals who retire dur<strong>in</strong>g the panel span (G 10 ) is no e¤ect on<br />
nondurable expenditure. The l<strong>at</strong>ter suggests th<strong>at</strong> <strong>in</strong>dividuals smooth consumption <strong>at</strong> retirement.<br />
In a further analysis divid<strong>in</strong>g nondurables <strong>in</strong> food and non-food expenditure, we …nd th<strong>at</strong> food<br />
decl<strong>in</strong>es by 6 percent and there is no e¤ect on non-food nondurables but the coe¢ cient has a<br />
13
Table 2: Impact on consumption around retirement <strong>in</strong>clud<strong>in</strong>g s<strong>in</strong>gle and couple<br />
households<br />
Nondurables Total food Food <strong>at</strong> home<br />
Non-food<br />
nondurables<br />
I G 00 0.0303 0.0372 0.0284 0.0279<br />
[0.0100**] [0.0106**] [0.0103**] [0.0129**]<br />
I G 01 0.0141 0.0458 0.0625 0.0033<br />
[0.0373] [0.0374] [0.0365*] [0.0497]<br />
I G 10 -0.0070 -0.0608 -0.0452 0.0112<br />
[0.0216] [0.0229**] [0.0246*] [0.0279]<br />
No. observ<strong>at</strong>ions 25,960 25,960 25,960 25,960<br />
**estim<strong>at</strong>es are signi…cant <strong>at</strong> 5 percent level of con…dence. *estim<strong>at</strong>es are signi…cant <strong>at</strong> 10<br />
percent level of con…dence. I is a dummy th<strong>at</strong> <strong>in</strong>dic<strong>at</strong>es the last <strong>in</strong>terview period. G j are<br />
labor st<strong>at</strong>us classi…c<strong>at</strong>ions <strong>in</strong> the …rst and last <strong>in</strong>terview. 11 are those work<strong>in</strong>g, which is<br />
the benchmark, 00 for those retired, 01 for those th<strong>at</strong> re-enter the labor market, and 10 for<br />
households th<strong>at</strong> transition from work<strong>in</strong>g to retirement. Regressions also <strong>in</strong>clude dummy<br />
variables for year, month and their <strong>in</strong>teractions, age, age squared, family size, an<br />
<strong>in</strong>dic<strong>at</strong>or for children under 18 years old, an <strong>in</strong>dic<strong>at</strong>or for couple, a dummy for last<br />
<strong>in</strong>terview, and the group dummies for the head of household labor st<strong>at</strong>us. The standard<br />
errors are robust to heteroskedasticity corrected with the Huber-White method and serial<br />
correl<strong>at</strong>ion with<strong>in</strong> households.<br />
positive sign. In this study, we …nd a drop <strong>in</strong> food expenditure as many of the previous studies<br />
for the U.S. have documented as the retirement consumption puzzle. We show th<strong>at</strong> a broader<br />
measure of nondurables expenditure <strong>in</strong>dic<strong>at</strong>es a smooth change <strong>in</strong> consumption <strong>at</strong> retirement<br />
consistent with the Life Cycle model predictions.<br />
The drop <strong>in</strong> food consumption could be expla<strong>in</strong>ed by a realloc<strong>at</strong>ion of expenses with<strong>in</strong> the<br />
household budget due to the decl<strong>in</strong>e <strong>in</strong> work rel<strong>at</strong>ed expenses and more time available for home<br />
production. Food is only one of the <strong>com</strong>ponents to approxim<strong>at</strong>e consumption as it represents 32<br />
percent of nondurable expenditure. Other <strong>com</strong>ponents of nondurable expenditure are <strong>in</strong>creas<strong>in</strong>g,<br />
which o¤sets the drop <strong>in</strong> food expenses. We conclude from these results th<strong>at</strong> there is no retirement<br />
consumption puzzle.<br />
When analyz<strong>in</strong>g food expenses <strong>in</strong> detail, we …nd th<strong>at</strong> food consumed <strong>at</strong> home drops by 4.5<br />
percent. Food <strong>at</strong> home is 72 percent of total food imply<strong>in</strong>g th<strong>at</strong> both <strong>com</strong>ponents of food <strong>at</strong> home<br />
and away from home are decl<strong>in</strong><strong>in</strong>g <strong>at</strong> retirement. It is beyond the scope of this study to provide<br />
an explan<strong>at</strong>ion for decl<strong>in</strong>e <strong>in</strong> food expenditure.<br />
Previous evidence suggests th<strong>at</strong> <strong>in</strong>dividuals<br />
spend more time on home production dur<strong>in</strong>g retirement (Hurd and Rohwedder, 2005). Aguiar<br />
and Hurst (2005) show th<strong>at</strong> food <strong>in</strong>take does not change after retirement but food expenses<br />
decl<strong>in</strong>e and time spent on home production <strong>in</strong>creases.<br />
Persons around retirement age spend<br />
longer periods shopp<strong>in</strong>g, shop more frequently, and use discounts more often (Aguiar and Hurst,<br />
2007).<br />
For <strong>in</strong>dividuals who re-enter the labor market (G 01 ) <strong>in</strong> <strong>com</strong>parison to those who stay work<strong>in</strong>g<br />
14
(G 11 ) the coe¢ cients have a positive sign as expected and the <strong>in</strong>crease <strong>in</strong> expenditure is higher<br />
<strong>in</strong> food than <strong>in</strong> non-food nondurables. Table 4 presents the <strong>com</strong>plete results of the speci…c<strong>at</strong>ion<br />
<strong>in</strong> Table 1.<br />
We observe an <strong>in</strong>crease <strong>in</strong> consumption for an additional household member, a<br />
higher expenditure for couple households than for s<strong>in</strong>gles, and a decl<strong>in</strong>e <strong>in</strong> nondurable household<br />
expenditure for another children under 18 years old. 5<br />
For group G 11 we …nd an average change <strong>in</strong> <strong>in</strong><strong>com</strong>e by 3.15 percent, for G 10 is -18.2 percent,<br />
and for G 01 is 18.7 percent. As expected, those who stay work<strong>in</strong>g dur<strong>in</strong>g all the period of<br />
observ<strong>at</strong>ion show a modest change <strong>in</strong> <strong>in</strong><strong>com</strong>e. The <strong>in</strong><strong>com</strong>e of those who retire decreases substantially,<br />
and there is an <strong>in</strong>crease <strong>in</strong> household earn<strong>in</strong>gs for those <strong>in</strong>dividuals who re-enter the labor<br />
market.<br />
For the group th<strong>at</strong> was not work<strong>in</strong>g dur<strong>in</strong>g all the time observed (G 00 ), we …nd an <strong>in</strong>crease by<br />
3 percent on nondurable expenditure. They also show an <strong>in</strong>crease <strong>in</strong> food by 3.7 percent and <strong>in</strong><br />
non-food nondurables by 2.7 percent. In th<strong>at</strong> case we …nd th<strong>at</strong> some households start receiv<strong>in</strong>g<br />
<strong>in</strong> the last period of observ<strong>at</strong>ion social security bene…ts, supplemental security <strong>in</strong><strong>com</strong>e (SSI),<br />
unemployment or other worker’s <strong>com</strong>pens<strong>at</strong>ions, priv<strong>at</strong>e pensions, food stamps, or other welfare<br />
bene…ts. We obta<strong>in</strong> th<strong>at</strong> 51.9 percent of G 00 ma<strong>in</strong>ly between age 62 and 68, start receiv<strong>in</strong>g <strong>in</strong> the<br />
last <strong>in</strong>terview social security bene…ts or other <strong>com</strong>pens<strong>at</strong>ions. The average <strong>in</strong>crease <strong>in</strong> <strong>in</strong><strong>com</strong>e<br />
between the …rst and last <strong>in</strong>terview for group G 00 is 4.8 percent, and for those <strong>in</strong>dividuals <strong>in</strong><br />
group G 00 th<strong>at</strong> start obta<strong>in</strong><strong>in</strong>g bene…ts <strong>in</strong> the last <strong>in</strong>terview is 43.8 percent.<br />
Some of these<br />
<strong>in</strong>dividuals might have retired early as a result of employer-provided pension <strong>in</strong>centives, and<br />
subsequently started claim<strong>in</strong>g social security bene…ts or other welfare <strong>com</strong>pens<strong>at</strong>ions.<br />
The results <strong>in</strong> Table 2 <strong>in</strong>clude only couples and take <strong>in</strong>to account hours of leisure of the<br />
wife. The …nd<strong>in</strong>gs <strong>in</strong> Table 2 follow the same tendency as the estim<strong>at</strong>ions <strong>in</strong>clud<strong>in</strong>g s<strong>in</strong>gles. For<br />
those households whose husband transitions from employment to retirement, there is no e¤ect<br />
on nondurables and non-food nondurables.<br />
Food drops by 5.4 percent and food <strong>at</strong> home by<br />
5.0 percent. The <strong>in</strong>crease <strong>in</strong> hours of leisure of the wife, decreases expenditure on nondurables,<br />
non-food nondurables and total food but there is no e¤ect on food <strong>at</strong> home. The estim<strong>at</strong>es have<br />
the expected sign as more leisure of the wife may substitute food out of home and other expenses.<br />
5 Table 4 also shows a lower level of nondurable consumption for the groups G 00 , G 01 , and G 10 with respect to<br />
G 11 and this may be expla<strong>in</strong>ed by early retirement or lower labor <strong>at</strong>tachment th<strong>at</strong> causes lower lifetime <strong>in</strong><strong>com</strong>e.<br />
The level of nondurable consumption is lower for G 00 , and G 01 than for G 10 because only a portion of these<br />
<strong>in</strong>dividuals are early retirees.<br />
15
Table 3: Impact on consumption around retirement <strong>in</strong>clud<strong>in</strong>g couple households<br />
Nondurables Total food Food <strong>at</strong> home<br />
Non-food<br />
nondurables<br />
I G 00 0.0261 0.0317 0.0250 0.0232<br />
[0.0108**] [0.0111**] [0.0109**] [0.0139*]<br />
I G 01 -0.0085 0.0370 0.0555 -0.0276<br />
[0.0391] [0.0400] [0.0388] [0.0520]<br />
I G 10 -0.0056 -0.0543 -0.0505 0.0131<br />
[0.0226] [0.0244**] [0.0246**] [0.0293]<br />
No. observ<strong>at</strong>ions 21,682 21,682 21,682 21,682<br />
**estim<strong>at</strong>es are signi…cant <strong>at</strong> 5 percent level of con…dence. *estim<strong>at</strong>es are signi…cant <strong>at</strong><br />
10 percent level of con…dence. I is a dummy th<strong>at</strong> <strong>in</strong>dic<strong>at</strong>es the last <strong>in</strong>terview period. G j<br />
are labor st<strong>at</strong>us classi…c<strong>at</strong>ions <strong>in</strong> the …rst and last <strong>in</strong>terview. 11 are those work<strong>in</strong>g, which<br />
is the benchmark, 00 for those retired, 01 for those th<strong>at</strong> re-enter the labor market, and 10<br />
for households th<strong>at</strong> transition from work<strong>in</strong>g to retirement. Regressions also <strong>in</strong>clude<br />
dummy variables for year, month and their <strong>in</strong>teractions, age, age squared, family size,<br />
an <strong>in</strong>dic<strong>at</strong>or for children under 18 years old, wife hours of leisure, the di¤erence<br />
between the age of the head and the age of the wife, a dummy for last <strong>in</strong>terview, and<br />
the group dummies for the head of household labor st<strong>at</strong>us. The standard errors are robust<br />
to heteroskedasticity corrected with the Huber-White method and serial correl<strong>at</strong>ion<br />
with<strong>in</strong> households.<br />
In order to explore <strong>in</strong> more detail the results <strong>in</strong> Table 1, we estim<strong>at</strong>ed th<strong>at</strong> speci…c<strong>at</strong>ion<br />
exclud<strong>in</strong>g from group G 00 those <strong>in</strong>dividuals who start receiv<strong>in</strong>g <strong>in</strong> the last period a social security<br />
bene…t or any other welfare <strong>com</strong>pens<strong>at</strong>ion. These results are presented <strong>in</strong> Table 3. As<br />
expected, the …nd<strong>in</strong>gs are no change <strong>in</strong> nondurable expenditure or none of its <strong>com</strong>ponents around<br />
retirement.<br />
Table 4: Impact on consumption around retirement exclud<strong>in</strong>g <strong>in</strong>dividuals th<strong>at</strong> receive<br />
any welfare <strong>com</strong>pens<strong>at</strong>ions <strong>in</strong> the last <strong>in</strong>terview<br />
Nondurables Total food Food <strong>at</strong> home<br />
Non-food<br />
nondurables<br />
I G 00 -0.0022 0.0186 0.0195 -0.0134<br />
[0.0127] [0.0132] [0.0132] [0.0164]<br />
I G 01 0.0150 0.0461 0.0621 0.0037<br />
[0.0374] [0.0376] [0.0365*] [0.0497]<br />
I G 10 -0.0076 -0.0615 -0.0464 0.0107<br />
[0.0216] [0.0229**] [0.0246*] [0.0279]<br />
No. observ<strong>at</strong>ions 20,236 20,236 20,236 20,236<br />
**estim<strong>at</strong>es are signi…cant <strong>at</strong> 5 percent level of con…dence. *estim<strong>at</strong>es are signi…cant <strong>at</strong> 10 percent<br />
level of con…dence. I is a dummy th<strong>at</strong> <strong>in</strong>dic<strong>at</strong>es the last <strong>in</strong>terview period. G j are labor st<strong>at</strong>us<br />
classi…c<strong>at</strong>ions <strong>in</strong> the …rst and last <strong>in</strong>terview. 11 are those work<strong>in</strong>g, which is the benchmark, 00<br />
for those retired, 01 for those th<strong>at</strong> re-enter the labor market, and 10 for households th<strong>at</strong> transition<br />
from work<strong>in</strong>g to retirement. Regressions also <strong>in</strong>clude dummy variables for year, month and their<br />
<strong>in</strong>teractions, age, age squared, family size, an <strong>in</strong>dic<strong>at</strong>or for children under 18 years old, an<br />
<strong>in</strong>dic<strong>at</strong>or for couple, a dummy for last <strong>in</strong>terview, and the group dummies for the head of<br />
household labor st<strong>at</strong>us. The standard errors are robust to heteroskedasticity corrected with the<br />
Huber-White method and serial correl<strong>at</strong>ion with<strong>in</strong> households.<br />
In this study, we can test whether the results about the retirement consumption puzzle of<br />
previous studies depend on their period of analysis because we use panel d<strong>at</strong>a from 1980 to<br />
2000. We can <strong>com</strong>pare our results to the …rst studies, Banks, Blundell and Tanner (1998) and<br />
16
Bernheim, Sk<strong>in</strong>ner and We<strong>in</strong>berg (2001), by us<strong>in</strong>g d<strong>at</strong>a from the 1980s as well as more recent<br />
liter<strong>at</strong>ure present<strong>in</strong>g evidence from the 1990s. The l<strong>at</strong>ter allows us to test whether results change<br />
due to the di¤erent economic conditions newly retired <strong>in</strong>dividuals were fac<strong>in</strong>g <strong>in</strong> the 1980s and<br />
the 1990s.<br />
We estim<strong>at</strong>ed the regression model for s<strong>in</strong>gles and couples as <strong>in</strong> Table 1 and for couples as <strong>in</strong><br />
Table 3, for the periods 1980 to 1989 and 1990 to 2000. Our results are <strong>in</strong>variant to the period of<br />
the 1980s and 1990s, where retirees faced di¤erent economic conditions. There is no st<strong>at</strong>istically<br />
signi…cant change <strong>in</strong> nondurable consumption for households with a retir<strong>in</strong>g member. In the case<br />
of total food and food <strong>at</strong> home, we …nd our results do not change dur<strong>in</strong>g the 1980s or 1990s.<br />
We …nd a neg<strong>at</strong>ive estim<strong>at</strong>e, <strong>in</strong>dic<strong>at</strong><strong>in</strong>g a drop <strong>in</strong> total food and food <strong>at</strong> home consumption for<br />
households with <strong>at</strong> least one member transitions to retirement. Some of these estim<strong>at</strong>es are not<br />
st<strong>at</strong>istically signi…cant but show a decl<strong>in</strong>e with similar magnitudes to our estim<strong>at</strong>es <strong>in</strong> Table 1<br />
and Table 3. These results are shown <strong>in</strong> Table 7 of the Appendix.<br />
Furthermore, we <strong>com</strong>puted the distribution of the change <strong>in</strong> the logarithm of nondurable<br />
consumption for those <strong>in</strong>dividuals who transition from work<strong>in</strong>g to retirement. We …nd th<strong>at</strong> the<br />
25th percentile drops consumption by 35.9 percent. Hence, the CEX <strong>in</strong>dic<strong>at</strong>es th<strong>at</strong> 25 percent<br />
of the people decl<strong>in</strong>e their consumption by more than 35 percent when they retire. Our …nd<strong>in</strong>g<br />
is similar to Hurst (2004), where 20 percent of the people do not plan adequ<strong>at</strong>ely for retirement,<br />
around 20 percent are "grasshoppers" and 80 percent "ants". Bernheim, Sk<strong>in</strong>ner, and We<strong>in</strong>berg<br />
(2001) found a signi…cant drop <strong>in</strong> consumption <strong>at</strong> retirement reach<strong>in</strong>g even the 50th percentile.<br />
4 Discussion<br />
There are several possible <strong>in</strong>terpret<strong>at</strong>ions of the retirement consumption puzzle as discussed <strong>in</strong><br />
Banks, Blundell and Tanner (1998). The …rst is th<strong>at</strong> <strong>in</strong>dividuals are myopic and fail to secure<br />
su¢ cient …nancial resources for the expected drop <strong>in</strong> <strong>in</strong><strong>com</strong>e associ<strong>at</strong>ed with retirement.<br />
A<br />
second and very di¤erent <strong>in</strong>terpret<strong>at</strong>ion is th<strong>at</strong> measured consumption determ<strong>in</strong>es utility not on<br />
its own, but <strong>in</strong>teracted with several other variables, <strong>in</strong>clud<strong>in</strong>g labor supply. If consumption and<br />
leisure are not separable <strong>in</strong> the utility function, then the <strong>in</strong>crease <strong>in</strong> leisure time associ<strong>at</strong>ed with<br />
retirement could be beh<strong>in</strong>d the drop <strong>in</strong> consumption. Consumers are not supposed to smooth<br />
consumption but marg<strong>in</strong>al utility. If this depends on leisure, changes <strong>in</strong> labor supply will be<br />
l<strong>in</strong>ked to changes <strong>in</strong> consumption. Banks, Blundell and Tanner (1998) try to address this issue<br />
17
y us<strong>in</strong>g preferences estim<strong>at</strong>ed from an Euler equ<strong>at</strong>ion on consumption. They identify changes<br />
<strong>in</strong> marg<strong>in</strong>al utility <strong>in</strong>duced by drops <strong>in</strong> labor supply by us<strong>in</strong>g <strong>in</strong>form<strong>at</strong>ion on consumption dur<strong>in</strong>g<br />
unemployment spells. They conclude th<strong>at</strong> changes <strong>in</strong> hours worked can expla<strong>in</strong> as much as two<br />
thirds of the observed decl<strong>in</strong>e <strong>in</strong> consumption, but leave the rema<strong>in</strong><strong>in</strong>g third unexpla<strong>in</strong>ed.<br />
For the U.S., Bernheim, Sk<strong>in</strong>ner and We<strong>in</strong>berg (2001) used longitud<strong>in</strong>al d<strong>at</strong>a from the PSID<br />
to look <strong>at</strong> the same issue. The decl<strong>in</strong>e <strong>in</strong> consumption dur<strong>in</strong>g the …rst year of retirement is 24<br />
percent for the …rst quartile of <strong>in</strong><strong>com</strong>e, 15 percent for the second quartile and 9 percent for the<br />
third and fourth quartile. They also analyze separ<strong>at</strong>ely food consumed <strong>at</strong> home and away from<br />
home …nd<strong>in</strong>g a drop for the …rst year of retirement by 34 percent and 14 percent, respectively. The<br />
authors suggest th<strong>at</strong> <strong>in</strong>dividuals behave accord<strong>in</strong>g to a rule of thumb or hyperbolic discount<strong>in</strong>g<br />
theories.<br />
Hurst (2008) provides a review of the retirement consumption puzzle conclud<strong>in</strong>g th<strong>at</strong> consumption<br />
p<strong>at</strong>terns <strong>at</strong> retirement age can be expla<strong>in</strong>ed by the home production model and unexpected<br />
shocks such as health events.<br />
We brie‡y summarize some of the studies th<strong>at</strong> o¤er<br />
explan<strong>at</strong>ions to the puzzle. <strong>Consumption</strong> (and <strong>in</strong> particular food consumption) does not determ<strong>in</strong>e<br />
utility directly, but enters <strong>in</strong> a household production function, together with other <strong>in</strong>puts,<br />
such as leisure time, home labor and so on. One could then th<strong>in</strong>k th<strong>at</strong> retirement corresponds to<br />
a shift <strong>in</strong> the home production function and to a substitution between market goods and services<br />
with home produced goods and services. Hurd and Rohwedder (2005) <strong>in</strong>vestig<strong>at</strong>e whether the<br />
drop <strong>in</strong> consumption is anticip<strong>at</strong>ed as well as present implic<strong>at</strong>ions suggested by the home production<br />
model. The authors use the Health and <strong>Retirement</strong> Study (HRS) and a supplemental<br />
survey CAMS for 2001. They show evidence th<strong>at</strong> the reduction <strong>in</strong> consumption th<strong>at</strong> households<br />
anticip<strong>at</strong>e is consistent with the out<strong>com</strong>es <strong>at</strong> retirement. The household production model predicts<br />
a discont<strong>in</strong>uous change <strong>in</strong> expenditure due to the substitution for leisure <strong>at</strong> retirement.<br />
The decl<strong>in</strong>e <strong>in</strong> spend<strong>in</strong>g <strong>at</strong> retirement is between 15 to 20 percent. They …nd a higher amount<br />
of time spent on home production for retirees than for not retired.<br />
Aguiar and Hurst (2005) also analyze the home production model implic<strong>at</strong>ions with the<br />
Cont<strong>in</strong>u<strong>in</strong>g Survey of Food Intake of Individuals (CSFII), a detailed survey on food expenditure<br />
and food <strong>in</strong>take, and the N<strong>at</strong>ional Human Activity P<strong>at</strong>tern Survey (NHAPS), which collects time<br />
spent on home production. They …nd a drop <strong>in</strong> food expenditure but not <strong>in</strong> food <strong>in</strong>take. This<br />
…nd<strong>in</strong>g is consistent with the implic<strong>at</strong>ions of the Home Production Model. Aguiar and Hurst<br />
(2007) us<strong>in</strong>g scanner d<strong>at</strong>a <strong>at</strong> household level on grocery expenses from ACNielsen’s Homescan<br />
18
Survey found th<strong>at</strong> <strong>in</strong>dividuals l<strong>at</strong>er <strong>in</strong> the life cycle shop more frequently buy<strong>in</strong>g goods <strong>at</strong> a lower<br />
price. Elderly households use more discounts and spend more time shopp<strong>in</strong>g, <strong>in</strong>dic<strong>at</strong><strong>in</strong>g a lower<br />
opportunity cost of time than younger households. They …nd a decrease <strong>in</strong> expenditure but an<br />
<strong>in</strong>crease <strong>in</strong> consumption tak<strong>in</strong>g <strong>in</strong>to account time spent on shopp<strong>in</strong>g and home production after<br />
middle age.<br />
Hyperbolic preferences could also expla<strong>in</strong> the puzzle, explored <strong>in</strong> Angeletos, Laibson, Repetto,<br />
Tobacman and We<strong>in</strong>berg (2001). Households with hyperbolic preferences act imp<strong>at</strong>iently <strong>in</strong> the<br />
short term which is not consistent with the long term plann<strong>in</strong>g.<br />
The l<strong>at</strong>ter leads to a lower<br />
wealth accumul<strong>at</strong>ion than <strong>in</strong>itially planned and consumption is more sensitive to changes <strong>in</strong><br />
<strong>in</strong><strong>com</strong>e. The simul<strong>at</strong>ions predict a decl<strong>in</strong>e by 14.5 percent <strong>in</strong> consumption around retirement.<br />
The authors test empirically the implic<strong>at</strong>ions of this model us<strong>in</strong>g d<strong>at</strong>a from the PSID. They …nd<br />
a decl<strong>in</strong>e by 11.6 percent <strong>in</strong> consumption dur<strong>in</strong>g a period of four years around retirement, which<br />
could be expla<strong>in</strong>ed with the predictions of the hyperbolic consumption model.<br />
Another potential explan<strong>at</strong>ion is <strong>in</strong>voluntary retirement.<br />
Haider and Stephens (2007) use<br />
expected retirement d<strong>at</strong>es as <strong>in</strong>strument for retirement <strong>in</strong>stead of age as <strong>in</strong> some of the previous<br />
studies.<br />
They found th<strong>at</strong> expected retirement predicts accur<strong>at</strong>ely retirement decisions us<strong>in</strong>g<br />
d<strong>at</strong>a from the <strong>Retirement</strong> History Survey (RHS) and the HRS. The authors found a decrease <strong>in</strong><br />
consumption by 10 percent with the RHS d<strong>at</strong>a and no e¤ect with the HRS for households th<strong>at</strong><br />
retire when expected. Us<strong>in</strong>g expected retirement d<strong>at</strong>es results <strong>in</strong> a lower drop <strong>in</strong> consumption<br />
accord<strong>in</strong>g to the evidence of the RHS. However, the authors cannot expla<strong>in</strong> the rema<strong>in</strong><strong>in</strong>g fall<br />
<strong>in</strong> consumption. Recent …nd<strong>in</strong>gs for the UK <strong>in</strong> Smith (2006) show th<strong>at</strong> only <strong>in</strong>dividuals with<br />
<strong>in</strong>voluntary retirement drop food spend<strong>in</strong>g <strong>at</strong> retirement. Blau (2008) shows with a theoretical<br />
model <strong>in</strong>clud<strong>in</strong>g uncerta<strong>in</strong>ty and discrete employment decisions th<strong>at</strong> a drop <strong>in</strong> consumption <strong>at</strong><br />
retirement can be expla<strong>in</strong>ed only for households th<strong>at</strong> retire as a result of an unexpected shock.<br />
Households th<strong>at</strong> retire as planned smooth consumption <strong>at</strong> retirement.<br />
Most of the previous studies have used food expenditure to approxim<strong>at</strong>e consumption. Even<br />
previous studies us<strong>in</strong>g panel d<strong>at</strong>a such as the Panel Study of In<strong>com</strong>e Dynamics (PSID) and the<br />
Health and <strong>Retirement</strong> Study (HRS) the consumption measure is very limited to ma<strong>in</strong>ly food<br />
expenditure. Only the HRS with the <strong>Consumption</strong> and Activities Mail Survey (CAMS), applied<br />
to a subsample of HRS respondents, could also provide panel d<strong>at</strong>a with a more <strong>com</strong>prehensive<br />
measure of consumption similar to the CEX (Hurd and Rohwedder, 2008). However, CAMS only<br />
<strong>in</strong>cludes a subsample of HRS respondents, so the number of observed transitions <strong>in</strong>to retirement<br />
19
is small. We analyze nondurable and food household expenditure around retirement age <strong>in</strong> this<br />
study.<br />
Some other previous studies have also used the CEX construct<strong>in</strong>g synthetic panels us<strong>in</strong>g the<br />
cross-sectional dimension of the d<strong>at</strong>a: Slesnick and Ulker (2005) and Fisher, Johnson, Marchand,<br />
Smeed<strong>in</strong>g and Torrey (2008).<br />
Slesnick and Ulker (2005) …nd th<strong>at</strong> <strong>in</strong>dividuals smooth total<br />
expenditure dur<strong>in</strong>g retirement but there is a signi…cant drop <strong>in</strong> food and consumer services.<br />
Fisher, Johnson, Marchand, Smeed<strong>in</strong>g and Torrey (2008) obta<strong>in</strong> a decl<strong>in</strong>e <strong>in</strong> food expenditure<br />
and a smaller drop <strong>in</strong> total household expenditure dur<strong>in</strong>g retirement. The results of these studies<br />
rely on cohorts sample sizes. The CEX is not designed as a survey for middle-aged or elderly like<br />
the HRS, caus<strong>in</strong>g less precision <strong>in</strong> the estim<strong>at</strong>ion us<strong>in</strong>g pooled cross-sectional d<strong>at</strong>a. Moreover,<br />
these studies may not analyze accur<strong>at</strong>ely changes <strong>in</strong> consumption <strong>at</strong> the moment of retirement<br />
as some of the heterogeneity across <strong>in</strong>dividuals is smoothed out by averag<strong>in</strong>g cohorts spend<strong>in</strong>g.<br />
We use the most suitable d<strong>at</strong>a set available to measure consumption. Nondurable expenditure<br />
does not change <strong>at</strong> retirement.<br />
Our evidence suggests th<strong>at</strong> <strong>in</strong>dividuals smooth consumption<br />
dur<strong>in</strong>g the …rst year of retirement. Moreover, if we focus on food expenditure, as some other<br />
studies have done, we do observe a decl<strong>in</strong>e <strong>in</strong> expenditure associ<strong>at</strong>ed with retirement. We analyze<br />
two decades of changes <strong>in</strong> consumption <strong>at</strong> the moment of retirement, mak<strong>in</strong>g it more robust to<br />
speci…c years economic conditions as some of the previous studies th<strong>at</strong> cover a shorter period.<br />
We support the evidence provided <strong>in</strong> Hurst (2008) th<strong>at</strong> the retirement consumption puzzle is<br />
dead.<br />
5 Conclusions<br />
This paper analyzes the retirement consumption puzzle us<strong>in</strong>g a broader de…nition of expenditure<br />
than <strong>in</strong> most of the previous studies th<strong>at</strong> use ma<strong>in</strong>ly food expenses. In addition, we exam<strong>in</strong>e labor<br />
market transitions around retirement age with the panel <strong>com</strong>ponent of the CEX. The empirical<br />
estim<strong>at</strong>ions show no e¤ect for nondurables, and a decl<strong>in</strong>e <strong>in</strong> food for households whose head transitions<br />
from employment to retirement. Food represents 32 percent of total nondurables. The<br />
drop <strong>in</strong> total food is due to the decl<strong>in</strong>e <strong>in</strong> food consumed <strong>at</strong> home and out of home around retirement<br />
age. Previous studies have given some explan<strong>at</strong>ions for the decl<strong>in</strong>e of food <strong>at</strong> retirement<br />
consistent with the Home Production model.<br />
These results support the evidence th<strong>at</strong> there is no retirement consumption puzzle. Contrary<br />
to some of the previous studies, we …nd th<strong>at</strong> <strong>in</strong>dividuals smooth consumption <strong>at</strong> retirement<br />
20
as predicted by the Life Cycle Model.<br />
Food expenditure should not be used to approxim<strong>at</strong>e<br />
consumption as it is a very narrow de…nition th<strong>at</strong> could provide mislead<strong>in</strong>g results.<br />
References<br />
Aguiar, M., Hurst, E., "<strong>Consumption</strong> versus Expenditure," Journal of Political Economy 113:5<br />
(2005), 919–948.<br />
Aguiar, M., Hurst, E., "Lifecycle Prices and Production," American Economic Review 97:5<br />
(2007), 1533-1559.<br />
Angeletos, G., Laibson, D., Repetto, A., Tobacman, J., We<strong>in</strong>berg, S., "The Hyperbolic <strong>Consumption</strong><br />
Model:<br />
Calibr<strong>at</strong>ion, Simul<strong>at</strong>ion, and Empirical Evalu<strong>at</strong>ion," Journal of Economic<br />
Perspectives 15:3 (2001), 47–68.<br />
Banks, J., Blundell, R., Tanner, S., "Is there a <strong>Retirement</strong>-Sav<strong>in</strong>gs Puzzle?," American Economic<br />
Review 88:4 (1998), 769–788.<br />
B<strong>at</strong>tist<strong>in</strong>, E., "Errors <strong>in</strong> Survey Reports of <strong>Consumption</strong> Expenditures," University of Padova,<br />
Mimeo (2004).<br />
Bernheim, D., Sk<strong>in</strong>ner, J., We<strong>in</strong>berg, S., "Wh<strong>at</strong> Accounts for the Vari<strong>at</strong>ion <strong>in</strong> <strong>Retirement</strong> Wealth<br />
Among U.S. Households," American Economic Review 91:4 (2001), 832–857.<br />
Blau, D., "<strong>Retirement</strong> and <strong>Consumption</strong> <strong>in</strong> a Life Cycle Model," Journal of Labor Economics<br />
26 (2008), 35–71.<br />
Fisher, J., Johnson, D., Marchand, J., Smeed<strong>in</strong>g, T., Torrey, B., "The <strong>Retirement</strong> <strong>Consumption</strong><br />
Conundrum: <strong>Evidence</strong> from a <strong>Consumption</strong> Survey," Economics Letters 99:3 (2008), 482–485.<br />
French, E., "The e¤ect of health, wealth and wages on labor supply and retirement behavior,"<br />
Review of Economic Studies 72:2 (2005), 395–427.<br />
Haider, S. J., Stephens, M., "Is There a <strong>Retirement</strong>-<strong>Consumption</strong> Puzzle?<br />
<strong>Evidence</strong> Us<strong>in</strong>g<br />
Subjective <strong>Retirement</strong> Expect<strong>at</strong>ions," The Review of Economics and St<strong>at</strong>istics 89:2 (2007), 247–<br />
264.<br />
Hurd, M., Rohwedder, S., "The <strong>Retirement</strong>-<strong>Consumption</strong> Puzzle:<br />
Anticip<strong>at</strong>ed and Actual<br />
Decl<strong>in</strong>es <strong>in</strong> Spend<strong>in</strong>g <strong>at</strong> <strong>Retirement</strong>," RAND, Work<strong>in</strong>g Paper 242 (2005).<br />
21
Hurd, M., Rohwedder, S., "Some Answers to the <strong>Retirement</strong>-<strong>Consumption</strong> Puzzle," NBER,<br />
Work<strong>in</strong>g Paper 12057 (2006).<br />
Hurd, M., Rohwedder, S., "The <strong>Retirement</strong> <strong>Consumption</strong> Puzzle: Actual Spend<strong>in</strong>g Change <strong>in</strong><br />
Panel D<strong>at</strong>a," RAND, Work<strong>in</strong>g Paper WR-563 (2008).<br />
Hurst, E., "Grasshoppers, Ants and Pre-<strong>Retirement</strong> Wealth: A Test of Permanent In<strong>com</strong>e Consumers,"<br />
MRRC, Work<strong>in</strong>g Paper 2004-088 (2004).<br />
Hurst, E., "The <strong>Retirement</strong> of a <strong>Consumption</strong> Puzzle," NBER, Work<strong>in</strong>g Paper 13789 (2008).<br />
Rust, J., Phelan, C., "How Social Security and Medicare a¤ect retirement behavior <strong>in</strong> a world<br />
of <strong>in</strong><strong>com</strong>plete markets," Econometrica 65:4 (1997), 781–831.<br />
Slesnick, D., Ulker, A., "The <strong>Consumption</strong> of the Elderly: <strong>Evidence</strong> from the Consumer Expenditure<br />
Survey," The University of Texas <strong>at</strong> Aust<strong>in</strong>, Work<strong>in</strong>g Paper (2005).<br />
Smith, S., "The retirement-consumption puzzle and <strong>in</strong>voluntary early retirement: <strong>Evidence</strong> from<br />
British Household Panel Survey," Economic Journal 116:510 (2006), C130–C148.<br />
22
Appendix<br />
CEX D<strong>at</strong>a<br />
This section provides a brief description of the characteristics of the sample obta<strong>in</strong>ed from<br />
the CEX. The ma<strong>in</strong> fe<strong>at</strong>ures of the CEX taken <strong>in</strong>to account when construct<strong>in</strong>g the sample<br />
are as follows. First, <strong>in</strong> 1986 and 1996 the CEX sample was <strong>com</strong>pletely refreshed so the last<br />
<strong>in</strong>terviews for households <strong>in</strong> 1985 and 1995 are lost. Second, some variables present topcod<strong>in</strong>g.<br />
The topcod<strong>in</strong>g rules were made consistent from 1980 to 2000. The change <strong>in</strong> methodology from<br />
1996 onwards is converted to the orig<strong>in</strong>al previous to 1996.<br />
Third, names and codi…c<strong>at</strong>ion of variables changed <strong>in</strong> some years, so these were detected<br />
and made consistent. F<strong>in</strong>ally, the questions of food consumed <strong>at</strong> home were phrased di¤erently<br />
between 1982 and 1987. Figure 3(a) shows the quarterly series of food consumed <strong>at</strong> home from<br />
1980 to 2000. We can observe a change <strong>in</strong> scale between 1982 and 1987. This was corrected to<br />
make the scale consistent with all the other time periods. Food consumed <strong>at</strong> home corrected for<br />
this problem is shown <strong>in</strong> Figure 3(b). The codi…c<strong>at</strong>ion, topcod<strong>in</strong>g and corrections to the scale<br />
problem are based on B<strong>at</strong>tist<strong>in</strong> (2004).<br />
5.1 5.2 5.3 5.4 5.5<br />
1980 1982 1984 1986 1988 1990 1992 1994 1996 1998 2000<br />
5.1 5.2 5.3 5.4 5.5<br />
1980 1982 1984 1986 1988 1990 1992 1994 1996 1998 2000<br />
(a) Food <strong>at</strong> home (b) Food <strong>at</strong> home correction 1982-1987<br />
Figure 9: Food consumed <strong>at</strong> home 1980-2000<br />
We selected out households th<strong>at</strong> report zero expenditure <strong>in</strong> order to avoid some sources of<br />
measurement error. Also, households whose head of family is self-employed or households th<strong>at</strong><br />
live <strong>in</strong> student hous<strong>in</strong>g are dropped out. In couples households, the male is considered the head of<br />
household. Only households th<strong>at</strong> <strong>com</strong>pleted <strong>at</strong> least the …rst and last <strong>in</strong>terviews and whose head<br />
of family is male are <strong>in</strong>cluded. In the Interview sample, the …rst <strong>in</strong>terview only collects household<br />
demographic <strong>in</strong>form<strong>at</strong>ion so the actual …rst <strong>in</strong>terview about household expenses is applied the<br />
second time the household is visited. We <strong>in</strong>clude <strong>in</strong> this study households th<strong>at</strong> <strong>com</strong>pleted the<br />
…rst and last <strong>in</strong>terviews where the survey <strong>in</strong>strument, not only the household roster, was applied.<br />
23
In few cases the age of the head of household changes up to three times dur<strong>in</strong>g the four<br />
quarters <strong>in</strong>terviewed. Households th<strong>at</strong> changed the age of the head of households more than<br />
once were selected out.<br />
The Interview questionnaire reports the expenditure of the previous<br />
three months to the <strong>in</strong>terview d<strong>at</strong>e. We use only the last month immedi<strong>at</strong>e to the <strong>in</strong>terview.<br />
The average of the three months reported every quarter was <strong>com</strong>pared to the expenditure of<br />
the previous month to the <strong>in</strong>terview but there are no substantial di¤erences. The explan<strong>at</strong>ion<br />
is th<strong>at</strong> the questionnaire requires the usual weekly expenditure of the previous three months<br />
<strong>in</strong> food c<strong>at</strong>egories. Each monthly measure is <strong>com</strong>puted with <strong>in</strong>form<strong>at</strong>ion on the usual weekly<br />
expenditure of the quarter so the monthly measures are <strong>in</strong> most cases identical.<br />
The d<strong>at</strong>a is de‡<strong>at</strong>ed with the CPI from the BLS. In the CPI, the weight of an item is derived<br />
from reported expenditures on th<strong>at</strong> item us<strong>in</strong>g the CEX from 1993, 1994, and 1995. The Stone<br />
Price Index is not used because its construction with weights <strong>at</strong> the household level, may <strong>in</strong>clude<br />
other endogeneity sources to the estim<strong>at</strong>ions. The presence of bus<strong>in</strong>ess cycles is explored <strong>in</strong> the<br />
d<strong>at</strong>a but no clear p<strong>at</strong>tern appears.<br />
6.5 6.6 6.7 6.8 6.9<br />
1980 1982 1984 1986 1988 1990 1992 1994 1996 1998 2000<br />
(a) Logarithm of nondurable expenditure<br />
5.3 5.4 5.5 5.6 5.7 5.8<br />
1980 1982 1984 1986 1988 1990 1992 1994 1996 1998 2000<br />
(b) Logarithm of food expenditure<br />
Figure 10: Expenditure c<strong>at</strong>egories 1980-2000<br />
The only puzzl<strong>in</strong>g issue is th<strong>at</strong> expenditure follows a decreas<strong>in</strong>g trend over time as shown <strong>in</strong><br />
Figure 4. A decreas<strong>in</strong>g p<strong>at</strong>tern over time for nondurables is observed <strong>in</strong> Figure 4(a). In Figure<br />
4(b) food expenditure also decl<strong>in</strong>e over time. The l<strong>at</strong>er does not a¤ect our estim<strong>at</strong>ions because<br />
we are exam<strong>in</strong><strong>in</strong>g changes <strong>in</strong> consumption p<strong>at</strong>terns dur<strong>in</strong>g the panel span for households with<br />
di¤erent labor market transitions.<br />
The labor st<strong>at</strong>us variable <strong>in</strong> both samples is classi…ed by the number of reported work<strong>in</strong>g<br />
hours per year. In the Interview is recorded how many weeks did the <strong>in</strong>dividual work <strong>in</strong> the<br />
previous 12 months and the number of hours per week. In the case the response is zero, the<br />
<strong>in</strong>dividual is classi…ed as not work<strong>in</strong>g due to retirement, illness, disability, study<strong>in</strong>g, among<br />
24
others. These questions are only <strong>in</strong>cluded <strong>in</strong> the …rst and last <strong>in</strong>terviews. The response <strong>in</strong> the<br />
last <strong>in</strong>terview has an overlapp<strong>in</strong>g period th<strong>at</strong> corresponds to the …rst three months or the last<br />
quarter for the …rst <strong>in</strong>terview response. Households are classi…ed <strong>in</strong> every <strong>in</strong>terview as work<strong>in</strong>g<br />
(full-time or part-time) and not work<strong>in</strong>g consider<strong>in</strong>g the structure of the labor st<strong>at</strong>us questions.<br />
Full-time work is de…ned as work<strong>in</strong>g more than 1,500 hours per year and 52 weeks. Parttime<br />
work represents between 500 and 1,500 hours per year and 52 weeks. Not work<strong>in</strong>g st<strong>at</strong>us<br />
is de…ned by self-report or work<strong>in</strong>g less than 500 hours per year and 52 weeks.<br />
We use the<br />
same de…nition as <strong>in</strong> Bernheim, Sk<strong>in</strong>ner and We<strong>in</strong>berg (2001). Individuals who report work<strong>in</strong>g<br />
less than 52 weeks are classi…ed as leav<strong>in</strong>g employment (full-time or part-time) or not work<strong>in</strong>g<br />
accord<strong>in</strong>g to the proportion of number of hours per year declared. In this speci…c group, the<br />
unemployment start d<strong>at</strong>e is not possible to identify.<br />
The employment questions are also applied <strong>in</strong> the second and third <strong>in</strong>terviews but only to<br />
<strong>in</strong>dividuals who reported not work<strong>in</strong>g <strong>in</strong> the …rst <strong>in</strong>terview and are chang<strong>in</strong>g work<strong>in</strong>g st<strong>at</strong>us. The<br />
responses <strong>in</strong> these <strong>in</strong>terviews were exam<strong>in</strong>ed for <strong>in</strong>dividuals work<strong>in</strong>g less than 52 weeks <strong>in</strong> the<br />
last <strong>in</strong>terview. In most of the cases the employment responses <strong>in</strong> the second and third <strong>in</strong>terviews<br />
do not capture <strong>in</strong>dividuals who started work<strong>in</strong>g <strong>in</strong> th<strong>at</strong> term as <strong>in</strong>dic<strong>at</strong>ed by the response of the<br />
last <strong>in</strong>terview. Therefore, as the labor st<strong>at</strong>us responses <strong>in</strong> the second and third <strong>in</strong>terviews are<br />
not reliable, they are not considered <strong>in</strong> the analysis.<br />
The unemployment spells do not a¤ect the out<strong>com</strong>es from the …rst <strong>in</strong>terview because <strong>in</strong><br />
order to be <strong>in</strong>cluded <strong>in</strong> the sample, <strong>in</strong>dividuals should be work<strong>in</strong>g full-time or part-time or not<br />
work<strong>in</strong>g <strong>in</strong> the …rst period. This e¤ect contam<strong>in</strong><strong>at</strong>es the out<strong>com</strong>es of the last <strong>in</strong>terviews when<br />
the number of hours per year th<strong>at</strong> <strong>in</strong>dividuals report is assumed to be consecutive. Therefore,<br />
only <strong>in</strong>dividuals report<strong>in</strong>g full-time or part-time work, and not work<strong>in</strong>g <strong>in</strong> the last <strong>in</strong>terview are<br />
considered. In the case of <strong>in</strong>dividuals who transition from employment to retirement, those who<br />
report <strong>in</strong> the last <strong>in</strong>terview up to the equivalent of 9 months work<strong>in</strong>g as <strong>in</strong> the …rst <strong>in</strong>terview<br />
are <strong>in</strong>cluded. We do not consider <strong>in</strong>dividuals who retire dur<strong>in</strong>g the previous three months to the<br />
last <strong>in</strong>terview because this co<strong>in</strong>cides with the period <strong>in</strong> which expenditure is reported and as the<br />
exact d<strong>at</strong>e of retirement is not asked, we cannot classify them properly. For those who re-enter<br />
the labor market report<strong>in</strong>g <strong>at</strong> least the equivalent to 3 months work<strong>in</strong>g full-time or part-time <strong>in</strong><br />
the last <strong>in</strong>terview and not work<strong>in</strong>g <strong>in</strong> the …rst <strong>in</strong>terview are considered <strong>in</strong> the classi…c<strong>at</strong>ion.<br />
The variable th<strong>at</strong> <strong>in</strong>dic<strong>at</strong>es the number of household earners was also explored as a possibility<br />
to re‡ect labor st<strong>at</strong>us. However, this variable gives mislead<strong>in</strong>g results because <strong>in</strong>dividuals who<br />
25
eport work<strong>in</strong>g less than 52 weeks per year are also considered as work<strong>in</strong>g.<br />
Results<br />
This section presents the detailed results for Table 1, Table 2, and Table 3 <strong>in</strong>clud<strong>in</strong>g all control<br />
variables. Table 7 presents the analysis divid<strong>in</strong>g the sample from 1980-1989 and 1990-2000.<br />
Table 5: Impact on consumption around retirement <strong>in</strong>clud<strong>in</strong>g s<strong>in</strong>gle and couple<br />
households<br />
Nondurables Total food Food <strong>at</strong> home<br />
Non-food<br />
nondurables<br />
Intercept 6.5758 5.2531 4.3775 6.0198<br />
[0.3998**] [0.3787**] [0.3580**] [0.4974**]<br />
Age 0.0016 0.0041 0.0191 0.0063<br />
[0.0126] [0.0118] [0.0112*] [0.0157]<br />
Age 2 -0.0001 -0.0001 -0.0001 -0.0001<br />
[0.0001] [0.0001] [0.0001**] [0.0001]<br />
Family size 0.1383 0.1447 0.1766 0.1393<br />
[0.0059**] [0.0056**] [0.0059**] [0.0074**]<br />
Children under 18 years old -0.1079 -0.0739 -0.0627 -0.1338<br />
[0.0098**] [0.0095**] [0.0094**] [0.0123**]<br />
Couple (dummy=1) 0.4044 0.3426 0.3894 0.4749<br />
[0.0155**] [0.0142**] [0.0143**] [0.0199**]<br />
I (dummy=1 last <strong>in</strong>terview) -0.0213 -0.0299 -0.0175 -0.0184<br />
[0.0069**] [0.0073**] [0.0071**] [0.0088**]<br />
G 00 -0.2707 -0.2033 -0.0982 -0.3198<br />
[0.0134**] [0.0125**] [0.0119**] [0.0169**]<br />
G 01 -0.2484 -0.1774 -0.0867 -0.3015<br />
[0.0417**] [0.0383**] [0.0357**] [0.0522**]<br />
G 10 -0.1427 -0.1092 -0.0539 -0.1626<br />
[0.0225**] [0.0218**] [0.0228**] [0.0280**]<br />
I G 00 0.0303 0.0372 0.0284 0.0279<br />
[0.0100**] [0.0106**] [0.0103**] [0.0129**]<br />
I G 01 0.0141 0.0458 0.0625 0.0033<br />
[0.0373] [0.0374] [0.0365*] [0.0497]<br />
I G 10 -0.0070 -0.0608 -0.0452 0.0112<br />
[0.0216] [0.0229**] [0.0246*] [0.0279]<br />
No. observ<strong>at</strong>ions 25,960 25,960 25,960 25,960<br />
**estim<strong>at</strong>es are signi…cant <strong>at</strong> 5 percent level of con…dence. *estim<strong>at</strong>es are signi…cant <strong>at</strong> 10 percent<br />
level of con…dence. Regressions also <strong>in</strong>clude dummy variables for year, month and their <strong>in</strong>teractions.<br />
The standard errors are robust to heteroskedasticity corrected with the Huber-White method<br />
and serial correl<strong>at</strong>ion with<strong>in</strong> households.<br />
26
Table 6: Impact on consumption around retirement <strong>in</strong>clud<strong>in</strong>g couple households<br />
Nondurables Total food Food <strong>at</strong> home<br />
Non-food<br />
nondurables<br />
Intercept 8.3566 6.2779 4.7749 8.1017<br />
[0.4412**] [0.4273**] [0.4007**] [0.5397**]<br />
Age 0.0001 0.0012 0.0137 0.0079<br />
[0.0131] [0.0124] [0.0117] [0.0162]<br />
Age 2 -0.0001 -0.0001 -0.0001 -0.0001<br />
[0.0001] [0.0001] [0.0001] [0.0001]<br />
Family size 0.1170 0.1295 0.1571 0.1133<br />
[0.0056**] [0.0055**] [0.0053**] [0.0068**]<br />
Children under 18 years old -0.0961 -0.0658 -0.0508 -0.1194<br />
[0.0099**] [0.0098**] [0.0094**] [0.0124**]<br />
Wife hours of leisure -0.1759 -0.0819 0.0085 -0.2281<br />
[0.0177**] [0.0174**] [0.0165] [0.0211**]<br />
(age of head age wife) 0.0021 0.0011 0.0016 0.0028<br />
[0.0009**] [0.0008] [0.0008**] [0.0011**]<br />
I (dummy=1 last <strong>in</strong>terview) -0.0106 -0.0236 -0.0128 -0.0059<br />
[0.0072] [0.0076**] [0.0074*] [0.0091]<br />
I G 00 0.0261 0.0317 0.0250 0.0232<br />
[0.0108**] [0.0111**] [0.0109**] [0.0139*]<br />
I G 01 -0.0085 0.0370 0.0555 -0.0276<br />
[0.0391] [0.0400] [0.0388] [0.0520]<br />
I G 10 -0.0056 -0.0543 -0.0505 0.0131<br />
[0.0226] [0.0244**] [0.0246**] [0.0293]<br />
No. observ<strong>at</strong>ions 21,682 21,682 21,682 21,682<br />
**estim<strong>at</strong>es are signi…cant <strong>at</strong> 5 percent level of con…dence. *estim<strong>at</strong>es are signi…cant <strong>at</strong> 10 percent<br />
level of con…dence. Regressions also <strong>in</strong>clude dummy variables for year, month and their <strong>in</strong>teractions,<br />
and the group dummies for the head of household labor st<strong>at</strong>us. The standard errors are robust to<br />
heteroskedasticity corrected with the Huber-White method and serial correl<strong>at</strong>ion with<strong>in</strong><br />
households.<br />
27
Table 7: Impact on consumption around retirement <strong>in</strong>clud<strong>in</strong>g s<strong>in</strong>gle and couple<br />
households with an altern<strong>at</strong>ive de…nition of retirement<br />
Nondurables Total food Food <strong>at</strong> home<br />
Non-food<br />
nondurables<br />
Intercept 7.2466 5.7016 4.6585 6.7622<br />
[0.4547**] [0.4300**] [0.4058**] [0.5672**]<br />
Age -0.0209 -0.0109 0.0097 -0.0182<br />
[0.0144] [0.0136] [0.0128] [0.0180]<br />
Age 2 0.0000 0.0000 -0.0001 0.0000<br />
[0.0001] [0.0001] [0.0001] [0.0001]<br />
Family size 0.1275 0.1354 0.1689 0.1258<br />
[0.0065**] [0.0060**] [0.0063**] [0.0081**]<br />
Children under 18 years old -0.0999 -0.0619 -0.0503 -0.1259<br />
[0.0105**] [0.0100**] [0.0098**] [0.0132**]<br />
Couple (dummy=1) 0.3971 0.3343 0.3874 0.4673<br />
[0.0174**] [0.0160**] [0.0165**] [0.0224**]<br />
I (dummy=1 last <strong>in</strong>terview) -0.0178 -0.0274 -0.0169 -0.0144<br />
[0.0069**] [0.0073**] [0.0072**] [0.0088]<br />
G 00 -0.2628 -0.2006 -0.1090 -0.3069<br />
[0.0165**] [0.0154**] [0.0149**] [0.0210**]<br />
G 01 -0.2446 -0.1735 -0.0876 -0.2961<br />
[0.0418**] [0.0383**] [0.0356**] [0.0523**]<br />
G 10 -0.1395 -0.1064 -0.0539 -0.1688<br />
[0.0225**] [0.0218**] [0.0228**] [0.0280**]<br />
I G 00 -0.0022 0.0186 0.0195 -0.0134<br />
[0.0127] [0.0132] [0.0132] [0.0164]<br />
I G 01 0.0150 0.0461 0.0621 0.0037<br />
[0.0374] [0.0376] [0.0365*] [0.0497]<br />
I G 10 -0.0076 -0.0615 -0.0464 0.0107<br />
[0.0216] [0.0229**] [0.0246*] [0.0279]<br />
No. observ<strong>at</strong>ions 20,236 20,236 20,236 20,236<br />
**estim<strong>at</strong>es are signi…cant <strong>at</strong> 5 percent level of con…dence. *estim<strong>at</strong>es are signi…cant <strong>at</strong> 10 percent<br />
level of con…dence. Regressions also <strong>in</strong>clude dummy variables for year, month and their <strong>in</strong>teractions.<br />
The standard errors are robust to heteroskedasticity corrected with the Huber-White method<br />
and serial correl<strong>at</strong>ion with<strong>in</strong> households.<br />
Table 8: Impact on consumption when the head of household transitions to retirement,<br />
1980-1989 and 1990-2000<br />
S<strong>in</strong>gles and Couples<br />
Couples<br />
1980-1989 1990-2000 1980-1989 1990-2000<br />
Nondurables -0.0380 0.0211 -0.0466 0.0321<br />
[0.0321] [0.0300] [0.0326] [0.0316]<br />
Total food -0.0763 -0.0509 -0.0820 -0.0346<br />
[0.0358**] [0.0303*] [0.0377**] [0.0321]<br />
Food <strong>at</strong> home -0.0585 -0.0372 -0.0775 -0.0324<br />
[0.0415] [0.0290] [0.0403*] [0.0300]<br />
Non-food nondurables -0.0154 0.0375 -0.0248 0.0511<br />
[0.0409] [0.0392] [0.0413] [0.0423]<br />
No. observ<strong>at</strong>ions 12,316 13,644 10,531 11,151<br />
**estim<strong>at</strong>es are signi…cant <strong>at</strong> 5 percent level of con…dence. *estim<strong>at</strong>es are signi…cant <strong>at</strong> 10<br />
percent level of con…dence. Regressions also <strong>in</strong>clude dummy variables for year, month and<br />
their <strong>in</strong>teractions, age, age squared, family size, an <strong>in</strong>dic<strong>at</strong>or for children, under 18 years old,<br />
a dummy for last <strong>in</strong>terview, and the group dummies for the head of household labor st<strong>at</strong>us.<br />
In addition, the regression for s<strong>in</strong>gles and couples <strong>in</strong>cludes an <strong>in</strong>dic<strong>at</strong>or for couple and the<br />
regression for couples has a variable for wife hours of leisure, and the di¤erence between<br />
the age of the head and the age of the wife. The standard errors are robust to heteroskedasticity<br />
corrected with the Huber-White method and serial correl<strong>at</strong>ion with<strong>in</strong> households.<br />
28