Global Greenhouse Gas Observation by Satellite - Planet Action
Global Greenhouse Gas Observation by Satellite - Planet Action
Global Greenhouse Gas Observation by Satellite - Planet Action

Create successful ePaper yourself
Turn your PDF publications into a flip-book with our unique Google optimized e-Paper software.
<strong>Global</strong> <strong>Greenhouse</strong> <strong>Gas</strong> <strong>Observation</strong> <strong>by</strong> <strong>Satellite</strong>
<strong>Greenhouse</strong> gases<br />
Observing<br />
SATellite<br />
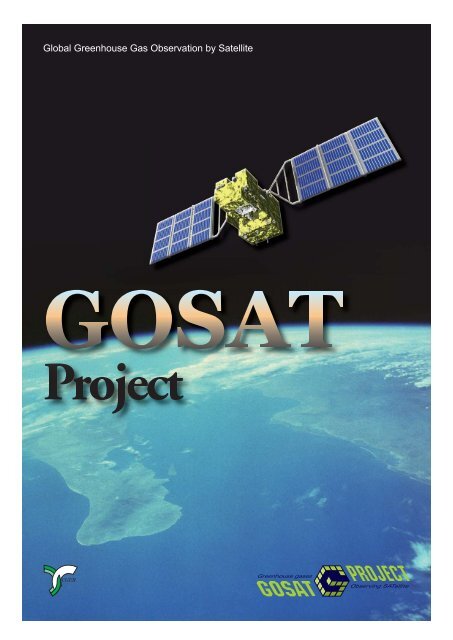
Figure 1. Overview of GOSAT (©JAXA)<br />
The <strong>Greenhouse</strong> <strong>Gas</strong>es Observing <strong>Satellite</strong> (GOSAT)<br />
will be the world’s first satellite to observe the concentrations<br />
Studies (NIES), and the Japan Aerospace Exploration<br />
Agency (JAXA) (Fig. 2).<br />
of carbon dioxide and methane, two major<br />
greenhouse gases, from space. (Fig. 1)<br />
MOE: Ministry of the Environment<br />
Analyses of GOSAT observation data will make it possible<br />
to ascertain the global distributions of carbon dioxide<br />
(CO 2<br />
) and methane (CH 4<br />
) and the geographical<br />
distribution of and seasonal and inter-annual variations<br />
Developing sensors (in collaboration with JAXA)<br />
Validating processed products<br />
Contributing to international efforts to reduce carbon<br />
emissions through scientific application of GOSAT<br />
observation data.<br />
in the flux (i.e., emission and absorption) of greenhouse<br />
gases. The results of the analysis will not only contribute<br />
to a deeper scientific understanding of the behaviors MOE<br />
Responsibilities<br />
Shared<br />
of the causative agents<br />
Managing the Science<br />
Team and promoting<br />
of global warming, but NIES: National<br />
data utilization<br />
will also provide fundamental<br />
Institute for<br />
information Environmental<br />
for refining climate Studies<br />
Developing and improving<br />
NIES<br />
JAXA<br />
change prediction and<br />
JAXA: Japan<br />
methods to derive greenhouse<br />
gas concentrations<br />
Aerospace<br />
formulating global<br />
warming countermeasures.<br />
from satellite and auxiliary<br />
Exploration<br />
The GOSAT<br />
Agency<br />
data<br />
Higher-level processing,<br />
Developing sensors (in collaboration with MOE)<br />
Project is a joint effort validation, and distribution of data products to external<br />
parties<br />
Developing, launching and operating the satellite<br />
of the Ministry of the<br />
Estimating carbon fl ux using models<br />
Environment (MOE),<br />
Acquiring satellite observation data, including<br />
Cooperating with JAXA activities<br />
data reception and recording<br />
the National Institute<br />
Level 1 processing of data and its calibration<br />
for Environmental<br />
Cooperating with MOE and NIES activities<br />
Figure 2. Role Sharing in the GOSAT Project<br />
1 <strong>Greenhouse</strong> gases Observing SATellite Project
Goals of the GOSAT Project<br />
1<br />
Goals of the GOSAT Project<br />
Emissions of CO 2<br />
have increased drastically<br />
over the past century as a result of the mass consumption of<br />
fossil fuels due to the expansion of industrial activities resulting<br />
in dramatic increases in atmospheric concentrations<br />
of CO 2<br />
(Fig. 3). CO 2<br />
, which is a greenhouse gas, leads to an<br />
increase in atmospheric temperatures. In addition to CO 2<br />
,<br />
species such as CH 4<br />
, nitrous oxide (N 2<br />
O), and halocarbons<br />
were designated as greenhouse gases subject to restrictions<br />
<strong>by</strong> the Kyoto Protocol; however, CO 2<br />
and CH 4<br />
account for<br />
81% of the total greenhouse effect caused <strong>by</strong> these gases<br />
(Fig. 4). The growing concentration of greenhouse gases in<br />
the atmosphere not only raises the temperature but can also<br />
cause droughts where rainfall is already scarce and floods<br />
in places where precipitation is already abundant, so there<br />
are concerns that, without intervention, significant damage<br />
will occur.<br />
That being the case, the global community is moving toward<br />
reducing greenhouse gas emissions. Under the United<br />
Nations Framework Convention on Climate Change, the<br />
Kyoto Protocol, which defines targets for emission reductions<br />
<strong>by</strong> developed nations, was agreed upon in 1997 and<br />
came into force in February 2002. In order for every nation<br />
on the globe to adopt measures for reducing greenhouse gas<br />
emissions, it is essential to set rational goals based on accurate<br />
predictions of climate change and its impact. At the<br />
same time, it is important to determine emission levels per<br />
country, and to evaluate various reduction measures based<br />
on that knowledge.<br />
The foremost purpose of the GOSAT Project is to produce<br />
more accurate estimates of the flux of greenhouse gases on<br />
a subcontinental basis (several thousand kilometers square).<br />
This is expected to help contribute to environmental administration<br />
efforts such as ascertaining the amount of CO 2<br />
absorbed<br />
or released per region and evaluating the carbon balance<br />
in forests. Furthermore, <strong>by</strong> engaging in research using<br />
the GOSAT data, we will accumulate new scientific knowledge<br />
on the global distribution of greenhouse gases and its<br />
temporal variations, and the mechanism of the global carbon<br />
cycle and its effect on climate, which will prove useful in<br />
predicting future climate change and assessing its impact.<br />
Additionally, the Project will expand upon existing earthobserving<br />
satellite technologies, develop new methodologies<br />
to measure greenhouse gases, and promote the technological<br />
development necessary for future earth-observing satellites.<br />
CO 2 concentration (ppm) N 2 O concentration (ppb)<br />
400<br />
350<br />
300<br />
Carbon dioxide (CO 2 )<br />
Methane (CH 4 )<br />
Nitrous oxide (N 2 O)<br />
2000<br />
1800<br />
1600<br />
1400<br />
1200<br />
1000<br />
800<br />
250<br />
0 500 1000 1500<br />
600<br />
2000<br />
Year<br />
Figure 3. Changes in concentrations of primary greenhouse<br />
gases in the atmosphere (Modified from the IPCC<br />
Fourth Assessment Report)<br />
Halocarbons<br />
13%<br />
Nitrous oxide<br />
(N 2 O) 6%<br />
Methane<br />
(CH 4 )<br />
18%<br />
Carbon dioxide<br />
(CO 2 )<br />
63%<br />
Figure 4. Contributions of the primary greenhouse gases to<br />
the increase in air temperature<br />
(The above figures are based on the bestestimates<br />
of radiative forcing gases from 1750 to<br />
2005, modified from the IPCC Fourth Assessment<br />
Report)<br />
(a)<br />
February<br />
(b)<br />
August<br />
Absorption<br />
Figure 5. The data obtained through GOSAT is expected to<br />
allow for this kind of computation of the global distribution<br />
of CO 2 flux<br />
(Simulation, (a) February, (b) August, carbon conversion<br />
[gC/m 2 /day])<br />
CH 4 concentration (ppb)<br />
Emissions <br />
2
GOSAT Sensors and <strong>Observation</strong> Methods<br />
2<br />
GOSAT Sensors and <strong>Observation</strong> Methods<br />
GOSAT will observe infrared light reaching<br />
its sensors from the earth’s surface and the atmosphere<br />
and give spectra which can be used to calculate the column<br />
abundances of CO 2<br />
and CH 4<br />
. The column abundances<br />
are expressed as the total number of molecules<br />
of target gases over the unit surface area or as the ratio<br />
of target gas molecules to the total number of molecules<br />
in dry air per unit surface area.<br />
GOSAT will orbit the earth in roughly 100 minutes at an<br />
altitude of approximately 666 km and return to the same<br />
orbit in three days (Fig. 6). The observation instrument onboard<br />
the satellite is called the Thermal And Near-infrared<br />
Sensor for carbon <strong>Observation</strong> (TANSO). TANSO is composed<br />
of two sensors: a Fourier Transform Spectrometer<br />
(FTS) and a Cloud Aerosol Imager (CAI). Tables 1 and 2<br />
summarize the target species, bands, and other specifications<br />
of the two sensors.<br />
TANSO-FTS utilizes optical interference, which is induced<br />
<strong>by</strong> splitting the incoming light into two optical paths<br />
to create an optical path difference between the two, and<br />
then recombining them. A light intensity distribution as<br />
a function of wavelength (spectrum) can be obtained <strong>by</strong><br />
conducting a mathematical conversion called the Fourier<br />
transform on the signals observed while changing the optical<br />
path difference little <strong>by</strong> little.<br />
Bands 1 to 3 of FTS will provide the spectra of sunlight<br />
reflected from the earth’s surface in the daytime and band<br />
4 will observe light emitted from the atmosphere and the<br />
earth’s surface throughout the day and night. The characteristics<br />
of sunlight reflection differ greatly between land<br />
and water surfaces. Seawater and freshwater absorb light<br />
which makes detection of the reflection difficult. However,<br />
in certain directions, sunlight is reflected as specular reflection<br />
and glitters brightly, so the sensor will target such<br />
points for observation over large water surfaces.<br />
GOSAT<br />
TANSO-CAI will observe the state of the atmosphere and<br />
the ground surface during the daytime in image form. The<br />
imagery data from TANSO-CAI will be used to determine<br />
the existence of clouds over a wide area including the field<br />
of view of FTS. When aerosols or clouds are detected,<br />
the characteristics of the clouds and the aerosol amounts<br />
are identified. This information is used to correct for the<br />
effects of clouds and aerosols on the spectra obtained <strong>by</strong><br />
FTS.<br />
Over a three-day period, TANSO-FTS will take spectra<br />
from several tens of thousands points distributed uniformly<br />
over the surface of the earth. Since analysis can only be<br />
done on cloud-free areas, only approximately 10 percent of<br />
the total number of observation points can be used for calculating<br />
the column abundances of CO 2<br />
and CH 4<br />
. Even so,<br />
the number of data points significantly surpasses the current<br />
number of ground measuring points (currently under<br />
200), and will serve to fill in areas where measurement has<br />
not been conducted to date.<br />
Table 1. Specifications of the Fourier Transform Spectrometer<br />
(FTS) sensor<br />
Band 1 Band 2 Band 3 Band 4<br />
Spectral coverage [μm] 0.758~0.775 1.56~1.72 1.92~2.08 5.56~14.3<br />
Spectral resolution [cm -1 ] 0.6 0.27 0.27 0.27<br />
Target species O 2 CO 2 · CH 4 CO 2 · H 2 O CO 2 · CH 4<br />
Instantaneous field of<br />
view/ Field of observation<br />
view at nadir<br />
Single-scan data<br />
acquisition time<br />
* 1 μm = 1/1000 mm<br />
Instantaneous fi eld of view: 15.8 mrad<br />
Field of view for observation (footprint): diameter<br />
of app. 10.5 km<br />
1.1, 2.0, 4.0 seconds<br />
Table 2. Specifications of the Cloud and Aerosol Imager (CAI)<br />
sensor<br />
Band 1 Band 2 Band 3 Band 4<br />
Spectral coverage<br />
[μm]<br />
0.370~0.390<br />
(0.380)<br />
0.668~0.688<br />
(0.678)<br />
0.860~0.880<br />
(0.870)<br />
Target substances Cloud, Aerosol<br />
Swath [km] 1000 1000 1000 750<br />
Spatial resolution<br />
0.5 0.5 0.5 1.5<br />
at nadir [km]<br />
1.56~1.68<br />
(1.62)<br />
Sunlight<br />
Descending<br />
666 km<br />
10km diameter<br />
Ascending<br />
Figure 6. Conceptual diagram of GOSAT observation and the satellite orbits (three days, 44 orbits)<br />
5000km(on the Equator)<br />
3 <strong>Greenhouse</strong> gases Observing SATellite Project
90<br />
45<br />
0<br />
-45<br />
-90<br />
0 30 60 90 120 150 180 210 240 270 300 330 360<br />
Longitude(deg.E)<br />
Copyright (c) 2007 NIES<br />
Analysis Methods of GOSAT data<br />
3<br />
Analysis Methods of GOSAT data<br />
The data taken <strong>by</strong> the FTS and CAI sensors<br />
will be processed as shown in Figure 7. FTS-observed<br />
values provide spectra while CAI-based data will be used<br />
to generate cloud and aerosol information. These data<br />
will be combined together to calculate the CO 2<br />
and CH 4<br />
column abundances at observation points with no or only<br />
thin clouds and aerosol layer present. Furthermore, an atmospheric<br />
transport model will be used with the obtained<br />
distribution of column abundance of CO 2<br />
to estimate the<br />
global distribution of CO 2<br />
fl ux as well as the three-dimensional<br />
distribution of CO 2<br />
concentrations.<br />
CO 2<br />
and CH 4<br />
absorb light with particular wavelengths.<br />
Therefore, <strong>by</strong> measuring how much<br />
light was absorbed <strong>by</strong> these molecules, the<br />
amounts of CO 2<br />
and CH 4<br />
existing through the<br />
optical paths can be calculated . Fig. 8 provides<br />
an example of spectra that are expected to be<br />
obtained from observation <strong>by</strong> FTS. The spectra<br />
structures like teeth of a comb indicate the<br />
absorption <strong>by</strong> gases, such as CO 2<br />
and CH 4<br />
, and<br />
the depths correlate with their column abundances.<br />
Radiance (W/m 2 /micron/str)<br />
Radiance(W/m 2 /micron/str)<br />
Radiance (W/m 2 /micron/str)<br />
Sensors<br />
TANSO-FTS sensor<br />
(provided <strong>by</strong> JAXA)<br />
TANSO-CAI sensor<br />
(provided <strong>by</strong> JAXA)<br />
April<br />
terly basis, and mapped out globally. The next step in<br />
data processing is the estimation of the flux of CO 2<br />
using<br />
the acquired column abundances of CO 2<br />
. We effectively<br />
“reverse” the atmospheric transport model to trace the<br />
origins of the CO 2<br />
detected <strong>by</strong> GOSAT, and estimate the<br />
flux of CO 2<br />
on a sub-continental scale (Fig. 5). The current<br />
method of estimating flux of CO 2<br />
depends solely on<br />
ground-based observation data, which results in significant<br />
errors in estimations for regions such as Africa and South<br />
America, where observation points are scarce. GOSAT is<br />
August<br />
<strong>Observation</strong> data<br />
Interferogram<br />
Cloud/aerosol distribution<br />
Processed products<br />
1.6 1.7<br />
Wavelength(μm)<br />
Spectrum<br />
3D distribution of CO 2<br />
Column abundances of CO 2 and CH 4<br />
Radiance(W/m 2 /micron/str)<br />
Latitude(deg.N)<br />
3<br />
2<br />
1<br />
0<br />
FTS SWIR Pseudo Data<br />
Sun Zenith Angle = 80 deg. Count = 26346<br />
? Low density High density ?<br />
355 357 359 361 363 365 367 369 371 373 (ppm)<br />
Among spectra obtained with FTS, only those<br />
spectra with no clouds in the field of view of the<br />
FTS will be identified with the use of images<br />
CO 2 flux<br />
Figure 7. Outline of GOSAT data processing<br />
from CAI. This is possible because the spatial<br />
resolution of CAI is high enough to detect cloud contamination<br />
in the field of view of FTS. The spectra with no<br />
clouds will then be analyzed using a numeric calculation<br />
capable of acquiring observation data almost uniformly<br />
around the globe and hence is expected to reduce errors in<br />
estimated CO 2<br />
flux. Furthermore, using the distribution of<br />
method called the retrieval method based on<br />
Wavenumber (cm -1 )<br />
20000 15000 12000 10000 8000 7000 6000 5000 4000<br />
the characteristics of absorption <strong>by</strong> gas, and<br />
20<br />
CO 2<br />
flux obtained<br />
in this manner and<br />
Absorption band of water vapor(H2O)<br />
15<br />
Absorption band of carbon dioxide(CO2)<br />
the column abundances of CO 2<br />
and CH 4<br />
will be<br />
the atmospheric<br />
Absorption band of methane(CH4)<br />
10<br />
Absorption band of oxygen(O2)<br />
derived. The CO 2<br />
absorption bands near 1.6μm<br />
transport model, it<br />
Absorption band of ozone(O3)<br />
5<br />
and 2.0 μm are quite important because they<br />
will be possible to<br />
0<br />
0.5 1.0 1.5<br />
provide us with a large amount of information<br />
Wavelength (μm)<br />
2.0 2.5<br />
simulate the global<br />
13200cm<br />
near the earth’s surface where the changes in<br />
12900cm -1 6400cm-1 5800cm -1 5200cm<br />
3<br />
4800cm -1<br />
O2<br />
H2O CO2 CO2 CO2 distribution of CO 2<br />
10<br />
2<br />
1 H2O<br />
CO 2<br />
concentrations are most apparent. The absorption<br />
band near 14 μm is used for obtainsions.<br />
1<br />
in three dimen-<br />
CO2<br />
CH4<br />
0<br />
0<br />
0<br />
0.76 0.77 1.6 1.7 1.95 2.00 2.05<br />
Wavelength (μm) Wavelength (μm) Wavelength (μm)<br />
Band 1<br />
Band 2 Band 3<br />
ing information mainly at altitudes of 2 km and<br />
Wavenumber (cm -1 )<br />
2000 1500 1200 1100 1000 900 800 700<br />
10<br />
above.<br />
H2O<br />
8<br />
CH4<br />
O3 CO2<br />
CO2 Figure 8. Examples of<br />
6<br />
spectra obtainable<br />
through<br />
4<br />
Once enough points of data are accumulated,<br />
GOSAT observation<br />
and<br />
2<br />
the acquired column abundances of CO 2<br />
and 0<br />
5 6 7 8 9 10 11 12 13 14 15<br />
the absorption<br />
Wavelength (μm)<br />
CH 4<br />
can be averaged on a monthly and quar-<br />
bands of CO<br />
Band 4<br />
2<br />
and CH 4<br />
4
Evaluation of Data Analysis Methods and Validation of Products<br />
4<br />
Evaluation of Data Analysis Methods and Validation of Products<br />
The GOSAT Project conducts research (Fig. 10). The column abundances of CO 2<br />
and CH 4<br />
will<br />
on analytical methods for decreasing uncertainty in be compared to observation data taken <strong>by</strong> high-resolution<br />
Fourier transform spectrometer or <strong>by</strong> direct obser-<br />
the calculation of column abundances and evaluates<br />
the validity of the methods <strong>by</strong> conducting simulations.<br />
Furthermore, we are planning to validate in aircraft, while cloud and aerosol data will be validated<br />
vation using the instruments installed on the ground or<br />
the analytical methods and the products processed using ground-based remote sensing instruments such as<br />
from GOSAT data after the satellite is launched. lidar or a sky radiometer. The amounts of CO 2<br />
flux and<br />
Based on the results of the validation, we will conduct<br />
further research into improving our<br />
3D distribution of CO 2<br />
will also be evaluated.<br />
methods.<br />
We have already performed a number of<br />
experiments to simulate satellite observation.<br />
One example of these simulations<br />
involved retrieving CO 2<br />
concentration <strong>by</strong><br />
installing a Fourier transform spectrometer,<br />
which functions on the same principles<br />
as TANSO-FTS, near the top of Mt.<br />
Tsukuba at an altitude of approximately<br />
800 m and observing the sunlight reflected<br />
on the farmland at the foot of the mountain<br />
(Fig. 9). At the same time, a small aircraft<br />
with CO 2<br />
and CH 4<br />
in-situ instruments took<br />
aerial measurements between the nearground<br />
level of the farmland and an altitude<br />
of 3,000 m. The results of these two<br />
observations were compared and found<br />
to be basically in agreement,<br />
proving the reliability of our<br />
method of evaluating the CO 2<br />
column abundance. Further<br />
simulation tests are planned<br />
on an ongoing basis so as to<br />
assess and improve the analysis<br />
methods.<br />
After the launch, the GOSAT<br />
data will be processed into<br />
products which will provide<br />
Farmland<br />
CO 2<br />
in-situ instrument<br />
CH 4<br />
in-situ instrument<br />
FTS<br />
Mt.Tsukuba<br />
Max.3,000m<br />
Figure 9. Outline of simulation tests conducted at Mt. Tsukuba in 2005<br />
Aerosols<br />
GOSAT<br />
FTS onboard<br />
the airplane<br />
Scattered light<br />
In-situ instrument<br />
onboard the airplane<br />
Concentration measurement<br />
at various altitudes<br />
information on CO 2<br />
and CH 4<br />
columns, CO 2<br />
flux, and the<br />
3D distribution of CO 2<br />
(Fig.<br />
7). These products will be<br />
verified and evaluated using<br />
highly accurate data<br />
independently obtained <strong>by</strong><br />
ground platforms or aircraft<br />
Ground-based<br />
high-resolution FTS<br />
Laser beam<br />
Lidar<br />
Sky radiometer<br />
In-situ instrument installed at the terrestrial station<br />
Figure 10. Schematic illustration of post-launch product validation experiments<br />
5 <strong>Greenhouse</strong> gases Observing SATellite Project
Data Distribution<br />
5<br />
Data Distribution<br />
NIES has been developing the GOSAT<br />
Data Handling Facility (DHF), which will process<br />
GOSAT data (Fig. 11). After data reception and Level<br />
1 processing <strong>by</strong> JAXA, GOSAT observation data will<br />
be transferred to the GOSAT DHF via Tsukuba WAN, a<br />
high-speed network in Tsukuba. At the GOSAT DHF,<br />
the GOSAT data and reference data from other sources<br />
will be used to generate the column abundances of CO 2<br />
and CH 4<br />
, CO 2<br />
flux, and the 3D distribution of CO 2<br />
with<br />
the cooperation of external computing centers.<br />
Table 3 shows the standard products that the GOSAT<br />
DHF will provide. Level 1 data to be provided <strong>by</strong><br />
JAXA (L1B of FTS observation) and higher-level products<br />
to be generated <strong>by</strong> NIES (L1B and L1B+ of CAI<br />
and L2, L3, L4A and L4B of FTS) will be available for<br />
use and searching <strong>by</strong> the general public <strong>by</strong> accessing the<br />
GOSAT DHF via networks. The provision of GOSAT<br />
products to the general public is scheduled for after the<br />
validation phase following the launch of the satellite.<br />
In addition, the GOSAT DHF will compile observation<br />
requests from users and forward them to JAXA.<br />
Table 3. Standard products to be provided <strong>by</strong> the GOSAT DHF. See Figure 7 for how each product type will be generated<br />
Product Level Sensor Description<br />
L1B FTS Spectrum data obtained <strong>by</strong> the Fourier transform of interferogram data<br />
CAI<br />
Radiance data including parameters for band-to-band registration and geometric correction<br />
(before map projection)<br />
L1B+ CAI Radiance data including parameters for band-to-band registration, geometric correction and map projection<br />
L2 FTS CO 2 column abundances (TBD)<br />
CH 4 column abundances (TBD)<br />
L3 FTS CO 2 column concentrations projected on a map (Monthly and quarterly averages)<br />
CH 4 column concentrations projected on a map (Monthly and quarterly averages)<br />
L4A - Amount of CO 2 fl ux per region, for each of 64 regions (Monthly averages)<br />
L4B - CO 2 global distribution data (3D, Monthly averages)<br />
L1data<br />
NIES/DHF<br />
GOSAT Data Handling Facility<br />
Data at<br />
each level<br />
JAXA<br />
L2,L3,L4<br />
data<br />
(From JAXA Website)<br />
Data users<br />
Reference<br />
data<br />
Input data,<br />
parameters<br />
Computation<br />
results<br />
Input data,<br />
parameters<br />
Computation<br />
results<br />
Validation and<br />
experiment data<br />
Entities<br />
providing<br />
reference data<br />
Computing center<br />
Computing center<br />
Entities providing<br />
validation and<br />
experiment data<br />
Figure 11. Workfl ow of GOSAT data processing<br />
6
Organization and Schedule<br />
6<br />
Organization and Schedule<br />
GOSAT is scheduled to be launched<br />
in early 2009, with full-fledged data acquisition to<br />
start three to six months after the launch.<br />
NIES has formed a project unit (Fig. 12) for carrying<br />
out the GOSAT Project. This unit will develop<br />
methods for calculating the CO 2<br />
and CH 4<br />
column<br />
abundances from the GOSAT data, develop models<br />
for estimating CO 2<br />
flux, validate and evaluate<br />
the results. At the same time, it will develop and<br />
operate the GOSAT DHF which will process the<br />
data, and provide information to users.<br />
Center for <strong>Global</strong> Environmental Research<br />
Yasuhiro Sasano, Director<br />
(Climate Change Research Project)<br />
Core Research Project 2<br />
Tatsuya Yokota, Leader<br />
Shamil Maksyutov, Sub-leader<br />
Development of data<br />
processing techniques<br />
Ground- and aircraft-based<br />
experiments for validation<br />
Development of carbon<br />
balance models<br />
NIES GOSAT Project<br />
Tatsuya Yokota, Leader<br />
Cooperation<br />
Hiroshi Watanabe,<br />
Office Manager<br />
Development and<br />
operation of DHF<br />
(Project promotion)<br />
NIES GOSAT Project Office<br />
Validation<br />
Osamu Uchino, Manager<br />
Public relations,<br />
other activities<br />
Figure 12. GOSAT Project at NIES<br />
(as of March 2008)<br />
Cooperative sections in NIES<br />
Validation, research on data utilization, etc.<br />
Cooperative organizations<br />
outside NIES<br />
Computing centers, method development,<br />
validation, research on data utilization, etc.<br />
Ministry of the Environment<br />
<br />
National Institute for Environmental Studies<br />
GOSAT Project<br />
<br />
Japan Aerospace Exploration Agency<br />
<br />
For more information, please contact:<br />
GOSAT Project Office<br />
Center for <strong>Global</strong> Environmental Research<br />
National Institute for Environmental Studies<br />
16-2 Onogawa, Tsukuba-shi, Ibaraki<br />
305-8506 Japan<br />
TEL: +81-29-850-2966 FAX: +81-29-850-2219<br />
E-mail: gosat-prj1@nies.go.jp<br />
URL: http://www.gosat.nies.go.jp/index_e.html<br />
Published <strong>by</strong> the Center for <strong>Global</strong><br />
Environmental Research, National<br />
Institute for Environmental Studies<br />
2008.5. 2000