Global Greenhouse Gas Observation by Satellite - Planet Action
Global Greenhouse Gas Observation by Satellite - Planet Action
Global Greenhouse Gas Observation by Satellite - Planet Action

You also want an ePaper? Increase the reach of your titles
YUMPU automatically turns print PDFs into web optimized ePapers that Google loves.
GOSAT Sensors and <strong>Observation</strong> Methods<br />
2<br />
GOSAT Sensors and <strong>Observation</strong> Methods<br />
GOSAT will observe infrared light reaching<br />
its sensors from the earth’s surface and the atmosphere<br />
and give spectra which can be used to calculate the column<br />
abundances of CO 2<br />
and CH 4<br />
. The column abundances<br />
are expressed as the total number of molecules<br />
of target gases over the unit surface area or as the ratio<br />
of target gas molecules to the total number of molecules<br />
in dry air per unit surface area.<br />
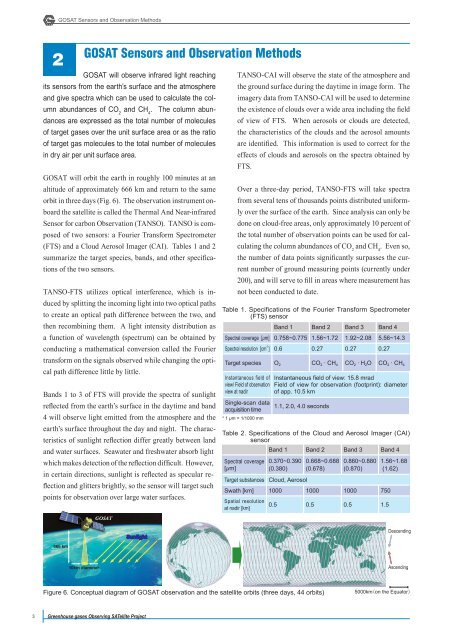
GOSAT will orbit the earth in roughly 100 minutes at an<br />
altitude of approximately 666 km and return to the same<br />
orbit in three days (Fig. 6). The observation instrument onboard<br />
the satellite is called the Thermal And Near-infrared<br />
Sensor for carbon <strong>Observation</strong> (TANSO). TANSO is composed<br />
of two sensors: a Fourier Transform Spectrometer<br />
(FTS) and a Cloud Aerosol Imager (CAI). Tables 1 and 2<br />
summarize the target species, bands, and other specifications<br />
of the two sensors.<br />
TANSO-FTS utilizes optical interference, which is induced<br />
<strong>by</strong> splitting the incoming light into two optical paths<br />
to create an optical path difference between the two, and<br />
then recombining them. A light intensity distribution as<br />
a function of wavelength (spectrum) can be obtained <strong>by</strong><br />
conducting a mathematical conversion called the Fourier<br />
transform on the signals observed while changing the optical<br />
path difference little <strong>by</strong> little.<br />
Bands 1 to 3 of FTS will provide the spectra of sunlight<br />
reflected from the earth’s surface in the daytime and band<br />
4 will observe light emitted from the atmosphere and the<br />
earth’s surface throughout the day and night. The characteristics<br />
of sunlight reflection differ greatly between land<br />
and water surfaces. Seawater and freshwater absorb light<br />
which makes detection of the reflection difficult. However,<br />
in certain directions, sunlight is reflected as specular reflection<br />
and glitters brightly, so the sensor will target such<br />
points for observation over large water surfaces.<br />
GOSAT<br />
TANSO-CAI will observe the state of the atmosphere and<br />
the ground surface during the daytime in image form. The<br />
imagery data from TANSO-CAI will be used to determine<br />
the existence of clouds over a wide area including the field<br />
of view of FTS. When aerosols or clouds are detected,<br />
the characteristics of the clouds and the aerosol amounts<br />
are identified. This information is used to correct for the<br />
effects of clouds and aerosols on the spectra obtained <strong>by</strong><br />
FTS.<br />
Over a three-day period, TANSO-FTS will take spectra<br />
from several tens of thousands points distributed uniformly<br />
over the surface of the earth. Since analysis can only be<br />
done on cloud-free areas, only approximately 10 percent of<br />
the total number of observation points can be used for calculating<br />
the column abundances of CO 2<br />
and CH 4<br />
. Even so,<br />
the number of data points significantly surpasses the current<br />
number of ground measuring points (currently under<br />
200), and will serve to fill in areas where measurement has<br />
not been conducted to date.<br />
Table 1. Specifications of the Fourier Transform Spectrometer<br />
(FTS) sensor<br />
Band 1 Band 2 Band 3 Band 4<br />
Spectral coverage [μm] 0.758~0.775 1.56~1.72 1.92~2.08 5.56~14.3<br />
Spectral resolution [cm -1 ] 0.6 0.27 0.27 0.27<br />
Target species O 2 CO 2 · CH 4 CO 2 · H 2 O CO 2 · CH 4<br />
Instantaneous field of<br />
view/ Field of observation<br />
view at nadir<br />
Single-scan data<br />
acquisition time<br />
* 1 μm = 1/1000 mm<br />
Instantaneous fi eld of view: 15.8 mrad<br />
Field of view for observation (footprint): diameter<br />
of app. 10.5 km<br />
1.1, 2.0, 4.0 seconds<br />
Table 2. Specifications of the Cloud and Aerosol Imager (CAI)<br />
sensor<br />
Band 1 Band 2 Band 3 Band 4<br />
Spectral coverage<br />
[μm]<br />
0.370~0.390<br />
(0.380)<br />
0.668~0.688<br />
(0.678)<br />
0.860~0.880<br />
(0.870)<br />
Target substances Cloud, Aerosol<br />
Swath [km] 1000 1000 1000 750<br />
Spatial resolution<br />
0.5 0.5 0.5 1.5<br />
at nadir [km]<br />
1.56~1.68<br />
(1.62)<br />
Sunlight<br />
Descending<br />
666 km<br />
10km diameter<br />
Ascending<br />
Figure 6. Conceptual diagram of GOSAT observation and the satellite orbits (three days, 44 orbits)<br />
5000km(on the Equator)<br />
3 <strong>Greenhouse</strong> gases Observing SATellite Project