Water hammer arrester - Caleffi
Water hammer arrester - Caleffi
Water hammer arrester - Caleffi

Create successful ePaper yourself
Turn your PDF publications into a flip-book with our unique Google optimized e-Paper software.
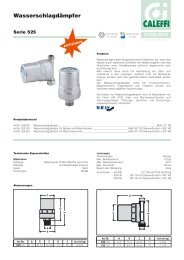
The water <strong>hammer</strong> phenomenon<br />
In domestic water systems, water <strong>hammer</strong> phenomenon occurs<br />
when a pipe is closed rapidly by a device such as a single-lever<br />
mixing tap, solenoid valve, ball valve, etc.. The abruptness of the<br />
operation creates a perturbation in the water pressure which<br />
propagates along the pipe in the form of an overpressure wave.<br />
The perturbation starts from the check device, travels upstream,<br />
reflects against other devices or elbows in the pipe and returns<br />
downstream, damping progressively. The overpressure thus adds<br />
to the existing pressure in the pipe (as visible in the next page<br />
diagram), causing the following problems:<br />
- breakage of pipes, tanks and hoses<br />
- wear of seals, connecting welds and sanitary appliances<br />
- damage to shut-off, check and regulating equipments<br />
- high noise and powerful vibrations in both the pipes and the<br />
structures.<br />
The amount of the overpressure is influenced by numerous factors,<br />
which make the phenomenon difficult to reproduce under<br />
laboratory conditions:<br />
- equipment closing times<br />
- length, diameter and material of the pipe<br />
- velocity of the water.<br />
For the practical purpose of calculating the water <strong>hammer</strong><br />
overpressure, the following formula combines the most common<br />
variables in a domestic water system:<br />
2 · v<br />
Δp = –––––––– 1 · L<br />
g · t<br />
Δp = overpressure due to water <strong>hammer</strong> (m w.g.)<br />
v 1 = water velocity at time of closure start (m/s)<br />
L = length of pipe (m)<br />
g = acceleration of gravity (9,81 m/s 2)<br />
t = valve closing time (s)<br />
We can briefly indicate the physical significance of the “closing<br />
time” (better defined as “phase time”) with the following formula:<br />
2 · L<br />
t* = –––––––– (2)<br />
v2 t* = valve phase time (s)<br />
L = length of pipe (m)<br />
v2 = velocity of the perturbation propagation (m/s) (as a function of<br />
the medium, pipe material, inner diameter and thickness of<br />
the pipe).<br />
For mechanical devices such as single-lever mixing taps, solenoid<br />
valves, ball valves, etc., all closing times t ≤ t* are defined “sudden<br />
operations” and induce a water <strong>hammer</strong> in the pipe with an<br />
overpressure at the maximum intensity, which is the same for any<br />
operating time. On the other hand, a closing time t > t* is defined<br />
“slow operation” and causes a less intense water <strong>hammer</strong> effect,<br />
which may even be negligible.<br />
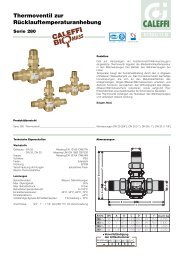
By setting t = t* within the formula (1), we obtain the maximum<br />
overpressure Δp value for the water <strong>hammer</strong> effect.<br />
This will be evident from the following graph.<br />
Δp<br />
Δp max.<br />
Overpressure<br />
Sudden<br />
operation<br />
(1)<br />
t*<br />
(phase time)<br />
formula valid for t > t*, [ see next definition ]<br />
Slow<br />
operation<br />
Closing time<br />
t<br />
Overpressure Δp (bar)<br />
Numerical example: pipe length 10 m, diameter equivalent to 1/2”,<br />
steel, copper and PE-X pipes with water velocity v 1 = 2 m/s. We<br />
give the values of the velocity of the perturbation propagation v 2,<br />
sudden operating times t* (phase time) and the overpressure Δp<br />
obtained with the formulas.<br />
L (m) v 1(m/s) v 2 (m/s) t* (ms) Δp (m w.g.) Δp (bar)<br />
Steel 10 2 1411 14,2 288 28,8<br />
Copper 10 2 1400 14,3 285 28,5<br />
PE-X 10 2 885 22,6 180 18<br />
Due to the greater stiffness of metal pipes, the velocity of the<br />
perturbation v 2 is greater than in plastic pipes and close to the<br />
velocity of sound in water (1420 m/s at 7°C). From these results, it<br />
is evident that plastic pipes for domestic water systems are more<br />
easily subject to water <strong>hammer</strong>, since they have a longer phase<br />
time t* than metal pipes. In practice, this means that closing<br />
operating times must be slower than in metal pipes. Although the<br />
overpressure values Δp for plastic pipes are lower than those for<br />
metal pipes (since they are less stiff, they partially dampen the<br />
water <strong>hammer</strong>), such overpressures can nonetheless stress the<br />
pipes beyond their resistance limit. Furthermore, in wall<br />
installations, the presence of a corrugated sheath or insulation<br />
influences the stiffness of plastic pipes, making the calculation of<br />
the water <strong>hammer</strong> even more complicated.<br />
From the example given, it is clear that the use of a water <strong>hammer</strong><br />
<strong>arrester</strong>, already useful for metal pipes, is even more advisable for<br />
domestic water systems with plastic pipes, especially if installed<br />
externally.<br />
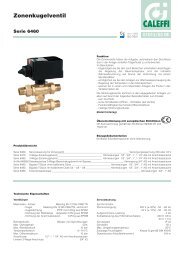
The graph at the bottom of the page shows the influence of the<br />
various parameters on the overpressure in copper pipes at the time<br />
of the pipe closure. The three curves were obtained setting a<br />
closing time t equal to the phase time t* of a 100 m pipe of size<br />
20x1.<br />
We can draw the following conclusions:<br />
1) The longer the pipe, the greater the phase time t* and hence<br />
operations must be slower to prevent water <strong>hammer</strong> (formula<br />
(2)).<br />
2) For a given operating time t and medium velocity v 1, the longer<br />
the pipe, the greater the Δp caused by the operation<br />
(formula (1)).<br />
3) For a given medium velocity v 1 and length of pipe, larger<br />
diameters yield a slightly lower Δp (formula (1), but the<br />
difference is close to be negligible).<br />
4) For a given pipe length and operating time t, if the medium<br />
velocity v 1 increases, the Δp generated by the operation also<br />
increases (formula (1) and graph at foot of page).<br />
80<br />
70<br />
60<br />
50<br />
40<br />
30<br />
20<br />
10<br />
0<br />
1<br />
Copper pipe v 2 (m/s) t* (ms) 100 m pipe<br />
20x1 1393 143,5<br />
Overpressure in copper pipe 20x1<br />
Diagram obtained by setting the<br />
operation time t = t* = phase time<br />
of the 100 m pipe<br />
20x1 v1 = 1 m/s<br />
20x1 v1 = 2 m/s<br />
20x1 v1 = 5 m/s<br />
10<br />
Pipe length (m)<br />
100