Rapid Determination of Moisture/Solids and Fat in Dairy Products by ...
Rapid Determination of Moisture/Solids and Fat in Dairy Products by ...
Rapid Determination of Moisture/Solids and Fat in Dairy Products by ...

Create successful ePaper yourself
Turn your PDF publications into a flip-book with our unique Google optimized e-Paper software.
FOOD COMPOSITION AND ADDITIVES<br />
<strong>Rapid</strong> <strong>Determ<strong>in</strong>ation</strong> <strong>of</strong> <strong>Moisture</strong>/<strong>Solids</strong> <strong>and</strong> <strong>Fat</strong> <strong>in</strong> <strong>Dairy</strong><br />
<strong>Products</strong> <strong>by</strong> Microwave <strong>and</strong> Nuclear Magnetic Resonance<br />
Analysis<br />
METHOD AUTHORS:<br />
GARY CART WRIGHT<br />
North Carol<strong>in</strong>a State Uni ver sity, De part ment <strong>of</strong> Food<br />
Sci ence, Cam pus Box 7624/4,1 Schaub Hall, Ra leigh, NC<br />
27695-7624, Tel: 919-513-2488<br />
BOBBIE H. MCMANUS, 1 TIM O THY P. LEFFLER, <strong>and</strong><br />
CINDY R. MOSER 1<br />
CEM Corp., 3100 Smith Farm Rd, Matthews, NC 28105,<br />
Tel: 704-821-7015<br />
SUB MIT TING LAB O RA TORY:<br />
CEM Corp., 3100 Smith Farm Rd, Matthews, NC 28112<br />
PEER LAB O RA TORY:<br />
North Carol<strong>in</strong>a State Uni ver sity, De part ment <strong>of</strong> Food<br />
Sci ence, Ra leigh, NC 27695<br />
Abstract<br />
A peer-ver i fied method is pre sented for the de ter mi na tion<br />
<strong>of</strong> per cent mois ture/sol ids <strong>and</strong> fat <strong>in</strong> dairy prod ucts <strong>by</strong><br />
mi cro wave dry <strong>in</strong>g <strong>and</strong> nu clear mag netic res o nance (NMR)<br />
analysis. The method <strong>in</strong> volves de ter m<strong>in</strong> <strong>in</strong>g the<br />
mois ture/sol ids con tent <strong>of</strong> dairy sam ples <strong>by</strong> mi cro wave dry <strong>in</strong>g<br />
<strong>and</strong> us <strong>in</strong>g the dried sam ple to de ter m<strong>in</strong>e the fat con tent <strong>by</strong><br />
NMR anal y sis. Both the sub mit t<strong>in</strong>g <strong>and</strong> peer lab o ra to ries<br />
an a lyzed var i ous dairy prod ucts <strong>by</strong> us <strong>in</strong>g a CEM SMART<br />
sys tem (mois ture) <strong>and</strong> the SMART Trac (fat). The sam ples<br />
<strong>in</strong> cluded milks, creams, ice cream mix, sour cream, yo gurt,<br />
cream cheese, <strong>and</strong> moz za rella, Swiss, <strong>and</strong> ched dar cheeses.<br />
These sam ples rep re sented a range <strong>of</strong> prod ucts that pro ces sors<br />
deal with <strong>in</strong> daily plant op er a tions. The re sults were com pared<br />
with mois ture/solids <strong>and</strong> fat values derived from<br />
AOAC-approved methods.<br />
1 Summary <strong>of</strong> Re sults<br />
1.1 Matrixes<br />
This pa per ad dresses the de ter mi na tion <strong>of</strong> mois ture/sol ids<br />
<strong>and</strong> fat <strong>in</strong> a range <strong>of</strong> dairy prod ucts <strong>in</strong> clud <strong>in</strong>g milks, creams,<br />
ice cream mix, yo gurt, <strong>and</strong> cheeses.<br />
1 Authors to whom correspondence should be addressed; e-mail:<br />
bobbie.mcmanus@cem.com <strong>and</strong> c<strong>in</strong>dy.moser@cem.com.<br />
CART WRIGHT ET AL.: JOURNAL OF AOAC INTERNATIONAL VOL. 88, NO. 1, 2005 1<br />
PVM 1:2004<br />
1.2 Number <strong>of</strong> Samples<br />
The <strong>Dairy</strong> Qual ity Con trol In sti tute (DQCI Ser vices, Inc.)<br />
re ported the re sults ob ta<strong>in</strong>ed <strong>by</strong> AOAC Method 990.20 (1) for<br />
the sol ids anal y ses <strong>of</strong> the milks <strong>and</strong> creams.<br />
CEM per formed the sol ids anal y ses <strong>of</strong> the yo gurt sam ples<br />
ac cord <strong>in</strong>g to the steps out l<strong>in</strong>ed <strong>in</strong> AOAC Method 990.20.<br />
Mois ture anal y ses <strong>of</strong> the cheese sam ples were per formed <strong>by</strong><br />
CEM ac cord <strong>in</strong>g to the steps out l<strong>in</strong>ed <strong>in</strong> AOAC Method<br />
926.08, <strong>and</strong> ice cream sol ids were de ter m<strong>in</strong>ed <strong>by</strong> CEM<br />
ac cord <strong>in</strong>g to AOAC Method 941.08. The stan dard meth ods<br />
were run 5 times for each yo gurt, cheese, <strong>and</strong> ice cream<br />
sample.<br />
Crude fat anal y ses <strong>of</strong> the dairy sam ples were per formed<br />
ac cord <strong>in</strong>g to the steps out l<strong>in</strong>ed <strong>in</strong> AOAC Method 989.05 for<br />
the milks <strong>and</strong> creams, <strong>and</strong> the re sults were re ported <strong>by</strong> DQCI<br />
Ser vices, Inc.<br />
For sour cream <strong>and</strong> yo gurt sam ples, AOAC Method<br />
905.02 was run 5 times <strong>by</strong> CEM. For the cheese sam ples,<br />
AOAC Method 933.05 was used, <strong>and</strong> for ice cream, AOAC<br />
Method 952.06 was run 5 times <strong>by</strong> CEM.<br />
The sub mit t<strong>in</strong>g <strong>and</strong> peer lab o ra to ries <strong>in</strong> de pend ently<br />
per formed anal y ses <strong>of</strong> 11 prod ucts (10 times each) for both<br />
mois ture/sol ids <strong>and</strong> fat <strong>by</strong> us <strong>in</strong>g a SMART sys tem (mi cro wave<br />
dry <strong>in</strong>g sys tem man u fac tured <strong>by</strong> CEM Corp.) <strong>and</strong> SMART Trac<br />
(NMR sys tem man u fac tured <strong>by</strong> CEM Corp.), respectively.<br />
2 Safety Precautions<br />
It is rec om mended that per sons with heart pace mak ers or<br />
other mag net i cally sen si tive de vices do not ap proach with<strong>in</strong><br />
11 <strong>in</strong>. (0.3 m) <strong>of</strong> the SMART Trac mag net com po nent. Cer ta<strong>in</strong><br />
heart pace mak ers or other mag net i cally sen si tive pros thetic<br />
de vices may be af fected <strong>by</strong> mag netic fields as low as 0.5 mT.<br />
3 Scope<br />
This method uses a mi cro wave dry <strong>in</strong>g method <strong>and</strong> a rapid<br />
NMR procedure for the de ter mi na tion <strong>of</strong> mois ture/sol ids <strong>and</strong><br />
fat, re spec tively, <strong>in</strong> dairy prod ucts. These tests cover a va ri ety<br />
<strong>of</strong> dairy prod ucts <strong>and</strong> a wide range <strong>of</strong> mois ture/sol ids <strong>and</strong> fat<br />
levels.
2 CART WRIGHT ET AL.: JOURNAL OF AOAC INTERNATIONAL VOL. 88, NO. 1, 2005<br />
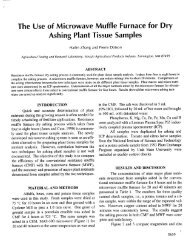
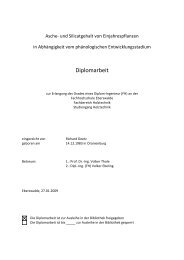
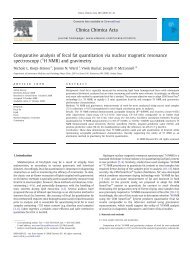
Figure 1. Approximate sample size <strong>and</strong> spread<br />
technique for various sample types.<br />
4 References<br />
(1) Of fi cial Meth ods <strong>of</strong> Anal y sis (2000) 17th Ed., AOAC<br />
IN TER NA TIONAL, Gaithersburg, MD<br />
(2) Youden, W.J., & Ste<strong>in</strong>er, E.H. (1975) Sta tis ti cal Man ual <strong>of</strong><br />
the AOAC, AOAC, Arl<strong>in</strong>gton, VA<br />
5 Def<strong>in</strong>itions <strong>and</strong> Abbreviations<br />
(5.1) NMR.—Nu clear mag netic res o nance.<br />
(5.2) RF.—Ra dio fre quency.<br />
(5.3) NCSU.—North Carol<strong>in</strong>a State Uni ver sity.<br />
(5.4) NIR.—Near <strong>in</strong> fra red.<br />
(5.5) LR-NMR.—Low-res o lu tion time-do ma<strong>in</strong> NMR.<br />
(5.6) DQCI.—<strong>Dairy</strong> Qual ity Con trol In sti tute.<br />
6 Pr<strong>in</strong>ciple<br />
NMR, dis cov ered <strong>in</strong> the mid dle <strong>of</strong> the last cen tury, is based<br />
on the ob ser va tion that cer ta<strong>in</strong> nu clei will ab sorb <strong>and</strong> re-emit<br />
RF en ergy over a nar row b<strong>and</strong> <strong>of</strong> fre quen cies when placed <strong>in</strong> a<br />
static mag netic field. The fre quency at which the NMR ef fect<br />
oc curs for a given nu clear iso tope is de pend ent on the strength<br />
<strong>of</strong> the mag netic field <strong>of</strong> the mag net, <strong>and</strong> the phe nom e non is<br />
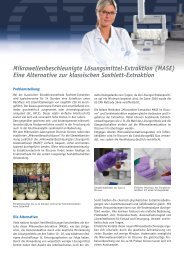
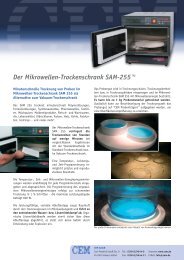
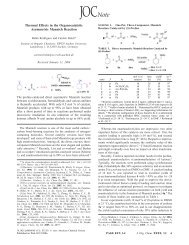
Figure 2. Place the 2 square pads <strong>and</strong> dried sample <strong>in</strong><br />
the center <strong>of</strong> the Trac film. Fold the left corner <strong>of</strong> the<br />
film <strong>and</strong> pads as illustrated. Fold the right corner. Pull<br />
the lower edge <strong>of</strong> the film <strong>and</strong> sample pads toward the<br />
top <strong>and</strong> beg<strong>in</strong> to roll them <strong>in</strong>to a tube.<br />
caused <strong>by</strong> the <strong>in</strong> ter ac tion be tween the nu clear mag netic di pole<br />
<strong>of</strong> a nu cleus <strong>and</strong> the mag netic field it ex pe ri ences. (The lat ter<br />
is the rea son why the word “nu clear” is <strong>in</strong> cluded <strong>in</strong> the<br />
de scrip tion <strong>of</strong> the phe nom e non. NMR does not <strong>in</strong>volve the<br />
emission <strong>of</strong> ioniz<strong>in</strong>g radiation.)<br />
Al though many nu clei can be made to gen er ate an NMR<br />
sig nal, the over whelm <strong>in</strong>g ma jor ity <strong>of</strong> NMR ex per i ments<br />
<strong>in</strong> volve the ex ci ta tion <strong>and</strong> de tec tion <strong>of</strong> sig nals from the 1 H<br />
nu cleus; this branch <strong>of</strong> the sci ence is com monly known as<br />
“pro ton NMR.” NMR has been widely used as the ba sis <strong>of</strong> an<br />
an a lyt i cal spec tros copy tech nique (NMR spec tros copy) for<br />
sev eral de cades <strong>and</strong> is also the ba sis <strong>of</strong> mag netic res o nance<br />
im ag <strong>in</strong>g (MRI), which has been used as a cl<strong>in</strong> i cal diagnostic<br />
tool for nearly 20 years.<br />
The NMR tech nique <strong>in</strong> cor po rated <strong>in</strong>to the SMART Trac<br />
sys tem is based on LR-NMR. This is a small “<strong>of</strong>f shoot” <strong>of</strong><br />
NMR spec tros copy that has also been used for >20 years for<br />
<strong>in</strong> dus trial qual ity con trol. The vast ma jor ity <strong>of</strong> LR-NMR is<br />
pro ton NMR. The ma<strong>in</strong> dif fer ence be tween LR-NMR <strong>and</strong><br />
NMR spec tros copy is <strong>in</strong> the ef fects used for dis crim i nat <strong>in</strong>g<br />
be tween dif fer ent hy dro gen-con ta<strong>in</strong> <strong>in</strong>g constituents <strong>of</strong> a<br />
sample.<br />
In NMR spec tros copy, these con stit u ents are dis t<strong>in</strong> guished<br />
<strong>by</strong> small vari a tions <strong>in</strong> the mag netic field that 1 H nu clei
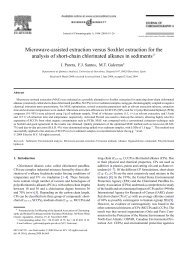
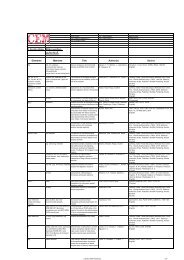
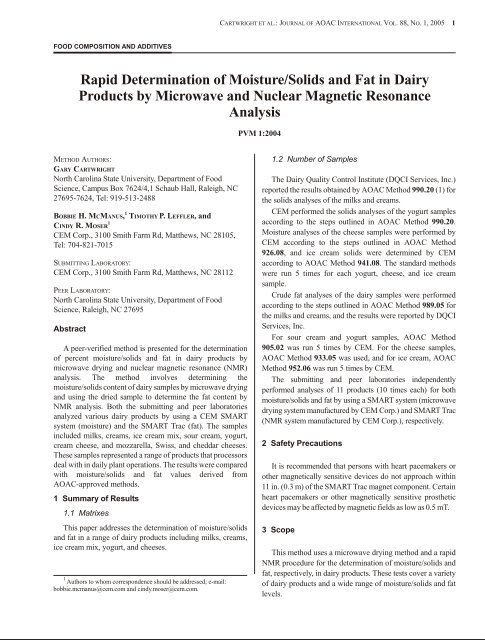
Figure 3. For samples that are rigid after be<strong>in</strong>g dried<br />
<strong>and</strong> more difficult to roll <strong>in</strong>to a cyl<strong>in</strong>der, prepare the<br />
pads as illustrated above.<br />
ex pe ri ence <strong>in</strong> dif fer ent mol e cules <strong>and</strong> dif fer ent parts <strong>of</strong> the<br />
same mol e cule. These vari a tions are caused <strong>by</strong> dif fer ences <strong>in</strong><br />
the elec tronic struc tures <strong>of</strong> mol e cules <strong>and</strong> lead to small<br />
dif fer ences <strong>in</strong> the NMR fre quen cies <strong>of</strong> 1 H nu clei <strong>in</strong> dif fer ent<br />
mol e cules that can be used to dis crim i nate be tween the<br />
dif fer ent con stit u ents with<strong>in</strong> the sam ple. This phe nom e non is<br />
known as the chemical shift effect.<br />
In LR-NMR, it is not pos si ble to de tect chem i cal shift<br />
ef fects <strong>in</strong> sam ples con ta<strong>in</strong> <strong>in</strong>g 1 H nu clei be cause <strong>of</strong> the low<br />
field strength <strong>and</strong> ho mo ge ne ity <strong>of</strong> the mag net used to gen er ate<br />
the static mag netic field. In stead, dif fer ences <strong>in</strong> the rate <strong>of</strong><br />
de cay <strong>of</strong> the sig nal from dif fer ent con stit u ents (com monly<br />
known as trans verse re lax ation or T 2 de cay) are used to<br />
dis t<strong>in</strong> guish be tween NMR sig nals from dif fer ent con stit u ents<br />
with<strong>in</strong> the sam ple. Trans verse re lax ation can gen er ally be<br />
ap prox i mated as an ex po nen tial de cay with time con stant T 2.<br />
In food that has un der gone mi cro wave dry <strong>in</strong>g, the ma<strong>in</strong><br />
con stit u ents that con ta<strong>in</strong> sig nif i cant amounts <strong>of</strong> pro tons are<br />
fat, pro te<strong>in</strong>, <strong>and</strong> car bo hy drate. There are sig nif i cant<br />
dif fer ences be tween the pro ton trans verse re lax ation times<br />
(T 2) <strong>of</strong> these con stit u ents. In par tic u lar, both pro te<strong>in</strong> <strong>and</strong><br />
car bo hy drate <strong>in</strong> dried foods ex hibit “solid-like” be hav ior <strong>and</strong><br />
have trans verse re lax ation times that are very short (typ i cally<br />
<strong>of</strong> the or der <strong>of</strong> ≤10 μs), <strong>and</strong> the sig nal from these sub stances<br />
CART WRIGHT ET AL.: JOURNAL OF AOAC INTERNATIONAL VOL. 88, NO. 1, 2005 3<br />
de cays very rap idly. How ever, the trans verse re lax ation times<br />
for fat are con sid er ably lon ger (typ i cally <strong>of</strong> the or der <strong>of</strong><br />
≥10 ms), <strong>and</strong> thus the sig nal de cays rel a tively slowly. In<br />
ad di tion, any very small amounts <strong>of</strong> re sid ual mois ture that<br />
re ma<strong>in</strong> af ter mi cro wave dry <strong>in</strong>g <strong>of</strong> the sam ple are as so ci ated<br />
with the nonlipid mol e cules with<strong>in</strong> it (i.e., pro te<strong>in</strong> <strong>and</strong><br />
car bo hy drate) <strong>and</strong> also ex hibit “solid-like” be hav ior. Thus, it<br />
is pos si ble to dis crim i nate be tween the fat <strong>and</strong> the other<br />
pr<strong>in</strong> ci pal con stit u ents <strong>of</strong> a dried food <strong>by</strong> ex cit <strong>in</strong>g the sys tem,<br />
wait <strong>in</strong>g for the “solid-like” sig nals to de cay, <strong>and</strong> then<br />
ac quir <strong>in</strong>g the re ma<strong>in</strong> <strong>in</strong>g sig nal which, <strong>in</strong> the absence <strong>of</strong><br />
moisture, is predom<strong>in</strong>antly from protons conta<strong>in</strong>ed <strong>in</strong> fat<br />
with<strong>in</strong> the sample.<br />
The <strong>in</strong> ten sity <strong>of</strong> an NMR sig nal ac quired from a dried food<br />
sam ple <strong>by</strong> us <strong>in</strong>g the meth od ol ogy de scribed above will be<br />
di rectly pro por tional to the num ber <strong>of</strong> pro tons with<strong>in</strong> the fat<br />
con ta<strong>in</strong>ed <strong>in</strong> the sam ple <strong>and</strong>, for many sam ples, di rectly<br />
pro por tional to the fat con tent <strong>of</strong> the sample.<br />
Low-res o lu tion NMR tech niques based on meth od ol o gies<br />
sim i lar to that de scribed above are used widely for qual ity<br />
con trol <strong>in</strong> a num ber <strong>of</strong> <strong>in</strong> dus tries, <strong>and</strong> some <strong>of</strong> these meth ods<br />
have been ap proved <strong>by</strong> <strong>in</strong> ter na tional stan dards or ga ni za tions.<br />
For ex am ple, see Amer i can So ci ety for Test <strong>in</strong>g <strong>and</strong> Ma te ri als<br />
(ASTM) D3701 <strong>and</strong> D4808 for de ter mi na tion <strong>of</strong> the hy dro gen<br />
con tent <strong>in</strong> var i ous pe tro leum prod ucts <strong>and</strong> In ter na tional<br />
Stan dards Or ga ni za tion (ISO) 10565 for determ<strong>in</strong>ation <strong>of</strong> oil<br />
<strong>and</strong> moisture <strong>in</strong> seeds.<br />
7 St<strong>and</strong>ards<br />
Not ap pli ca ble.<br />
8 Supplies<br />
(8.1) Glass fi ber pads.—CEM Corp. or equiv a lent.<br />
(8.2) Trac film.—CEM Corp. or equiv a lent.<br />
9 Apparatus <strong>and</strong> Equipment<br />
(9.1) Mi cro wave mois ture/sol ids an a lyzer.—Sen si tiv ity<br />
<strong>of</strong> 0.2 mg wa ter; mois ture range <strong>of</strong> 0.01–99.99% <strong>in</strong> liq uids,<br />
sol ids, <strong>and</strong> slur ries; 0.01% res o lu tion. In cludes au to matic<br />
elec tronic bal ance (0.1 mg read abil ity), mi cro wave dry <strong>in</strong>g<br />
sys tem with tem per a ture feed back <strong>and</strong> mi cro pro ces sor<br />
com puter control (CEM Corp.); or equivalent.<br />
(9.2) NMR–RF pulse gen er a tor.—Pulse power, 250 W<br />
nom i nal; pulse times, vari able <strong>in</strong> 100 ns <strong>in</strong> cre ments; trans mit<br />
<strong>and</strong> re ceive phases, selectable 0°, 90°, 180°, <strong>and</strong> 270°;<br />
nom i nal 90° pulse times, 4 μs (18 mm probe). Mag net:<br />
per ma nent, ther mally sta bi lized, 0.47 T (20 MHz), <strong>and</strong><br />
ho mo ge ne ity better than 10 ppm. Sig nal de tec tion:<br />
dual-chan nel (quad ra ture) de tec tion with pro gram ma ble<br />
low-pass fil ter <strong>in</strong>g, pro gram ma ble data ac qui si tion rate up to<br />
4 MHz per pair <strong>of</strong> po<strong>in</strong>ts (CEM Corp.); or equivalent.
4 CART WRIGHT ET AL.: JOURNAL OF AOAC INTERNATIONAL VOL. 88, NO. 1, 2005<br />
Table 1. Results from analyses <strong>of</strong> DQCI milk sample 9, set 239 a<br />
SMART Trac results from CEM SMART Trac results from NCSU AOAC results from DQCI<br />
Sample ID Wt, g Microwave, S, % NMR, F, % Wt, g Microwave, S, % NMR, F, %<br />
Method<br />
990.10, S, %<br />
Method<br />
989.05, F, %<br />
1 4.1443 11.77 2.99 3.8945 11.83 3.00 11.79 3.0193<br />
2 4.3300 11.78 2.98 4.1822 11.83 3.01 11.78 3.0094<br />
3 4.4346 11.80 2.97 4.1213 11.81 3.00 3.0213<br />
4 4.7113 11.81 2.98 4.0613 11.80 3.00<br />
5 4.4751 11.77 2.96 4.0441 11.80 3.03<br />
6 3.9464 11.79 3.01 4.4162 11.80 3.00<br />
7 3.8453 11.79 3.01 4.1109 11.77 2.98<br />
8 3.6758 11.78 3.01 4.0890 11.83 2.99<br />
9 3.6831 11.78 2.99 4.1664 11.78 3.01<br />
10 3.7225 11.79 3.01 4.2647 11.82 2.98<br />
Mean 11.79 2.99 11.81 3.00 11.79 3.02<br />
SD b<br />
a S = <strong>Solids</strong>; F = fat.<br />
b SD = St<strong>and</strong>ard deviation.<br />
0.013 0.019 0.021 0.015 0.007 0.006<br />
Table 2. Results from analyses <strong>of</strong> DQCI reduced milk sample 5, set 239 a<br />
SMART Trac results from CEM SMART Trac results from NCSU AOAC results from DQCI<br />
Sample ID Wt, g Microwave, S, % NMR, F, % Wt, g Microwave, S, % NMR, F, %<br />
Method<br />
990.10, S, %<br />
Method<br />
989.05, F, %<br />
1 4.3015 9.93 0.99 4.0372 9.88 0.97 9.87 0.9827<br />
2 3.9614 9.93 0.97 3.7935 9.93 0.98 9.87 1.0133<br />
3 4.3538 9.92 0.97 3.9850 9.94 0.99 0.9956<br />
4 3.6101 9.87 0.98 4.1085 9.93 0.99<br />
5 3.5606 9.93 0.99 4.0157 9.93 0.99<br />
6 3.8770 9.90 0.96 4.4296 9.93 0.98<br />
7 4.1012 9.92 0.96 4.1261 9.91 0.98<br />
8 3.9439 9.93 0.96 4.1844 9.93 1.00<br />
9 4.1969 9.93 0.98 4.0369 9.88 1.00<br />
10 4.6306 9.87 0.98 4.5477 9.89 0.97<br />
Mean 9.91 0.97 9.92 0.99 9.87 1.00<br />
SD b<br />
a S = <strong>Solids</strong>; F = fat.<br />
b SD = St<strong>and</strong>ard deviation.<br />
0.025 0.012 0.023 0.011 0.000 0.015
Table 3. Results from analyses <strong>of</strong> DQCI heavy cream a<br />
CART WRIGHT ET AL.: JOURNAL OF AOAC INTERNATIONAL VOL. 88, NO. 1, 2005 5<br />
SMART Trac results from CEM SMART Trac results from NCSU AOAC results from DQCI<br />
Sample ID Wt, g Microwave, S, % NMR, F, % Wt, g Microwave, S, % NMR, F, %<br />
Method<br />
990.20, S, %<br />
Method<br />
989.05, F, %<br />
1 2.5523 45.59 39.83 2.6443 45.52 39.95 45.57 39.96<br />
2 2.3591 45.61 39.95 2.4219 45.49 39.93 45.57 39.90<br />
3 2.4594 45.53 40.01 2.5356 45.52 39.84<br />
4 2.3075 45.63 39.92 2.5842 45.51 39.85<br />
5 2.5811 45.56 39.83 2.3451 45.35 39.96<br />
6 2.6227 45.61 39.86 2.0813 45.57 40.07<br />
7 2.4871 45.59 40.01 2.2943 45.54 40.07<br />
8 2.3598 45.66 40.00 2.4101 45.54 39.88<br />
9 2.3285 45.56 39.85 2.6731 45.52 39.95<br />
10 2.4629 45.65 40.00 2.2915 45.40 39.92<br />
Mean 45.60 39.93 45.50 39.94 45.57 39.93<br />
SD b<br />
a S = <strong>Solids</strong>; F = fat.<br />
b SD = St<strong>and</strong>ard deviation.<br />
0.041 0.078 0.068 0.079 0.000 0.042<br />
Table 4. Results from analyses <strong>of</strong> light cream sample 4, set 538 a<br />
SMART Trac results from CEM SMART Trac results from NCSU AOAC results from DQCI<br />
Sample ID Wt, g Microwave, S, % NMR, F, % Wt, g Microwave, S, % NMR, F, %<br />
Method<br />
990.20, S, %<br />
Method<br />
989.05, F, %<br />
1 2.3534 20.85 12.92 2.5073 20.83 12.97 20.86 12.9130<br />
2 2.3827 20.83 12.91 2.5196 20.77 12.93 20.85 12.8951<br />
3 2.5486 20.80 12.89 2.2672 20.85 12.92 20.85 12.8395<br />
4 2.4339 20.82 12.92 2.2035 20.78 12.90<br />
5 2.4584 20.77 12.86 2.4807 20.78 12.88<br />
6 2.3064 20.74 12.95 2.5304 20.92 12.91<br />
7 2.3418 20.87 12.92 2.4260 20.75 12.88<br />
8 2.4656 20.83 12.83 2.3663 20.80 12.84<br />
9 2.3290 20.85 12.89 2.5216 20.90 12.86<br />
10 2.4446 20.80 12.89 2.4813 20.83 12.87<br />
Mean 20.82 12.90 20.82 12.90 20.85 12.88<br />
SD b<br />
a S = <strong>Solids</strong>; F = fat.<br />
b SD = St<strong>and</strong>ard deviation.<br />
0.039 0.034 0.056 0.038 0.006 0.038
6 CART WRIGHT ET AL.: JOURNAL OF AOAC INTERNATIONAL VOL. 88, NO. 1, 2005<br />
Table 5. Results from analyses <strong>of</strong> mozzarella cheese a<br />
SMART Trac results from CEM SMART Trac results from NCSU AOAC results from CEM<br />
Sample ID Wt, g Microwave, M, % NMR, F, % Wt, g Microwave, M, % NMR, F, %<br />
Method<br />
926.08, M, %<br />
Method<br />
933.05, F, %<br />
1 2.2308 46.15 24.25 2.2527 46.28 24.40 46.17 24.32<br />
2 2.0764 46.02 24.23 2.1932 46.10 24.44 46.18 24.47<br />
3 2.1903 46.22 24.25 2.2509 46.19 24.40 46.10 24.30<br />
4 1.9632 46.12 24.32 2.2067 46.01 24.40 46.05 24.13<br />
5 1.9422 45.83 24.30 2.0898 46.11 24.41 46.24 24.36<br />
6 1.7798 45.95 24.37 2.2554 46.29 24.43<br />
7 1.9395 45.81 24.43 2.0403 45.99 24.28<br />
8 2.1878 45.92 24.56 2.4189 46.08 24.32<br />
9 1.8352 46.08 24.53 2.1369 46.07 24.43<br />
10 2.3110 46.24 24.34 2.0268 46.06 24.31<br />
Mean 46.03 24.36 46.12 24.38 46.15 24.32<br />
SD b<br />
a M = <strong>Moisture</strong>; F = fat.<br />
b SD = St<strong>and</strong>ard deviation.<br />
Table 6. Results from analyses <strong>of</strong> Swiss cheese a<br />
0.146 0.110 0.0098 0.054 0.066 0.110<br />
SMART Trac results from CEM SMART Trac results from NCSU AOAC results from CEM<br />
Sample ID Wt, g Microwave, M, % NMR, F, % Wt, g Microwave, M, % NMR, F, %<br />
Method<br />
926.08, M, %<br />
Method<br />
933.05, F, %<br />
1 2.7200 40.08 27.88 2.2181 39.84 28.07 39.95 27.84<br />
2 2.5223 39.97 28.01 2.3263 39.70 27.91 39.78 27.85<br />
3 2.6170 39.98 27.70 2.4166 39.75 27.81 39.82 28.20<br />
4 2.7229 39.90 27.74 2.0604 39.71 27.80 40.00 27.87<br />
5 2.5451 39.91 27.88 2.0643 39.83 27.89 40.27 28.15<br />
6 2.5906 40.00 28.15 2.2466 39.78 28.01<br />
7 2.6066 40.11 27.96 2.3289 40.02 28.07<br />
8 2.7935 39.95 28.01 2.6000 39.88 28.09<br />
9 2.5475 39.90 27.81 2.1072 39.71 28.17<br />
10 2.8223 39.98 28.18 2.3289 39.93 28.07<br />
Mean 39.98 27.93 39.82 27.99 39.96 27.98<br />
SD b<br />
a M = <strong>Moisture</strong>; F = fat.<br />
b SD = St<strong>and</strong>ard deviation.<br />
0.068 0.153 0.101 0.121 0.173 0.159
Table 7. Results from analyses <strong>of</strong> cheddar cheese a<br />
CART WRIGHT ET AL.: JOURNAL OF AOAC INTERNATIONAL VOL. 88, NO. 1, 2005 7<br />
SMART Trac results from CEM SMART Trac results from NCSU AOAC results from CEM<br />
Sample ID Wt, g Microwave, M, % NMR, F, % Wt, g Microwave, M, % NMR, F, %<br />
Method<br />
926.08, M, %<br />
Method<br />
933.05, F, %<br />
1 2.0178 36.59 31.43 2.0936 36.79 31.35 36.79 31.41<br />
2 2.1036 36.99 31.16 2.2693 36.67 31.35 36.68 31.43<br />
3 2.0657 36.59 31.15 2.2849 36.89 31.37 36.83 31.07<br />
4 2.1941 36.80 31.28 2.2639 36.83 31.49 36.77 31.32<br />
5 2.0218 36.66 31.35 2.0009 36.85 31.16 36.75 31.24<br />
6 2.1164 36.62 31.51 2.1508 36.69 31.05<br />
7 2.3500 36.68 31.30 2.0369 36.88 31.37<br />
8 2.4276 36.70 31.32 2.3932 36.81 31.10<br />
9 2.1461 36.63 31.43 2.0830 36.57 31.28<br />
10 1.9509 36.55 31.29 2.3385 36.65 31.41<br />
Mean 36.68 31.32 36.76 31.29 36.76 31.29<br />
SD b<br />
a M = <strong>Moisture</strong>; F = fat.<br />
b SD = St<strong>and</strong>ard deviation.<br />
Table 8. Results from analyses <strong>of</strong> ice cream a<br />
0.123 0.109 0.104 0.136 0.050 0.131<br />
SMART Trac results from CEM SMART Trac results from NCSU AOAC results from CEM<br />
Sample ID Wt, g Microwave, S, % NMR, F, % Wt, g Microwave, S, % NMR, F, %<br />
Method<br />
941.08, S, %<br />
Method<br />
952.06, F, %<br />
1 1.6988 37.87 9.73 1.8188 37.91 9.81 38.02 9.76<br />
2 1.9009 37.91 9.77 1.8875 37.90 9.75 38.07 9.74<br />
3 2.0709 38.00 9.78 1.8883 38.00 9.80 37.85 9.78<br />
4 1.1972 38.07 9.73 2.0424 37.97 9.77 37.93 9.80<br />
5 2.1537 38.08 9.71 1.8710 38.03 9.73 37.86 9.75<br />
6 1.9221 37.98 9.78 2.1444 37.87 9.73<br />
7 2.1258 38.01 9.72 2.0934 37.95 9.76<br />
8 1.7855 37.97 9.76 1.8591 37.97 9.77<br />
9 1.6788 37.93 9.78 1.9112 37.95 9.78<br />
10 2.1355 38.07 9.72 1.9741 37.98 9.83<br />
Mean 37.99 9.75 37.95 9.77 37.95 9.77<br />
SD b<br />
a S = <strong>Solids</strong>; F = fat.<br />
b SD = St<strong>and</strong>ard deviation.<br />
0.072 0.029 0.048 0.033 0.087 0.022
8 CART WRIGHT ET AL.: JOURNAL OF AOAC INTERNATIONAL VOL. 88, NO. 1, 2005<br />
Table 9. Results from analyses <strong>of</strong> sour cream a<br />
SMART Trac results from CEM SMART Trac results from NCSU AOAC results from CEM<br />
Sample ID Wt, g Microwave, S, % NMR, F, % Wt, g Microwave, S, % NMR, F, %<br />
Method<br />
990.20, S, %<br />
Method<br />
905.02, F, %<br />
1 2.2018 25.93 18.40 2.2358 25.94 18.39 26.03 18.26<br />
2 2.6194 26.00 18.49 2.2176 25.91 18.41 26.12 18.37<br />
3 2.1480 26.01 18.48 2.3220 26.06 18.44 26.03 18.58<br />
4 2.3803 26.07 18.47 2.4422 25.91 18.39 26.00 18.51<br />
5 2.3554 26.00 18.51 2.3928 26.05 18.46 25.93 18.37<br />
6 2.2559 26.02 18.52 2.1009 26.15 18.53<br />
7 2.4510 26.02 18.49 2.0944 26.10 18.56<br />
8 2.4436 25.93 18.50 2.5110 26.16 18.48<br />
9 2.4227 25.99 18.46 2.1413 26.04 18.41<br />
10 2.3467 26.01 18.50 2.2793 25.99 18.49<br />
Mean 26.00 18.48 26.03 18.46 26.02 18.42<br />
SD b<br />
a S = <strong>Solids</strong>; F = fat.<br />
b SD = St<strong>and</strong>ard deviation.<br />
Table 10. Results from analyses <strong>of</strong> cream cheese a<br />
0.042 0.034 0.092 0.059 0.061 0.113<br />
SMART Trac results from CEM SMART Trac results from NCSU AOAC results from CEM<br />
Sample ID Wt, g Microwave, S, % NMR, F, % Wt, g Microwave, S, % NMR, F, %<br />
Method<br />
926.08, S, %<br />
Method<br />
933.05, F, %<br />
1 2.1385 41.05 28.23 1.8721 41.22 28.11 41.17 28.26<br />
2 2.1463 41.15 28.20 1.7500 41.15 28.12 41.18 28.10<br />
3 1.8897 40.97 28.16 1.7736 41.11 28.13 41.16 28.04<br />
4 2.0791 41.16 28.17 1.7596 40.97 28.12 41.13 28.28<br />
5 1.7843 41.11 28.26 1.7385 41.22 28.17 41.09 28.19<br />
6 1.6406 40.92 28.20 2.0077 41.06 28.24<br />
7 1.8609 41.10 28.10 1.9284 41.15 28.16<br />
8 2.0020 40.95 28.23 1.6891 41.09 28.26<br />
9 1.7305 41.07 28.24 1.8422 41.19 28.22<br />
10 1.7953 41.20 28.21 1.7073 41.10 28.25<br />
Mean 41.07 28.20 41.13 28.18 41.15 28.17<br />
SD b<br />
a S = <strong>Solids</strong>; F = fat.<br />
b SD = St<strong>and</strong>ard deviation.<br />
0.095 0.047 0.077 0.059 0.033 0.092
Table 11. Results from analyses <strong>of</strong> yogurt a<br />
10 Sample Preparation Procedures<br />
(10.1) <strong>Dairy</strong> prod ucts/milk.—AOAC Of fi cial Method 925.21.<br />
(10.2) <strong>Dairy</strong> prod ucts/cheese.—AOAC Of fi cial Method<br />
955.30.<br />
11 Procedures<br />
11.1 AOAC <strong>Moisture</strong>/<strong>Solids</strong> <strong>Determ<strong>in</strong>ation</strong><br />
<strong>Dairy</strong> sam ples were an a lyzed for mois ture/sol ids ac cord <strong>in</strong>g<br />
to AOAC Method 990.20 for the milks, creams, sour cream,<br />
<strong>and</strong> yo gurt. Cheese sam ples were an a lyzed for mois ture<br />
ac cord <strong>in</strong>g to AOAC Method 926.08, <strong>and</strong> ice cream sam ples<br />
were an a lyzed for sol ids ac cord <strong>in</strong>g to AOAC Method 941.08.<br />
11.2 AOAC Crude <strong>Fat</strong> <strong>Determ<strong>in</strong>ation</strong><br />
<strong>Dairy</strong> sam ples were an a lyzed for crude fat ac cord <strong>in</strong>g to<br />
AOAC Method 989.05 for the milks <strong>and</strong> creams. Sam ples <strong>of</strong><br />
sour cream <strong>and</strong> yo gurt were an a lyzed <strong>by</strong> AOAC Method<br />
905.02. Cheese sam ples were an a lyzed <strong>by</strong> AOAC Method<br />
933.05, <strong>and</strong> ice cream sam ples, <strong>by</strong> AOAC Method 952.06.<br />
11.3 CEM SMART System<br />
(<strong>Moisture</strong>/<strong>Solids</strong>)/SMART Trac (<strong>Fat</strong>)<br />
Note: Con sult man u fac turer’s op er a tion man ual <strong>and</strong><br />
per form the rec om mended tests to de ter m<strong>in</strong>e sys tem<br />
func tion al ity. A fre quency op ti mi za tion should be per formed<br />
daily prior to sys tem op er a tion to cor rect for any drift <strong>in</strong> the<br />
SMART Trac magnetic frequency.<br />
(11.3.1) On the SMART sys tem CEM Ma<strong>in</strong> Menu screen,<br />
se lect Load Method; then se lect the ap pro pri ate<br />
pre pro grammed item to be an a lyzed, e.g., Milk.<br />
CART WRIGHT ET AL.: JOURNAL OF AOAC INTERNATIONAL VOL. 88, NO. 1, 2005 9<br />
SMART Trac results from CEM SMART Trac results from NCSU AOAC results from CEM<br />
Sample ID Wt, g Microwave, S, % NMR, F, % Wt, g Microwave, S, % NMR, F, %<br />
Method 990.20, Method 905.02,<br />
S, % F, %<br />
1 1.8034 12.89 3.23 1.6898 12.92 3.19 13.00 3.21<br />
2 1.9221 12.99 3.25 1.7745 13.05 3.26 13.01 3.28<br />
3 1.7733 12.99 3.29 2.0980 13.04 3.24 12.90 3.19<br />
4 1.9049 13.01 3.27 1.8623 12.95 3.19 12.95 3.28<br />
5 1.7933 12.93 3.25 1.7562 12.99 3.25 12.96 3.28<br />
6 1.8733 12.99 3.26 2.0185 12.99 3.22<br />
7 1.6752 12.98 3.26 2.0428 12.96 3.20<br />
8 1.7605 12.99 3.27 1.8348 13.04 3.26<br />
9 1.9152 13.01 3.24 1.9762 13.01 3.23<br />
10 2.1500 13.07 3.24 1.8810 13.06 3.24<br />
Mean 12.99 3.26 13.00 3.23 12.96 3.25<br />
SD b<br />
a S = <strong>Solids</strong>; F = fat.<br />
b SD = St<strong>and</strong>ard deviation.<br />
0.048 0.018 0.047 0.027 0.039 0.040<br />
Note: Dif fer ent types <strong>of</strong> sam ple ma trixes <strong>and</strong> fat will<br />
ex hibit dif fer ent re sponses with the NMR sys tem. To ob ta<strong>in</strong><br />
ac cu rate fat read <strong>in</strong>gs, ≥2 sam ples <strong>of</strong> the spe cific sam ple type<br />
must be an a lyzed <strong>by</strong> the AOAC method. The sam ples should<br />
cover the en tire fat range to be an a lyzed. Pref er a bly, 1 high-fat<br />
ref er ence sam ple <strong>and</strong> 1 low-fat ref er ence sam ple should be<br />
an a lyzed. The ref er ence val ues are typed <strong>in</strong>to the SMART<br />
Trac sys tem, <strong>and</strong> then rep li cate runs <strong>of</strong> each sam ple are<br />
per formed to de ter m<strong>in</strong>e the ap pro pri ate NMR sig nal val ues<br />
for that spe cific sam ple type. Af ter the ref er ence scans are<br />
com pleted, the SMART Trac sys tem will es tab lish a l<strong>in</strong> ear<br />
re la tion ship for fat determ<strong>in</strong>ation for that type <strong>of</strong> sample.<br />
(11.3.2) Press the Ready key to <strong>in</strong>i ti ate the anal y sis. Place<br />
2 glass fi ber sam ple pads (square) <strong>in</strong> the SMART sys tem<br />
mois ture/sol ids an a lyzer mi cro wave cham ber on the bal ance,<br />
<strong>and</strong> press Tare on the key pad. Tare weight will be<br />
au to mat i cally recorded.<br />
(11.3.3) Trans fer the ap prox i mate amount <strong>of</strong> sam ple onto<br />
the cen ter <strong>of</strong> 1 <strong>of</strong> the tared sam ple pads. (See Fig ure 1 for<br />
ap prox i mate sam ple size <strong>and</strong> spread tech nique.) Spread the<br />
sam ple ac cord <strong>in</strong>g to the il lus tra tions <strong>in</strong> Figure 1.<br />
(11.3.4) Cover the sam ple with the other tared square pad as if<br />
mak <strong>in</strong>g a s<strong>and</strong> wich, <strong>and</strong> re turn the pads to the SMART sys tem<br />
mois ture/sol ids an a lyzer mi cro wave cham ber on the balance.<br />
(11.3.5) Dry the sam ple <strong>by</strong> press <strong>in</strong>g Start on the key pad. A<br />
tem per a ture feed back sys tem al lows rapid mea sure ment <strong>of</strong> the<br />
tem per a ture <strong>of</strong> the sam ple dur <strong>in</strong>g dry <strong>in</strong>g to ad just the<br />
mi cro wave power de liv ery. Per cent Mois ture/Sol ids will be<br />
dis played on the screen (±0.01%) af ter the sam ple has dried to<br />
a con stant weight. Note: Five short beeps will be heard when<br />
dry<strong>in</strong>g is complete.
10 CART WRIGHT ET AL.: JOURNAL OF AOAC INTERNATIONAL VOL. 88, NO. 1, 2005<br />
Table 12. Statistical summary for determ<strong>in</strong>ation <strong>of</strong> solids <strong>in</strong> dairy products<br />
Parameter a<br />
(11.3.6) Re move pads <strong>and</strong> roll both pads <strong>in</strong> Trac film<br />
(Fig ures 2 <strong>and</strong> 3).<br />
(11.3.7) Com press the rolled sam ple <strong>in</strong> the plas tic sleeve <strong>by</strong><br />
us <strong>in</strong>g the com pres sion tool, <strong>and</strong> <strong>in</strong> sert the sam ple <strong>in</strong>to the<br />
NMR cham ber for anal y sis. (The sam ple is placed <strong>in</strong> the core<br />
<strong>of</strong> an 89 kg mag net <strong>and</strong> pulsed with RF en ergy while <strong>in</strong> the<br />
static mag netic field. The re sult <strong>in</strong>g sig nal is re corded <strong>and</strong><br />
an a lyzed for the to tal pro ton ac tiv ity <strong>of</strong> fat pres ent <strong>in</strong> the<br />
sam ple. Mois ture <strong>and</strong> fat re sults are calculated <strong>and</strong> displayed.)<br />
(11.3.8) Press Ready to con t<strong>in</strong>ue the fat anal y sis; then<br />
press Start to an a lyze for fat. Per cent <strong>Fat</strong> will be dis played<br />
on the screen (±0.01%).<br />
12 Test Results Report<br />
DQCI milk sample DQCI reduced milk sample DQCI heavy cream DQCI light cream<br />
The re sults from the study are given <strong>in</strong> Ta bles 1–11. CEM<br />
<strong>and</strong> DQCI used the AOAC sol ids/mois ture <strong>and</strong> fat meth ods to<br />
an a lyze the 11 prod ucts. NCSU <strong>and</strong> CEM, the par tic i pat <strong>in</strong>g<br />
lab o ra to ries, both used the SMART sys tem <strong>and</strong> SMART Trac<br />
AOAC Method 990.20<br />
�, % 11.79 9.87 45.57 20.85<br />
S o 0.007 0.000 0.000 0.006<br />
<strong>Rapid</strong> microwave dry<strong>in</strong>g method<br />
�, % 11.80 9.91 45.55 20.82<br />
S o 0.017 0.024 0.056 0.049<br />
S x 0.022 0.023 0.090 0.046<br />
CV o , % 0.148 0.241 0.124 0.233<br />
CV x , % 0.188 0.229 0.198 0.222<br />
a � = Mean; So <strong>and</strong> S x = with<strong>in</strong>-laboratory repeatability st<strong>and</strong>ard deviation <strong>and</strong> between-laboratories reproducibility st<strong>and</strong>ard deviation,<br />
respectively; CV o <strong>and</strong> CV x = the correspond<strong>in</strong>g coefficients <strong>of</strong> variation.<br />
Table 13. Statistical summary for determ<strong>in</strong>ation <strong>of</strong> fat <strong>in</strong> dairy products<br />
Parameter a<br />
sys tem to de ter m<strong>in</strong>e mois ture/sol ids <strong>and</strong> fat, re spec tively, <strong>in</strong><br />
the 11 products.<br />
Data were an a lyzed, <strong>and</strong> the sta tis ti cal sum ma ries are given<br />
<strong>in</strong> Ta bles 12–19 (2). The sta tis ti cal data for each prod uct<br />
cat e gory <strong>in</strong> clude the mean, the stan dard de vi a tions for<br />
with<strong>in</strong>-lab o ra tory re peat abil ity <strong>and</strong> be tween-lab o ra to ries<br />
reproducibility, <strong>and</strong> the cor re spond <strong>in</strong>g co ef fi cients <strong>of</strong> vari a tion.<br />
The data <strong>in</strong> di cate the SMART sys tem <strong>and</strong> SMART Trac sys tem<br />
com pare fa vor ably with the AOAC meth ods for de ter mi na tion<br />
<strong>of</strong> both mois ture/sol ids <strong>and</strong> fat. Of ut most im por tance are the<br />
sta tis ti cal data for the milks <strong>and</strong> the creams be cause these<br />
prod ucts serve as the raw ma te ri als for dairy prod ucts.<br />
There fore, the fa vor able re sults for the f<strong>in</strong> ished prod ucts,<br />
<strong>in</strong>clud<strong>in</strong>g the cultured products, <strong>in</strong> this study were expected.<br />
13 Conclusions from Ruggedness Test<strong>in</strong>g<br />
(Attachment A)<br />
Ini tial sam ple weight can have an ad verse ef fect on<br />
mois ture/sol ids <strong>and</strong> fat de ter mi na tions. Sam ple weight should<br />
DQCI milk sample DQCI reduced milk sample DQCI heavy cream DQCI light cream<br />
AOAC Method 989.05<br />
�, % 3.02 1.00 39.93 12.88<br />
S o 0.006 0.015 0.042 0.038<br />
NMR fat method<br />
�, % 3.00 0.98 39.93 12.90<br />
S o 0.017 0.011 0.078 0.036<br />
S x 0.017 0.013 0.075 0.034<br />
CV o , % 0.561 1.152 0.196 0.281<br />
CV x , % 0.573 1.351 0.189 0.267<br />
a See footnote a <strong>in</strong> Table 12.
Table 14. Statistical summary for determ<strong>in</strong>ation <strong>of</strong><br />
solids <strong>in</strong> cultured dairy products<br />
Parameter a<br />
be <strong>in</strong> the range ap pro pri ate for the cor re spond <strong>in</strong>g sam ple type,<br />
as shown <strong>in</strong> Figure 1.<br />
The dry <strong>in</strong>g tem per a ture <strong>of</strong> the sam ple can have an ef fect on<br />
the mois ture/sol ids de ter mi na tions with very lit tle ef fect on<br />
the fat de ter mi na tions. Sam ples may not be com pletely dried<br />
if the ap pro pri ate dry <strong>in</strong>g tem per a ture is not used.<br />
Sam ple tem per a ture does have a sig nif i cant ad verse ef fect<br />
on fat de ter mi na tions. Sam ples should be cooled to 40°C<br />
be fore NMR analysis.<br />
14 Quality Assurance<br />
Keep all pre pared sam ples <strong>in</strong> air- <strong>and</strong> wa ter tight con ta<strong>in</strong> ers.<br />
Sam ples should be dried at the tem per a ture <strong>and</strong> weight<br />
ap pro pri ate for the sam ple type <strong>and</strong> con di tioned to 40°C be fore<br />
NMR analysis.<br />
15 Comments<br />
Sour cream Yogurt<br />
AOAC Method 990.20<br />
�, % 26.02 12.96<br />
S o 0.061 0.039<br />
<strong>Rapid</strong> microwave dry<strong>in</strong>g method<br />
�, % 26.01 12.99<br />
S o 0.071 0.048<br />
S x 0.072 0.047<br />
CV o , % 0.275 0.366<br />
CV x , % 0.276 0.358<br />
a See footnote a <strong>in</strong> Table 12.<br />
Over all, the 2 par tic i pat <strong>in</strong>g lab o ra to ries were pleased with<br />
the method be cause it pro vides a safe <strong>and</strong> rapid method <strong>of</strong><br />
CART WRIGHT ET AL.: JOURNAL OF AOAC INTERNATIONAL VOL. 88, NO. 1, 2005 11<br />
Table 15. Statistical summary for determ<strong>in</strong>ation <strong>of</strong> fat<br />
<strong>in</strong> cultured dairy products<br />
Parameter a<br />
an a lyz <strong>in</strong>g dairy prod ucts for mois ture/sol ids <strong>and</strong> fat that<br />
com pares fa vor ably with the AOAC methods.<br />
15.1 Peer Laboratory Comments<br />
Sour cream Yogurt<br />
AOAC Method 905.02<br />
�, % 18.42 3.25<br />
S o 0.113 0.040<br />
NMR fat method<br />
�, % 18.47 3.24<br />
S o 0.048 0.023<br />
S x 0.049 0.029<br />
CV o , % 0.260 0.705<br />
CV x , % 0.266 0.906<br />
a See footnote a <strong>in</strong> Table 12.<br />
Table 16. Statistical summary for determ<strong>in</strong>ation <strong>of</strong> moisture <strong>in</strong> cheese products<br />
Parameter a<br />
The CEM SMART Trac sys tem <strong>of</strong> fers im prove ments <strong>in</strong> the<br />
de ter mi na tions <strong>of</strong> sol ids <strong>and</strong> fats <strong>in</strong> dairy prod ucts through<br />
<strong>in</strong> creased speed <strong>of</strong> test <strong>in</strong>g <strong>and</strong> im proved ac cu racy <strong>of</strong> re sults<br />
<strong>and</strong> safety.<br />
The NCSU dairy pro cess <strong>in</strong>g op er a tion uses the Bab cock<br />
Method (AOAC Method 989.04) for the de ter mi na tion <strong>of</strong> fat<br />
<strong>in</strong> raw milk <strong>and</strong> heavy cream <strong>and</strong> <strong>in</strong> pro cessed milks with<br />
re duced <strong>and</strong> high fat con tent. Ice cream <strong>and</strong> ice milk mixes are<br />
also pro duced <strong>and</strong> tested <strong>by</strong> us <strong>in</strong>g the Bab cock Method. The<br />
SMART Trac sys tem, when com pared with the Bab cock<br />
Method, has <strong>in</strong> creased the ef fi ciency <strong>of</strong> lab o ra tory anal y sis<br />
dur <strong>in</strong>g pro duc tion, dra mat i cally re duc <strong>in</strong>g the time for<br />
gen er a tion <strong>of</strong> <strong>in</strong>-pro cess fat anal y sis from 25 to 4 m<strong>in</strong>.<br />
Op er a tor vari abil ity, which pro duced sig nif i cant er ror with the<br />
Bab cock Method, has been re duced to an <strong>in</strong>significant level<br />
with the SMART Trac system.<br />
Mozzarella Swiss Cheddar Cream cheese<br />
AOAC Method 926.08<br />
�, % 46.15 39.96 39.76 41.15<br />
S o 0.066 0.173 0.050 0.033<br />
<strong>Rapid</strong> microwave dry<strong>in</strong>g method<br />
�, % 46.08 39.90 36.72 41.10<br />
S o 0.131 0.090 0.120 0.087<br />
S x 0.138 0.144 0.128 0.092<br />
CV o , % 0.284 0.227 0.327 0.211<br />
CV x , % 0.299 0.360 0.348 0.223<br />
a See footnote a <strong>in</strong> Table 12.
12 CART WRIGHT ET AL.: JOURNAL OF AOAC INTERNATIONAL VOL. 88, NO. 1, 2005<br />
Table 17. Statistical summary for determ<strong>in</strong>ation <strong>of</strong> fat <strong>in</strong> cheese products<br />
Parameter a<br />
The elim i na tion <strong>of</strong> spent re agents pro duced <strong>by</strong> the Bab cock<br />
Method has sub stan tially re duced haz ard ous waste gen er a tion.<br />
Safety-re lated is sues have been m<strong>in</strong> i mized through the re duc tion<br />
<strong>of</strong> haz ard ous chem i cals, glass ware, <strong>and</strong> centrifuge operation.<br />
For a uni ver sity multiuse lab o ra tory, the ver sa til ity <strong>and</strong><br />
ac cu racy pro vided <strong>by</strong> the SMART Trac sys tem for the<br />
de ter mi na tion <strong>of</strong> sol ids, fat, <strong>and</strong> mois ture <strong>in</strong> milks, mixes, cheeses,<br />
but ter, <strong>and</strong> meat prod ucts have ex p<strong>and</strong>ed the scope <strong>of</strong> avail able<br />
anal y ses while m<strong>in</strong> i miz <strong>in</strong>g vari a tion among multiple users.<br />
At tach ment A: Rug ged ness Test <strong>in</strong>g<br />
Test: Ef fect <strong>of</strong> sam ple weight on the de ter mi na tion <strong>of</strong> sol ids<br />
<strong>and</strong> fat <strong>by</strong> us <strong>in</strong>g mi cro wave dry <strong>in</strong>g <strong>and</strong> NMR, re spec tively.<br />
In milk Ex am ple 1 (Table A.1.), the weight <strong>of</strong> the sam ple<br />
was de creased to be low the rec om mended pa ram e ter <strong>of</strong> 3–4 g.<br />
Re sults showed that sam ple size can have an ef fect on sol ids<br />
<strong>and</strong> fat de ter mi na tions. A dry <strong>in</strong>g tem per a ture <strong>of</strong> 105°C was<br />
<strong>in</strong> ad e quately ma<strong>in</strong> ta<strong>in</strong>ed dur <strong>in</strong>g the dry <strong>in</strong>g cy cle, be cause <strong>of</strong><br />
Mozzarella Swiss Cheddar Cream cheese<br />
AOAC Method 933.05<br />
�, % 24.32 27.98 31.29 28.17<br />
S o 0.110 0.159 0.131 0.092<br />
NMR fat method<br />
�, % 24.37 27.96 31.31 28.19<br />
S o 0.091 0.145 0.130 0.053<br />
S x 0.088 0.144 0.125 0.053<br />
CV o , % 0.374 0.520 0.415 0.189<br />
CV x , % 0.362 0.514 0.399 0.188<br />
a See footnote a <strong>in</strong> Table 12.<br />
Table 18. Statistical summary for determ<strong>in</strong>ation <strong>of</strong><br />
solids <strong>in</strong> ice cream<br />
Parameter a<br />
AOAC Method 941.08<br />
Ice cream<br />
�, % 37.95<br />
S o<br />
<strong>Rapid</strong> microwave dry<strong>in</strong>g method<br />
0.087<br />
�, % 37.97<br />
S o<br />
S x<br />
0.061<br />
0.063<br />
CV o , % 0.161<br />
CV x , % 0.167<br />
a See footnote a <strong>in</strong> Table 12.<br />
the sam ple size. There fore, re sults for sol ids <strong>in</strong> the above<br />
sam ples ranged from 0.09 to 0.14% be low the AOAC av er age<br />
<strong>of</strong> 11.79%. All the wa ter was not elim i nated from the sam ple<br />
dur <strong>in</strong>g the dry <strong>in</strong>g pro cess; there fore, ad di tional hy dro gen<br />
pro tons were pres ent <strong>and</strong> caused an <strong>in</strong> crease <strong>in</strong> the re ported fat<br />
<strong>in</strong> 2 <strong>of</strong> the sam ples. When NMR tech nol ogy is used for fat<br />
de ter mi na tion, all wa ter must be elim i nated from the sam ple<br />
be fore the sam ple is placed <strong>in</strong> the nu clear mag netic field for<br />
fat de ter mi na tion. If the hy dro gen pro tons from wa ter are not<br />
com pletely elim i nated, these pro tons will be cal cu lated as fat.<br />
This re sulted <strong>in</strong> a range <strong>of</strong> 0.10 to 0.14% above the AOAC<br />
average <strong>of</strong> 3.02% fat for 2 <strong>of</strong> the samples.<br />
Test: Ef fect <strong>of</strong> dry <strong>in</strong>g tem per a ture on the de ter mi na tion <strong>of</strong><br />
sol ids <strong>and</strong> fat <strong>by</strong> us <strong>in</strong>g mi cro wave dry <strong>in</strong>g <strong>and</strong> NMR,<br />
re spec tively.<br />
In milk Ex am ple 2 (Table A.2.), the dry <strong>in</strong>g tem per a ture was<br />
de creased from the rec om mended 105° to 80°C. Re sults showed<br />
that dry <strong>in</strong>g tem per a ture has an ef fect on sol ids de ter mi na tion<br />
(0.09% higher) <strong>and</strong> very lit tle ef fect on fat determ<strong>in</strong>ations.<br />
Table 19. Statistical summary for determ<strong>in</strong>ation <strong>of</strong> fat<br />
<strong>in</strong> ice cream<br />
Parameter a<br />
AOAC Method 952.06<br />
Ice cream<br />
�, % 9.77<br />
S o<br />
NMR fat method<br />
0.022<br />
�, % 9.76<br />
S o<br />
S x<br />
0.031<br />
0.034<br />
CV x , % 0.316<br />
CV x , % 0.351<br />
a See footnote a <strong>in</strong> Table 12.
Table A.1. Test results for Example 1 milk sample 9 a<br />
Test: Ef fect <strong>of</strong> dry <strong>in</strong>g tem per a ture on the de ter mi na tion <strong>of</strong><br />
mois ture <strong>and</strong> fat <strong>by</strong> us <strong>in</strong>g mi cro wave dry <strong>in</strong>g <strong>and</strong> NMR,<br />
re spec tively.<br />
In milk Ex am ple 3 (Table A.3.), the dry <strong>in</strong>g tem per a ture<br />
was <strong>in</strong> creased from the rec om mended 105°C to 120°C.<br />
Re sults showed that a higher dry <strong>in</strong>g tem per a ture has very lit tle<br />
ef fect on sol ids or fat de ter mi na tions. How ever, sam ples with<br />
higher fat con tent may tend to brown or burn if run at<br />
tem per a tures higher than those recommended.<br />
Test: Ef fect <strong>of</strong> sam ple weight on the de ter mi na tion <strong>of</strong> sol ids<br />
<strong>and</strong> fat <strong>by</strong> us <strong>in</strong>g mi cro wave dry <strong>in</strong>g <strong>and</strong> NMR, re spec tively.<br />
In heavy cream Ex am ple 4 (Table A.4.), the weight <strong>of</strong> the<br />
sam ple was de creased to be low the rec om mended 2–2.5 g.<br />
Re sults showed that sam ple size can have an ef fect on sol ids<br />
<strong>and</strong> fat de ter mi na tions. A dry <strong>in</strong>g tem per a ture <strong>of</strong> 100°C was<br />
<strong>in</strong> ad e quately ma<strong>in</strong> ta<strong>in</strong>ed dur <strong>in</strong>g the dry <strong>in</strong>g cy cle, be cause <strong>of</strong><br />
CART WRIGHT ET AL.: JOURNAL OF AOAC INTERNATIONAL VOL. 88, NO. 1, 2005 13<br />
Sample ID Wt, g Microwave, S, % NMR, F, % Microwave, °C AOAC, S, % AOAC, F, %<br />
1 2.0049 11.65 3.00 105 11.79 3.02<br />
2 1.2185 11.68 3.12 105<br />
3 1.3778 11.70 3.14 105<br />
a S = <strong>Solids</strong>; F = fat.<br />
Table A.2. Test results for Example 2 milk sample 5 a<br />
Sample ID Wt, g Microwave, S, % NMR, F, % Microwave, °C AOAC, S, % AOAC, F, %<br />
1 3.7666 10.05 1.00 80 9.91 0.97<br />
2 4.0067 9.97 1.02 80<br />
3 3.7409 9.99 1.00 80<br />
a S = <strong>Solids</strong>; F = fat.<br />
Table A.3. Test results for Example 3 milk sample 5 a<br />
Sample ID Wt, g Microwave, S, % NMR, F, % Microwave, °C AOAC, M, % AOAC, F, %<br />
1 3.8394 9.87 0.97 120 9.91 0.97<br />
2 3.7428 9.88 0.98 120<br />
3 3.8394 9.88 0.99 120<br />
a M = <strong>Moisture</strong>; F = fat.<br />
Table A.4. Test results for Example 4 heavy cream a<br />
the sam ple size. There fore, re sults for sol ids <strong>in</strong> the sam ples<br />
av er aged 0.08% higher than the AOAC av er age re sult <strong>of</strong><br />
45.57%. All the wa ter was not elim i nated from the sam ple<br />
dur <strong>in</strong>g the dry <strong>in</strong>g pro cess; there fore, ad di tional hy dro gen<br />
pro tons were pres ent <strong>and</strong> caused an <strong>in</strong> crease <strong>in</strong> the re ported fat<br />
<strong>in</strong> 2 <strong>of</strong> the sam ples. When NMR tech nol ogy is used for fat<br />
de ter mi na tion, all wa ter must be elim i nated from the sam ple<br />
be fore the sam ple is placed <strong>in</strong> the nu clear mag netic field for<br />
fat de ter mi na tion. If hy dro gen pro tons from wa ter are not<br />
com pletely elim i nated, these pro tons will be cal cu lated as fat.<br />
This resulted <strong>in</strong> an average fat <strong>in</strong>crease <strong>of</strong> 0.29% above the<br />
AOAC average <strong>of</strong> 39.93%.<br />
Test: Ef fect <strong>of</strong> sam ple weight on the de ter mi na tion <strong>of</strong><br />
sol ids <strong>and</strong> fat <strong>by</strong> us <strong>in</strong>g mi cro wave dry <strong>in</strong>g <strong>and</strong> NMR,<br />
re spec tively.<br />
Sample ID Wt, g Microwave, S, % NMR, F, % Microwave, °C AOAC, S, % AOAC, F, %<br />
1 1.4612 45.65 40.10 100 45.57 39.93<br />
2 1.4386 45.58 40.26 100<br />
3 1.0988 45.71 40.31 100<br />
a S = <strong>Solids</strong>; F = fat.
14 CART WRIGHT ET AL.: JOURNAL OF AOAC INTERNATIONAL VOL. 88, NO. 1, 2005<br />
Table A.5. Test results for Example 5 heavy cream a<br />
Sample ID Wt, g Microwave, S, % NMR, F, % Microwave, °C AOAC, S, % AOAC, F, %<br />
1 3.7924 45.57 39.90 100 45.57 39.93<br />
2 4.0953 45.61 39.63 100<br />
3 4.1566 45.43 39.57 100<br />
a S = <strong>Solids</strong>; F = fat.<br />
Table A.6. Test results for Example 6 heavy cream a<br />
Sample ID Wt, g Microwave, S, % NMR, F, % Microwave, °C AOAC, S, % AOAC, F, %<br />
1 2.5615 45.61 39.65 100 45.57 39.93<br />
2 2.7932 45.59 39.25 100<br />
3 2.2800 45.59 39.14 100<br />
a S = <strong>Solids</strong>; F = fat.<br />
In heavy cream Ex am ple 5 (Table A.5.), the weight <strong>of</strong> the<br />
sam ple was <strong>in</strong> creased to above the rec om mended 2–2.5 g.<br />
Re sults showed that sam ple size can have an ef fect on sol ids<br />
<strong>and</strong> fat de ter mi na tions. Be cause there was some brown <strong>in</strong>g <strong>of</strong><br />
the sam ples, this brown <strong>in</strong>g ef fect caused more vari abil ity <strong>in</strong><br />
the over all re sults, <strong>and</strong> the fat con tent was some what lower <strong>in</strong><br />
samples 2 <strong>and</strong> 3.<br />
Test: Ef fect <strong>of</strong> sam ple tem per a ture on the de ter mi na tion <strong>of</strong><br />
fat <strong>by</strong> us <strong>in</strong>g NMR.<br />
In heavy cream Example 6 (Table A.6.), the temperature at<br />
which the sample is <strong>in</strong>troduced to the NMR <strong>in</strong>strumentation<br />
was tested. The magnet is ma<strong>in</strong>ta<strong>in</strong>ed at a constant temperature<br />
<strong>of</strong> 40°C; therefore, all samples measured should be conditioned<br />
to 40°C. These samples were taken directly from the<br />
microwave at a temperature <strong>of</strong> 100°C <strong>and</strong> put immediately <strong>in</strong>to<br />
the NMR <strong>in</strong>strument. Results showed that sample temperature<br />
does have an adverse effect on fat determ<strong>in</strong>ation. The AOAC<br />
average for this sample was 39.93% fat.