NHBC NEW HOMES STATISTICS REVIEW 2012 - NHBC Home
NHBC NEW HOMES STATISTICS REVIEW 2012 - NHBC Home
NHBC NEW HOMES STATISTICS REVIEW 2012 - NHBC Home

You also want an ePaper? Increase the reach of your titles
YUMPU automatically turns print PDFs into web optimized ePapers that Google loves.
<strong>NHBC</strong> <strong>NEW</strong> <strong>HOMES</strong><br />
<strong>STATISTICS</strong> <strong>REVIEW</strong> <strong>2012</strong><br />
With Richard Tamayo – Commercial Director at <strong>NHBC</strong><br />
According to <strong>NHBC</strong>’s registration figures for <strong>2012</strong> there were 104,514 new homes registered in the UK<br />
over the past year, representing a 9% decrease compared to 2011 (114,930).<br />
Contents<br />
The big numbers<br />
for <strong>2012</strong><br />
1<br />
Regional<br />
overview<br />
2<br />
In summary, <strong>2012</strong> was a challenging year for the housebuilding industry but as the year progressed, and with<br />
Government-backed schemes such as NewBuy and Funding for Lending helping to increase mortgage<br />
availability, there were some encouraging signs.<br />
We were heartened by the Government’s commitment to back the industry and provide new funding,<br />
particularly to unlock almost 50,000 homes on stalled sites and look forward to seeing how this progresses.<br />
We obviously hope that the upward trend seen towards the end of <strong>2012</strong>, which included a 17% increase in<br />
registrations for Q4 <strong>2012</strong> (24,560) compared to Q4 2011 (21,060) and the positive trend seen in the opening<br />
weeks of January 2013 will continue throughout the year.<br />
YEAR ON YEAR OVERALL New HOUSEBUILDING FIGURES – 2011 vs <strong>2012</strong><br />
Public vs. private<br />
3<br />
Appendix<br />
4<br />
Registrations<br />
9%<br />
All Sectors:-<br />
Completions<br />
1%<br />
(2011-<strong>2012</strong>) (2011-<strong>2012</strong>)<br />
UK Registrations<br />
2011 114,930<br />
<strong>2012</strong> 104,510<br />
UK Completions<br />
2011 113,880<br />
<strong>2012</strong> 114,550<br />
Number of <strong>NEW</strong> homes<br />
Source: <strong>NHBC</strong> (Appendix table 1)<br />
Note: Figures for 2011 are derived from actual ‘New-Build’ registrations for <strong>NHBC</strong>’s ten-year warranty and<br />
the number of completions notified by <strong>NHBC</strong> inspectors. Figures are rounded to the nearest 10.<br />
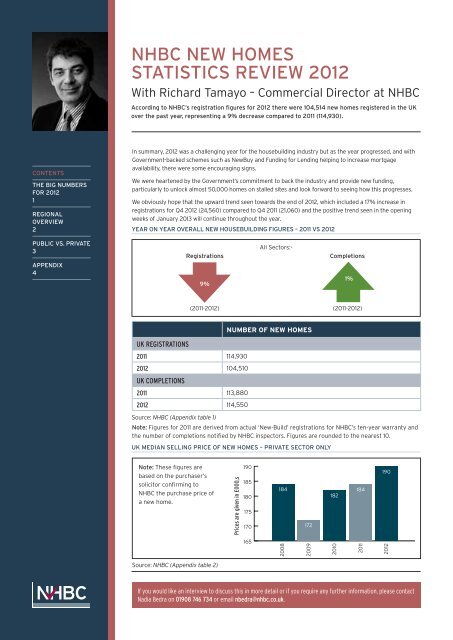
UK Median Selling Price of New homes – private sector only<br />
Note: These figures are<br />
based on the purchaser’s<br />
solicitor confirming to<br />
<strong>NHBC</strong> the purchase price of<br />
a new home.<br />
Prices are given in £000,s<br />
190<br />
185<br />
180<br />
175<br />
170<br />
184<br />
172<br />
182<br />
184<br />
194 190<br />
165<br />
2008<br />
2009<br />
2010<br />
2011<br />
<strong>2012</strong><br />
Source: <strong>NHBC</strong> (Appendix table 2)<br />
If you would like an interview to discuss this in more detail or if you require any further information, please contact<br />
Nadia Bedra on 01908 746 734 or email nbedra@nhbc.co.uk.
page 2 of 10<br />
<strong>NHBC</strong> <strong>NEW</strong> <strong>HOMES</strong><br />
<strong>STATISTICS</strong> <strong>REVIEW</strong> <strong>2012</strong><br />
Regional Overview<br />
Annual registrations for all sectors (% change 2011 on <strong>2012</strong>)<br />
David Little, <strong>NHBC</strong> Director<br />
Northern Ireland<br />
As expected we have seen a moderate decline<br />
over the last 12 months, but not as marked as the<br />
comparative statistic from a year ago (-35% in 2011<br />
compared to 2010). We have also seen signs of<br />
house prices stabilising at an affordable level which<br />
in turn should lead to an increase in sales volumes.<br />
The recent strong figures for purchases through<br />
the NI CoOwnership scheme may well indicate that<br />
potential buyers are now confident that this is the<br />
right time to buy. While we expect<br />
the recovery in new housebuilding<br />
volumes to be led by Belfast and<br />
the East of Northern Ireland, we<br />
-14%<br />
believe that overall the local<br />
housebuilding industry will see<br />
an increase in volumes in 2013.<br />
Peter Watton, <strong>NHBC</strong> Director<br />
Wales<br />
We have seen encouraging figures over the course<br />
of <strong>2012</strong> in terms of new build registrations across<br />
the country, with a 16% increase compared against<br />
2011. It was also pleasing to see increases in both<br />
the private and public sectors as a number of large,<br />
stalled sites finally reached completion and have<br />
been replaced by exciting new sites. We hope that<br />
this progress will continue into the new year and,<br />
as an industry, we must try and ensure that key<br />
issues such as mortgage availability, remain<br />
closely monitored.<br />
-7%<br />
+16%<br />
+6%<br />
+3%<br />
+24%<br />
-2%<br />
+0.4%<br />
Malcolm MacLeod, <strong>NHBC</strong> Director<br />
Scotland<br />
<strong>2012</strong> has seen registration levels in Scotland stabilise with<br />
overall levels revealing a slight decline compared with 2011.<br />
Figures for the private sector show that year-end results are<br />
virtually like-for-like versus last year, although public sector,<br />
as elsewhere across the UK, is significantly down on 2011.<br />
In the last quarter of <strong>2012</strong> both the Mi New <strong>Home</strong> and the<br />
Funding for Lending initiatives were launched and will greatly<br />
assist first time buyers to get onto the housing ladder. During<br />
2013 the industry must work together even more to promote<br />
the benefits of new homes to ensure the aspirations of<br />
prospective homebuyers are met.<br />
+2%<br />
-7%<br />
-33%<br />
-16%<br />
Steve Catt, <strong>NHBC</strong> director<br />
England<br />
In keeping with overall UK housing figures,<br />
England has seen a levelling out in the housing<br />
market in <strong>2012</strong> with a 10% decrease in housing<br />
numbers. There were encouraging signs as the<br />
year progressed, with Government backed<br />
schemes such as NewBuy, helping to<br />
increase mortgage availability for<br />
prospective homeowners.<br />
However, it is clear that there remains a<br />
continued undersupply of new homes,<br />
especially in the affordable sector which<br />
contributed to a large proportion of the<br />
fall in numbers for the year. This<br />
undersupply needs to be addressed as we<br />
begin to speculate about what 2013 may bring for<br />
the industry.<br />
Source: <strong>NHBC</strong> (Appendix table 3)<br />
Note: The comparison is based on ‘New-Build’ registrations for <strong>NHBC</strong>’s ten-year warranty.<br />
Percentage of UK house types in total registrations – all sectors<br />
Percentage<br />
45<br />
40<br />
35<br />
30<br />
25<br />
20<br />
15<br />
10<br />
5<br />
0<br />
20<br />
Detached houses<br />
23<br />
1 1<br />
Detached bungalows<br />
18<br />
Semi-detached houses<br />
21 21<br />
Terraced houses<br />
23<br />
1 1<br />
Attached bungalows<br />
39<br />
Flats and maisonettes<br />
32<br />
Year 2011<br />
Year <strong>2012</strong><br />
Source: <strong>NHBC</strong> (Appendix table 5)<br />
If you would like an interview to discuss this in more detail or if you require any further information, please contact Nadia Bedra on 01908 746 734 or email<br />
nbedra@nhbc.co.uk.
page 3 of 10<br />
<strong>NHBC</strong> <strong>NEW</strong> <strong>HOMES</strong><br />
<strong>STATISTICS</strong> <strong>REVIEW</strong> <strong>2012</strong><br />
PRIVATE vs. AFFORDABLE<br />
Private Sector<br />
Number of new homes<br />
Year on year percentage change<br />
Registrations<br />
2011 78,250<br />
<strong>2012</strong> 78,120 -0.2%<br />
Completions<br />
2011 76,890<br />
<strong>2012</strong> 80,270 4%<br />
Affordable Sector<br />
Number of <strong>NEW</strong> homes<br />
Year on year percentage change<br />
Registrations<br />
2011 36,680<br />
<strong>2012</strong> 26,390 -28%<br />
Completions<br />
2011 36,990<br />
<strong>2012</strong> 34,280 -7%<br />
Note: Figures are rounded to the nearest 10.<br />
Mehban Chowdery, Head of social housing at <strong>NHBC</strong><br />
Over the course of the last year the final <strong>2012</strong> figures<br />
for the social housing sector were significantly down on<br />
2011. This decrease can be partly attributed to the delays<br />
experienced in starting the National Affordable Housing<br />
Programme (NAHP) <strong>2012</strong> – 2015 which had a significant<br />
knock-on effect on the subsequent figures for the UK’s<br />
public sector housing numbers.<br />
However, now this has been resolved, with a new timetable<br />
of the NAHP for this year and the rest of the programme,<br />
we can hopefully look forward to an increase in levels. This,<br />
combined with the measures announced by the Government<br />
last year should boost housing numbers in the public sector.<br />
Number of homes<br />
120000<br />
100000<br />
80000<br />
60000<br />
40000<br />
20000<br />
0<br />
Chart 2: <strong>NHBC</strong> registrations and completions<br />
2008<br />
2009<br />
Registrations – private sector<br />
Registrations – public sector<br />
Completions – private sector<br />
Completions – public sector<br />
2010<br />
2011<br />
<strong>2012</strong><br />
Source: <strong>NHBC</strong> (Appendix table 4)<br />
If you would like an interview to discuss this in more detail or if you require any further information, please contact Nadia Bedra on 01908 746 734 or email<br />
nbedra@nhbc.co.uk.
page 4 of 10<br />
<strong>NHBC</strong> <strong>NEW</strong> <strong>HOMES</strong><br />
<strong>STATISTICS</strong> <strong>REVIEW</strong> <strong>2012</strong><br />
Appendix<br />
Table 1: UK Registrations and completions all sectors<br />
Registrations<br />
2008 106,890<br />
2009 88,080<br />
2010 115,460<br />
2011 114,930<br />
<strong>2012</strong> 104,510<br />
Oct <strong>2012</strong> 9,680<br />
Nov <strong>2012</strong> 9,530<br />
Dec <strong>2012</strong> 5,350<br />
Completions<br />
2008 148,890<br />
2009 116,330<br />
2010 103,800<br />
2011 113,880<br />
<strong>2012</strong> 114,550<br />
Oct <strong>2012</strong> 8,820<br />
Nov <strong>2012</strong> 11,280<br />
Dec <strong>2012</strong> 9,000<br />
Number of new homes<br />
Notes<br />
1. <strong>NHBC</strong> statistics are derived almost exclusively from its registered builders, who construct around 80% of the new homes built in the UK.<br />
As such, they represent a unique source of detailed, up-to-date information on new home construction and the house-building industry.<br />
2. A <strong>NHBC</strong> registered builder is required to register a house with <strong>NHBC</strong> at least 21 days before building starts.<br />
3. A house registered with <strong>NHBC</strong> is deemed completed when the <strong>NHBC</strong> Building Inspector, who carried out key stage inspections during<br />
construction, considers that the house has been satisfactorily completed in respect of <strong>NHBC</strong>’s technical requirements.<br />
4. These figures are rounded numbers.<br />
5. The number of ‘Registrations’ relate to homes registered, less a small percentage reduction to allow for likely cancellations. During an<br />
economic downturn the number of actual cancellations is likely to be higher.<br />
6. The above figures relate to ‘New-Build’ registrations for <strong>NHBC</strong>’s ten-year warranty in the UK, including the Isle of Man.<br />
7. ‘Completions’ relate to the number of homes ‘finalled’ by <strong>NHBC</strong>’s Building Inspectors and are reported in the month they are received<br />
and processed.<br />
If you would like an interview to discuss this in more detail or if you require any further information, please contact Nadia Bedra on 01908 746 734 or email<br />
nbedra@nhbc.co.uk.
page 5 of 10<br />
<strong>NHBC</strong> <strong>NEW</strong> <strong>HOMES</strong><br />
<strong>STATISTICS</strong> <strong>REVIEW</strong> <strong>2012</strong><br />
Appendix<br />
Table 2: Median Selling Price of New Houses – PRIVATE SECTOR ONLY<br />
Prices are given<br />
in £000’s<br />
2008 2009 2010 2011 <strong>2012</strong><br />
North East 157 144 150 143 146<br />
North West 148 138 150 153 155<br />
Yorkshire & The Humber 150 146 159 150 153<br />
West Midlands 156 153 158 159 166<br />
East Midlands 155 148 157 157 165<br />
Eastern 195 180 205 205 215<br />
South West 190 175 190 186 190<br />
Greater London 270 257 252 287 273<br />
South East 225 210 230 235 240<br />
England 185 175 185 186 195<br />
Scotland 189 174 185 188 191<br />
Wales 160 145 157 160 165<br />
Northern Ireland 169 148 145 130 127<br />
United Kingdom 184 172 182 184 190<br />
Notes<br />
1. <strong>NHBC</strong> asks the purchaser’s solicitor to return a document confirming the purchase price of a house.<br />
2. For each update, the previous figures are re-calculated and this can result in some minor changes occuring.<br />
3. Houses includes flats, maisonettes and bungalows.<br />
If you would like an interview to discuss this in more detail or if you require any further information, please contact Nadia Bedra on 01908 746 734 or email<br />
nbedra@nhbc.co.uk.
page 6 of 10<br />
<strong>NHBC</strong> <strong>NEW</strong> <strong>HOMES</strong><br />
<strong>STATISTICS</strong> <strong>REVIEW</strong> <strong>2012</strong><br />
Appendix (continued)<br />
Table 3: REGIONAL REGISTRATION FIGURES – All sectors<br />
2008 2009 2010 2011 <strong>2012</strong><br />
North East 2,845 2,758 4,548 3,227 3,996<br />
North West 8,252 6,471 8,318 8,103 8,620<br />
Yorkshire & the Humber 6,601 4,727 7,339 5,891 5,914<br />
West Midlands 7,627 5,782 8,780 7,890 7,701<br />
East Midlands 8,071 7,042 8,984 7,657 7,784<br />
Eastern 12,755 11,686 13,337 13,343 11,270<br />
South West 10,647 10,744 13,073 11,376 11,730<br />
Greater London 16,015 10,304 16,169 24,592 16,364<br />
South East 17,555 15,356 19,306 18,303 16,966<br />
England 90,368 74,870 99,854 100,382 90,345<br />
Scotland 9,752 6,814 8,209 8,986 8,327<br />
Wales 3,640 2,872 4,193 3,495 4,065<br />
Northern Ireland (incl. Isle of Man) 3,134 3,527 3,202 2,067 1,777<br />
United Kingdom (incl. Isle of Man) 106,894 88,083 115,458 114,930 104,514<br />
Northern Ireland Registration Figures by County – all sectors<br />
2008 2009 2010 2011 <strong>2012</strong><br />
Antrim 710 1,010 952 715 578<br />
Armagh 343 296 243 109 109<br />
Down 1,060 1,380 988 796 603<br />
Fermanagh 167 196 122 80 43<br />
Londonderry 344 276 509 199 245<br />
Tyrone 209 193 262 31 131<br />
If you would like an interview to discuss this in more detail or if you require any further information, please contact Nadia Bedra on 01908 746 734 or email<br />
nbedra@nhbc.co.uk.
page 7 of 10<br />
<strong>NHBC</strong> <strong>NEW</strong> <strong>HOMES</strong><br />
<strong>STATISTICS</strong> <strong>REVIEW</strong> <strong>2012</strong><br />
Appendix (continued)<br />
Scotland Registration Figures by Council – all sectors<br />
2008 2009 2010 2011 <strong>2012</strong><br />
Aberdeenshire 1099 921 654 837 651<br />
Angus 130 181 172 167 140<br />
Argyll & Bute 109 185 110 107 41<br />
City of Aberdeen 247 233 195 587 574<br />
City of Edinburgh 617 594 837 1,105 699<br />
City of Glasgow 844 426 1,063 382 1,311<br />
Clackmannan 6 58 35 97 63<br />
Dumfries & Galloway 106 136 254 67 64<br />
Dundee City 330 188 153 88 52<br />
East Ayrshire 124 56 134 143 144<br />
East Dumbartonshire 66 54 131 380 170<br />
East Lothian 152 208 231 148 183<br />
East Renfrewshire 151 42 203 192 210<br />
Falkirk 404 189 162 307 285<br />
Fife 925 416 570 752 531<br />
Highland 528 361 407 367 303<br />
Inverclyde 186 49 82 97 47<br />
Midlothian 290 124 232 313 357<br />
Moray 98 72 185 64 144<br />
North Ayrshire 103 68 137 113 112<br />
North Lanarkshire 734 459 495 673 495<br />
Orkney Islands 33 38 19 12 10<br />
Perthshire & Kinross 216 194 234 152 252<br />
Renfrewshire 313 166 197 97 194<br />
Scottish Borders 250 85 131 83 163<br />
Shetland Islands 25 15 5 4 2<br />
South Ayrshire 118 69 92 63 120<br />
South Lanarkshire 838 459 778 602 439<br />
Stirling 271 105 171 142 212<br />
West Dumbartonshire 120 95 18 62 158<br />
Western Isles 21 20 64 9 2<br />
West Lothian 298 548 58 774 199<br />
If you would like an interview to discuss this in more detail or if you require any further information, please contact Nadia Bedra on 01908 746 734 or email<br />
nbedra@nhbc.co.uk.
page 8 of 10<br />
<strong>NHBC</strong> <strong>NEW</strong> <strong>HOMES</strong><br />
<strong>STATISTICS</strong> <strong>REVIEW</strong> <strong>2012</strong><br />
Appendix (continued)<br />
Welsh Registration Figures by Unitary Authority – all sectors<br />
2008 2009 2010 2011 <strong>2012</strong><br />
Blaenau Gwent 36 85 131 58 57<br />
Bridgend 228 210 422 300 382<br />
Caerphilly 103 268 198 220 266<br />
Cardiff 598 359 467 208 290<br />
Carmarthenshire 125 200 260 263 213<br />
Ceredigion 22 14 40 34 40<br />
Conwy 182 140 103 75 185<br />
Denbighshire 172 53 119 128 48<br />
Flintshire 168 118 174 265 286<br />
Gwynedd 36 68 50 39 60<br />
Isle of Anglesey 116 74 74 83 64<br />
Merthyr Tydfil 7 107 240 21 49<br />
Monmouthshire 186 33 242 152 318<br />
Neath Port Talbot 214 100 206 210 120<br />
Newport 508 267 253 292 220<br />
Pembrokeshire 72 73 100 121 63<br />
Powys 160 78 82 176 91<br />
Rhondda Cynon Taff 205 116 198 272 370<br />
Swansea 287 154 361 285 289<br />
Torfaen 95 108 150 73 235<br />
Vale of Glamorgan 15 122 91 63 123<br />
Wrexham 105 125 232 157 296<br />
If you would like an interview to discuss this in more detail or if you require any further information, please contact Nadia Bedra on 01908 746 734 or email<br />
nbedra@nhbc.co.uk.
page 9 of 10<br />
<strong>NHBC</strong> <strong>NEW</strong> <strong>HOMES</strong><br />
<strong>STATISTICS</strong> <strong>REVIEW</strong> <strong>2012</strong><br />
Appendix (continued)<br />
Table 4: UK Private and Affordable Sector Registrations and Completions<br />
Private sector number<br />
Affordable sector number<br />
Registrations<br />
2008 72,110 34,780<br />
2009 55,910 32,170<br />
2010 77,530 37,920<br />
2011 78,250 36,680<br />
<strong>2012</strong> 78,120 26,390<br />
Completions<br />
2008 111,950 36,940<br />
2009 81,060 35,270<br />
2010 72,480 31,320<br />
2011 76,890 36,990<br />
<strong>2012</strong> 80,270 34,280<br />
Notes<br />
1. The above figures relate to ‘New-Build’ registrations for <strong>NHBC</strong>’s ten-year warranty in the UK. Northern Ireland values include the Isle of Man.<br />
2. <strong>NHBC</strong> registration figures are obtained as follows: A builder is required to register a house with <strong>NHBC</strong> at least 21 days before building starts.<br />
3. <strong>NHBC</strong> registration figures reflect an intention to build, they may give an earlier indication of market trends.<br />
4. ‘Completions’ relate to the number of homes ‘finalled’ by <strong>NHBC</strong>’s Building Inspectors and are reported in the month they are received and processed.<br />
5. These figures are rounded.<br />
If you would like an interview to discuss this in more detail or if you require any further information, please contact Nadia Bedra on 01908 746 734 or email<br />
nbedra@nhbc.co.uk.
page 10 of 10<br />
<strong>NHBC</strong> <strong>NEW</strong> <strong>HOMES</strong><br />
<strong>STATISTICS</strong> <strong>REVIEW</strong> <strong>2012</strong><br />
Appendix (continued)<br />
Table 5: PERCENTAGE OF HOUSE TYPES IN TOTAL registrations<br />
Private and AFFORDABLE Sector – Percentage of house type in total registrations<br />
Country Year Detached<br />
Houses<br />
Detached<br />
Bungalows<br />
Semi-detached<br />
HOUSES<br />
Terraced<br />
Houses<br />
Attached<br />
bungalows<br />
England 2008 12% 1% 14% 21% 1% 51%<br />
2009 15% 1% 17% 25% 1% 40%<br />
2010 15% 1% 19% 25% 1% 39%<br />
2011 17% 1% 18% 22% 1% 41%<br />
<strong>2012</strong> 21% 1% 21% 23% 1% 34%<br />
Wales 2008 21% 2% 20% 20% 1% 37%<br />
2009 23% 2% 22% 24% 2% 27%<br />
2010 28% 2% 28% 21% 0% 21%<br />
2011 38% 1% 24% 20% 1% 16%<br />
<strong>2012</strong> 35% 1% 23% 20% 0% 20%<br />
Scotland 2008 34% 2% 14% 14% 2% 34%<br />
2009 31% 3% 20% 11% 2% 33%<br />
2010 33% 3% 14% 14% 2% 34%<br />
2011 38% 2% 16% 12% 1% 30%<br />
<strong>2012</strong> 37% 2% 15% 23% 1% 22%<br />
Flats and<br />
maisonettes<br />
Northern<br />
Ireland<br />
2008 24% 6% 21% 15% 0% 33%<br />
2009 24% 5% 25% 20% 1% 25%<br />
2010 23% 4% 27% 25% 1% 20%<br />
2011 29% 5% 33% 14% 0% 19%<br />
<strong>2012</strong> 31% 4% 36% 18% 0% 11%<br />
United<br />
Kingdom<br />
2008 14% 1% 14% 20% 1% 49%<br />
2009 17% 1% 18% 24% 1% 39%<br />
2010 17% 1% 19% 24% 1% 37%<br />
2011 20% 1% 18% 21% 1% 39%<br />
<strong>2012</strong> 23% 1% 21% 23% 1% 32%<br />
Notes<br />
1. The above table shows the percentages of different types of homes registered by country for the past five years by house types.<br />
2. For each update, the previous figures are recalculated and this can result in some minor changes occurring.<br />
If you would like an interview to discuss this in more detail or if you require any further information, please contact Nadia Bedra on 01908 746 734 or email<br />
nbedra@nhbc.co.uk.<br />
<strong>NHBC</strong><br />
<strong>NHBC</strong> House, Davy Avenue, Knowlhill, Milton Keynes, Bucks MK5 8FP<br />
Tel: 0844 633 1000 Fax: 0844 633 0022 www.nhbc.co.uk<br />
G25 01/13