Air Quality at Roseville Railyard Poses Cancer Risk : Recent Study ...
Air Quality at Roseville Railyard Poses Cancer Risk : Recent Study ...
Air Quality at Roseville Railyard Poses Cancer Risk : Recent Study ...

Create successful ePaper yourself
Turn your PDF publications into a flip-book with our unique Google optimized e-Paper software.
Final Report to the Health Effects Task Force (HETF),<br />
Bre<strong>at</strong>he California of Sacramento-Emigrant Trails<br />
Mass, Organic, and Elemental Aerosols by size, time, and<br />
composition <strong>at</strong> the Union Pacific Rail Road’s<br />
<strong>Roseville</strong> <strong>Railyard</strong><br />
November 27, 2007<br />
Prof. Thomas A. Cahill, P.I 1,2 , and Prof. Thomas M. Cahill 3,4 , co-P.I.s, Dr. David E. Barnes 1 and<br />
Nicholas J. Spada 1 , Project Managers, Dr. Steven S. Cliff 1 , and Prof. Kevin D. Perry 1,5 , Staff<br />
Scientists, and Erin Fujii 1 , Student Research Assistant<br />
1 DELTA * Group, Depts. of Physics, Chemical Engineering/M<strong>at</strong>erials Science, and Applied<br />
Science, University of California, Davis, CA<br />
2 Bre<strong>at</strong>he California of Sacramento/Emigrant Trails (BC/SET), Sacramento, CA,<br />
3 Department of Integr<strong>at</strong>ed Physical Sciences, Arizona St<strong>at</strong>e University, Glendale, AZ,<br />
4 Department of Eco-toxicology, University of California, Davis, CA,<br />
5 Department of Meteorology, University of Utah, Salt Lake City, UT<br />
• DELTA – Detection and Evalu<strong>at</strong>ion in Long-range Transport of Aerosols<br />
1
Executive Summary<br />
This report has seven components, all bearing on aerosol emissions from Union Pacific<br />
<strong>Roseville</strong> <strong>Railyard</strong> (UPRR). Component A represents d<strong>at</strong>a from the <strong>Roseville</strong><br />
<strong>Railyard</strong> Aerosol Monitoring Project (RRAMP), Components C and D (in bold) were funded on<br />
a grant to Placer County from EPA Region IX extending RRAMP aerosol d<strong>at</strong>a, using samples<br />
collected by the Bre<strong>at</strong>he California Health Effects Task Force (HETF). Component E was a<br />
winter study, an HETF study. The final report for these components (A, C, D, and E) was<br />
submitted October 1, 2007, and is posted on the Placer County <strong>Air</strong> Pollution Control District<br />
web site. The remaining components of this report are additional programs of the HETF and the<br />
DELTA Group, University of California, Davis. However, all seven are included for<br />
completeness and ease of interpret<strong>at</strong>ion. Note th<strong>at</strong> while Components A, C, D, and E were<br />
reviewed in detail by the RRAMP Technical Advisory Committee, the conclusions presented<br />
herein are those of the investig<strong>at</strong>ors and are not an official RRAMP project.<br />
Component A RRAMP monitoring d<strong>at</strong>a, NO, NO 2 , EC, and PM 2.5 , Pool site<br />
(upwind of the rail yard <strong>at</strong> night) and Denio site (downwind of the<br />
rail yard <strong>at</strong> night), with the difference representing the rail yard<br />
contributions to <strong>at</strong>mospheric aerosols and gasses.<br />
Component B UC Davis DELTA /Bre<strong>at</strong>he California of Sacramento-Emigrant<br />
Trails (BC/SET) collabor<strong>at</strong>ive contributions, with<br />
1. Mass every 3 hrs, 8 size modes, Denio site, mass in the<br />
very fine size mode (0.26 > D p > 0.09 µm), Pool site, and<br />
2. Very fine S-XRF elemental S-XRF composition, 32<br />
elements, every 3 hr, (Pool and Denio).<br />
Component C UC Davis DELTA Group S-XRF elemental analysis of all 7<br />
size fractions, 10.0 to 0.26 µm, every 3 hr, <strong>at</strong> the Denio site, and<br />
Component D Organic analysis <strong>at</strong> the Denio site for PAHs, n-alkanes, sugars,<br />
and f<strong>at</strong>ty acids, 5 to 8 size modes, 3 integr<strong>at</strong>ed periods.<br />
This component includes an explicit comparison to<br />
diesel truck d<strong>at</strong>a from the liter<strong>at</strong>ure.<br />
Component E UC Davis DELTA Group analysis of mass and elements, Denio<br />
site, February, 2006, as part of the Bre<strong>at</strong>he California (BC/SET)<br />
studies of Sacramento aerosols.<br />
This work included a comparison to W<strong>at</strong>t Ave <strong>at</strong> Arden<br />
Way, which is included for completeness.<br />
Component F Collection of aerosols <strong>at</strong> the Pool and Denio sites, summer, 2006,<br />
and <strong>at</strong> the Pool, Denio, and Church Street sites, summer, 2007.<br />
Component G Mitig<strong>at</strong>ion options proposed by the HETF for the <strong>Roseville</strong> <strong>Railyard</strong><br />
and surrounding area.<br />
Component QA The DELTA Group’s DRUM <strong>Quality</strong> Assurance Protocols (DQAP,<br />
ver. 1/05) are included by reference, and a copy is provided. A<br />
short summary is included as Appendix QA.<br />
2
The UC Davis DELTA Group and Bre<strong>at</strong>he California of Sacramento-Emigrant Trails<br />
(BC/SET) collabor<strong>at</strong>ed with the RRAMP project to assist BC/SET ongoing studies of aerosol<br />
sources and transport in general and diesel exhaust in particular. The RRAMP program was ideal<br />
for this purpose, with an upwind-downwind measurement protocol across the <strong>Roseville</strong> <strong>Railyard</strong><br />
and numerous pollutant measurements. The DELTA Group contributions for summer, 2005,<br />
included mass by soft beta rays every 3 hours for 5 weeks (8 size modes Denio site, the very fine<br />
mode, 0.26 > Dp > 0.09 µm, Pool Site) and very fine elemental concentr<strong>at</strong>ions by synchrotroninduced<br />
X-ray fluorescence (S-XRF) every 3 hours (Denio and Pool site) for the period July 12<br />
through August 17, 2005. Samples were also taken suitable for l<strong>at</strong>er organic analysis <strong>at</strong> the<br />
Denio site from August 5 though October 17, and archived in a freezer.<br />
The results of this early effort lead to a proposal via Placer County to the US EPA Region<br />
IX for funding to analyze the remainder of the DRUM stages for the coarser elements, 10.0 to<br />
0.26 µm. July 12 through August 17, and analyze the organic samples for PAHs, n-alkanes,<br />
sugars, and f<strong>at</strong>ty acids by GC/MS (Gas Chrom<strong>at</strong>ography/Mass Spectrometry). These efforts are<br />
presented in the Final Report, “Mass, elemental, and organic aerosols by size, time, and<br />
composition for the <strong>Roseville</strong> <strong>Railyard</strong> Aerosol Monitoring Project (RRAMP)”, Prof. Thomas M.<br />
Cahill, P.I 1,2 , and Prof. Thomas A. Cahill 3,4 , co-P.I.s, Nicholas J. Spada 3 , Project Manager, Drs.<br />
David E. Barnes 3 , Steven S. Cliff 3 , and Prof. Kevin D. Perry 3,5 , Staff Scientists, and Erin Fujii 3 ,<br />
Oct.1, 2007.<br />
Additional studies were proposed to the Placer County APCD with Cahill/HETF input in<br />
winter, 2006, summer, 2006, and summer, 2007, in order to extend the summer, 2005 d<strong>at</strong>a<br />
deeper into ongoing UPRR mitig<strong>at</strong>ion efforts and prepare for potential future work summer,<br />
2008, if the Denio and Pool sites were to be removed.<br />
Finally, mitig<strong>at</strong>ion options have been developed for aerosol emissions from the <strong>Roseville</strong><br />
<strong>Railyard</strong> by the investig<strong>at</strong>ors, with input from the HETF, based partially on current HETF studies<br />
and mitig<strong>at</strong>ion on W<strong>at</strong>t Avenue.<br />
The key findings are:<br />
1. The key assumptions behind the RRAMP project are sound, with several characteristic<br />
diesel species having large railyard versus background r<strong>at</strong>ios; NO, x 22.1; NO 2 , x 7.2; very fine<br />
mass and very fine sulfur; x 4.0, black carbon, x 2.3; and a number of anthropogenic metals, x<br />
1.6 to 2.8.<br />
2. Exhaust from diesel engines as seen downwind of the <strong>Roseville</strong> <strong>Railyard</strong> differs in<br />
important ways from prior published studies of truck diesel engines<br />
a. The size of the diesel exhaust peaks in mass (and sulfur) is about 0.3 µm,<br />
roughly 3 times th<strong>at</strong> of a diesel truck under load but similar to size distributions of idling diesel<br />
engines.<br />
b. However, the PAH’s (pyrene, coronene) peak well below 0.1 µm, finer than<br />
those seen in truck studies (Zielinska et al 2004).<br />
3
<strong>Roseville</strong> <strong>Railyard</strong> Denio Site - Sulfur<br />
0.75 to 0.56 0.56 to 0.34 0.34 to 0.26 0.26 to 0.09<br />
400<br />
Nanograms/m3<br />
300<br />
200<br />
100<br />
0<br />
8 10 12 14 16 18 20 22 24 26 28 30 1 3 5 7 9 11 13 15 17<br />
9 11 13 15 17 19 21 23 25 27 29 31 2 4 6 8 10 12 14 16<br />
July, 2005 August, 2005<br />
3. The coarse (10 0 > D p > 2.5 µm) soils of the <strong>Roseville</strong> <strong>Railyard</strong> and its vicinity contain<br />
anthropogenic metals <strong>at</strong> levels many times th<strong>at</strong> of standard soil, with Enrichment Factor (EF)<br />
values such as times 33 (zinc) and times 43 (copper). Some of these m<strong>at</strong>erials are also present in<br />
fine mode aerosols smaller than 2.5 µm.<br />
4. The d<strong>at</strong>a for n-alkanes suggest th<strong>at</strong> the soil is also contamin<strong>at</strong>ed by heavy petroleumbased<br />
hydrocarbons, supporting the elemental d<strong>at</strong>a.<br />
5. The diesel exhaust from the <strong>Roseville</strong> <strong>Railyard</strong> is about 5.5 times richer in the most<br />
carcinogenic components of diesel exhaust (benzo[a]pyrene, among others) than is the exhaust<br />
from diesel trucks.<br />
Below we show profiles of rel<strong>at</strong>ive PAHs as a function of molecular mass from the<br />
<strong>Roseville</strong> <strong>Railyard</strong> and the liter<strong>at</strong>ure. RRAMP aerosols have a rel<strong>at</strong>ive enhancement of<br />
benzo[a]pyrene and similar heavy PAHs of about a factor of 3. Combining the absolute emission<br />
r<strong>at</strong>es, and using r<strong>at</strong>ios of both very fine/ultra fine mass and elemental carbon (EC), we gener<strong>at</strong>e<br />
11 different r<strong>at</strong>ios based on the method used. A weighted average of the 11 values, very fine<br />
mass and EC, gives a r<strong>at</strong>io of the RRAMP BaP to diesel trucks of 5.5 ± 0.7. This means th<strong>at</strong><br />
there was about 5.5 times more benzo[a]pyrene from the RRAMP aerosols than from diesel truck<br />
aerosols, per unit very fine/ultra fine mass and per unit elemental carbon (EC).<br />
With Key Finding 2 a and 2 b (above), this implies th<strong>at</strong> the PAHs are derived from the used<br />
lubric<strong>at</strong>ing oil, not the diesel fuel.<br />
4
Fraction of total PAHmass<br />
0.6<br />
0.5<br />
0.4<br />
0.3<br />
0.2<br />
0.1<br />
0.0<br />
0.6<br />
<strong>Roseville</strong> Rail Yard<br />
8-stage DRUM<br />
Early Lundgren<br />
L<strong>at</strong>e Lundgren<br />
Mass of<br />
benzo[a]pyrene<br />
* * *<br />
178 202 228 252 276+278 300<br />
Fraction of total PAHmass<br />
0.5<br />
0.4<br />
0.3<br />
0.2<br />
0.1<br />
Published PAH Profiles<br />
SRM 2975<br />
SRM 1650a<br />
DRI truck<br />
0<br />
178 202 228 252 276+278 300<br />
PAH molecular mass<br />
6. About ½ of the PM 2.5 organic mass was in largely biogenic sugars and f<strong>at</strong>ty<br />
acids, ½ was in petroleum based n-alkanes, and only a few percent was in PAHs.<br />
7. The winter very fine particle mass <strong>at</strong> the Denio site, 6.6 µg/m 3 , in the size range<br />
0.34 - 0.09 µm, was about three times the summer mass <strong>at</strong> the Denio site, 2.25 µg/m 3 .<br />
8. A qualit<strong>at</strong>ive comparison of downtown Sacramento (ARB’s 13 th and T Street<br />
site) and the <strong>Roseville</strong> Pool site, summer 2007, appear similar in time behavior and color,<br />
confirming th<strong>at</strong> the Pool site represents regional aerosols. The downwind Denio and<br />
Church Street sites are much darker in the finer modes, probably from soot. This is<br />
consistent with the design of the RRAMP upwind-downwind protocols to isol<strong>at</strong>e railyard<br />
emissions.<br />
9. Many options exist for mitig<strong>at</strong>ion of aerosols from the <strong>Roseville</strong> <strong>Railyard</strong>, with<br />
the HETF suggestions in Component G, including:<br />
a) Mitig<strong>at</strong>ion of railyard emissions sources (work in progress as part of an MOU<br />
between UPRR, Placer County, and others; plus additional suggestions discussed<br />
in Component G),<br />
b) Mitig<strong>at</strong>ion on railyard properties to lower the gener<strong>at</strong>ion of coarse, contamin<strong>at</strong>ed<br />
soils on site, and to lower the transport of all railyard aerosols off-site,<br />
c) Mitig<strong>at</strong>ion from the railyard boundary into nearby receptor areas, including use of<br />
distance to receptors and veget<strong>at</strong>ive barriers, and<br />
d) Mitig<strong>at</strong>ion of railyard aerosols within homes and other nearby receptors.<br />
5
Table of Contents<br />
Executive Summary 2<br />
Component A<br />
RRAMP monitoring d<strong>at</strong>a 9<br />
Component B<br />
Mass <strong>at</strong> the Denio and Pool site<br />
Elemental analysis of very fine particles <strong>at</strong> the Denio and Pool sites 15<br />
Component C<br />
Elemental analysis of 8 size ranges PM 10 to very fine <strong>at</strong> the Denio Site 32<br />
Component D 43<br />
Organic analysis of aerosols <strong>at</strong> the Denio site: PAHs 47<br />
PAHs n-alkanes 51<br />
Alkanes organic acids 55<br />
Organic acids sugars and polyols 57<br />
Comparison to truck diesel d<strong>at</strong>a 63<br />
Component E 67<br />
Aerosol sampling, winter, 2006, and comparison to heavily traveled<br />
secondary streets<br />
Component F 76<br />
Collection of aerosols <strong>at</strong> the Pool and Denio sites, summer, 2006,<br />
and <strong>at</strong> the Pool, Denio, and Church Street sites, summer, 2007.<br />
Component G<br />
Mitig<strong>at</strong>ion options proposed by the HETF for the <strong>Roseville</strong> rail yard 79<br />
References 83<br />
Acknowledgements 84<br />
Appendix QA 85<br />
List of Tables<br />
Table 1 Regional meteorology during the study 10<br />
Table 2 Placer County pollutant emissions for the 8 largest contributors 14<br />
to NO x<br />
Table 3 Organics sampling and RRAMP d<strong>at</strong>a 15<br />
Table 4a, 4b Denio site versus Pool site comparisons in parallel with DELTA 16<br />
Group sampling periods.<br />
Table 5 S-XRF comparison, all blind tests since 1999 18<br />
Table 6 Samples collected for organic analysis 47<br />
Table 7. Concentr<strong>at</strong>ions (pg/m 3 ) of particul<strong>at</strong>e PAHs observed <strong>at</strong><br />
the <strong>Roseville</strong> <strong>Railyard</strong> in the Summer of 2005 48<br />
Table 8. Concentr<strong>at</strong>ions (ng/m 3 ) of particul<strong>at</strong>e n-alkanes observed <strong>at</strong> the<br />
<strong>Roseville</strong> <strong>Railyard</strong> in the Summer of 2005 51<br />
Table 9. Concentr<strong>at</strong>ions (ng/m 3 ) of particul<strong>at</strong>e organic acids observed <strong>at</strong> the<br />
<strong>Roseville</strong> <strong>Railyard</strong> in the Summer of 2005 56<br />
Table 10. Concentr<strong>at</strong>ions (ng/m 3 ) of particul<strong>at</strong>e sugars observed <strong>at</strong> the<br />
<strong>Roseville</strong> <strong>Railyard</strong> in the Summer of 2005 58<br />
Table 11 Comparison of RRAMP Benzo{a}pyrene results to liter<strong>at</strong>ure<br />
values for diesel trucks 65<br />
6
List of Figures<br />
Figure 1 The Davis Union Pacific Rail Road <strong>Roseville</strong> <strong>Railyard</strong>. 9<br />
Figure 2 a, b, and c D<strong>at</strong>a on nitric oxide (NO), July – October, 2005 11<br />
Figure 3 a, b, and c D<strong>at</strong>a on “black carbon”, EC for July - October, 2005 12<br />
Figure 4 a, b, and c D<strong>at</strong>a on PM 2.5 mass, July – October, 2005 13<br />
Figure 5 Nick Spade (left) and David Barnes <strong>at</strong> the Denio site 17<br />
Figure 6 Precision test for mass 18<br />
Figure 7 Mass from 10.0 to 0.75 µm 19<br />
Figure 8 Mass from 0.75 to 0.09 µm 19<br />
Figure 9 Three components of fine mass versus time 20<br />
Figure 10 Comparison of the Pool and Denio sites for very fine mass 20<br />
Figure 11<br />
Nighttime (9 PM – 6 AM) mass size profiles for early August<br />
<strong>at</strong> the Denio site. 21<br />
Figure 12 Size mode of aerosol mass, July 15, versus other diesel studies 22<br />
Figure 13 Typical elemental sign<strong>at</strong>ures of diesel, Denio site very fine mode 23<br />
Figure 14 Zielenska et al 2004 diesel characteriz<strong>at</strong>ion results 23<br />
Figure 15<br />
Transition mode elements nickel, copper, and zinc in the Denio<br />
site very fine mode. 24<br />
Figure 16 Crustal elements in the very fine mode, Denio site 24<br />
Figure 17 Mass versus typically diesel sign<strong>at</strong>ure elements, Denio site 25<br />
Figure 18 Comparison of very fine sulfur, Denio Site vs Pool Site 26<br />
Figure 19 Comparison of very fine phosphorus, Denio Site vs Pool Site 27<br />
Figure 20 Comparison of very fine zinc, Denio Site vs Pool Site 27<br />
Figure 21 Comparison of very fine calcium, Denio Site vs Pool Site 28<br />
Figure 22 Comparison of very fine copper, Denio Site vs Pool Site 28<br />
Figure 23 Comparison of very fine nickel, Denio Site vs Pool Site 29<br />
Figure 24 Comparison of very fine potassium, Denio Site vs Pool Site 29<br />
Figure 25 Comparison of very fine vanadium, Denio Site vs Pool Site 30<br />
Figure 26 Comparison of very fine chromium, Denio Site vs Pool Site 31<br />
Figure 27 Sea salt sign<strong>at</strong>ure in coarse particle fluorine. 32<br />
Figure 28 HYSPLIT trajectory showing Bay Area transport, July 22, 2005 33<br />
Figure 29 Sub-micron Fine sulfur <strong>at</strong> the Denio site 34<br />
Figure 30 Components of fine sulfur <strong>at</strong> the Denio site 34<br />
Figure 31 Sub-micron sulfur versus fine iron <strong>at</strong> the Denio site 35<br />
Figure 32 Size distribution of sulfur and soils, daytime, July 18, 2006 35<br />
Figure 33 Time plots of coarse and fine silicon, Denio site 36<br />
Figure 34 Size distribution of sulfur and soils, nighttime, July 18, 2006 37<br />
Figure 35 Time plots of coarse and fine potassium, Denio site 37<br />
Figure 36 2.5 to 1.15 µm vanadium and chromium, summer, 2005 38<br />
Figure 37 Time plots of sub-microns zinc, summer, 2005 38<br />
Figure 38<br />
Figure 39<br />
Figure 40<br />
HYSPLIT Wind trajectories <strong>at</strong> the beginning of the zinc episode,<br />
on the morning of July 27. 39<br />
Comparison of very fine copper and zinc <strong>at</strong> the Pool and Denio<br />
sites. Most of the largest metal spikes occur <strong>at</strong> the Denio site. 40<br />
Size Distribution of elements on July 18, 2006, during night time<br />
cross rail yard winds 41<br />
7
Figure 41 Size Distribution of elements on July 18, 2006, during day time<br />
winds from the southwest roughly parallel to the rail yard. 42<br />
Figure 42. Coronene and pyrene concentr<strong>at</strong>ions (pg/m 3 ) is the different size<br />
fractions of the 8-stage DRUM sampler and the afterfilter. 48<br />
Figure 43. Profiles of PAHs as a function of molecular mass from the<br />
<strong>Roseville</strong> <strong>Railyard</strong> and the liter<strong>at</strong>ure. 50, 63<br />
Figure 44. A selected ion chrom<strong>at</strong>ogram of m/z 57 showing the<br />
undifferenti<strong>at</strong>ed hydrocarbon “envelope”. The n-alkanes are<br />
labeled by their carbon number. 53<br />
Figure 45 Concentr<strong>at</strong>ions of undifferenti<strong>at</strong>ed hydrocarbons in different size<br />
fractions of the 8-stage DRUM sampler. 54<br />
Figure 46. The fraction of n-alkanes collected on the after filter of the 8-stage<br />
DRUM. The C 33 to C 36 alkanes were not detected on the filter. 55<br />
Figure 47. Concentr<strong>at</strong>ion of octadecanoic, hexadecanoic and 9-octadenenoic<br />
(oleic) acid as a function of particle size. 57<br />
Figure 48. Sucrose and glucose concentr<strong>at</strong>ions (ng/m 3 ) as a function of<br />
aerosol size. 59<br />
Figure 49 Fraction of the identified organic mass belonging to the four<br />
different classes of chemicals identified. 60<br />
Figure 50. Mass of aerosols as determined by beta gauge and by the sum of<br />
The elements and oxides as determined by S-XRF. 61<br />
Figure 51. Composition of aerosol mass as determined by beta-gauge. 62<br />
Figure 52 Meteorology during the winter sampling, 2006 67<br />
Figure 53 Photograph of winter drum strips, W<strong>at</strong>t Ave <strong>at</strong> Arden versus<br />
Denio site 68<br />
Figure 54 Coarse and fine mass <strong>at</strong> W<strong>at</strong>t and Arden versus the Denio<br />
site, winter, 2006 69<br />
Figure 55 Photographs of winter DRUM strips, W<strong>at</strong>t/Arden, 2004, vs<br />
W<strong>at</strong>t/Arden and Denio, 2006 70<br />
Figure 56 Chlorine aerosols (sea salt) <strong>at</strong> W<strong>at</strong>t/Arden and Denio, winter, 2006 70<br />
Figure 57 Iron aerosols (soil) <strong>at</strong> W<strong>at</strong>t/Arden vs Denio, winter, 2006 71<br />
Figure 58 Sulfur aerosols (soil) <strong>at</strong> W<strong>at</strong>t/Arden vs Denio, winter, 2006 72<br />
Figure 59 Vanadium aerosols (heavy fuel oil) <strong>at</strong> W<strong>at</strong>t/Arden vs Denio, winter 72<br />
Figure 60 Coarse potassium aerosols (soil) <strong>at</strong> W<strong>at</strong>t/Arden vs Denio, winter 73<br />
Figure 61 a,b Accumul<strong>at</strong>ion mode potassium aerosols (wood smoke) and<br />
very fine potassium aerosols (vehicular) <strong>at</strong> W<strong>at</strong>t vs Denio, winter 74<br />
Figure 62 Very fine mode phosphorus and zinc aerosols (vehicular,<br />
Figure 63<br />
Lubric<strong>at</strong>ing oil) <strong>at</strong> W<strong>at</strong>t/Arden vs Denio, winter 2006 75<br />
Very fine mode Ni, Cu, and Zn zinc aerosols <strong>at</strong> W<strong>at</strong>t/Arden vs<br />
Denio 2006 75<br />
Figure 64 Comparison of downtown and the <strong>Roseville</strong> Pool site 77<br />
Figure 65 Comparison of the Denio and Church Street sites 78<br />
Figure 66 Preliminary d<strong>at</strong>a on removal r<strong>at</strong>e of very fine (0.26 > D p > 0.09<br />
µm) on redwood branches in the UC Davis wind tunnel 81<br />
8
Component A<br />
Introduction and RRAMP monitoring d<strong>at</strong>a<br />
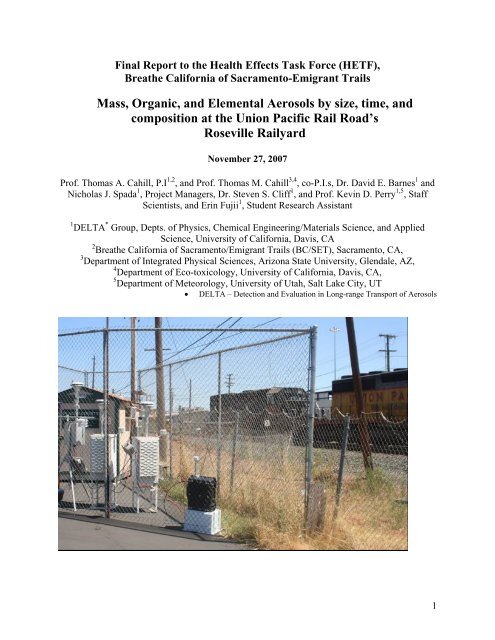
The Davis <strong>Railyard</strong> of Union Pacific Railroad (UPRR) in <strong>Roseville</strong>, California,<br />
hosts typically 31,000 trains/years for maintenance, repair, and testing, and re-routing,<br />
while an additional 16,000 trains/year pass through the yard without stopping. The<br />
pollutants emitted by the rail yard are significant components of the gas and aerosol<br />
inventory for the region. Through a joint agreement between UPRR and the California<br />
<strong>Air</strong> Resources Board (ARB), Placer and Sacramento Counties APCDs, and the US EPA,<br />
Region IX, a multi-year plan is in place for reduction of pollutants and measuring the<br />
improvement through the <strong>Roseville</strong> <strong>Railyard</strong> Aerosol Monitoring Project (RRAMP)<br />
The RRAMP program is based upon a robust air monitoring program upwind and<br />
downwind of the rail yard during summer periods when the winds are especially regular<br />
and predictable. This program also includes collabor<strong>at</strong>ive programs of Bre<strong>at</strong>he California<br />
of Sacramento-Emigrant Trails and specific purpose grants, including the present one<br />
from EPA Region IX th<strong>at</strong> funded additional aerosol elemental and organic measurements.<br />
Denio Site<br />
Pool Site<br />
Figure 1 The Davis Union Pacific Rail Road <strong>Roseville</strong> <strong>Railyard</strong><br />
9
The sites used for the present program are marked, the “Pool Site”, upwind in<br />
summer nights, and the “Denio Site”, downwind in summer nights. Two other sites also<br />
are being used in the program. The stability of the metrology during the period was<br />
typical of summer conditions near Sacramento.<br />
July 2005<br />
M<strong>at</strong>her AFB w e<strong>at</strong>her Press Visibility Direction<br />
Temp F RH % In miles Wind mph Precip 160 night<br />
Max Avg Min Max Avg Min Avg Max Avg Min Max Avg Gust inches 270 day<br />
8 Friday 87 72 57 83 59 35 29.92 10 10 10 14 8 - 0.00 SSW<br />
9 S<strong>at</strong>urday 84 73 62 88 65 35 29.91 10 10 10 15 10 18 0.00 SSW<br />
10 Sunday 80 68 57 94 76 37 29.93 10 10 10 9 7 - 0.00 SSE<br />
11 96 78 60 94 60 23 29.91 10 10 10 12 1 - 0.00 WSW<br />
12 102 82 62 83 48 18 29.89 10 10 10 9 4 - 0.00 WSW<br />
13 104 86 68 78 40 20 29.85 10 10 10 12 5 - 0.00 SW<br />
14 105 87 69 64 42 20 29.82 10 10 10 10 7 - 0.00 SSW<br />
15 Friday 105 87 69 69 40 18 29.77 10 10 10 10 6 - 0.00 SW<br />
16 S<strong>at</strong>urday 107 88 68 60 38 12 29.77 10 10 10 12 6 - 0.00 S<br />
17 Sunday 105 86 66 68 40 20 29.77 10 10 10 10 3 - 0.00 SSW<br />
18 98 82 66 68 46 27 29.76 10 10 10 12 5 - 0.00 SSW<br />
19 98 80 62 82 53 25 29.76 10 10 10 9 8 - 0.00 SSW<br />
20 102 81 60 77 42 15 29.8 10 10 10 9 7 - 0.00 SW<br />
21 87 78 64 73 44 21 29.84 10 10 10 17 9 21 0.00 SSW<br />
22 Friday 95 77 59 82 50 14 29.9 10 10 10 13 8 16 0.00 SSW<br />
23 S<strong>at</strong>urday 104 80 57 94 43 7 29.89 10 10 10 10 4 - 0.00 SSW<br />
24 Sunday 102 83 64 64 38 15 29.86 10 10 10 15 1 - 0.00 S<br />
25 100 80 59 82 43 11 29.85 10 10 10 12 6 - 0.00 SSW<br />
26 102 83 64 73 43 17 29.83 10 10 10 12 3 - 0.00 S<br />
27 100 81 62 72 43 14 29.86 10 10 10 12 7 - 0.00 SSW<br />
28 98 78 59 77 47 13 29.84 10 10 10 12 6 - 0.00 SSW<br />
29 Friday 96 79 62 68 43 22 29.87 10 10 10 12 7 - 0.00 SSW<br />
30 S<strong>at</strong>urday 100 81 62 72 47 21 29.94 10 10 10 13 6 - 0.00 SSW<br />
31 Sunday 100 81 62 68 42 11 29.92 10 10 10 9 4 - 0.00 SSW<br />
1 102 80 59 82 40 9 29.89 10 10 10 14 6 - 0.00 SSW<br />
2 96 78 59 67 40 12 29.87 10 10 10 9 6 - 0.00 SSW<br />
3 98 78 59 82 46 16 29.87 10 10 10 12 6 - 0.00 WSW<br />
4 100 80 60 77 45 18 29.93 10 10 10 9 7 - 0.00 SW<br />
5 Friday 102 83 64 68 40 15 29.93 10 10 10 12 5 - 0.00 SW<br />
6 S<strong>at</strong>urday 105 84 64 68 36 9 29.89 10 10 10 10 5 - 0.00 SSW<br />
7 Sunday 102 83 64 68 41 13 29.83 10 10 10 10 6 - 0.00 S<br />
8 96 79 62 72 44 22 29.83 10 10 10 9 5 - 0.00 SSW<br />
9 100 81 62 77 49 17 29.87 10 10 10 9 6 - 0.00 SSW<br />
10 96 78 60 77 50 22 29.9 10 10 10 9 3 - 0.00 SSW<br />
11 98 78 59 77 43 13 29.89 10 10 10 12 6 - 0.00 SSW<br />
12 Friday 100 81 62 68 43 18 29.79 10 10 10 15 5 - 0.00 SSW<br />
13 S<strong>at</strong>urday 86 70 53 94 63 33 29.8 10 10 10 12 5 - 0.00 S<br />
14 Sunday 87 71 55 94 66 35 29.81 20 11 10 12 6 - 0.00 S<br />
15 84 70 55 94 60 37 29.89 10 10 10 14 6 18 0.00 SSW<br />
16 95 80 66 73 48 23 29.94 10 10 10 10 3 - 0.00 W<br />
17 95 77 59 82 44 19 29.83 20 11 10 14 6 - 0.00 SSW<br />
18 84 68 53 100 67 27 29.83 10 10 8 14 8 20 0.00 SSW<br />
19 Friday 87 72 57 94 62 16 29.89 10 10 10 9 8 - 0.00 SSW<br />
S<strong>at</strong>urday<br />
Sunday<br />
Table 1 Regional meteorology during the study<br />
Generally, the regional we<strong>at</strong>her (M<strong>at</strong>her AFB) showed wind direction roughly<br />
160 o <strong>at</strong> night, and roughly 270 o during the day, with small vari<strong>at</strong>ions. This p<strong>at</strong>tern,<br />
10
confirmed by on-site meteorology, makes the Denio site downwind each night for about 8<br />
hr every night from the Pool site direction.<br />
Below we show the major d<strong>at</strong>a from the monitoring program for 2005. The<br />
pollutants were chosen to reflect a primarily diesel based emissions.<br />
Gaseous Pollutants during RRAMP, Summer, 2005<br />
600<br />
NO <strong>at</strong> the Denio site<br />
NO <strong>at</strong> the Pool Site<br />
Parts per billion (ppb)<br />
500<br />
400<br />
300<br />
200<br />
100<br />
0<br />
15<br />
16<br />
17<br />
18<br />
19<br />
21<br />
20<br />
July<br />
22<br />
23<br />
24<br />
25<br />
26<br />
27<br />
28<br />
29<br />
30<br />
31<br />
1<br />
2<br />
3<br />
4<br />
5<br />
6 8<br />
7<br />
August<br />
9<br />
10<br />
11<br />
12<br />
13<br />
14<br />
15<br />
16<br />
17<br />
Gaseous Pollutants during RRAMP, Summer, 2005<br />
400<br />
NO <strong>at</strong> the Denio site<br />
NO <strong>at</strong> the Pool Site<br />
Parts per billion (ppb)<br />
300<br />
200<br />
100<br />
0<br />
17 19 21 23 25 27 29 31 2<br />
18 20 22 24 26 28 30 1<br />
3<br />
4<br />
5<br />
6<br />
7<br />
8<br />
10 12 14 16 18 20 22 24 26<br />
9 11 13 15 17 19 21 23 25<br />
August<br />
Septermber<br />
Gaseous Pollutants during RRAMP, Fall, 2005<br />
600<br />
NO <strong>at</strong> the Denio site<br />
NO <strong>at</strong> the Pool Site<br />
Parts per billion (ppb)<br />
500<br />
400<br />
300<br />
200<br />
100<br />
0<br />
27 28 29 30 1 2 3 4 5 6 7 8 9 10 11 12 13 14 15<br />
September<br />
October<br />
Figure 2 a, b, and c D<strong>at</strong>a on nitric oxide (NO), July – October, 2005<br />
11
Particul<strong>at</strong>e Pollutants during RRAMP, Summer, 2005<br />
Black Carbon <strong>at</strong> the Denio site<br />
Black Carbon <strong>at</strong> the Pool Site<br />
8<br />
7<br />
Micrograms/3<br />
6<br />
5<br />
4<br />
3<br />
2<br />
1<br />
0<br />
15 17 19 21 23 25 27 29 31<br />
16 18 20 22 24 26 28 30<br />
1<br />
2<br />
3<br />
4<br />
5<br />
6<br />
7<br />
8<br />
9<br />
10 12 14 16<br />
11 13 15 17<br />
July<br />
August<br />
Particlu<strong>at</strong>e Pollutants during RRAMP, Summer, 2005<br />
BC <strong>at</strong> the Denio site<br />
BC <strong>at</strong> the Pool Site<br />
7<br />
6<br />
Micrograms/m3<br />
5<br />
4<br />
3<br />
2<br />
1<br />
0<br />
17 19 21 23 25 27 29 31 2<br />
18 20 22 24 26 28 30 1<br />
3<br />
4<br />
5<br />
6<br />
7<br />
8<br />
9<br />
10 12 14 16 18 20 22 24 26<br />
11 13 15 17 19 21 23 25<br />
August<br />
Septermber<br />
Particul<strong>at</strong>e Pollutants during RRAMP, Fall, 2005<br />
BC <strong>at</strong> the Denio site<br />
BC <strong>at</strong> the Pool Site<br />
12<br />
Micrograms/m3<br />
10<br />
8<br />
6<br />
4<br />
2<br />
0<br />
27 28 29 30 1 2 3 4 5 6 7 8 9 10 11 12 13 14 15<br />
September<br />
October<br />
Figure 3 a, b, and c D<strong>at</strong>a on “black carbon”, EC for July - October, 2005<br />
12
Particul<strong>at</strong>e Pollutants during RRAMP, Summer, 2005<br />
150<br />
PM2.5 mass <strong>at</strong> the Denio site<br />
PM2.5 mass <strong>at</strong> the Pool Site<br />
Micrograms/m3<br />
100<br />
50<br />
0<br />
15 17 19 21 23 25 27 29 31<br />
16 18 20 22 24 26 28 30 1<br />
2<br />
3<br />
4<br />
5<br />
6<br />
7<br />
8<br />
9<br />
10 12 14 16<br />
11 13 15 17<br />
July<br />
August<br />
Particlu<strong>at</strong>e Pollutants during RRAMP, Summer, 2005<br />
150<br />
PM2.5 <strong>at</strong> the Denio site<br />
PM2.5 <strong>at</strong> the Pool Site<br />
Micrograms/m3<br />
100<br />
50<br />
0<br />
17 19 21 23 25 27 29 31 2<br />
18 20 22 24 26 28 30 1<br />
3<br />
4<br />
5<br />
6<br />
7<br />
8<br />
10 12 14 16 18 20 22 24 26<br />
9 11 13 15 17 19 21 23 25<br />
August<br />
Septermber<br />
Micrograms/m3<br />
90<br />
80<br />
70<br />
60<br />
50<br />
40<br />
30<br />
20<br />
10<br />
0<br />
Particul<strong>at</strong>e Pollutants during RRAMP, Fall, 2005<br />
27 28 29 30 1 2 3 4 5 6 7 8 9 10 11 12 13 14 15<br />
September<br />
PM2.5 <strong>at</strong> the Denio site<br />
October<br />
PM2.5 <strong>at</strong> the Pool Site<br />
Figure 4 a, b, and c D<strong>at</strong>a on PM 2.5 mass, July – October, 2005<br />
13
The role of trains, roughly 3/4 road haul, 1/4 switching, in gener<strong>at</strong>ing NO x for<br />
Placer County is shown in the 2005 Almanac summary, expressed as fraction of the total<br />
pollutant in each c<strong>at</strong>egory. The table lists the top 8 contributors to NO x , which amount to<br />
96.9% of the total from all sources. Trains domin<strong>at</strong>e NO x, 24.2 % of the total, and SO x ,<br />
63.3% of the total emissions.<br />
Pollutant TOG ROG CO NO x SO x TSP PM 10 PM 2.5<br />
Total (ordered by NO x ) 100.0 100.0 100.0 100.0 100.0 100.0 100.0 100.0<br />
Trains 0.7 1.5 0.8 24.2 63.3 0.5 0.8 1.8<br />
Off road vehicles 8.4 19.6 25.1 21.1 4.1 1.5 2.4 5.1<br />
(no trains)<br />
Heavy duty trucks 0.3 0.6 0.5 13.4 4.1 0.2 0.4 0.9<br />
on road – diesels<br />
Light duty trucks 5.0 11.8 18.4 10.7 2.0 0.3 0.5 0.8<br />
Fuel combustion - 1.4 1.5 1.1 10.1 4.1 0.5 0.9 2.0<br />
commercial/utilities<br />
Passenger cars 4.5 10.8 14.8 7.5 2.0 0.3 0.6 0.8<br />
Medium and heavy 2.5 5.7 8.7 6.6 1.0 0.1 0.2 0.2<br />
Trucks - Gas<br />
Residential fuel<br />
7.1 7.9 14.8 3.2 14.3 9.3 14.9 34.9<br />
combustion<br />
Fraction of total –<br />
8 largest c<strong>at</strong>egories<br />
29.9 59.4 84.2 96.9 94.9 12.9 20.7 46.5<br />
Table 2 Placer County pollutant emissions for the 8 largest contributors to NO x<br />
14
2. Component B<br />
UC Davis DELTA Group and Bre<strong>at</strong>he California of Sacramento-Emigrant Trails<br />
(BC/SET) collabor<strong>at</strong>ion<br />
The UC Davis DELTA Group and Bre<strong>at</strong>he California of Sacramento-Emigrant<br />
Trails (BC/SET) collabor<strong>at</strong>ed with the RRAMP project to assist its ongoing studies of<br />
aerosol sources and transport in general and diesel exhaust in particular. The RRAMP<br />
program was ideal for this purpose, with an upwind-downwind measurement protocol<br />
across the <strong>Roseville</strong> <strong>Railyard</strong> and numerous measurements. The regional meteorology<br />
was stable (above), with typical summer conditions and a persistent across-yard air<br />
transport almost every night.<br />
1. Sampling<br />
a. Dur<strong>at</strong>ion and Sites<br />
Aerosol sampling was initi<strong>at</strong>ed on July 8 <strong>at</strong> the Denio site, 3 hr resolution, with 2<br />
DELTA 8 DRUM inertial impactors oper<strong>at</strong>ed on a side by side mode for quality<br />
assurance valid<strong>at</strong>ion until July 12. One 8 DRUM was then moved to the Pool site. Both<br />
samplers delivered d<strong>at</strong>a until August 15, but only the very fine (vf) size mode ( 0.26 D p ><br />
0.09 µm) of the Pool site sampler met all QA checks because of an internal leak.<br />
Sampling for organic analysis commenced with another DELTA 8 DRUM <strong>at</strong> the<br />
Denio site on August 5, running to September 27. Finally, two sets of samples were<br />
collected with high flow Lundgren impactors, Sept. 27 – Oct. 7, and Oct. 7 - Oct. 17, the<br />
l<strong>at</strong>ter only oper<strong>at</strong>ing for 8 hrs each night, 10 PM – 6 AM. In all three cases, samples were<br />
integr<strong>at</strong>ed over the sampling time.<br />
PM 2.5<br />
Denio Site Sampler Analysis NO NO x Black<br />
Carbon mass<br />
Sampling Substr<strong>at</strong>e ppb ppb µg/m 3 µg/m 3<br />
Periods<br />
7/21 – 8/17, 8 DRUM, 16 Mass, 81.0 120.2 1.2 14.4<br />
3 hr L/min, Mylar elements<br />
8/5 – 9/27 8 DRUM, 16 Organics 62.8 94.2 1.4 12.9<br />
Average L/min, aluminum<br />
9/27 – 10/7 Lundgren, 150 Organics 87.6 120.8 1.8 11.1<br />
nights L/min, aluminum<br />
10/7 – 10/17 Lundgren, 150 Organics 69.2 101.3 1.8 14.2<br />
nights L/min aluminum<br />
Pool Site<br />
7/21 – 8/17, 8 DRUM, 16 Mass, vf 3.7 17.0 0.5 9.7<br />
3 hr L/min, Mylar elements<br />
8/5 – 9/27, None None 8.3 26.2 0.6 9.3<br />
9/27 – 10/7, None None 30.8 59.5 1.0 9.6<br />
10/7 – 10/17, None None 17.7 45.9 1.0 12.2<br />
Table 3 Sampling schedule and mean RRAMP monitoring d<strong>at</strong>a for the four time periods<br />
utilized.<br />
15
Below we summarize the RRAMP air monitoring d<strong>at</strong>a averaged over the<br />
sampling periods of the DRUM samplers.<br />
Site Wind Pool Denio Pool Denio Pool Denio Pool Denio<br />
Pollutant Speed NO NO NO 2 NO 2 EC EC PM 2.5 PM 2.5<br />
Units mph Ppb ppb ppb ppb µg/m 3 µg/m 3 µg/m 3 µg/m 3<br />
7/21 – 8/15 4.32 3.63 80.34 16.60 119.20 0.5 1.2 9.7 14.3<br />
8/5 – 9/27 4.36 8.10 63.02 26.01 94.80 0.6 1.4 9.4 13.0<br />
9/27 – 10/7 3.67 31.39 85.63 60.01 118.29 1.0 1.8 9.3 10.9<br />
10/7 – 10/17 3.83 17.87 73.87 46.08 107.36 1.0 1.8 12.5 14.6<br />
2/10 - 2/24<br />
Calcul<strong>at</strong>ing differences and r<strong>at</strong>ios, it become clear th<strong>at</strong> nitric oxide (NO) has the<br />
best discrimin<strong>at</strong>ion between rail yard and non-rail yard sources in summer, (x 22.1) with<br />
NO 2 close behind (x 7.2). Black carbon (EC) (x 2.3) is significantly worse, while PM 2.5 is<br />
not very specific to the rail yard, as expected. ( x 1.48)<br />
Site Denio<br />
- Pool<br />
Denio/<br />
Pool<br />
Denio<br />
- Pool<br />
Denio/<br />
Pool<br />
Denio<br />
- Pool<br />
Denio/<br />
Pool<br />
Denio<br />
- Pool<br />
Denio/<br />
Pool<br />
Pollutant NO NO NO 2 NO 2 EC EC PM 2.5 PM 2.5<br />
Units ppb R<strong>at</strong>io ppb R<strong>at</strong>io µg/m 3 r<strong>at</strong>io µg/m 3 r<strong>at</strong>io<br />
7/21–8/15 76.7 22.1 102.6 7.2 0.7 2.3 1.5 1.48<br />
8/5 – 9/27 54.9 7.8 68.8 3.6 0.8 2.5 1.4 1.38<br />
9/27–10/7 54.2 2.7 58.3 2.0 0.8 1.8 1.2 1.17<br />
10/7–10/17 56.0 4.1 61.3 2.3 0.8 1.8 1.2 1.17<br />
2/10 - 2/24<br />
Table 4a, 4b Denio site versus Pool site comparisons in parallel with DELTA Group<br />
sampling periods.<br />
Note the breakdown of the clean summer Denio versus Pool downwind-upwind<br />
rel<strong>at</strong>ionship as the program pushed into fall months.<br />
The excess black carbon, assigned to the rail yard, is remarkably constant <strong>at</strong> 0.7<br />
µg/m 3 , or about ½ of the PM 2.5 mass increment. It is also clear th<strong>at</strong> the rel<strong>at</strong>ionship, rail<br />
yard to non rail yard sources, is significantly poorer by the fall months, but the rail yard<br />
contribution is still about the same value. This may, however, be misleading as the Pool<br />
Site upwind values are rising sharply by fall, as much as a factor of 2 to 5 for the tracer<br />
species, so the difference and r<strong>at</strong>io are degraded while the concentr<strong>at</strong>ions are rel<strong>at</strong>ively<br />
stable.<br />
Thus, the monitoring d<strong>at</strong>a show th<strong>at</strong> the Denio Site is the optimum site for<br />
measuring organic species <strong>at</strong> the <strong>Roseville</strong> <strong>Railyard</strong> even in the early fall periods<br />
16
. Sampling Equipment<br />
The samplers used were DELTA Group 8 DRUM inertial impactors (Cahill et al,<br />
1985). These slotted impactors are based on the Lundgren impactor (Cahill and<br />
Wakabayashi, 1993) with theoretical and experimental valid<strong>at</strong>ion of sizing (Raabe et al,<br />
1989). The DRUM collects aerosols continuously onto 8 slowly rot<strong>at</strong>ing drums in 8 size<br />
modes: 10 to 5.0, 2.5, 1.15, 0.75, 0.56, 0.34, 0.26, and 0.09 µm aerodynamic diameters.<br />
One sampler, the Pool site, was an older model th<strong>at</strong> had to be modified to meet equivalent<br />
upwind – downwind comparison.<br />
Lundgren<br />
8 DRUM<br />
with PM 10<br />
Figure 5 Nick Spade (left) and David Barnes <strong>at</strong> the Denio site, Sept. 27, 2005. The c<strong>at</strong>tle<br />
auction buildings of the Denio’s Farmer’s Market are seen behind them, across a large<br />
parking lot.<br />
c. <strong>Quality</strong> assurance<br />
Full quality assurance document<strong>at</strong>ion for DRUM samplers, and references on<br />
their use, are contained in the DRUM <strong>Quality</strong> Assurance Protocols version 1/05 (DQAP v<br />
1/05) available on the DELTA web site: http://delta.ucdavis.edu. A printed copy will be<br />
supplied with this Final Report, and a summary is included in Appendix QA.<br />
As an example, we include below a precision test of soft beta ray mass analysis on<br />
a RRAMP DRUM strip. Analysis was completed for mass values every 1 ½ hours in 8<br />
size modes for the entire period. Each strip was analyzed <strong>at</strong> least 2 times, and the<br />
standard devi<strong>at</strong>ion of the d<strong>at</strong>a is included in the d<strong>at</strong>a file.<br />
17
200<br />
<strong>Quality</strong> Assurance Precision Test of RRAMP DRUM strips<br />
UC Davis DELTA Group soft beta ray mass analysis<br />
Denio DRUM #8 Stage 8 0.26 > Dp > 0.09 microns<br />
Run #1 Run #2<br />
Micrograms/cm2<br />
150<br />
100<br />
50<br />
0<br />
26<br />
31<br />
36<br />
46 56 66 76 86 96 106 116 126 136 146 156 166<br />
41 51 61 71 81 91 101 111 121 131 141 151 161 171<br />
Millimeters along DRUM strip<br />
Figure 6 Precision test for mass<br />
Note th<strong>at</strong> since the strip was remounted, the test also valid<strong>at</strong>es rel<strong>at</strong>ive time<br />
precision. Any measurements where the analysis differs by more than ± 10% are<br />
independently re-run until agreement is achieved.<br />
The samples collected by the DRUM sampler are designed to allow highly<br />
sensitive elemental analysis by the new DELTA Group designed aerosol analysis system<br />
of the x-ray micro beam of the Advanced Light Source, Lawrence Berkeley NL (Bench et<br />
al, 2002). The method, synchrotron-induced x-ray fluorescence (S-XRF) has been used<br />
by the DELTA Group since 1992, (Cahill et al, 1992) but in its present form since 1999.<br />
<strong>Study</strong> and d<strong>at</strong>e Methods Average r<strong>at</strong>io,<br />
Al to Fe<br />
Std.<br />
dev.<br />
Average r<strong>at</strong>io,<br />
Cu to Pb<br />
Std.<br />
dev.<br />
BRAVO, 1999 PIXE vs 0.99 0.04<br />
S-XRF<br />
BRAVO, 1999 CNL XRF vs<br />
1.24 0.14<br />
S-XRF<br />
FACES, 2001 ARB XRF vs 0.93 0.21 1.02 0.08<br />
S-XRF<br />
FACES, 2001 ARB RAAS (0.98) 0.27 (0.74) 0.23<br />
vs S-XRF<br />
ARB LTAD 2005 DRI XRF vs 1.037 0.085 0.907 0.009<br />
S-XRF<br />
All prior studies Average 0.984 0.15 0.977 0.115<br />
Table 5 S-XRF comparison, all blind tests since 1999<br />
18
The S-XRF system has been tested in blind inter-comparisons since 1999, and all<br />
of these are shown above. Typically 32 elements are recorded for each analysis, all of<br />
which can be traced back to NIST primary (SRM # 1832, SRM # 1833) or secondary<br />
(Microm<strong>at</strong>ter thin film) standards. MDLs are included in Appendix QA.<br />
2. Results<br />
a. Mass<br />
All results are provided on a CD in the form of Excel spread sheets. The DRUM<br />
<strong>Quality</strong> Assurance Protocols (DQAP ver 1/05) are included by reference, but a hard copy<br />
(135 pages) can be downloaded if required.<br />
10<br />
Aerosol Mass in the Coarser > 0.75 micron Size Mode<br />
UC Davis DELTA Group 8 DRUM, soft beta ray analysis<br />
10.0 to 5.0 5.0 to 2.5 2.5 to 1.15 1.15 to 0.76<br />
Micrograms/m3<br />
8<br />
6<br />
4<br />
2<br />
0<br />
12 14 16 18 20 22 24 26 28 30 1<br />
13 15 17 19 21 23 25 27 29 31<br />
2<br />
3<br />
4<br />
5<br />
6<br />
7<br />
8<br />
9<br />
11 13<br />
10 12 14<br />
July August, 2005<br />
Figure 7 Mass from 10.0 to 0.75 µm<br />
Aerosol Mass in the sub-micron (< 0.75) micron Size Modes<br />
UC Davis DELTA Group 8 DRUM, soft beta ray analysis<br />
0.75 to 0.56 0.56 to 0.34 0.34 to 0.26 0.26 to 0.09<br />
5<br />
Micrograms/m3<br />
4<br />
3<br />
2<br />
1<br />
0<br />
12 14 16 18 20 22 24 26 28 30 1<br />
13 15 17 19 21 23 25 27 29 31<br />
2<br />
3<br />
4<br />
5<br />
6<br />
7<br />
8<br />
9<br />
11 13<br />
10 12 14<br />
July August, 2005<br />
Figure 8 Mass from 0.75 to 0.09 µm<br />
19
<strong>Roseville</strong> Rail Yard <strong>Study</strong> - Denio Site<br />
Mass by Particle Diameter - UC Davis DRUM/soft beta ray mass<br />
Micrograms/m3<br />
8<br />
7<br />
6<br />
5<br />
4<br />
3<br />
2<br />
1<br />
0<br />
2.5 to 1.15 0.34 to 0.26 0.26 to 0.09<br />
10 12 14 16 18 20 22 24 26 28 30 1 3 5 7 9 11 13 15 17<br />
9 11 13 15 17 19 21 23 25 27 29 31 2 4 6 8 10 12 14 16 18<br />
July, 2005 August, 2005<br />
Figure 9 Three components of fine mass versus time<br />
Above we present the sub-2.5 µm soils (to 1.15) and the very fines soot like<br />
particles. The most striking results were the very highly correl<strong>at</strong>ed very fine particles<br />
(0.34 µm) <strong>at</strong> night anti-correl<strong>at</strong>ed with fine mass in the 2.5 to 1.15 µm mode, typically<br />
fine soil in the summer Central Valley conditions. The night mass peaks can confidently<br />
be assigned to rail yard aerosols. Below we compare the very fine micron mass (0.26 ><br />
D p > 0.09 µm) from the Pool site and the Denio site.<br />
Aerosol Mass in the Very Fine (9.25 0 > Dp > 0.09 micron) Size Mode<br />
UC Davis DELTA Group 8 DRUM, soft beta ray analysis<br />
Denio site<br />
Pool site<br />
3<br />
Micrograms/m3<br />
2.5<br />
2<br />
1.5<br />
1<br />
0.5<br />
0<br />
12 14 16 18 20 22 24 26 28 30 1<br />
13 15 17 19 21 23 25 27 29 31<br />
2<br />
3<br />
4<br />
5<br />
6<br />
7<br />
8<br />
9<br />
11 13<br />
10 12 14<br />
July August, 2005<br />
Figure 10 Comparison of the Pool and Denio sites for very fine mass<br />
20
Detailed meteorological analysis is needed to interpret these d<strong>at</strong>a, augmented by<br />
high resolution d<strong>at</strong>a such as NO to properly assign DRUM time sign<strong>at</strong>ures. However,<br />
there are periods (July 14 – 16, July 29 – August 7) when daytime values <strong>at</strong> the Denio<br />
and Pool sites are similar and 6 hr average nighttime values <strong>at</strong> the Denio site are<br />
enhanced, with an approxim<strong>at</strong>e mean value of 1.35 ± 0.27 µg/m 3 .<br />
Average Denio/Pool difference for 9 hrs, 10:30 PM to 7:30 AM, for the July-<br />
August DRUM sampling period, was 0.83 µg/m 3 . The median (a better estim<strong>at</strong>e) was<br />
0.87 µg/m 3 , and maximum was 1.53 µg/m 3 . We can compare these d<strong>at</strong>a with the d<strong>at</strong>a for<br />
mass of black carbon (EC), since EC is known to be primarily in the very fine mode. The<br />
EC difference, Denio – Pool, was 0.7 µg/m 3 , while the average DRUM very fine mass<br />
difference was 0.83 µg/m 3 (for PM 2.5 , the value was 1.5 µg/m 3 ). However, recall th<strong>at</strong> this<br />
DRUM did not have an after filter for the < 0.09 µm particles and thus would lose some<br />
mass.<br />
There is an enormous amount of inform<strong>at</strong>ion on particle size, but interpret<strong>at</strong>ion of<br />
these d<strong>at</strong>a is hampered by lack of Pool site d<strong>at</strong>a and elemental analysis of the coarser<br />
modes. Nevertheless, below we plot 9 hr (9 PM- 6 AM) nighttime mass distributions <strong>at</strong><br />
the Denio site for 5 days in early August when the very fine mode Pool site-Denio site<br />
comparisons indic<strong>at</strong>e direct rail yard influence.<br />
Figure 11 Nightime (9 PM – 6 AM) mass size profiles for early August <strong>at</strong> the Denio site.<br />
We can compare these d<strong>at</strong>a to other measurements of diesel exhaust in labor<strong>at</strong>ory<br />
and field conditions. Below we plot these d<strong>at</strong>a for July 15 and compare them with a<br />
recent (2005) study we are doing with Johns Hopkins University on the Baltimore<br />
McHenry tunnels, one bore of which is all truck traffic and overwhelmingly diesel. These<br />
21
d<strong>at</strong>a are then compared to a 2002 study with the U. of Minnesota diesels in the labor<strong>at</strong>ory,<br />
an average of 6 different runs, mostly with California fuel (Zielinska et al, 2004).<br />
Comparison of Diesel Trains and Diesel Trucks<br />
Mass (normalized)<br />
<strong>Roseville</strong> trains Minnesota diesel trucks (lab) Diesel trucks McHenry Tunnel,<br />
Baltimore<br />
3.5<br />
3<br />
2.5<br />
2<br />
1.5<br />
1<br />
0.5<br />
0<br />
0.0 to 0.09 0.26 to 0.34 0.56 to 0.75 1.15 to 2.5 5.0 to 10.0<br />
0.09 to 0.26 0.34 to 0.56 0.75 to 1.15 2.5 to 5.0<br />
Aerodynamic Diameter in Micrometers<br />
Figure 12 Size mode of aerosol mass, July 15, versus other recent diesel studies<br />
From the plots, it is clear th<strong>at</strong> the very fine and accumul<strong>at</strong>ion size modes of the diesel<br />
exhaust from the rail yard are considerably coarser in particle size than th<strong>at</strong> in the<br />
labor<strong>at</strong>ory or tunnel diesel trucks sign<strong>at</strong>ure, while the coarse modes mimic the tunnel d<strong>at</strong>a.<br />
b. Elemental d<strong>at</strong>a – very fine particles <strong>at</strong> the Denio and Pool sites<br />
i. Denio Site<br />
The Stage 8 sample from the Denio site was selected for elemental analysis by<br />
S-XRF as this stage is the size mode heavily represented in diesel exhaust (Zielinska <strong>at</strong> al,<br />
2004). The strip was analyzed in 3 hr increments, resulting in 320 analyses with almost<br />
9,000 d<strong>at</strong>a values and 9,000 individually calcul<strong>at</strong>ed errors.<br />
An example of the almost 9,000 elemental d<strong>at</strong>a, each with an associ<strong>at</strong>ed error, is shown<br />
below for three elements previously identified with diesel exhaust from trucks (Zielinska<br />
et al, 2004), phosphorus and zinc from the zinc thio phosph<strong>at</strong>e stabilizer in lubric<strong>at</strong>ing<br />
oils, sulfur from the fuel.<br />
22
Characteristic Diesel Aerosols in the Very Fine Size Mode<br />
Denio DRUM Stage 8, 0.26 > Dp > 0.09 microns<br />
Phosphorus Zinc x 10 Sulfur/10<br />
ng/m3 (Sulfur/10, Zinc x 10)<br />
20<br />
15<br />
10<br />
5<br />
0<br />
8 10 12 14 16 18 20 22 24 26 28 30 1 3 5 7 9 11 13 15<br />
9 11 13 15 17 19 21 23 25 27 29 31 2 4 6 8 10 12 14<br />
July<br />
August<br />
Figure 13 Typical elemental sign<strong>at</strong>ures of diesel, Denio site very fine mode<br />
These elements had been seen earlier in this size mode in our work in Zielinska et al 2004,<br />
and tied to their sources in the fuel and lubric<strong>at</strong>ing oil.<br />
Diesel Particles by MOUDI Impactor and S-XRF<br />
Sample Run # 4, CA Fuel; no grease<br />
0.16<br />
0.14<br />
0.12<br />
Micrograms/cm2<br />
0.1<br />
0.08<br />
0.06<br />
0.04<br />
0.02<br />
-0.02<br />
0<br />
18<br />
10<br />
5.62<br />
3.2<br />
1.8<br />
1<br />
0.56<br />
0.32<br />
0.18<br />
0.1<br />
0.056<br />
0.032<br />
0.018<br />
0.01<br />
Coarse MOUDI Stage Diameter (micrometers) Ultra- Fine<br />
Mass/200<br />
Sulfur<br />
Lead<br />
Zinc x 10<br />
Calcium<br />
Phosphorus<br />
For micrograms/m3, times 8.7<br />
DELTA Group, S-XRF, UC Davis<br />
Figure 14. Zielinska et al diesel characteriz<strong>at</strong>ion results<br />
23
There are additional very fine aerosols th<strong>at</strong> have strong nighttime sign<strong>at</strong>ures.<br />
RRAMP Aerosols in the Very Fine Size Mode<br />
Denio DRUM Stage 8, 0.26 > Dp > 0.09 microns<br />
Nickel Copper Zinc<br />
ng/m3 (Sulfur/10, Zinc x 10)<br />
3<br />
2.5<br />
2<br />
1.5<br />
1<br />
0.5<br />
0<br />
8<br />
10 12 14 16 18 20 22 24 26 28 30 1 3 5 7 9 11 13 15<br />
9 11 13 15 17 19 21 23 25 27 29 31 2 4 6 8 10 12 14<br />
July<br />
August<br />
Figure 15 Transition mode elements nickel, copper, and zinc in the Denio site very fine<br />
mode.<br />
Below we show some aerosols th<strong>at</strong> would be, in coarser modes, derived from soil (Si, K,<br />
Ca, Fe) or in a finer mode, wood smoke (K).<br />
RRAMP Aerosols in the Very Fine Size Mode<br />
Denio DRUM Stage 8, 0.26 > Dp > 0.09 microns<br />
Silicon Potassium Calcium Iron<br />
ng/m3 (Sulfur/10, Zinc x 10)<br />
25<br />
20<br />
15<br />
10<br />
5<br />
0<br />
8<br />
10 12 14 16 18 20 22 24 26 28 30 1 3 5 7 9 11 13 15<br />
9 11 13 15 17 19 21 23 25 27 29 31 2 4 6 8 10 12 14<br />
July<br />
August<br />
Figure 16 Crustal elements in the very fine mode, Denio site<br />
24
Combining the mass and elemental d<strong>at</strong>a, we can identify sources for the observed mass.<br />
Below we show a few days in early August, associ<strong>at</strong>ing the nighttime mass peaks with<br />
characteristic diesel effluents. Note the anti correl<strong>at</strong>ed mass near PM 2.5 , associ<strong>at</strong>ed with<br />
stronger daytime winds<br />
<strong>Roseville</strong> Rail Yard <strong>Study</strong> - Denio Site<br />
Mass by Particle Diameter - UC Davis DRUM/soft beta ray mass<br />
6<br />
5<br />
2.5 to 1.15 0.34 to 0.26 0.26 to 0.09<br />
Micrograms/m3<br />
4<br />
3<br />
2<br />
1<br />
0<br />
1<br />
2<br />
3<br />
4<br />
5<br />
6<br />
7<br />
August, 2005<br />
Preliminary Composition of Very Fine Aerosols, Denio Site<br />
0.26 > Dp > 0.09 microns<br />
Phosphorus Sulfur/10 Zinc x 10<br />
12<br />
10<br />
Nanograms/m3<br />
8<br />
6<br />
4<br />
2<br />
0<br />
Figure 17 Mass versus typically diesel sign<strong>at</strong>ure elements, Denio site<br />
25
ii. Pool Site<br />
The mass d<strong>at</strong>a show th<strong>at</strong> in the very finest mode of the Pool site DRUM sampler, the<br />
critical orifice Stage 8 from 0.26 > D p > 0.09 µm, had run properly. The mass delivered<br />
was equivalent (0.72 µg/m 3 Denio, 0.68 µg/m 3 Pool, each with an error of ± 0.2 µg/m 3 )<br />
when the Denio and Pool samplers were co-loc<strong>at</strong>ed <strong>at</strong> the Denio site from July 8 through<br />
July 12. Thus, the DELTA Group could safely compositionally analyze the samples by S-<br />
XRF. We report here the preliminary d<strong>at</strong>a pending the required S-XRF precision reanalysis<br />
protocol Level 1 of DQAP ver 1/06.<br />
The results were again compared <strong>at</strong> the co-loc<strong>at</strong>ed site and were again equivalent. For<br />
the 5 major elements, which make up 87% of all S-XRF elemental mass, the r<strong>at</strong>io,<br />
Pool/Denio, was 0.97 ± 0.27. On the other hand, two trace elements, Ni and Cu, did not<br />
agree, while there was also some excess soil seen in the first few hours of sampling,<br />
probably from contamin<strong>at</strong>ion in handling. Since the amount of soil on this stage is
Phosphorus is normally a sign<strong>at</strong>ure of the combustion of lubric<strong>at</strong>ing oil from the<br />
zinc thio-phosph<strong>at</strong>e stabilizer. It, too, shows a nighttime enhancement synchronous with<br />
sulfur, but there are also other sources present <strong>at</strong> the upwind site, perhaps reflecting the<br />
heavy nighttime truck traffic on I-80. However, the phosphorus spike on July 18 is<br />
clearly some special situ<strong>at</strong>ion th<strong>at</strong> requires much more analysis.<br />
<strong>Roseville</strong> <strong>Railyard</strong> Denio Site - Phosphorus<br />
Denio site 0.26 to 0.09 Pool site 0.26 to 0.09<br />
Nanograms/m3<br />
20<br />
15<br />
10<br />
5<br />
co-loc<strong>at</strong>ed<br />
<strong>at</strong> Denio<br />
0<br />
8<br />
10 12 14 16 18 20 22 24 26 28 30 1 3<br />
9 11 13 15 17 19 21 23 25 27 29 31 2 4<br />
5 7<br />
6 8<br />
July, 2005 August, 2005<br />
Figure 19 Comparison of very fine phosphorus, Denio Site vs Pool Site<br />
9 11 13 15 17<br />
10 12 14 16<br />
Zinc, on the other hand, clearly has numerous sources in the area, although in<br />
August we do see a system<strong>at</strong>ic nighttime enhancement.<br />
<strong>Roseville</strong> <strong>Railyard</strong> Denio Site - Zinc<br />
Denio site 0.26 to 0.09 Pool site 0.26 to 0.09<br />
Nanograms/m3<br />
8<br />
7<br />
6<br />
5<br />
4<br />
3<br />
2<br />
1<br />
0<br />
co-loc<strong>at</strong>ed<br />
<strong>at</strong> Denio<br />
8<br />
9<br />
10 12 14 16 18 20 22 24 26 28 30 1<br />
11 13 15 17 19 21 23 25 27 29 31<br />
3 5 7<br />
2 4 6 8<br />
July, 2005 August, 2005<br />
9 11 13 15 17<br />
10 12 14 16<br />
Figure 20 Comparison of very fine zinc, Denio Site vs Pool Site<br />
27
The last element system<strong>at</strong>ically associ<strong>at</strong>ed with diesel combustion is calcium,<br />
which in this very fine size mode is a tracer of calcium carbon<strong>at</strong>e, an antacid in the<br />
lubric<strong>at</strong>ing oil. Sodium carbon<strong>at</strong>e is also used in some oils, which may be the source of<br />
the rel<strong>at</strong>ively high sodium numbers.<br />
<strong>Roseville</strong> <strong>Railyard</strong> Denio Site - Calcium<br />
Nanograms/m3<br />
9<br />
8<br />
7<br />
6<br />
5<br />
4<br />
3<br />
2<br />
1<br />
coloc<strong>at</strong>ed<br />
<strong>at</strong><br />
0<br />
8<br />
9<br />
Denio site 0.26 to 0.09 Pool site 0.26 to 0.09<br />
10 12 14 16 18 20 22 24 26 28 30 1<br />
11 13 15 17 19 21 23 25 27 29 31<br />
3 5 7<br />
2 4 6 8<br />
July, 2005 August, 2005<br />
Figure 21 Comparison of very fine calcium, Denio Site vs Pool Site<br />
9 11 13 15 17<br />
10 12 14 16<br />
In addition to the expected elements from the combustion of diesel fuel and<br />
lubric<strong>at</strong>ing oil, we observe other elements. Copper and nickel behave in a similar manner<br />
and have poor agreement <strong>at</strong> the co-loc<strong>at</strong>ed site for reasons th<strong>at</strong> are not clear <strong>at</strong> this time,<br />
but based upon agreement in re-analysis, is probably accidental contamin<strong>at</strong>ion of the first<br />
8 cm (first 20 days of July).<br />
<strong>Roseville</strong> <strong>Railyard</strong> Denio Site - Copper<br />
Denio site 0.26 to 0.09 Pool site 0.26 to 0.09<br />
Nanograms/m3<br />
2.5<br />
2<br />
1.5<br />
1<br />
0.5<br />
co-loc<strong>at</strong>ed<br />
<strong>at</strong> Denio<br />
0<br />
8<br />
10 12 14 16 18 20 22 24 26 28 30 1 3 5 7 9 11 13 15 17<br />
9 11 13 15 17 19 21 23 25 27 29 31 2 4 6 8 10 12 14 16<br />
July, 2005 August, 2005<br />
Figure 22 Comparison of very fine copper, Denio Site vs Pool Site<br />
28
Until we can do further analyses, we must assign much of the Denio signal for<br />
these elements for the first 10 days to contamin<strong>at</strong>ion, either on the drums or perhaps in<br />
the air, since it is well known th<strong>at</strong> some motors give off a fine copper aerosol. Note th<strong>at</strong><br />
there was also an anomalous mass sign<strong>at</strong>ure for the very coarsest particles for the first<br />
few days <strong>at</strong> Denio site, strengthening the argument for contamin<strong>at</strong>ion.<br />
<strong>Roseville</strong> <strong>Railyard</strong> Denio Site - Nickel<br />
Denio site 0.26 to 0.09 Pool site 0.26 to 0.09<br />
3<br />
2.5<br />
co-loc<strong>at</strong>ed<br />
<strong>at</strong> Denio<br />
Nanograms/m3<br />
2<br />
1.5<br />
1<br />
0.5<br />
0<br />
8<br />
10 12 14 16 18 20 22 24 26 28 30 1 3 5 7 9 11 13 15 17<br />
9 11 13 15 17 19 21 23 25 27 29 31 2 4 6 8 10 12 14 16<br />
July, 2005 August, 2005<br />
Figure 23 Comparison of very fine nickel, Denio Site vs Pool Site<br />
Potassium, on the other hand, is usually domin<strong>at</strong>ed by internal combustion engines in this<br />
size mode. Potassium from wood smoke peaks in the 0,34 to 0.56 µm mode.<br />
<strong>Roseville</strong> <strong>Railyard</strong> Denio Site - Potassium<br />
Nanograms/m3<br />
90<br />
80<br />
70<br />
60<br />
50<br />
40<br />
30<br />
20<br />
10<br />
0<br />
co-loc<strong>at</strong>ed<br />
<strong>at</strong> Denio<br />
8<br />
Denio site 0.26 to 0.09 Pool site 0.26 to 0.09<br />
10 12 14 16 18 20 22 24 26 28 30 1 3<br />
9 11 13 15 17 19 21 23 25 27 29 31 2 4<br />
5 7<br />
6 8<br />
July, 2005 August, 2005<br />
Figure 24 Comparison of very fine potassium, Denio Site vs Pool Site<br />
9 11 13 15 17<br />
10 12 14 16<br />
29
Vanadium is used in metallurgy and has a very high boiling point. It also occurs n<strong>at</strong>urally<br />
in soil <strong>at</strong> a trace level. However, in this size mode, it is almost certainly from some high<br />
temper<strong>at</strong>ure process. The nighttime enhancement was unexpected.<br />
<strong>Roseville</strong> <strong>Railyard</strong> Denio Site - Vanadium<br />
Denio site 0.26 to 0.09 Pool site 0.26 to 0.09<br />
Nanograms/m3<br />
0.9<br />
0.8<br />
0.7<br />
0.6<br />
0.5<br />
0.4<br />
0.3<br />
0.2<br />
0.1<br />
0<br />
coloc<strong>at</strong>ed<br />
<strong>at</strong><br />
8<br />
10 12 14 16 18 20 22 24 26 28 30 1 3 5 7 9 11 13 15 17<br />
9 11 13 15 17 19 21 23 25 27 29 31 2 4 6 8 10 12 14 16<br />
July, 2005 August, 2005<br />
Figure 25 Comparison of very fine vanadium, Denio Site vs Pool Site<br />
Chromium has similar behavior to vanadium metallurgically, but has a very different<br />
behavior in RRAMP.<br />
30
<strong>Roseville</strong> <strong>Railyard</strong> Denio Site - Chromium<br />
Denio site 0.26 to 0.09 Pool site 0.26 to 0.09<br />
Nanograms/m3<br />
5<br />
4<br />
3<br />
2<br />
1<br />
0<br />
8 10 12 14 16 18 20 22 24 26 28 30 1 3 5 7<br />
9 11 13 15 17 19 21 23 25 27 29 31 2 4 6 8<br />
July, 2005 August, 2005<br />
Figure 26 Comparison of very fine chromium, Denio Site vs Pool Site<br />
9 11 13 15 17<br />
10 12 14 16<br />
In summary, the elemental d<strong>at</strong>a support and confirm the nighttime enhancement<br />
of aerosols expected from oper<strong>at</strong>ions of the <strong>Roseville</strong> <strong>Railyard</strong> while identifying other<br />
components of unknown origin. With the completion of the EPA Region 9 grant, full<br />
elemental size distributions will be available <strong>at</strong> the Denio site, which will gre<strong>at</strong>ly assist us<br />
in interpreting the d<strong>at</strong>a. We will also have the repe<strong>at</strong> runs which are part of the Level 1<br />
quality assurance protocols for S-XRF, similar to those shown earlier for mass.<br />
31
3. Component C<br />
Enhancement of aerosol d<strong>at</strong>a by S-XRF analysis <strong>at</strong> the Denio site; all size modes<br />
The presence of a rel<strong>at</strong>ively large amount of mass (Figures 8 and 9) <strong>at</strong> sizes not<br />
typical of fresh diesel exhaust encourage DELTA to propose to measure these species to<br />
complete the picture of aerosols <strong>at</strong> the Denio site in summer. Thus, the un-analyzed<br />
DRUM Stages 1 through 7 (10.0 to 5.0, 5.0 to 2.5, 2.5 to 1.15, 1.15 to 0.75.0.75 to 0.56,<br />
0.56 to 0.34, 0.34 to 0.26 µm aerodynamic diameter) were analyzed by S-XRF in 3 hr<br />
increments.<br />
salt.<br />
.<br />
The first result was the discovery of periodic oceanic influence in the form of sea<br />
<strong>Roseville</strong> <strong>Railyard</strong> Denio Site<br />
Chlorine<br />
10.0 to 5.0 5.0 to 2.5 2.5 to 1.15 1.15 to 0.75<br />
Nanograms/m3<br />
350<br />
300<br />
250<br />
200<br />
150<br />
100<br />
50<br />
0<br />
8<br />
10 12 14 16 18 20 22 24 26 28 30 1 3 5 7 9 11 13 15 17<br />
9 11 13 15 17 19 21 23 25 27 29 31 2 4 6 8 10 12 14 16<br />
July, 2005 August, 2005<br />
Figure 27 Sea salt sign<strong>at</strong>ure in coarse particle fluorine.<br />
This hypothesis was confirmed via trajectory analysis from the NOAA RERADY<br />
ARL HYSPLIT isentropic trajectory program, version 4. High speed transport trajectories<br />
for the chlorine peaks were associ<strong>at</strong>ed with rapid transport of air from the ocean near<br />
Point Reyes to <strong>Roseville</strong>.<br />
32
Figure 28 HYSPLIT trajectory showing Bay Area transport, July 22, 2005<br />
The strongest correl<strong>at</strong>ion between nighttime transport across the rail yard was<br />
sulfur, a component of burned diesel fuel in the very fine particle mode (Figure 11).<br />
Examining the vari<strong>at</strong>ion of sulfur with size and time, we can see th<strong>at</strong> the p<strong>at</strong>tern in the<br />
expected very fine (0.26 > D p > 0.09 µm) mode extends into the accumul<strong>at</strong>ion mode.<br />
33
<strong>Roseville</strong> <strong>Railyard</strong> Denio Site - Sulfur<br />
0.75 to 0.56 0.56 to 0.34 0.34 to 0.26 0.26 to 0.09<br />
400<br />
Nanograms/m3<br />
300<br />
200<br />
100<br />
0<br />
8 10 12 14 16 18 20 22 24 26 28 30 1 3 5 7 9 11 13 15 17<br />
9 11 13 15 17 19 21 23 25 27 29 31 2 4 6 8 10 12 14 16<br />
July, 2005 August, 2005<br />
Figure 29 Sub-micron sulfur <strong>at</strong> the Denio site<br />
While the strong day night p<strong>at</strong>tern in very fine sulfur was expected, wh<strong>at</strong> was not<br />
expected was the continu<strong>at</strong>ion of this p<strong>at</strong>tern into accumul<strong>at</strong>ion mode aerosols up to 0.75<br />
µm diameter, and even larger, although mass measurements (Figures 8 and 9) had shown<br />
mass present in these sizes.<br />
Figure 30 Components of fine sulfur <strong>at</strong> the Denio site<br />
34
Then results from sulfur can be contrasted with th<strong>at</strong> of soils, as shown by the iron<br />
tracer in the larger size modes.<br />
400<br />
<strong>Roseville</strong> <strong>Railyard</strong> Denio Site - Sulfur and Iron (soil)<br />
0.56 to 0.34 sulfur 1.15 to 0.75 0.75 to 0.56 sulfur 2.5 to 1.15 iron<br />
Nanograms/m3<br />
300<br />
200<br />
100<br />
0<br />
8<br />
10 12 14 16 18 20 22 24 26 28 30 1 3<br />
9 11 13 15 17 19 21 23 25 27 29 31 2<br />
5 7<br />
4 6 8<br />
July, 2005 August, 2005<br />
9 11 13 15 17<br />
10 12 14 16<br />
Figure 31 Sub-micron sulfur versus fine iron <strong>at</strong> the Denio site<br />
The almost perfect anti-correl<strong>at</strong>ion of fine sulfur to coarse soil is fully consistent<br />
with the meteorology of the site and the stronger daytime winds from the southwest.<br />
However, the situ<strong>at</strong>ion becomes more complex than simply soil in day and diesels <strong>at</strong><br />
night. Below we show the graph for the major soil elements, silicon, for the summer<br />
period. The high levels on July 9 came on strong winds, gust to 18 mph, from the<br />
southwest, across the Denio’s Farmer’s Market, which was in oper<strong>at</strong>ion th<strong>at</strong> day. The size<br />
distribution is somewh<strong>at</strong> finer than typical wind blown dust.<br />
500<br />
<strong>Roseville</strong> <strong>Railyard</strong> Aerosols<br />
Denio Site, Day, July 18, 2005<br />
Sulfur Silicon Iron<br />
Nanograms/ m3<br />
400<br />
300<br />
200<br />
100<br />
0<br />
0.09 to 0.26 0.34 to 0.56 0.75 to 1.15 2.5 to 5.0<br />
0.26 to 0.34 0.56 to 0.75 1.15 to 2.5 5.0 to 10.0<br />
Particle Diameter micrometers<br />
Figure 32 Size distribution of sulfur and soils, daytime, July 18, 2006<br />
35
<strong>Roseville</strong> <strong>Railyard</strong> Denio Site - Silicon<br />
10.0 to 5.0 5.0 to 2.5 2.5 to 1.15 1.15 to 0.75<br />
4<br />
Denio's<br />
Denio's<br />
Denio's<br />
Denio's<br />
Denio's<br />
Denio's<br />
Nanograms/m3<br />
Thousands<br />
3<br />
2<br />
1<br />
0<br />
8 10 12 14 16 18 20 22 24 26 28 30 1 3 5 7 9 11 13 15 17<br />
9 11 13 15 17 19 21 23 25 27 29 31 2 4 6 8 10 12 14 16<br />
July, 2005 August, 2005<br />
<strong>Roseville</strong> <strong>Railyard</strong> Denio Site - Silicon<br />
0.75 to 0.56 0.56 to 0.34 0.34 to 0.26 0.26 to 0.09<br />
Nanograms/m3<br />
60<br />
50<br />
40<br />
30<br />
20<br />
10<br />
0<br />
-10<br />
8<br />
10 12 14 16 18 20 22 24 26 28 30 1 3 5 7 9 11 13 15 17<br />
9 11 13 15 17 19 21 23 25 27 29 31 2 4 6 8 10 12 14 16<br />
July, 2005 August, 2005<br />
Figure 33 Time plots of coarse and fine silicon, Denio site<br />
But there is also a small amount of silicon seen each night in very fine size modes,<br />
coming from the rail yard. The source of this m<strong>at</strong>erial is unknown <strong>at</strong> this time<br />
36
<strong>Roseville</strong> <strong>Railyard</strong> Aerosols<br />
Denio Site, Night, July 18, 2005<br />
Sulfur Silicon Iron<br />
500<br />
Nanograms/m3<br />
400<br />
300<br />
200<br />
100<br />
0<br />
0.09 to 0.26 0.34 to 0.56 0.75 to 1.15 2.5 to 5.0<br />
0.26 to 0.34 0.56 to 0.75 1.15 to 2.5 5.0 to 10.0<br />
Partic le Diameter mic rometers<br />
Figure 34 Size distribution of sulfur and soils, nighttime, July 18, 2006<br />
<strong>Roseville</strong> <strong>Railyard</strong> Denio Site<br />
Potassium<br />
10.0 to 5.0 5.0 to 2.5 2.5 to 1.15 1.15 to 0.75<br />
Nanograms/m3<br />
300<br />
250<br />
200<br />
150<br />
100<br />
50<br />
0<br />
8<br />
Denio's<br />
Denio's<br />
Denio's<br />
Denio's<br />
10 12 14 16 18 20 22 24 26 28 30 1<br />
9 11 13 15 17 19 21 23 25 27 29 31<br />
Denio's<br />
3 5 7<br />
2 4 6 8<br />
July, 2005 August, 2005<br />
Denio's<br />
9 11 13 15 17<br />
10 12 14 16<br />
120<br />
100<br />
Denio's<br />
0.75 to 0.56 0.56 to 0.34 0.34 to 0.26 0.26 to 0.09<br />
Denio's<br />
Denio's<br />
Denio's<br />
Denio's<br />
Denio's<br />
Nanograms/m3<br />
80<br />
60<br />
40<br />
20<br />
0<br />
8<br />
10 12 14 16 18 20 22 24 26 28 30 1 3<br />
9 11 13 15 17 19 21 23 25 27 29 31 2<br />
July, 2005 August, 2005<br />
Figure 35 Time plots of coarse and fine potassium, Denio site<br />
4<br />
5<br />
6<br />
7<br />
8<br />
9 11 13 15 17<br />
10 12 14 16<br />
37
Potassium also has anomalous behaviors, with the coarse potassium clearly of soil<br />
origin, but finer accumul<strong>at</strong>ion mode potassium, usually a sign<strong>at</strong>ure of wood smoke,<br />
peaking typically when the Denio’s Farmers Market was in oper<strong>at</strong>ion.<br />
However, the coarser size modes also possess a number of anthropogenic metals.<br />
Below we show an example of chromium and vanadium in the upper end of the fine size<br />
mode, 2.5 to 1.15 µm diameter, a region of particle size th<strong>at</strong> has significant lung capture<br />
potential, circa 20%. Also shown is zinc in the fine particle and accumul<strong>at</strong>ion modes. The<br />
clear day-night p<strong>at</strong>terns seen in some of the species like sulfur are much weaker in the<br />
metals, although <strong>at</strong> times there are strong enhancements <strong>at</strong> night. At other times, sources<br />
are clearly more complex.<br />
<strong>Roseville</strong> <strong>Railyard</strong> Denio Site - Fine Anthropogenic Metals<br />
2.5<br />
Vanadium 2.5 to 1.15 microns<br />
Chromium 2.5 to 1.15 microns<br />
Nanograms/m3<br />
2<br />
1.5<br />
1<br />
0.5<br />
0<br />
8<br />
10 12 14 16 18 20 22 24 26 28 30 1 3 5 7 9 11 13 15 17<br />
9 11 13 15 17 19 21 23 25 27 29 31 2 4 6 8 10 12 14 16<br />
July, 2005 August, 2005<br />
Figure 36 2.5 to 1.15 µm vanadium and chromium, summer, 2005<br />
Zinc<br />
10<br />
0.75 to 0.56 0.56 to 0.34 0.34 to 0.26 0.26 to 0.09<br />
Nanograms/m3<br />
8<br />
6<br />
4<br />
2<br />
0<br />
8<br />
10 12 14 16 18 20 22 24 26 28 30 1<br />
9 11 13 15 17 19 21 23 25 27 29 31 2<br />
July, 2005 August, 2005<br />
Figure 37 Time plots of sub-microns zinc, summer, 2005<br />
3<br />
4<br />
5<br />
6<br />
7<br />
8<br />
9 11 13 15 17<br />
10 12 14 16<br />
38
The large zinc episode around July 27 though July 28, for example, largely came<br />
into the site from the southwest, not from across the rail yard, and was also seen <strong>at</strong> the<br />
Pool Site. The nighttime wind on July 28 was weak and of short dur<strong>at</strong>ion.<br />
Figure 38 Wind trajectories <strong>at</strong> the beginning of the zinc episode, on the morning of July<br />
27. The typical night time cross-rail yard winds were weak and of short dur<strong>at</strong>ion. during<br />
this episode.<br />
Other elements may or may not be involved in these episodic spikes of metals.<br />
For example, below we show the very fine d<strong>at</strong>a from both the Denio site and the pool site.<br />
Note th<strong>at</strong> there is little copper in the zinc episode around July 27, and th<strong>at</strong> the Pool site<br />
39
was also involved. All the evidence points to a source or sources southwest of and outside<br />
of the <strong>Roseville</strong> <strong>Railyard</strong>s.<br />
2<br />
<strong>Roseville</strong> <strong>Railyard</strong> Denio Site - Zinc<br />
Denio site 0.26 to 0.09 Pool site 0.26 to 0.09<br />
Nanograms/m3<br />
1.5<br />
0.5<br />
1<br />
0<br />
8<br />
9<br />
10 12 14 16 18 20 22 24 26 28 30 1<br />
11 13 15 17 19 21 23 25 27 29 31<br />
July, 2005 August, 2005<br />
2<br />
3<br />
4<br />
5<br />
6<br />
7<br />
8<br />
9<br />
11 13 15 17<br />
10 12 14 16<br />
<strong>Roseville</strong> <strong>Railyard</strong> Denio Site - Copper<br />
Denio site 0.26 to 0.09 Pool site 0.26 to 0.09<br />
2.5<br />
Nanograms/m3<br />
2<br />
1.5<br />
1<br />
0.5<br />
0<br />
8<br />
9<br />
10 12 14 16 18 20 22 24 26 28 30 1<br />
11 13 15 17 19 21 23 25 27 29 31<br />
July, 2005 August, 2005<br />
2<br />
3<br />
4<br />
5<br />
6<br />
7<br />
8<br />
9<br />
11 13 15 17<br />
10 12 14 16<br />
Figure 39 Comparison of very fine copper and zinc <strong>at</strong> the Pool and Denio sites. Most of<br />
the largest metal spikes occur <strong>at</strong> the Denio site.<br />
As an example of the complexity of the coarse particle d<strong>at</strong>a, we have selected just<br />
one day-night period when the upwind-downwind vectors across the rail yard were well<br />
established. We then calcul<strong>at</strong>ed the size of soil (silicon, iron, and coarse potassium),<br />
wood smoke and cars (fine potassium), sulfur (diesel fuel), phosphorus and zinc<br />
(lubric<strong>at</strong>ing oil), and other trace elements vanadium, nickel, copper, and lead. These are<br />
gre<strong>at</strong>ly enhanced over wh<strong>at</strong> one would expect in soil, with enrichment factors versus<br />
mean Earth crustal values (Handbook of Chemistry and Physics, F - 143 1989) such as<br />
times 33 (zinc) and times 43 (copper).<br />
40
<strong>Roseville</strong> <strong>Railyard</strong> Aerosols<br />
Denio Site, Night, July 18, 2005<br />
Sulfur S ilic on Iron<br />
500<br />
Nanograms/m3<br />
400<br />
300<br />
200<br />
100<br />
0<br />
0.09 to 0.26 0.34 to 0.56 0.75 to 1.15 2.5 to 5.0<br />
0.26 to 0.34 0.56 to 0.75 1.15 to 2.5 5.0 to 10.0<br />
60<br />
Particle Diameter micrometers<br />
Phosphorus Potassium Lead<br />
50<br />
Nanograms/m3<br />
40<br />
30<br />
20<br />
10<br />
0<br />
4<br />
0.09 to 0.26 0.34 to 0.56 0.75 to 1.15 2.5 to 5.0<br />
0.26 to 0.34 0.56 to 0.75 1.15 to 2.5 5.0 to 10.0<br />
Partic le Diameter in mic rometers<br />
Nickel Copper Zinc Vanadium<br />
Nanograms/m3<br />
3<br />
2<br />
1<br />
0<br />
0.09 to 0.26 0.34 to 0.56 0.75 to 1.15 2.5 to 5.0<br />
0.26 to 0.34 0.56 to 0.75 1.15 to 2.5 5.0 to 10.0<br />
Partic le Diameter in mic rometers<br />
Figure 40 Size Distribution of elements on July 18, 2006, during night time cross rail<br />
yard winds.<br />
41
<strong>Roseville</strong> <strong>Railyard</strong> Aerosols<br />
Denio Site, Day, July 18, 2005<br />
Sulfur Silicon Iron<br />
500<br />
Nanograms/m3<br />
400<br />
300<br />
200<br />
100<br />
60<br />
0<br />
0.09 to 0.26 0.34 to 0.56 0.75 to 1.15 2.5 to 5.0<br />
0.26 to 0.34 0.56 to 0.75 1.15 to 2.5 5.0 to 10.0<br />
Partic le Diameter mic rometers<br />
Phosphorus Potassium Lead<br />
50<br />
Nanograms/m3<br />
40<br />
30<br />
20<br />
10<br />
0<br />
0.09 to 0.26<br />
0.26 to 0.34<br />
0.34 to 0.56<br />
0.56 to 0.75<br />
0.75 to 1.15<br />
1.15 to 2.5<br />
2.5 t o 5.0<br />
5.0 t o 10.0<br />
Particle Diameter in micrometers<br />
Nickel Copper Zinc Vanadium<br />
4<br />
3<br />
Nanograms/m3<br />
2<br />
1<br />
0<br />
0.09 to 0.26<br />
0.26 to 0.34<br />
0.34 to 0.56<br />
0.56 to 0.75<br />
0.75 to 1.15<br />
1.15 to 2.5<br />
2.5 t o 5.0<br />
5.0 t o 10.0<br />
Particle Diameter in micrometer s<br />
Figure 41 Size Distribution of elements on July 18, 2006, during day time winds from<br />
the southwest roughly parallel to the rail yard.<br />
One of the most unexpected finding was th<strong>at</strong> much of the same behavior occurred<br />
during daylight hours, when winds typically blew to the Denio site roughly parallel with<br />
to rail yard tracks and <strong>at</strong> a higher wind velocities.<br />
42
4. Component D<br />
Organic Sample Collection and Analysis, Denio Site<br />
The <strong>Roseville</strong> <strong>Railyard</strong> is a large source of diesel emissions. Most of the<br />
analysis done thus far in RRAMP have focused on monitoring gasses (NO, NO x ) and<br />
particul<strong>at</strong>e m<strong>at</strong>ter, (Black Carbon (EC) mass, PM 2.5 mass), enhanced by mass and<br />
elemental composition as a function of particle size from the DRUM samplers. However,<br />
these alone may not accur<strong>at</strong>ely assess the toxicity of the diesel emission from<br />
locomotives since the emissions of chemicals from locomotives have not been well<br />
characterized. If locomotives are assumed to have the same emission profiles as diesel<br />
trucks, then it would appear th<strong>at</strong> they may have an impact. However, there are reasons to<br />
believe th<strong>at</strong> the emission profiles from the locomotives may be different than the d<strong>at</strong>a<br />
from trucks.<br />
The present mass measurements show th<strong>at</strong> the size of the aerosols emitted by<br />
locomotives in RRAMP are different than diesel trucks, (Figure 9), so the amount of the<br />
emissions th<strong>at</strong> are respirable and the toxic chemicals contained therein may also be<br />
different. Thus any accur<strong>at</strong>e assessment of the rail yard will need to determine the<br />
toxicity, by measuring the PAH concentr<strong>at</strong>ions, of the locomotive emissions <strong>at</strong> the site.<br />
For this reason, we added sample collection suitable for organic analysis towards the end<br />
of the summer, 2005 campaign, in the hopes of eventually being able to conduct organic<br />
analysis of the aerosols downwind of the <strong>Roseville</strong> <strong>Railyard</strong>. The samples were collected<br />
and placed in freezers until funds could be obtained to do the analysis. This section of<br />
the Final Report contains the results of these analyses.<br />
1. Methods<br />
We collected particul<strong>at</strong>e m<strong>at</strong>ter from August to October, 2005 <strong>at</strong> the Denio<br />
downwind site using an 8-stage DRUM sampler and a Lundgren impactor (see table 1,<br />
repe<strong>at</strong>ed below). The Lundgren impactor has a high flow r<strong>at</strong>e (~130 L/min) th<strong>at</strong> collects<br />
considerable mass, but the size cut points are r<strong>at</strong>her coarse (50% cut points of 17µm,<br />
5µm, 2µm and 0.5µm for the four stages) for diesel exhaust. However, the large amount<br />
of mass collected gives a high degree of sensitivity. A quartz filter was then used to<br />
collect aerosols with a diameter of less than 0.5µm. The Lundgren impactor was<br />
deployed for 2 – 10 days intervals to collect a single set of samples (4 stages, 1 filter and<br />
2 blanks).<br />
The other sampler utilized will be the 8-stage DRUM sampler with aluminum<br />
substr<strong>at</strong>es, which is identical to the sampler used for elemental and mass analyses. Using<br />
identical samplers will ensure accur<strong>at</strong>e comparisons between the elemental and organic<br />
results. This sampler has a much lower flow r<strong>at</strong>e (~16 L/min), so less mass will be<br />
collected and the sensitivity of the analysis will be lower. However, this sampler has 8<br />
fractions with most of them being smaller than the Lundgren impactor. This<br />
understanding in which size fractions the PAHs reside is particularly important since it<br />
will determine how much of the total PAH load is present in the respirable aerosol<br />
fraction. Since the flow r<strong>at</strong>e of this sampler is much lower, it was run for 6 weeks to<br />
43
collect a set of samples (8 stages, one filter and 3 blanks). For this study, we were able to<br />
modify the DRUM sampler to accept an after filter.<br />
We obtained two sets of Lundgren impactor strips and filters, which will give a<br />
total of 10 samples (4 size fractions and a filter for each of 10 days of oper<strong>at</strong>ion). The 8-<br />
stage DRUM will give a total of 9 samples during its six-week long oper<strong>at</strong>ion (8 stages +<br />
a filter). Therefore, there will be a total of 19 samples th<strong>at</strong> will be extracted and analyzed<br />
for PAHs and n-alkanes. In addition, there were approxim<strong>at</strong>ely 8 blanks to ensure th<strong>at</strong><br />
the sample substr<strong>at</strong>es were clean and th<strong>at</strong> there was little/no contamin<strong>at</strong>ion from sample<br />
handling. After sample collection, the samples were stored in sealed glass jars <strong>at</strong> -20 o C<br />
until sample extraction.<br />
2. Sample analysis<br />
Each sample was tested for four classes of compounds, namely PAHs, alkanes,<br />
organic acids and sugars. The first two classes of chemicals are non-polar and are often<br />
the result of primary emission sources. The organic acids and the sugars/levoglucosan<br />
are polar chemicals th<strong>at</strong> require deriv<strong>at</strong>iz<strong>at</strong>ion prior to analysis. The organic acids arise<br />
from both combustion processes and from biological m<strong>at</strong>erials while the sugars are<br />
almost always biological in origin. Levoglucosan is a famous tracer of biomass<br />
combustion (“wood smoke”), so it was determined to assess the contribution of wood<br />
smoke to the aerosols th<strong>at</strong> were collected. Considering th<strong>at</strong> the sample collection period<br />
was in the summer, we did not anticip<strong>at</strong>e significant wood smoke sign<strong>at</strong>ures in the<br />
samples.<br />
Each of the field samples was enriched with 100 ng of a series of deuter<strong>at</strong>ed<br />
PAHs and n-alkanes to determine the extraction efficiency of the analytical method. The<br />
labeled PAHs were: phenanthrene-d 10 , fluoranthene-d 10 , pyrene-d 10 chrysene-d 12 , and<br />
benzo[k]fluoranthene-d 12 (Cambridge Isotope Labor<strong>at</strong>ories Inc. Andover, MA) while the<br />
n-alkanes were n-tetracosane-d 50 and hex<strong>at</strong>riacontane-d 74 (Cambridge Isotope<br />
Labor<strong>at</strong>ories Inc.). The samples were also enriched with benzoic-d 6 acid and succinic-<br />
13 C 2 acid to represent the organic acids th<strong>at</strong> are in the samples.<br />
Each sample was placed in a 10 ml centrifuge vial and extracted three times with<br />
7 ml of toluene (HPLC grade, Burdick and Jackson, Muskegon, MI) to remove the nonpolar<br />
fraction and then the samples were then extracted three times with 7ml of methanol<br />
(purge-and-trap grade, Fisher Scientific Company, Fair Lawn, NJ). For the first<br />
extraction with each solvent, the sample centrifuge tube was wrapped in aluminum foil to<br />
protect it from light and then placed on a test tube shaker (Labquake series 1104,<br />
Barnstead Thermolyne, Dubuque IW) for 20 hours. After the first solvent wash, the<br />
samples were centrifuged <strong>at</strong> 3000 RPM (IEC Clinical Centrifuge, Intern<strong>at</strong>ional<br />
Equipment Co., Needham Heights, MA) for 5 minutes to settle any solids. The solution<br />
was removed and transferred to another centrifuge tube for concentr<strong>at</strong>ion by nitrogen<br />
evapor<strong>at</strong>ion. The second and third washes with each solvent were conducted for 2 hours<br />
each, thus the total extraction time was 24 hours for each solvent. After each wash, the<br />
sample was centrifuged before the solution was removed. The non-polar (toluene) and<br />
44
polar (methanol) extracts were stored separ<strong>at</strong>ely. For each sample, the toluene and<br />
methanol fractions were reduced to 2 ml by nitrogen evapor<strong>at</strong>ion.<br />
The analysis of PAHs and n-alkanes only utilized the toluene fraction since these<br />
compounds will only be found in this fraction. One milliliter (50% of the sample extract)<br />
was removed and passed through a pasture pipet clean-up column consisting of 1.5 g of<br />
silica gel (70-320 mesh, Fisher Scientific Co.) to remove polar chemicals th<strong>at</strong> may<br />
interfere with the analysis. The silica gel column was eluted with 7 ml toluene. The<br />
extract was concentr<strong>at</strong>ed by nitrogen evapor<strong>at</strong>ion to 100 µl and then it was transferred to<br />
a GC vial. Pyrene-d 10 was then added to the sample, giving a concentr<strong>at</strong>ion of 100pg/µl,<br />
to serve as an internal standard. The samples were then ready for analysis by gas<br />
chrom<strong>at</strong>ography- ion trap mass spectrometry (GC-MS).<br />
The analysis of sugars and acids required deriv<strong>at</strong>iz<strong>at</strong>ion by BSTFA (Supelco,<br />
Bellefonte, PA), which is a silyl<strong>at</strong>ion reagent. In this case, 100µl of the toluene extract<br />
and 100µl of the methanol extract, which represent 5% of the total sample mass, were<br />
added to a GC vial. The extract was evapor<strong>at</strong>ed to dryness by nitrogen evapor<strong>at</strong>ion in the<br />
GC vial. The samples were re-constituted in 100µl of a 50:50 BSTFA:pyridine<br />
deriv<strong>at</strong>iz<strong>at</strong>ion solution (pyridine from Aldrich Chemical Co.). The samples were then<br />
placed on a dryb<strong>at</strong>h he<strong>at</strong>er set to 40 o C for 24 hours. After deriv<strong>at</strong>iz<strong>at</strong>ion was complete,<br />
the samples were uncapped and pyrene-d 10 was added as an injection standard. The<br />
samples were then ready for analysis by GC-MS.<br />
All samplers were quantified using a Varian 3400 GC coupled to a S<strong>at</strong>urn 2000<br />
ion trap mass spectrometer (Varian Inc., Walnut Creek, CA). The analytical column was<br />
a Varian Factor Four High Temper<strong>at</strong>ure Column (30m length, 0.25mm ID, 0.1µm film<br />
thickness, and 5% phenyl substituted st<strong>at</strong>ionary phase). Helium was used as the carrier<br />
gas with a linear velocity of 37cm/sec. The oven program for the PAH and n-alkane<br />
analyses was: initial temper<strong>at</strong>ure of 64 o C held for 5 minutes, then ramp 5 o C/min to 375 o C,<br />
and hold for 5 minutes. The sugar and acid analysis had a similar program except th<strong>at</strong> it<br />
started <strong>at</strong> 35 o C (hold 5 minutes), and then ramped 5 o C to 330 o C. Sample introduction<br />
consisted of 5µl injection of the sample extract onto a glass wool-packed injection port<br />
liner th<strong>at</strong> was maintained <strong>at</strong> 5 o C or more below the boiling temper<strong>at</strong>ure of the sample<br />
solvent. The injection port temper<strong>at</strong>ure was them increased to 375 o C for the PAH and n-<br />
alkane analyses and 300 o C for the sugar and acid analysis. This causes the analytes to<br />
vol<strong>at</strong>ilize from the injection port and move onto the column before the column<br />
temper<strong>at</strong>ure is increased. The PAH analysis was the only exception to this procedure<br />
since 20µl of the sample was injected r<strong>at</strong>her than 5µl to achieve gre<strong>at</strong>er sensitivity.<br />
The analysis of the sugars, acids and n-alkanes utilized a simple electron<br />
ioniz<strong>at</strong>ion (EI) mass spectrometer program with a scan range of 50 to 650 mass units. All<br />
instrumental conditions were Varian default settings except for the target ion count,<br />
which was reduced from 20,000 to 10,000. The ion trap temper<strong>at</strong>ure was set <strong>at</strong> 220 o C for<br />
all analyses. The PAH analysis program was different in th<strong>at</strong> it used MS-MS techniques<br />
to improve sensitivity and selectivity. In this case, the molecular ion of each PAH was<br />
isol<strong>at</strong>ed and then further fragmented by collision-induced disassoci<strong>at</strong>ion where resonant<br />
45
excit<strong>at</strong>ion was used to impart energy to the ions. The resonant excit<strong>at</strong>ion energy was<br />
optimized for each PAH to produce the maximum abundance of secondary ions.<br />
Identific<strong>at</strong>ion and quantific<strong>at</strong>ion was conducted using the product ions, which typically<br />
consisted of the loss of H 2 from the molecular ion.<br />
Quantific<strong>at</strong>ion was conducted by a six-point calibr<strong>at</strong>ion curve for each class of<br />
chemicals. If a field sample had a concentr<strong>at</strong>ion th<strong>at</strong> exceeded the calibr<strong>at</strong>ion curve, then<br />
the sample was diluted 10-fold and re-analyzed to bring the response within the<br />
calibr<strong>at</strong>ion curve. For the n-alkanes, we only had authentic standards of C 16 , C 24 , C 30 ,<br />
and C 36 n-alkanes. The other alkanes between C 20 and C 35 are tent<strong>at</strong>ively identified by<br />
their mass spectra and their retention time sequence. Quantific<strong>at</strong>ion assumed the same<br />
rel<strong>at</strong>ive response as the nearest authentic standard, which may cre<strong>at</strong>e a minor bias in<br />
calibr<strong>at</strong>ion. In the case of the acids and sugars, the calibr<strong>at</strong>ion curve was deriv<strong>at</strong>ized<br />
alongside the samples to keep the deriv<strong>at</strong>iz<strong>at</strong>ion time and conditions identical to the field<br />
samples. Pyrene-d 10 was used as the injection standard for all analyses. The other<br />
labeled compounds added to the sample before extraction were used to determine the<br />
extraction efficiency of the analytical method. The d<strong>at</strong>a are not corrected for extraction<br />
efficiencies of the analytes. All final concentr<strong>at</strong>ion d<strong>at</strong>a are rounded to two significant<br />
digits of accuracy.<br />
The results provide size-resolved PAH and alkane d<strong>at</strong>a from downwind of the<br />
<strong>Roseville</strong> <strong>Railyard</strong>. The important aspect of this research is determine the PAH<br />
concentr<strong>at</strong>ions in the aerosol size fractions th<strong>at</strong> can penetr<strong>at</strong>e into the deep lung, and thus<br />
represent the gre<strong>at</strong>est exposure hazard. This is particularly important for the rail yard<br />
since the emissions from locomotive engines have not been well characterized in terms of<br />
the size of the particul<strong>at</strong>e m<strong>at</strong>ter emitted, thus we need to determine the size distribution<br />
of the aerosols and the associ<strong>at</strong>ed PAHs to assess the potential health effects.<br />
3. Results for Organic Constituents<br />
Recoveries of isotopically labeled compounds from samples<br />
One of the best measures of the efficacy of an analytical method is the recovery of<br />
isotopically labeled surrog<strong>at</strong>e compounds to the samples. Since the isotopically labeled<br />
compounds have a different mass from the “n<strong>at</strong>ive” analytes, they do not interfere with<br />
the analytes in the samples. However, the isotopically labeled analytes have the same<br />
chemical properties and behavior as the n<strong>at</strong>ive analytes. Therefore a good recovery of<br />
the labeled surrog<strong>at</strong>e compounds from the samples gives a high degree of confidence th<strong>at</strong><br />
the n<strong>at</strong>ive analytes were also effectively extracted.<br />
A series of 9 labeled surrog<strong>at</strong>e compounds were added to all samples and blanks.<br />
The recoveries of these labeled compounds were generally good to acceptable (Table 6).<br />
Phenanthrene had the lowest recovery of any of the PAHs <strong>at</strong> 54.6%, but this was<br />
expected since phenanthrene is a semi-vol<strong>at</strong>ile PAH and could easily evapor<strong>at</strong>e from the<br />
samples during processing. The recoveries of all of the heavier PAHs and the two<br />
n-alkanes were good. Only two organic acids were utilized in this. Benzoic acid showed<br />
118.5% recovery, which suggests th<strong>at</strong> the spiking solution may have been inaccur<strong>at</strong>ely<br />
46
measured. Succinic acid (AKA butanedioic acid) showed a poor recovery partly due to<br />
the low response of the instrument to this compound. In the future, long chain alkanoic<br />
acids (e.g. octadecanoic acid) should be added to the surrog<strong>at</strong>e solution mixture since<br />
they were the most abundant organic acids detected and their chemistry is significantly<br />
different from the benzoic and succinic acid surrog<strong>at</strong>es th<strong>at</strong> were utilized.<br />
Table 6. Average recovery (%) of isotopically labeled compounds to all the samples and<br />
blanks (n = 27)<br />
Recovery (%)<br />
Compound<br />
n-alkanes<br />
n-tetracosane-d 50 (C 24 ) 71.0<br />
n-hex<strong>at</strong>riacontane-d 74 (C 36 ) 73.0<br />
PAHs<br />
phenanthrene-d 10 54.6<br />
chrysene-d 12 76.9<br />
benzo[k]fluoranthene-d 12 74.1<br />
benzo[g,h,i]perylene-d 12 86.9<br />
acids<br />
benzoic-d 6 acid 118.5<br />
succinic- 13 C 2 acid 50.5<br />
Based on the recovery d<strong>at</strong>a of the labeled surrog<strong>at</strong>es from all the sample m<strong>at</strong>rices<br />
(aluminum foil and quartz filters), it appears th<strong>at</strong> the analytical method was effective for<br />
the heavier PAHs, n-alkanes and some of the organic acids. The d<strong>at</strong>a reported herein has<br />
not been corrected using the above recovery d<strong>at</strong>a, so we would anticip<strong>at</strong>e th<strong>at</strong> there is<br />
approxim<strong>at</strong>ely a ± 30% error for most of the chemicals.<br />
a. Polycyclic arom<strong>at</strong>ic hydrocarbons (PAHs)<br />
The results from the PAH analysis clearly showed high concentr<strong>at</strong>ions of PAHs in<br />
the particul<strong>at</strong>e m<strong>at</strong>ter (Table 7) with the majority of the PAH mass being collected in the<br />
ultra-fine stage (0.26 to 0.09 µm) and the afterfilter (Figure 43). The presence of PAHs<br />
in the ultra-fine size fraction corresponds well to previous observ<strong>at</strong>ions of PAHs in diesel<br />
emissions (Zielinska et al, 2004; Gertler et al, 2002). The presence of a strong marker for<br />
fresh diesel emissions was expected.<br />
Note th<strong>at</strong> the Lundgren sampler was only oper<strong>at</strong>ed <strong>at</strong> night when the air is coming<br />
from the rail yard, thus it has higher concentr<strong>at</strong>ions. For this reason, the 8 DRUM results<br />
are scaled by a factor 2.57 to account for PAHs only <strong>at</strong> night (from the NO r<strong>at</strong>ios of<br />
Figure 2.a, x 2.0) and the r<strong>at</strong>io of EC, 1.4 (Table 3, x 1.29) to allow better comparison to<br />
the Lundgren d<strong>at</strong>a. This amounts essentially to an assumption th<strong>at</strong> all PAHs come from<br />
the rail yard on night winds.<br />
47
Table 7. Concentr<strong>at</strong>ions (pg/m 3 ) of particul<strong>at</strong>e PAHs observed <strong>at</strong> the <strong>Roseville</strong> Rail Yard<br />
in the summer of 2005.<br />
Compound<br />
8-stage<br />
DRUM<br />
(8/5 - 9/27)<br />
8-stage<br />
DRUM<br />
(scaled x 2.6)<br />
Early<br />
Lundgren<br />
(9/27 - 10/7)<br />
L<strong>at</strong>e<br />
Lundgren<br />
(10/7 -10/17)<br />
(8/5 - 9/27)<br />
Phenanthrene 21 55 110 100<br />
Anthracene
The presence of the PAHs in the ultra-fine stage indic<strong>at</strong>es th<strong>at</strong> the diesel source<br />
was close to the sampler since the particul<strong>at</strong>es had not coagul<strong>at</strong>ed into larger particles,<br />
which also suggests th<strong>at</strong> the source of the particul<strong>at</strong>es was the rail yard.<br />
The PAH results from the Lundgren sampler also support these observ<strong>at</strong>ions.<br />
This sampler was only oper<strong>at</strong>ed during the nighttime hours when the local meteorology<br />
brings a weak down-slope breeze across the rail yard and to the sampling site. Therefore,<br />
the higher concentr<strong>at</strong>ions observed by this sampler were expected and support the<br />
assertion th<strong>at</strong> they are coming from the site. The air concentr<strong>at</strong>ions were approxim<strong>at</strong>ely 4<br />
times higher than the 8-stage DRUM, which appears to be the result of the 8-stage<br />
DRUM samples being “diluted” by the daytime sampling th<strong>at</strong> lacked any rail yard<br />
influence (Figure 3 a, x 2) and the increasing mass in the fall periods (x 1.28). The<br />
combin<strong>at</strong>ion of these factors give a multiplic<strong>at</strong>ive factor of 2.57, which is presented in the<br />
tables. Inversions become more common in fall and winter, raising the very fine mass<br />
from a value of 2.25 µg/m 3 in summer (DRUM sages 7 + 8, 0.34 to 0.09 µm) to 6.6<br />
µg/m 3 measured in February, 2006, using identical equipment. Thus, the Lundgren<br />
samplers were collecting in periods th<strong>at</strong> would tend to have higher masses <strong>at</strong> the Denio<br />
site. In summary, the mass differences in organic m<strong>at</strong>ter from the summer 8 DRUM<br />
samplers and the fall night-only Lundgren samplers are consistent.<br />
The PAHs from the locomotive diesel engines showed a very different trend in<br />
terms of the PAH profile compared to diesel engines used in trucks and other on-road<br />
applic<strong>at</strong>ions. The PAH profile from the locomotives had considerably more of the heavy<br />
PAHs with molecular weights gre<strong>at</strong>er than 252 compared to the on-road diesel trucks and<br />
the NIST standard reference m<strong>at</strong>erials (Figure 43). This trend was observed with all<br />
three samples collected, namely the 8-stage DRUM and both of the Lundgren samples.<br />
The higher proportion of the high molecular weight PAHs of locomotive emission<br />
may affect the overall toxicity of these emission compared to smaller diesel engines since<br />
the larger PAHs classes include some of the more toxic PAHs such as benzo{a}pyrene.<br />
Therefore, the standard cancer assessment based on diesel truck particul<strong>at</strong>e mass may be<br />
biased on the low side. While it appears th<strong>at</strong> the locomotive emissions have a higher<br />
proportion of heavier PAHs, it is unclear from these d<strong>at</strong>a whether the PAHs are arising<br />
from the large-bore engine technology, the locomotive fuel, which is different from the<br />
diesel fuel used in trucks, or the lubric<strong>at</strong>ing oils.<br />
49
Fraction of total PAH mass<br />
0.6<br />
0.5<br />
0.4<br />
0.3<br />
0.2<br />
0.1<br />
0.0<br />
0.6<br />
<strong>Roseville</strong> Rail Yard<br />
8-stage DRUM<br />
Early Lundgren<br />
L<strong>at</strong>e Lundgren<br />
* * *<br />
178 202 228 252 276+278 300<br />
Fraction of total PAH mass<br />
0.5<br />
0.4<br />
0.3<br />
0.2<br />
0.1<br />
Published PAH Profiles<br />
SRM 2975<br />
SRM 1650a<br />
DRI truck<br />
0<br />
178 202 228 252 276+278 300<br />
PAH molecular mass<br />
Figure 43. Profiles of PAHs as a function of molecular mass from the <strong>Roseville</strong> rail yard<br />
and the liter<strong>at</strong>ure.<br />
The molecular mass of benzo{a}pyrene is 252. Note th<strong>at</strong> the molecular profile of<br />
the 8 DRUM (summer) and the Lundgren sampler (fall) are essentially identical. The<br />
“228” values in the <strong>Roseville</strong> samples are an underestim<strong>at</strong>e since we could not quantify<br />
benz{a}anthracene due to an analytical problem.<br />
One possible explan<strong>at</strong>ion for different PAH profiles is th<strong>at</strong> the lighter PAHs could<br />
“blow-off” of the sample during the long sample collection periods. We do not believe<br />
this to be a significant effect since the “early” and “l<strong>at</strong>e” Lundgren samples had almost<br />
the identical profiles, yet the “early” samples were in the sampler for a week and a half<br />
50
longer than the “l<strong>at</strong>e” samples. If blow-off was significant, then we would expect the<br />
samples exposed to the air stream for a longer period of time to have lower proportions of<br />
the lighter (178 and 202 amu) PAHs. This was not observed. Furthermore, the 8-stage<br />
DRUM sampler collected m<strong>at</strong>erial for 6 weeks, and its profile is likewise very similar to<br />
the Lundgren samples th<strong>at</strong> were only 1.5 weeks in dur<strong>at</strong>ion and only oper<strong>at</strong>ed <strong>at</strong> night.<br />
Therefore, the PAH profile does not appear to be the result of “blow-off” during sample<br />
collection.<br />
b. Alkanes:<br />
The second class of chemicals investig<strong>at</strong>ed was the alkanes and rel<strong>at</strong>ed<br />
hydrocarbons. Unlike the PAHs, there were appreciable alkanes in the field blanks, but<br />
the concentr<strong>at</strong>ion of alkanes were generally low enough not to interfere with the<br />
quantific<strong>at</strong>ion of the alkanes (Table 8).<br />
Table 8. Concentr<strong>at</strong>ions (ng/m 3 ) of particul<strong>at</strong>e n-alkanes observed <strong>at</strong> the <strong>Roseville</strong> Rail<br />
Yard in the summer of 2005.<br />
Compound<br />
8-stage<br />
DRUM<br />
(8/5 to 9/27)<br />
8-stage<br />
DRUM<br />
(8/5 to 9/27)<br />
Early<br />
Lundgren<br />
(9/27 to 10/7)<br />
L<strong>at</strong>e<br />
Lundgren<br />
(10/7 to<br />
10/17)<br />
(scaled x 2.6)<br />
C 20 n-alkane 0.25 0.64 1.1 1.0<br />
C 21 n-alkane 0.50 1.29 2.1 1.7<br />
C 22 n-alkane 0.42 1.08 3.6 2.8<br />
C 23 n-alkane 0.94 2.42 5.2 4.0<br />
C 24 n-alkane 1.3 3.34 2.8 1.5<br />
C 25 n-alkane 2.5 6.43 7.5 5.8<br />
C 26 n-alkane 2.8 7.11 7.6 5.7<br />
C 27 n-alkane 4.4 11.3 10 7.5<br />
C 28 n-alkane 4.5 11.6 9.4 4.2<br />
C 29 n-alkane 9.4 24.2 17 11<br />
C 30 n-alkane 5.7 14.7 11 3.8<br />
C 31 n-alkane 8.6 22.1 13 5.9<br />
C 32 n-alkane 4.2 10.6 7.0 0.5<br />
C 33 n-alkane 4.2 10.8 6.4 1.3<br />
C 34 n-alkane 1.4 3.6 2.7 < MQL<br />
C 35 n-alkane 0.76 1.95 1.9 < MQL<br />
C 36 n-alkane 0.94 2.42 1.3 < MQL<br />
Total<br />
alkanes<br />
Undifferenti<strong>at</strong>ed<br />
hydrocarbon<br />
identified<br />
53 140 110 55<br />
210 540 530 450<br />
Note th<strong>at</strong> the Lundgren sampler was only oper<strong>at</strong>ed <strong>at</strong> night when the air is coming<br />
from the rail yard. The “undifferenti<strong>at</strong>ed hydrocarbon envelope” represents the<br />
51
integr<strong>at</strong>ion of m/z 57 (C 4 H 9 ) between the C 20 and C 39 n-alkanes where the mass<br />
calibr<strong>at</strong>ion was based on the n-alkane standards.<br />
Both the 8-stage DRUM and the Lundgren samples showed th<strong>at</strong> the C 29 n-alkane<br />
was the most abundant chemical observed with concentr<strong>at</strong>ions in 9 to 17 ng/m 3 . Unlike<br />
the PAH d<strong>at</strong>a, the concentr<strong>at</strong>ions of alkanes were different between the early and the l<strong>at</strong>e<br />
Lundgren samples with the early sample having concentr<strong>at</strong>ion th<strong>at</strong> were almost twice as<br />
high as the l<strong>at</strong>e sample. The 8-stage and early Lundgren samples had no clear p<strong>at</strong>tern of<br />
odd-even carbon number species. This would suggest a petroleum source of the<br />
hydrocarbons. However, the l<strong>at</strong>e Lundgren sample had a clear preference for oddnumber<br />
hydrocarbons, particularly for the heavier alkanes. This p<strong>at</strong>tern would suggest a<br />
biological source for the hydrocarbon r<strong>at</strong>her than a petroleum source. The lower alkane<br />
concentr<strong>at</strong>ions and the odd-length chain bias suggests th<strong>at</strong> there was a background<br />
biogenic source of hydrocarbons on which the rail yard emissions are superimposed.<br />
In addition to the specific n-alkanes th<strong>at</strong> were identified and quantified, there was<br />
a large “envelope” of undifferenti<strong>at</strong>ed hydrocarbons th<strong>at</strong> approxim<strong>at</strong>ely eluted between<br />
C 23 and C 39 n-alkanes (Figure 44). This undifferenti<strong>at</strong>ed hydrocarbon envelope was<br />
integr<strong>at</strong>ed by selecting only m/z ion 57, which corresponds to C 4 H 9 fragment between the<br />
C 20 and C 39 n-alkanes where the mass calibr<strong>at</strong>ion was based on the n-alkane standards.<br />
As a double-check, ion 85 (C 6 H 15 ), which is another common ion from s<strong>at</strong>ur<strong>at</strong>ed alkane<br />
chains, was also selected and integr<strong>at</strong>ed. The results agreed between the two methods<br />
within 10%, thus giving a reasonable degree of confidence in the identific<strong>at</strong>ion of the<br />
“envelope” as mostly alkanes. It should also be noted th<strong>at</strong> this extract was the toluene<br />
extract from the samples, thus non-polar constituents would be removed from the<br />
aerosols but not the more polar chemicals. This further contributes to the confidence in<br />
the identific<strong>at</strong>ion. The estim<strong>at</strong>ed mass of the undifferenti<strong>at</strong>ed alkane envelope was 210<br />
ng/m 3 for the 8-stage DRUM sampler while it was 530 and 450 ng/m 3 in the early and<br />
l<strong>at</strong>e Lundgren sampler. The identified n-alkanes represented anywhere between 12 and<br />
25% of the undifferenti<strong>at</strong>ed hydrocarbon envelope. The undifferenti<strong>at</strong>ed alkane envelope<br />
showed interesting trends as a function of particle size (Figure 45). The highest<br />
concentr<strong>at</strong>ions were found on the afterfilter followed by the 2.5 to 1.15 and the 1.15 to<br />
0.75 µm size fraction. This differs from the PAH results since the PAHs lacked the<br />
rel<strong>at</strong>ively high concentr<strong>at</strong>ions in the accumul<strong>at</strong>ion mode. The presence of the alkanes in<br />
the accumul<strong>at</strong>ion mode in the absence of PAHs suggest th<strong>at</strong> there is a separ<strong>at</strong>e source of<br />
these undifferenti<strong>at</strong>ed hydrocarbons in addition to diesel combustion emissions.<br />
52
kCounts<br />
8-DRUM stage 3<br />
(2.5 to 1.15 µm)<br />
Ion: 57 all alkane, 8dr3, 11-18-2005.sms<br />
700<br />
600<br />
500<br />
400<br />
300<br />
200<br />
100<br />
Phthal<strong>at</strong>e ester (DEHP)<br />
C 29 C 31<br />
C 27 C 28 C 26 C 25 C 24 C 23 C 22 C C 21 20<br />
C 32 C C 33 30 C 34 C 35 C 36 C 37 C 38 C 39<br />
0<br />
Integr<strong>at</strong>ion range for undifferenti<strong>at</strong>ed alkane “envelope”<br />
30 40 50 60 70 minutes<br />
Figure 44. A selected ion chrom<strong>at</strong>ogram of m/z 57 showing the undifferenti<strong>at</strong>ed<br />
hydrocarbon “envelope”. The n-alkanes are labeled by their carbon number.<br />
53
120.0<br />
Undifferenti<strong>at</strong>ed hydrocarbon<br />
concentr<strong>at</strong>ions (ng/m 3 )<br />
100.0<br />
80.0<br />
60.0<br />
40.0<br />
20.0<br />
0.0<br />
10 to<br />
5um<br />
5 to<br />
2.5um<br />
2.5 to<br />
1.15um<br />
1.15 to<br />
0.75um<br />
0.75 to<br />
0.56um<br />
Size fraction<br />
0.56 to<br />
0.34um<br />
0.34 to<br />
0.26um<br />
0.26 to<br />
0.09um<br />
filter<br />
(
60<br />
Pecent of chemical on filter<br />
50<br />
40<br />
30<br />
20<br />
10<br />
0<br />
20 25 30 35 40<br />
Alkane carbon number<br />
Figure 46. The fraction of n-alkanes collected on the after filter of the 8-stage DRUM.<br />
The C 33 to C 36 alkanes were not detected on the filter.<br />
c. Organic acids<br />
The particul<strong>at</strong>e-associ<strong>at</strong>ed organic acids were domin<strong>at</strong>ed by the long-chain<br />
alkanoic acids (Table 9) and hexadecanoic and octadecanoic acids in particular. The high<br />
abundance of these two acids strongly suggests a biological source for this particul<strong>at</strong>e<br />
m<strong>at</strong>ter. This biological source can be either suspended bio-aerosols (pollen, microbes,<br />
spores, etc.) or biomass combustions (e.g. wood smoke). Another potential source would<br />
be cooking oil th<strong>at</strong> may have been used <strong>at</strong> the nearby farmer’s market. However, the<br />
presence of these acids combined with the effective absence of adjacent odd-number<br />
chain-length acids implies a non-petroleum source of this organic m<strong>at</strong>ter th<strong>at</strong> is not<br />
associ<strong>at</strong>ed with the rail yard.<br />
55
Table 9. Concentr<strong>at</strong>ions (ng/m 3 ) of particul<strong>at</strong>e organic acids observed <strong>at</strong> the <strong>Roseville</strong><br />
Rail Yard in the summer of 2005. Note th<strong>at</strong> the Lundgren sampler was only oper<strong>at</strong>ed <strong>at</strong><br />
night when the air is coming from the rail yard.<br />
Compound<br />
8-stage<br />
DRUM<br />
(8/5 to 9/27)<br />
8-stage<br />
DRUM<br />
(8/5 to 9/27)<br />
(scaled x 2.6)<br />
Early<br />
Lundgren<br />
(9/27 to 10/7)<br />
L<strong>at</strong>e<br />
Lundgren<br />
(10/7 to<br />
10/17)<br />
Decanoic acid < MQL < MQL < MQL < MQL<br />
Undecanoic acid 2.2 5.7 < MQL < MQL<br />
Dodecanoic acid 0.09 0.23 < MQL < MQL<br />
Tridecanoic acid 0.63 1.62 < MQL < MQL<br />
Tetradecanoic acid 0.43 1.11 < MQL < MQL<br />
Pentadecanoic acid 0.72 1.85 < MQL < MQL<br />
Hexadecanoic acid 4.6 11.8 7.7 8.4<br />
Heptadecanoic acid 0.30 0.66 0.51 0.46<br />
Octadecanoic acid 4.6 10.1 7.6 7.7<br />
Nonadecanoic acid 0.05 0.13 0.08 < MQL<br />
9-octadecenoic acid;<br />
0.70 1.80 0.79 < MQL<br />
(oleic acid)<br />
Butanedioic acid 1.6 4.1 5.1 5.5<br />
Pentanedioic acid 0.65 1.67 1.4 1.5<br />
Hexanedioic acid 1.3 3.34 0.41 0.41<br />
Heptanedioic acid 0.23 0.59 0.74 0.77<br />
Octanedioic acid 0.53 1.36 3.8 4.8<br />
Nonanedioic acid 0.98 2.52 3.0 3.3<br />
Decanedioic acid 0.05 0.13 0.61 0.63<br />
2,3-hydroxybutanedioic 0.61 1.57 3.3 3.4<br />
2-methyl-2-butenedioic < MQL < MQL 0.21 < MQL<br />
acid<br />
Cis-pinonic acid < MQL < MQL < MQL < MQL<br />
Pinic acid 0.10 0.26 4.0 3.6<br />
Trans-norpinic acid < MQL < MQL < MQL < MQL<br />
Sum of acids 20 51 40 42<br />
The scaling factor for night-time only emissions for RRAMP sources is not<br />
necessarily true for these acids. Thus, the agreement (or lack thereof) between the scaled<br />
d<strong>at</strong>a and the night only Lundgren d<strong>at</strong>a is just another tool to identify sources. However,<br />
there are a number of cases for which the scaling makes the DRUM 24 hour d<strong>at</strong>a agree<br />
better with the nighttime only Lundgren d<strong>at</strong>a, hinting <strong>at</strong> a mixture of biogenic and<br />
anthropogenic sources. 0<br />
The concentr<strong>at</strong>ions of the predominant organic acids as a function of aerosol size<br />
further supports the identific<strong>at</strong>ion of these chemicals as having a biological source<br />
(Figure 47). Octadecanoic acid was only found in the larger size fractions gre<strong>at</strong>er than<br />
0.75µm and the afterfilter. Additionally, there was appreciable mass in the largest size<br />
56
fraction between 5 and 10 µm, which is typically the domain of suspended dust.<br />
Therefore, these largest particles simply contain biological m<strong>at</strong>erials as part of the<br />
ambient dust. The hexadecanoic and octadecanoic acids were effectively absent from the<br />
fine particul<strong>at</strong>e sizes, except for the afterfilter, thus implying th<strong>at</strong> combustion probably<br />
was not a significant source of these acids.<br />
Particul<strong>at</strong>e concentr<strong>at</strong>ions (ng/m 3 )<br />
3.0<br />
2.5<br />
2.0<br />
1.5<br />
1.0<br />
0.5<br />
octadecanoic acid<br />
hexadecanoic acid<br />
9-octadecenoic (oleic) acid<br />
0.0<br />
10 to 5um 5 to<br />
2.5um<br />
2.5 to<br />
1.15um<br />
1.15 to<br />
0.75um<br />
0.75 to<br />
0.56um<br />
Size fraction<br />
0.56 to<br />
0.34um<br />
0.34 to<br />
0.26um<br />
0.26 to<br />
0.09um<br />
filter<br />
(
Table 10. Concentr<strong>at</strong>ions (ng/m 3 ) of particul<strong>at</strong>e sugars observed <strong>at</strong> the <strong>Roseville</strong> Rail<br />
Yard in the summer of 2005.<br />
Compound<br />
8-stage DRUM<br />
(8/5 to 9/27)<br />
Early Lundgren<br />
(9/27 to 10/7)<br />
L<strong>at</strong>e Lundgren<br />
(10/7 to 10/17)<br />
Methyl-B-L-arabinopyranoside < MQL < MQL < MQL<br />
D-arabitol 1.5 3.2 2.9<br />
Levoglucosan 2.2 9.7 12<br />
Fructose 2.6 3.2 3.4<br />
Glucose 3.7 5.2 4.8<br />
Mannitol 2.0 3.3 3.2<br />
Inositol 0.32 0.50 0.52<br />
Sucrose 7.3 5.2 5.7<br />
2-methylthreitol 0.60 0.60 0.73<br />
2-methylerythritol 1.9 1.8 2.2<br />
Seven of the eight sugars for which we had standards were detected in the 8-stage<br />
DRUM sampler. Sucrose was the most abundant sugar (7.3 ng/m 3 ) followed by glucose<br />
(3.7 ng/m 3 ). The high concentr<strong>at</strong>ions of refined table sugar (sucrose) implies th<strong>at</strong> the<br />
some of the aerosols were gener<strong>at</strong>ed from cooking <strong>at</strong> the “farmer’s market” nearby. The<br />
mass of sucrose was gre<strong>at</strong>er than either of the most abundant organic acids and<br />
comparable to the single most abundant n-alkane, which emphasizes the importance of a<br />
thorough organic chemical assessment including species th<strong>at</strong> were not anticip<strong>at</strong>ed to be<br />
important emissions from the rail depot. While the presence of sucrose suggests a source<br />
of the aerosols, the notable absence of levoglucosan effectively elimin<strong>at</strong>es biomass<br />
burning as an appreciable source of the aerosol. These samples were collected in the l<strong>at</strong>e<br />
summer when home he<strong>at</strong>ing by fireplaces is non-existent and agricultural burning had not<br />
yet commenced, so these results, which are very low rel<strong>at</strong>ive to other published values,<br />
make intuitive sense. It also suggests th<strong>at</strong> the high concentr<strong>at</strong>ions of the hexadecanoic<br />
and octadecanoic acids are the result of primary biogenic origin r<strong>at</strong>her than biomass<br />
combustion.<br />
The size distribution for the sugars showed the highest mass loading in the largest<br />
size fraction (Figure 48). This size distribution suggests th<strong>at</strong> the sugars are present in<br />
larger aerosols th<strong>at</strong> may have been mechanically gener<strong>at</strong>ed. Once again, this indic<strong>at</strong>es<br />
th<strong>at</strong> they had been formed <strong>at</strong> the “farmer’s market” and the associ<strong>at</strong>ed cooking activities<br />
<strong>at</strong> th<strong>at</strong> site. The high concentr<strong>at</strong>ion of the sugars may also be indic<strong>at</strong>ive of soil microbes<br />
since many of the sugars are used in metabolic processes. Thus, the profile of the sugars<br />
could also indic<strong>at</strong>e th<strong>at</strong> the re-suspended dust from a biological origin. There is a<br />
livestock auction building very close to the Denio’s site th<strong>at</strong> would be a potential<br />
candid<strong>at</strong>e for this type of biologically-rich dust.<br />
58
Particul<strong>at</strong>e concentr<strong>at</strong>ions (ng/m 3 )<br />
2.5<br />
2.0<br />
1.5<br />
1.0<br />
0.5<br />
sucrose<br />
glucose<br />
0.0<br />
10 to 5um 5 to<br />
2.5um<br />
2.5 to<br />
1.15um<br />
1.15 to<br />
0.75um<br />
0.75 to<br />
0.56um<br />
Size fraction<br />
0.56 to<br />
0.34um<br />
0.34 to<br />
0.26um<br />
0.26 to<br />
0.09um<br />
Figure 48. Sucrose and glucose concentr<strong>at</strong>ions (ng/m 3 ) as a function of aerosol size.<br />
filter<br />
(
PAHs<br />
Organic acids<br />
Sugars and polyols<br />
Identified alkanes<br />
8-stage DRUM<br />
Early Lundgren<br />
L<strong>at</strong>e Lundgren<br />
Figure 49 Fraction of the identified organic mass belonging to the four different classes<br />
of chemicals identified.<br />
60
The next aerosol composition calcul<strong>at</strong>ion <strong>at</strong>tempts to reconstruct the total aerosol<br />
mass, as measured by beta-gauge, from the known elemental and organic constituents<br />
(Figure 50). For this calcul<strong>at</strong>ion, the elements of Al, Si, Ca, Ti, Mn, and Fe are assumed<br />
to be in their oxide st<strong>at</strong>es th<strong>at</strong> are common of the crustal m<strong>at</strong>erials. This roughly doubles<br />
the weight of each of these elements. Sulfur is assumed to be in the sulf<strong>at</strong>e form, which<br />
results in the sulfur contribution to aerosol mass to be 4.125 times sulfur. (Malm et al,<br />
1994) The elements (and assumed elemental oxides) are summed for each size fraction<br />
of the 8-stage DRUM sampler.<br />
10.0<br />
9.0<br />
8.0<br />
Mass by beta gauge<br />
Sum of S-XRF elements and oxides<br />
Average mass (ug/m 3 )<br />
7.0<br />
6.0<br />
5.0<br />
4.0<br />
3.0<br />
2.0<br />
1.0<br />
0.0<br />
10 to 5um 5 to 2.5um 2.5 to<br />
1.15um<br />
1.15 to 0.75 to<br />
0.75um 0.56um<br />
Size fraction<br />
0.56 to<br />
0.34um<br />
0.34 to<br />
0.26um<br />
0.26 to<br />
0.09um<br />
Figure 50. Mass of aerosols as determined by beta gauge and by the sum of the elements<br />
and oxides as determined by S-XRF.<br />
The results (Figure 49) showed th<strong>at</strong> the elemental mass was the largest fraction of<br />
the aerosol mass in the coarse stages and then the importance of elemental mass declines<br />
with the smaller size fractions. In the largest size fraction, the estim<strong>at</strong>ed elemental<br />
contribution to total aerosol mass exceeded the beta-gauge measured mass, but this is<br />
probably the result of the addition of many separ<strong>at</strong>e elemental measurements to<br />
determine the S-XRF elements and oxides. In all cases, the contribution of organic<br />
chemicals to the total mass measured by beta-gauge was rel<strong>at</strong>ively minor. Stage 4 (1.8%)<br />
and stage 8 (1.6%) had the gre<strong>at</strong>est contributions, mostly due to the “undifferenti<strong>at</strong>ed<br />
alkane envelope” (Figure 51). The remaining mass was <strong>at</strong>tributed as “unknown”.<br />
Although it was not measured, we would expect elemental carbon to make up a<br />
considerable fraction of the unknown mass since the samples were a dark black color th<strong>at</strong><br />
is typical of elemental carbon. Also, the fraction of the unknown mass was larger in the<br />
finer size fractions th<strong>at</strong> would be combustion processes and diesel.<br />
61
Stage 3 Elements<br />
Alkanes<br />
Organic acids<br />
and sugars<br />
Stage 4<br />
Unknown<br />
Stage 5 Stage 6<br />
Stage 7 Stage 8<br />
Figure 51. Composition of aerosol mass as determined by beta-gauge.<br />
62
1. Comparisons to diesel truck d<strong>at</strong>a<br />
The rel<strong>at</strong>ive distribution of PAHs into heavier and more toxic modes, as shown in<br />
Figure 43 (repe<strong>at</strong>ed below), is not by itself adequ<strong>at</strong>e to determine impacts from <strong>Roseville</strong><br />
rail yard aerosols.<br />
Fraction of total PAH mass<br />
0.6<br />
0.5<br />
0.4<br />
0.3<br />
0.2<br />
0.1<br />
0.0<br />
0.6<br />
<strong>Roseville</strong> Rail Yard<br />
8-stage DRUM<br />
Early Lundgren<br />
L<strong>at</strong>e Lundgren<br />
* * *<br />
178 202 228 252 276+278 300<br />
Fraction of total PAH mass<br />
0.5<br />
0.4<br />
0.3<br />
0.2<br />
0.1<br />
Published PAH Profiles<br />
SRM 2975<br />
SRM 1650a<br />
DRI truck<br />
0<br />
178 202 228 252 276+278 300<br />
PAH molecular mass<br />
Figure 43. Profiles of PAHs as a function of molecular mass from the <strong>Roseville</strong> rail yard<br />
and the liter<strong>at</strong>ure.<br />
It is also necessary to determine the mass of PAHs in the aerosols, and/or the r<strong>at</strong>io as a<br />
fraction of total aerosol mass, fine mass, and/or elemental carbon, to allow estim<strong>at</strong>es of<br />
aerosols impacts, The most direct way is to form the r<strong>at</strong>io of PAHs to the major diesel<br />
aerosol component, elemental carbon. This is not available from the NIST diesel SRM<br />
1650a and SRM 2975, but these d<strong>at</strong>a are available from the Desert Research Institute<br />
Report to the N<strong>at</strong>ional Renewable Energy Labor<strong>at</strong>ory, 2004. (Zielinska et al, 2004). An<br />
63
additional source is from the work of Gertler <strong>at</strong> al (2004) in a report to the Health Effects<br />
Institute and public<strong>at</strong>ions (Gertler et al, 2002, Gertler et al, 2004). For the <strong>Roseville</strong> d<strong>at</strong>a,<br />
elemental carbon was measured <strong>at</strong> the Denio and Pool sites through October, 2005.<br />
In addition, during the summer, very fine mass was also measured <strong>at</strong> the Denio<br />
and Pool sites, allowing a comparison to size resolved d<strong>at</strong>a in Zielinska et al 2004. These<br />
d<strong>at</strong>a can be further sorted by total m<strong>at</strong>erial <strong>at</strong> the Denio site, and the difference between<br />
the Pool and Denio sites. These estim<strong>at</strong>es are necessary because no upwind-downwind<br />
organic measurements were taken. Combining the d<strong>at</strong>a on Table 1 for elemental carbon<br />
(EC) and Table 8 for benzo{a}pyrene, we can form r<strong>at</strong>ios th<strong>at</strong> can be compared to<br />
liter<strong>at</strong>ure values, rail yard d<strong>at</strong>a to trucks.<br />
These calcul<strong>at</strong>ions have been done in Table 11.<br />
There are three columns of results, the first being for very fine/ultra fine mass,<br />
and the second and third for elemental carbon (EC).<br />
Using only mass d<strong>at</strong>a to form the r<strong>at</strong>io, we suffer from the uncertainty as to how<br />
one accounts for the < 0.09 µm components not measured by the DELTA 8 DRUM. The<br />
first mass values in Table 11 assume th<strong>at</strong> there is negligible mass below 0.09 µm<br />
diameter, which is unrealistic and gives a high r<strong>at</strong>io, 12.7<br />
The next two measures use estim<strong>at</strong>es of the missing sub–0.09 µm estim<strong>at</strong>ed from<br />
the difference of the RRAMP PM 2.5 and the measured DRUM masses, and an estim<strong>at</strong>e<br />
using the r<strong>at</strong>io observed for diesel trucks in Zielinska et al 2004. Using only the mass<br />
d<strong>at</strong>a, we obtain a mean RRAMP/truck r<strong>at</strong>io 7.5 ± 4.0.<br />
However, in the final analysis, we drop the unrealistic highest r<strong>at</strong>io, 12.7, and<br />
arrive <strong>at</strong> a mean mass r<strong>at</strong>io of 4.8 ± 2.7.<br />
Considerably more d<strong>at</strong>a exist th<strong>at</strong> allow us to form a r<strong>at</strong>io to elemental carbon<br />
(EC) the largest single component of diesel exhaust by mass. These d<strong>at</strong>a were compared<br />
with liter<strong>at</strong>ure emission r<strong>at</strong>es of benzo{a}pyrene derived from both labor<strong>at</strong>ory studies<br />
(Zielinska et al, 2004) and on-roadway tunnel studies (Gertler et al, 2002). R<strong>at</strong>ios were<br />
derived elemental carbon (EC), for the DELTA 8 DRUM in summer, and two Lungdren<br />
impactors in fall. Finally, we used both total EC <strong>at</strong> the Denio site and the EC difference,<br />
Denio to Pool site. This gener<strong>at</strong>ed 15 different r<strong>at</strong>ios based on the method used.<br />
64
Table 11 Comparison of RRAMP Benzo{a}pyrene results to liter<strong>at</strong>ure values for diesel<br />
trucks, in a highway tunnel (Gertler et al, 2002) and in the labor<strong>at</strong>ory (Zielinska et al,<br />
2004. The most precise values for the rail yard/truck r<strong>at</strong>ios are in bold type.<br />
RRAMP – Denio site Period R<strong>at</strong>io –<br />
vf/uf mass<br />
labor<strong>at</strong>ory<br />
8 DRUM – very fine mass 7/21 – 12.7<br />
8/17<br />
8 DRUM – vf mass corr. by 7/21 – 3.0<br />
PM 2.5 diff.<br />
8/17<br />
8 DRUM – vf mass corr. by 7/21 – 6.8<br />
DRI r<strong>at</strong>io<br />
8/17<br />
Mass average - corrected 4.8 ± 2.7<br />
8 DRUM – all EC 8/5 –<br />
9/27<br />
8 DRUM –<br />
8/5 –<br />
corr. by EC diff.<br />
9/27<br />
Lundgren 5 drum – all EC 9/27 –<br />
10/7<br />
Lundgren 5 drum – corr. by 9/27 –<br />
EC diff.<br />
10/7<br />
Lundgren 5 drum – all EC 10/7 –<br />
Lundgren 5 drum – corr. by<br />
EC diff.<br />
10/17<br />
10/7 –<br />
10/17<br />
R<strong>at</strong>io -<br />
EC/DRI<br />
labor<strong>at</strong>ory<br />
R<strong>at</strong>io –<br />
EC/highway<br />
tunnel<br />
5.15 3.7<br />
9.02 6.7<br />
6.18 4.5<br />
13.9 10.1<br />
6.41 4.7<br />
14.4 10.5<br />
Average values (all) 7/21 –<br />
10/ 17<br />
Average values (Denio EC 7/21 –<br />
only)<br />
10/17<br />
Grand weighted average 7/21 –<br />
(EC + mass, Denio only) 10/17<br />
7.5 ± 4.0 9.2 ± 3.7 6.7 ± 2.7<br />
5.9 ± 0.6 4.3 ± 4.0<br />
5.5 ± 0.7<br />
A raw average of the 15 values gives a r<strong>at</strong>io of the RRAMP benzo{a}pyrene to<br />
diesel trucks of 7.7 ± 3.5. However, we conclude th<strong>at</strong> the Denio – Pool difference in EC<br />
is not a good m<strong>at</strong>ch to the Denio-only PAHs. Removing these d<strong>at</strong>a, and weighting the<br />
averages by errors, we derive 5.5 ± 0.7. This means th<strong>at</strong> there was about 5.5 times more<br />
benzo{a}pyrene from the RRAMP aerosols than from diesel truck aerosols, per unit very<br />
fine/ultra fine mass and per unit elemental carbon.<br />
Combining this with the PAH r<strong>at</strong>io d<strong>at</strong>a above, we find th<strong>at</strong> the factor of 5.5 is<br />
made up equally from the shift in mass of the PAHs to heavier masses in RRAMP and an<br />
increase in the gross emission r<strong>at</strong>e of PAHs.<br />
65
While we used EC to scale from summer to fall conditions we could easily have<br />
used mass if we had had it. This is important since inversions become more common in<br />
fall and winter, raising the very fine mass from a value of 2.25 µg/m 3 in summer (DRUM<br />
sages 7 + 8, 0.34 to 0.09 µm) to 6.6 µg/m 3 measured in February, 2006, using identical<br />
equipment. Thus, the Lundgren samplers were collecting in periods th<strong>at</strong> would tend to<br />
have higher masses <strong>at</strong> the Denio site, and the factor may gre<strong>at</strong>er than the 1.25 used from<br />
the EC d<strong>at</strong>a. This would improve the 8 DRUM to Lundgren agreement.<br />
66
Component E<br />
Aerosol sampling, winter, 2006, and comparison to heavily traveled secondary<br />
streets<br />
Aerosol concentr<strong>at</strong>ions in the Sacramento region typically maximize in winter<br />
months when stagn<strong>at</strong>ion and inversions are common. For this reason, even though the<br />
upwind-downwind Pool site to Denio Site rel<strong>at</strong>ionship of summer was degraded, it was<br />
decided to obtain <strong>at</strong> least 2 weeks of winter d<strong>at</strong>a to complete the 6 month period and gain<br />
an annual perspective. In addition, in order to aid in comparison of the rail yard d<strong>at</strong>a to<br />
other local pollution sources, the same protocol was applied to the Arden Middle School<br />
site, 25 m downwind of heavily traveled (65,0000 v/day) W<strong>at</strong>t Avenue, a road th<strong>at</strong><br />
typically has about 1.5% truck traffic. This work is not part of the grant but a contribution<br />
from Bre<strong>at</strong>he California of Sacramento-Emigrant Trails Health Effects Task Force and<br />
the UC Davis DELTA Group. Two DELTA 8 DRUM samplers with ultra-fine after<br />
filters were placed <strong>at</strong> Arden Middle School, Jan. 27. On February 10, they were both<br />
moved to the Denio site downwind of the <strong>Roseville</strong> <strong>Railyard</strong>. As shown below (Figure<br />
52), the we<strong>at</strong>her during each two week period was roughly comparable, with Arden<br />
having slightly better ventil<strong>at</strong>ion.<br />
Sacramento Intern<strong>at</strong>ional We<strong>at</strong>her<br />
Rainfall<br />
0.25<br />
0.2<br />
Inches<br />
0.15<br />
0.1<br />
0.05<br />
0<br />
27 29 31<br />
28 30 1<br />
January<br />
2<br />
3<br />
4<br />
5<br />
6<br />
7<br />
8<br />
9<br />
10 12 14 16 18 20 22 24<br />
11 13 15 17 19 21 23<br />
February<br />
Sacramento Intern<strong>at</strong>ional We<strong>at</strong>her<br />
Visibility (mi) Mean wind velocity (mi/hr) Fog present<br />
15<br />
10<br />
5<br />
0<br />
27 29 31<br />
28 30 1<br />
January<br />
2<br />
3<br />
4<br />
5<br />
6<br />
7<br />
8<br />
9<br />
10 12 14 16 18 20 22 24<br />
11 13 15 17 19 21 23<br />
February<br />
Figure 52 Meteorology during the winter sampling, 2006<br />
67
The Arden outdoor site was on the roof of the teacher ready room, about 25 m<br />
from the edge of the nearest traffic lane and above a small (6 car) parking lot. It was <strong>at</strong><br />
the same elev<strong>at</strong>ion but about <strong>at</strong> ½ the distance to W<strong>at</strong>t Avenue th<strong>at</strong> we used in 2003 and<br />
2005. The roof (painted white) was filthy with black soot.<br />
Below (Figure 53) we show the actual particles photographed in n<strong>at</strong>ural light<br />
(hence the bluish tinge to the clean Mylar). There is an obvious soil like component <strong>at</strong><br />
the Denio site absent <strong>at</strong> the Arden site, but other than th<strong>at</strong>, the traces seen roughly<br />
comparable.<br />
Arden Middle School/<strong>Roseville</strong> <strong>Railyard</strong> Aerosols<br />
DELTA Group 8 DRUM, true color photo, white background<br />
Arden Middle School<br />
<strong>Roseville</strong> <strong>Railyard</strong> (Denio)<br />
• Inlet to 5.0 µm<br />
• 5.0 to 2.5 µm<br />
• 2.5to 1.15 µm<br />
• 1.15 to 0.75 µm<br />
• 0.75 to 0.56 µm<br />
• 0.56 to 0.34 µm<br />
• 0.34 to 0.26 µm<br />
• 0.26 to 0.09 µm<br />
2006 January 24 26 28 30 1 3 5 7 9 11 13 15 17 19 21 23<br />
Figure 53 Photograph of winter drum strips, W<strong>at</strong>t Ave <strong>at</strong> Florin versus Denio site<br />
Based on the compositional inform<strong>at</strong>ion, the finest 2 stages (< 0.34 µm) are domin<strong>at</strong>ed by<br />
automobile and diesel exhaust, while there is clearly additional smoke impact on the 0.56<br />
to 0.34 µm stage.<br />
Mass measurements were made by soft beta ray transmission by the DELTA<br />
Group, and these are shown below (Figure 54).<br />
68
Arden <strong>Roseville</strong> Aerosols<br />
Inlet to 5.0 5.0 to 2.5 2.5 to 1.15 1.15 to 0.75<br />
25<br />
Arden Middle<br />
<strong>Roseville</strong> <strong>Railyard</strong><br />
Micrograms/m3<br />
20<br />
15<br />
10<br />
5<br />
0<br />
27 29 31<br />
28 30 1<br />
2<br />
3<br />
4<br />
5<br />
6<br />
7<br />
8<br />
9<br />
10 12 14 16 18 20 22 24<br />
11 13 15 17 19 21 23 25<br />
y<br />
February<br />
Arden <strong>Roseville</strong> Aerosols<br />
0.75 to 0.56 0.56 to 0.34 0.34 to 0.26 0.26 to 0.09<br />
Micrograms/m3<br />
10<br />
9<br />
8<br />
7<br />
6<br />
5<br />
4<br />
3<br />
2<br />
1<br />
0<br />
27 29 31<br />
28 30 1<br />
Arden Middle School<br />
7.0 ug/m3 vf<br />
2<br />
3<br />
4<br />
5<br />
6<br />
7<br />
8<br />
9<br />
<strong>Roseville</strong> <strong>Railyard</strong><br />
6.6 ug/m3<br />
10 12 14 16 18 20 22 24<br />
11 13 15 17 19 21 23 25<br />
January<br />
February<br />
Figure 54 Coarse and fine mass <strong>at</strong> W<strong>at</strong>t and Arden versus the Denio site, winter, 2006<br />
69
Qualit<strong>at</strong>ive comparison to winter, 2004 study<br />
Arden Middle School Very Fine Aerosols<br />
DELTA 8 DRUM, 0.26 > Dp > 0.09 µm<br />
January 16 – February 4, 2004<br />
January 24 – February 10, Arden roof:<br />
February 10 - 24 – Denio site – <strong>Roseville</strong> rail yard<br />
Figure 55 Photographs of winter DRUM strips, W<strong>at</strong>t/Arden, 2004, vs W<strong>at</strong>t/Arden and<br />
Denio, 2006<br />
Compositional analyses were made of the winter samples. First, chlorine in<br />
coarse modes is plotted, generally an indic<strong>at</strong>or of sea salt and strong marine winds<br />
(Figure 56).<br />
Arden <strong>Roseville</strong> Aerosols<br />
Chlorine<br />
Nanograms/m3<br />
1500<br />
1000<br />
500<br />
0.75 to 0.56 1.15 to 0.75 2.5 to 1.15 5.0 to 2.5 10 to 5.0<br />
Arden Middle<br />
Sh l<br />
<strong>Roseville</strong> rail yard<br />
0<br />
27<br />
29<br />
30<br />
31<br />
2<br />
3<br />
5<br />
6<br />
7<br />
9<br />
10<br />
11<br />
13<br />
14<br />
16<br />
17<br />
18<br />
20<br />
21<br />
22<br />
24<br />
25<br />
January<br />
February<br />
Figure 56 Chlorine aerosols (sea salt) <strong>at</strong> W<strong>at</strong>t/Arden and Denio, winter, 2006<br />
70
The second element is iron, a tracer of soil. This can the m<strong>at</strong>ched to the coarse<br />
mass fraction seen only <strong>at</strong> the Denio site in mass (Figure 57).<br />
Arden <strong>Roseville</strong> Aerosols<br />
Iron<br />
Nanograms/m3<br />
Thousands<br />
0.75 to 0.56 1.15 to 0.75 2.5 to 1.15 5.0 to 2.5 10 to 5.0<br />
4<br />
3<br />
2<br />
1<br />
Arden Middle<br />
Sh l<br />
<strong>Roseville</strong> rail yard<br />
0<br />
27<br />
29<br />
30<br />
31<br />
2<br />
3<br />
5<br />
6<br />
7<br />
9<br />
10<br />
11<br />
13<br />
14<br />
16<br />
17<br />
18<br />
20<br />
21<br />
22<br />
24<br />
25<br />
January<br />
February<br />
Figure 57 Iron aerosols (soil) <strong>at</strong> W<strong>at</strong>t/Arden vs Denio, winter, 2006<br />
Finally, we plot sulfur (Figure 58). The peaks from January 29 through February 6 are<br />
associ<strong>at</strong>ed with Bay Area sources as shown by both the chlorine and the vanadium<br />
(Figure 59), generally a tracer of heavy fuel oil. Note th<strong>at</strong> the sulfur <strong>at</strong> the Denio site<br />
shows the characteristic diurnal maxima and minima p<strong>at</strong>tern only weakly present <strong>at</strong><br />
Arden Middle School.<br />
71
Arden <strong>Roseville</strong> Aerosols<br />
0.26 to 0.09 microns<br />
Sulfur<br />
140<br />
Nanograms/m3<br />
120<br />
100<br />
80<br />
60<br />
40<br />
Arden Middle<br />
Sh l<br />
<strong>Roseville</strong> rail yard<br />
20<br />
0<br />
27 30<br />
29 31<br />
2<br />
3<br />
5<br />
6<br />
7<br />
9<br />
10<br />
11<br />
13<br />
14<br />
16<br />
17<br />
18<br />
20<br />
21<br />
22<br />
24<br />
25<br />
January<br />
February<br />
Figure 58 Iron aerosols (soil) <strong>at</strong> W<strong>at</strong>t/Arden vs Denio, winter, 2006<br />
Arden <strong>Roseville</strong> Aerosols<br />
0.26 to 0.09 microns<br />
Nanograms/m3<br />
1<br />
0.9<br />
0.8<br />
0.7<br />
0.6<br />
0.5<br />
0.4<br />
0.3<br />
0.2<br />
0.1<br />
0<br />
27<br />
Arden Middle<br />
Sh l<br />
30<br />
29 31<br />
2<br />
3<br />
5<br />
6<br />
7<br />
9<br />
Vanadium<br />
10 13<br />
11 14<br />
<strong>Roseville</strong> rail yard<br />
16 18 21<br />
17 20 22<br />
24<br />
25<br />
January<br />
February<br />
Figure 59 Vanadium aerosols (heavy fuel oil) <strong>at</strong> W<strong>at</strong>t/Arden vs Denio, winter, 2006<br />
Potassium in the coarser modes is a component of soil. Compare this (Figure 60) plot to<br />
iron.<br />
72
Nanograms/m3<br />
500<br />
400<br />
300<br />
200<br />
100<br />
0.75 to 0.56 1.15 to 0.75 2.5 to 1.15 5.0 to 2.5 10 to 5.0<br />
Arden Middle<br />
Sh l<br />
Arden <strong>Roseville</strong> Aerosols<br />
Potassium - soil<br />
<strong>Roseville</strong> rail yard<br />
0<br />
27<br />
29<br />
30<br />
31<br />
2<br />
3<br />
5<br />
6<br />
7<br />
9<br />
10<br />
11<br />
13<br />
14<br />
16<br />
17<br />
18<br />
20<br />
21<br />
22<br />
24<br />
25<br />
January<br />
February<br />
Figure 60 Coarse potassium aerosols (soil) <strong>at</strong> W<strong>at</strong>t/Arden vs Denio, winter, 2006<br />
Potassium in the finer modes has both a biomass combustion component (0.35 to 0.75<br />
µm) and an internal engine combustion component (< 0.34 µm) (Figure 61).<br />
73
Arden <strong>Roseville</strong> Aerosols<br />
Potassium - wood smoke<br />
Nanograms/m3<br />
150<br />
100<br />
50<br />
Arden Middle<br />
Sh l<br />
0.34 to 0.26 0.56 to 0.34 0.75 to 0.56<br />
<strong>Roseville</strong> rail yard<br />
0<br />
27<br />
29<br />
30<br />
31<br />
2<br />
3<br />
5<br />
6<br />
7<br />
9<br />
10<br />
11<br />
13<br />
14<br />
16<br />
17<br />
18<br />
20<br />
21<br />
22<br />
24<br />
25<br />
January<br />
February<br />
Arden <strong>Roseville</strong> Aerosols<br />
Potassium - cars and diesels<br />
0.26 to 0.09<br />
60<br />
50<br />
Arden Middle<br />
Sh l<br />
<strong>Roseville</strong> rail yard<br />
Nanograms/m3<br />
40<br />
30<br />
20<br />
10<br />
0<br />
27<br />
29<br />
30<br />
31<br />
2<br />
3<br />
5<br />
6<br />
7<br />
9<br />
10<br />
11<br />
13<br />
14<br />
16<br />
17<br />
18<br />
20<br />
21<br />
22<br />
24<br />
25<br />
January<br />
February<br />
Figure 61 a, b Accumul<strong>at</strong>ion mode potassium aerosols (wood smoke) and very fine<br />
potassium aerosols (vehicular) <strong>at</strong> W<strong>at</strong>t/Arden vs Denio, winter 2006<br />
Examining the very fine zinc sign<strong>at</strong>ure (Figure 62), we can add the phosphorus<br />
component from the zinc thiophosph<strong>at</strong>e stabilizer in lubric<strong>at</strong>ing oils. Ignoring the period<br />
of high Bay Area transport, we can see th<strong>at</strong> the Zn/P r<strong>at</strong>io is smaller <strong>at</strong> the rail yard than<br />
<strong>at</strong> W<strong>at</strong>t Ave, most likely a reflection of the differences between the spark emission<br />
domin<strong>at</strong>ed W<strong>at</strong>t Ave. and the diesel domin<strong>at</strong>ed <strong>Roseville</strong> <strong>Railyard</strong>.<br />
74
Nanograms/m3<br />
9<br />
8<br />
7<br />
6<br />
5<br />
4<br />
3<br />
2<br />
1<br />
0<br />
27 30<br />
29 31<br />
January<br />
Arden Middle<br />
Sh l<br />
Arden <strong>Roseville</strong> Aerosols<br />
Phosphorus and zinc - cars and diesels lube oil<br />
0.26 to 0.09 phosphorus 0.26 to 0.09 zinc<br />
2<br />
3<br />
5<br />
6<br />
7<br />
<strong>Roseville</strong> rail yard<br />
10 13 16 18 21<br />
9 11 14 17 20 22<br />
February<br />
24<br />
25<br />
Figure 62 Very fine mode phosphorus and zinc aerosols (vehicular) <strong>at</strong> W<strong>at</strong>t/Arden vs<br />
Denio, winter 2006<br />
Finally, for completeness sake, we include some typically anthropogenic metals<br />
(Figure 63). The high nickel levels from the Bay Area are the m<strong>at</strong>ch to the vanadium<br />
values, above, as both are in heavy oils. The high copper levels <strong>at</strong> Arden <strong>at</strong> the moment<br />
lack any r<strong>at</strong>ionale.<br />
Arden <strong>Roseville</strong> Aerosols<br />
0.26 to 0.09 microns<br />
Nickel Copper Zinc<br />
Nanograms/m3<br />
9<br />
8<br />
7<br />
6<br />
5<br />
4<br />
3<br />
2<br />
1<br />
0<br />
27<br />
29<br />
Arden Middle<br />
Sh l<br />
30<br />
31<br />
2<br />
3<br />
5<br />
6<br />
7<br />
9<br />
10<br />
11<br />
13<br />
14<br />
16<br />
<strong>Roseville</strong> rail yard<br />
17<br />
18 21<br />
20 22<br />
24<br />
25<br />
January<br />
February<br />
Figure 63 Very fine mode Ni, Cu, and Zn zinc aerosols <strong>at</strong> W<strong>at</strong>t/Arden vs Denio 2006<br />
75
The implic<strong>at</strong>ions of the winter d<strong>at</strong>a, although limited in time and with no Denio-<br />
Pool comparison, are still useful for an overall evalu<strong>at</strong>ion of the impact of the <strong>Roseville</strong><br />
<strong>Railyard</strong> on local aerosols.<br />
From the RRAMP d<strong>at</strong>a of Table 3, we see th<strong>at</strong> the average PM 2.5 <strong>at</strong> the Denio site<br />
was 13.15 µg/m 3 , and the Pool site 10.2 µg/m 3 , July through October. . The DRUM d<strong>at</strong>a<br />
from summer show a Denio – Pool enhancement of 1.35 ± 0.27 µg/m 3 during the same<br />
period when BC is 1.2 µg/m 3 and the Denio – Pool PM 2.5 mass was 4.7 µg/m 3 . Thus, we<br />
can conclude th<strong>at</strong> essentially all of the very fine-ultra fine mass difference in summer is<br />
BC.<br />
No discernable trend is seen in PM 2.5 <strong>at</strong> the Denio site as we move into fall,<br />
despite a rise in BC from 1.2 µg/m 3 to 1.8 µg/m 3 in th<strong>at</strong> period, for an average of 1.5<br />
µg/m 3 . Using the Denio – Pool subtraction, we conclude th<strong>at</strong> circa ½ of the 2.95 µg/m 3 of<br />
the PM 2.5 mass is in the form of BC, summer though fall, and almost entirely in the very<br />
fine-ultra fine mass fraction.<br />
A linear progression of the BC d<strong>at</strong>a until winter would give an estim<strong>at</strong>e of 2.7<br />
µg/m 3 . The very fine (< 0.25 µm) aerosol from the 8 DRUM d<strong>at</strong>a showed a mass of 2.25<br />
µg/m 3 in summer and 6.6 µg/m 3 in winter, a factor of 2.9, somewh<strong>at</strong> gre<strong>at</strong>er than the<br />
factor 2.25 estim<strong>at</strong>ed for BC in the same period. Thus, we can estim<strong>at</strong>e th<strong>at</strong> the annual<br />
average BC enhancement for the Denio site is about 2 µg/m 3 , and 4.4 µg/m 3 of very fineultra<br />
fine mass.<br />
Component F<br />
Collection of aerosols <strong>at</strong> the Pool and Denio sites, summer, 2006, and <strong>at</strong> the Pool,<br />
Denio, and Church Street sites, summer, 2007.<br />
One of the primary goals of the RRAMP and Bre<strong>at</strong>he California’s HETF<br />
programs was to track the progress of UPRR’s mitig<strong>at</strong>ion efforts. Our capabilities can<br />
track changes, such as sulfur emissions, th<strong>at</strong> are unavailable from standard RRAMP<br />
measurements. Thus, samples were taken with 8 DRUM samplers, with 3 hr resolution,<br />
over a period of 6 weeks <strong>at</strong> the Pool and Denio site, summer 2006, and <strong>at</strong> the Pool, Denio,<br />
and Church Street sites, summer 2007. The Church Street site was added since it is<br />
possible th<strong>at</strong> the Denio site might not be available in summer 2008, and without a<br />
comparison, some of the usefulness of the early Denio-only d<strong>at</strong>a would be lost. These<br />
samples will be analyzed for mass, photographed, then archived for potential future<br />
analysis.<br />
76
10 to 5.0<br />
ARB 13 th and T Street Aug 22 – Oct 2, 2007<br />
5.0 to 2.5<br />
2.5 to 1.15<br />
1.15 to 0.75<br />
0.75 to 0.56<br />
0.56 to 0.34<br />
0.34 to 0.26<br />
0.26 to 0.09<br />
10 to 5.0<br />
<strong>Roseville</strong> rail yard Pool site Aug 22 – Oct 2, 2007<br />
5.0 to 2.5<br />
2.5 to 1.15<br />
1.15 to 0.75<br />
0.75 to 0.56<br />
0.56 to 0.34<br />
0.34 to 0.26<br />
0.26 to 0.09<br />
Figure 64 Comparison of downtown and the <strong>Roseville</strong> Pool site<br />
77
10 to 5.0<br />
<strong>Roseville</strong> rail yard Denio site Aug 22 – Oct.4, 2007<br />
5.0 to 2.5<br />
2.5 to 1.15<br />
1.15 to 0.75<br />
0.75 to 0.56<br />
0.56 to 0.34<br />
0.34 to 0.26<br />
0.26 to 0.09<br />
10 to 5.0<br />
<strong>Roseville</strong> rail yard Church Street Aug 22 – Oct. 4 2007<br />
5.0 to 2.5<br />
2.5 to 1.15<br />
1.15 to 0.75<br />
0.75 to 0.56<br />
0.56 to 0.34<br />
0.34 to 0.26<br />
0.26 to 0.09<br />
Figure 65 Comparison of the Denio and Church Street sites<br />
From these comparisons, it can be seen th<strong>at</strong> the <strong>Roseville</strong> Pool site, generally<br />
upwind of the rail yard, is very similar to downtown Sacramento <strong>at</strong> the ARB 13 th and T<br />
Street sites. The brown fine mass in early September is the Plumas County “Moonlight”<br />
fire, while the whiter band is an artifact introduced to aid in timing. It is also clear th<strong>at</strong> the<br />
Denio site is darker (soot?) in the very fine modes than the Church Street site.<br />
78
Component G<br />
Mitig<strong>at</strong>ion options proposed by the HETF for the <strong>Roseville</strong> <strong>Railyard</strong><br />
These studies identify the <strong>Roseville</strong> <strong>Railyard</strong> as a source of aerosols with potential<br />
for health impacts. It is thus essential th<strong>at</strong> efforts are made to reduce these impacts. This<br />
process has already been started with a Memorandum of Understanding (MOU) between<br />
the UPRR, Placer County APCD, and other local, st<strong>at</strong>e, and federal air pollution agencies.<br />
The MOU outlines actions being taken by UPRR, with valid<strong>at</strong>ion by the RRAMP<br />
program. However, the results of these studies have raised other concerns not addressed<br />
in the original MOU, such as the presence of metal-rich soil aerosols blowing from the<br />
site, and the potential for more serious health impacts because of the n<strong>at</strong>ure of the rail<br />
yard diesel emissions.<br />
In parallel with other ongoing mitig<strong>at</strong>ion efforts, such as those centered on W<strong>at</strong>t<br />
Avenue, we propose a four phase program:<br />
1. Mitig<strong>at</strong>ion of the diesel sources,<br />
2. Mitig<strong>at</strong>ion options within the rail yard itself, including contamin<strong>at</strong>e soils,<br />
3. Mitig<strong>at</strong>ion from the rail yard fence to downwind receptors such as houses,<br />
schools, and playgrounds; and<br />
4. Mitig<strong>at</strong>ion <strong>at</strong> the receptors, generally focusing on indoor air quality.<br />
1. Mitig<strong>at</strong>ion of the diesel sources<br />
These mitig<strong>at</strong>ions are largely included in the original MOU and upd<strong>at</strong>ed<br />
periodically to ascertain progress. They include a variety of options, such as newer,<br />
cleaner engines, changes in fuel, modific<strong>at</strong>ions of yard oper<strong>at</strong>ions to reduce engine<br />
idling, future tests with a hood system to capture and tre<strong>at</strong> exhaust, and other actions.<br />
The final RRAMP report will document these actions.<br />
In addition to specific<strong>at</strong>ions in the MOU, we recommend:<br />
• install<strong>at</strong>ion of the highest level Verified Diesel Emission Control Systems<br />
(VDECS) commercially available for the model year, duty cycle and body<br />
configur<strong>at</strong>ion of the locomotive; with the system upgraded as higher levels of<br />
VDECS become available;<br />
• acceler<strong>at</strong>ed replacement of line haul locomotives oper<strong>at</strong>ing in California;<br />
• retrofit or rebuild of line haul locomotives with lower emitting technology;<br />
• use of altern<strong>at</strong>ive fuels, truck engines, and hybrid engines in switcher locomotives;<br />
• retrofit of non-locomotive rail yard diesel rail yard equipment;<br />
• emissions testing for switcher locomotives and/or incentives to replace oilburning<br />
locomotives;<br />
• since this report highlights the role of used lubric<strong>at</strong>ing oil in toxic emissions, we<br />
recommend immedi<strong>at</strong>e replacement of used lubric<strong>at</strong>ing oil prior to any engine<br />
repair or testing oper<strong>at</strong>ions in the rail yard; and<br />
• research of the modific<strong>at</strong>ion of lubric<strong>at</strong>ing oil formul<strong>at</strong>ions to reduce toxic<br />
emissions.<br />
79
2. Mitig<strong>at</strong>ion options within the rail yard itself<br />
No m<strong>at</strong>ter how much mitig<strong>at</strong>ion is made in the sources, there will still be diesel<br />
effluent. In addition, there appear to be anomalously high emissions of fine metals<br />
from the yard, likely a result of high temper<strong>at</strong>ure working of metals. .<br />
Further, analysis of coarse and fine particles downwind of the railyard show<br />
elev<strong>at</strong>ed levels of lead and other heavy metals th<strong>at</strong> are not common in the surrounding<br />
urban environment in the concentr<strong>at</strong>ions measured. A strong possibility exists th<strong>at</strong><br />
these concentr<strong>at</strong>ions result from dust gener<strong>at</strong>ing activities within the railyard on soils<br />
contamin<strong>at</strong>ed over the decades by the dumping of paint wastes, shop wastes, and<br />
steam locomotive boiler slag.<br />
Emissions of fugitive dust within the railyard should be minimized, especially<br />
from portions of the yard th<strong>at</strong> contain contamin<strong>at</strong>ed surface soils. Fugitive dust<br />
control measures include the paving of areas traversed by mobile equipment and the<br />
stabiliz<strong>at</strong>ion of inactive disturbed soils to reduce dust from oper<strong>at</strong>ional activities and<br />
windblown soil entrainment. Soil stabiliz<strong>at</strong>ion should be performed using dust<br />
palli<strong>at</strong>ives and soil berms constructed to prevent further vehicle disturbance, as well<br />
as by reintroducing veget<strong>at</strong>ion on bare soil areas.<br />
The use of veget<strong>at</strong>ion barriers within the rail yard, generally aligned in parallel<br />
with the tracks, and <strong>at</strong> the boundary fences, can have strong effects in several ways.<br />
First, it will reduce the wind velocities across contamin<strong>at</strong>ed soil. Second, barriers<br />
such as evergreen trees have been shown to reduce aerosols in the size mode of diesel<br />
emissions by <strong>at</strong>tachment to the needles and leaves. Third, by hampering l<strong>at</strong>eral<br />
transport of the wind and cre<strong>at</strong>ing eddies behind veget<strong>at</strong>ion <strong>at</strong> high winds, pollutants<br />
are lofted vertically, reducing near rail yard concentr<strong>at</strong>ions. These mitig<strong>at</strong>ions have<br />
secondary benefits in improved scenery, reduced sounds, and carbon sequestr<strong>at</strong>ion.<br />
Below we show an example of recent d<strong>at</strong>a from a HETF/UC Davis study of<br />
veget<strong>at</strong>ion funded by Sacramento Metropolitan AQMD. In it we show the removal of<br />
very fine (D p , 0.26 µm) particles passing <strong>at</strong> low speed through redwood veget<strong>at</strong>ion in<br />
the UC Davis Mechanical Engineering wind tunnel. These results are in substantial<br />
agreement with theoretical analyses based on the enhanced removal by diffusion for<br />
very fine particles if a surface is available. We have also confirmed th<strong>at</strong> the particles,<br />
once impacted, do not re-emit under strong winds or shaking.<br />
80
Removal of very fine particles in redwood veget<strong>at</strong>ion<br />
HETF/UC Davis Tunnel Studies<br />
Fraction penetr<strong>at</strong>ing veget<strong>at</strong>ion<br />
1.2<br />
1<br />
0.8<br />
0.6<br />
0.4<br />
0.2<br />
0<br />
1.0 1.5 2.0 3.0 4.0<br />
Wind velocity m/s (for mph, x 2.1)<br />
Figure 66 Preliminary d<strong>at</strong>a on removal r<strong>at</strong>e of very fine (0.26 > D p > 0.09 µm) on<br />
redwood branches in the UC Davis mechanical Engineering wind tunnel<br />
The barriers should grow to be essentially complete (veget<strong>at</strong>ion touching) in a few<br />
years up to a height of roughly the mixing zone on the roadway, which is typically<br />
about 3 m (16 feet) high. This can also be accomplished with bushes in front of the<br />
trees, and recent studies (Baldauf et al, US EPA) have shown 30% removal of ultra<br />
fine particles even with sound walls. Excellent examples of effective barriers can be<br />
seen on I-5 south of the Business 80 (W-X) freeway, and south of I-80 just west of<br />
Fairfield on the new Paradise valley development.<br />
3. Mitig<strong>at</strong>ion from the rail yard fence to downwind receptors, houses, schools,<br />
playgrounds, etc.<br />
Clearly, the best possible mitig<strong>at</strong>ion beyond the rail yard fence is distance. The<br />
rail yard as a source certainly is of the same order as the 50,000 vehicle/day threshold in<br />
the law th<strong>at</strong> requires schools to be sited <strong>at</strong> least 500 ft away from the source.<br />
Distance can be made yet more effective by the same sort of barriers mentioned in<br />
Mitig<strong>at</strong>ion 2, especially through use of evergreen veget<strong>at</strong>ive barriers. Modific<strong>at</strong>ion of<br />
street tree planting types could aid in this process, with redwoods, deodar, live oak, and<br />
oleander already tested and shown effective.<br />
81
4. Mitig<strong>at</strong>ion <strong>at</strong> the receptors, generally focusing on indoor air quality<br />
There is a growing appreci<strong>at</strong>ion th<strong>at</strong> indoor air quality is a major factor in total<br />
person-dose-days exposure to airborne contaminants. There is a growing liter<strong>at</strong>ure on<br />
methods to clean indoor air.<br />
The special case of the rail yard, however, offers special options. Since the most<br />
toxic m<strong>at</strong>erials are in the very fine and ultra fine size modes, these particle have an ability<br />
to travel short distances to a surface. Our studies in indoor filtr<strong>at</strong>ion with simple passive<br />
electrost<strong>at</strong>ic filters <strong>at</strong> Arden Middle School showed surprisingly high effectiveness for a<br />
filter th<strong>at</strong> can be used to replace existing furnace filters. In this study, very fine aerosols<br />
<strong>at</strong> the school loc<strong>at</strong>ion averaged 7 µg/m 3 in a winter study, 2006 (see Figure 53). Current<br />
theory estim<strong>at</strong>es th<strong>at</strong> about ¾ of fine particles (D p < 2.5 µm) should penetr<strong>at</strong>e an average<br />
building, yielding an expected indoor concentr<strong>at</strong>ion of a little over 5 µg/m 3 . Install<strong>at</strong>ion<br />
of a simple passive electrost<strong>at</strong>ic non-HEPA filter on a recalcul<strong>at</strong>ing indoor gas fired<br />
he<strong>at</strong>ing unit resulted in measured very fine particul<strong>at</strong>e mass of 1.8 µg/m 3 .<br />
This result is being evalu<strong>at</strong>ed in the SMAQMD study, but this is in accord with<br />
theory th<strong>at</strong> st<strong>at</strong>es filters become more effective as particle sizes decrease below 0.1 µm.<br />
This, as with the veget<strong>at</strong>ion, the very fine modes of the <strong>Roseville</strong> <strong>Railyard</strong> diesel exhaust,<br />
and the fact th<strong>at</strong> almost all of the most potent carcinogens with molecular masses of<br />
252 (benzo[a]pyrene) or higher lie in particle sizes below 0.09 µm (Figure 42), also<br />
allows enhanced and more effective options for mitig<strong>at</strong>ion.<br />
Efforts should be made to evalu<strong>at</strong>e the presence of rail yard aerosols inside homes,<br />
and support should be given to aid the residences to reduce the concentr<strong>at</strong>ions.<br />
82
References:<br />
Baldauf, R. Personal communic<strong>at</strong>ion (2007)<br />
Bench, G., P.G. Grant, D. Ueda, S.S. Cliff, K.D. Perry, and T. A. Cahill. The use of<br />
STIM and PESA to respectively measure profiles of aerosol mass and hydrogen<br />
content across Mylar rot<strong>at</strong>ing drum impactor samples. 2001 Aerosol Science and<br />
Technology 36:642-651.<br />
Cahill, Thomas A. and Paul Wakabayashi. Compositional analysis of size-segreg<strong>at</strong>ed<br />
aerosol samples. Chapter in the ACS book Measurement Challenges in<br />
Atmospheric Chemistry. Leonard Newman, Editor. Chapter 7, Pp. 211-228<br />
(1993).<br />
Cahill, T.A., P, Wakabayashi, T. James. Chemical St<strong>at</strong>e of Sulf<strong>at</strong>e <strong>at</strong> Shenandoah<br />
N<strong>at</strong>ional Park During Summer 1991 Nuclear Instruments and Methods in<br />
Physics Research B: Beam Interactions with M<strong>at</strong>erials and Atoms, 109/110 542-<br />
547, (1996)<br />
Cahill, Thomas A., Kent Wilkinson, and Russ Schnell. Composition analyses of sizeresolved<br />
aerosol samples taken from aircraft downwind of Kuwait, Spring, 1991.<br />
Journal of Geophysical Research. Vol. 97, No. D13, Paper no. 92JD01373, Pp.<br />
14513-14520, September 20 (1992).<br />
Cahill, T.A., C. Goodart, J.W. Nelson, R.A. Eldred, J.S. Nasstrom, and P.J. Feeney.<br />
Design and evalu<strong>at</strong>ion of the drum impactor. Proceedings of Intern<strong>at</strong>ional<br />
Symposium on Particul<strong>at</strong>e and Multi-phase Processes. Teoman Ariman and T.<br />
Nej<strong>at</strong> Veziroglu, Editors. Hemisphere Publishing Corpor<strong>at</strong>ion, Washington, D.C.<br />
2:319-325. (1985).<br />
Cahill, T. A. Comments on surface co<strong>at</strong>ings for Lundgren-type impactors. Aerosol<br />
Measurement. Dale A. Lundgren, Editor. University Presses of Florida, Pp.<br />
131-134 (1979).<br />
Draxler, R.R. and Rolph, G.D., 2003. HYSPLIT (HYbrid Single-Particle Lagrangian<br />
Integr<strong>at</strong>ed Trajectory) Model access via NOAA ARL READY Website<br />
(http://www.arl.noaa.gov/ready/hysplit4.html). NOAA <strong>Air</strong> Resources Labor<strong>at</strong>ory,<br />
Silver Spring, MD.<br />
Raabe, Otto G., David A. Bra<strong>at</strong>en, Richard L. Axelbaum, Stephen V. Teague, and<br />
Thomas A. Cahill. Calibr<strong>at</strong>ion Studies of the DRUM Impactor. Journal of<br />
Aerosol Science. 19.2:183-195 (1988).<br />
Rolph, G.D., 2003. Real-time Environmental Applic<strong>at</strong>ions and Display sYstem<br />
(READY) Website (http://www.arl.noaa.gov/ready/hysplit4.html). NOAA <strong>Air</strong><br />
Resources Labor<strong>at</strong>ory, Silver Spring, MD.<br />
Wesolowski, J.J., W. John, W. Devor, T.A. Cahill, P.J. Feeney, G. Wolfe, R. Flocchini.<br />
Collection surfaces of cascade impactors. In X-ray fluorescence analysis of<br />
environmental samples. Dzubay, T., Editor. Ann Arbor Science, Pp. 121-130<br />
(1978).<br />
Zielinska, B., Cahill, T.A , Steve Cliff, Michael Jimenez-Cruz, and Kevin Perry,<br />
Elemental analysis of diesel particles from MOUDI samplers, Final Report to<br />
Doug Lawson, the N<strong>at</strong>ional Renewable Energy Labor<strong>at</strong>ory, Golden, CO (2004)<br />
83
Acknowledgments:<br />
The authors wish to acknowledge the continual support, encouragement, and expert<br />
scientific guidance of the Health Effects Task Force of Bre<strong>at</strong>he California of Sacramento-<br />
Emigrant Trails, its Chair, Jan Sharpless, and its Consultant, Betty Turner.<br />
The staff of the Placer County APCD were exemplary in their support of our field<br />
analyses and their provision of meteorology and d<strong>at</strong>a from RRAMP.<br />
The authors also gr<strong>at</strong>efully acknowledge the NOAA <strong>Air</strong> Resources Labor<strong>at</strong>ory (ARL) for<br />
the provision of the HYSPLIT transport and dispersion model and/or READY website<br />
(http://www.arl.noaa.gov/ready.html) used in this public<strong>at</strong>ion.<br />
This report has benefited gre<strong>at</strong>ly from the comments and suggestions of the RRAMP<br />
Technical Advisory Committee, but the opinions expressed herein are solely those of the<br />
authors.<br />
84
Appendix QA:<br />
The DRUM cuts are sharp and fully predictable by standard aerodynamic principles, and<br />
mis-sizing by bounce-off is reduced to less than 1 part in 5,000 by mass by a light grease<br />
co<strong>at</strong>ing (Wesolowski et al, 1979, Cahill 1979, Cahill et al, 1985).<br />
A side by side comparison study of DRUM and other samplers was done on<br />
October 2 – 14, 2005, <strong>at</strong> Davis as part of the <strong>Quality</strong> Assurance component of the new<br />
EPA Particul<strong>at</strong>e M<strong>at</strong>ter Research Center grant to UC Davis which will be using DELTA<br />
Group DRUM samplers and analysis, 2005-2010.<br />
However, an error in the modific<strong>at</strong>ion in old DRUM #4, (1987) the Pool site<br />
sampler, resulted in an internal leak in th<strong>at</strong> could not be detected during field sampling <strong>at</strong><br />
RRAMP using standard vacuum and flow audit devices. It was discovered after analyses<br />
of the co-loc<strong>at</strong>ed sampling for quality assurance purposes <strong>at</strong> the Denio site and confirmed<br />
by disassembly of the unit. This invalid<strong>at</strong>ed all size modes from the Pool sampler except<br />
the finest, 0.26 > D p > 0.09 µm, which as a critical orifice has separ<strong>at</strong>e quality assurance<br />
checks. The side by side comparison yielded an average of 0.72 µg/m 3 for the Denio<br />
sampler, 0.68 µg/m 3 for the Pool site.<br />
Comparison between d<strong>at</strong>a on DRUM samplers to standard PM is difficult due to:<br />
1. Sharper size cut profiles, DRUM vs filters, especially important near the PM 10<br />
and PM 2.5 cut points,<br />
2. Differences in the way impactors handle aerosols, since air is not drawn through<br />
the deposit, preserving chemical inform<strong>at</strong>ion sometimes lost in filters (i.e.,<br />
sulfuric acid, Cahill et al, 1996)<br />
3. Lack of ultra fine d<strong>at</strong>a below 0.09 µm. This l<strong>at</strong>ter problem is especially important<br />
near strong combustion sources.<br />
4. Time registr<strong>at</strong>ion. DRUM samplers have errors in timing inherent to continuous<br />
sampling. The finite width of the impaction slot introduces an irreducible<br />
averaging over 1 ½ to 3 hr, the stretching of the Mylar onto the analysis frame<br />
adds typically 6 ± 3 hr of uncertainty. The rel<strong>at</strong>ive time uncertainty is very small,<br />
10 min/day, so th<strong>at</strong> alignment of DRUM d<strong>at</strong>a with high precision gas and<br />
particul<strong>at</strong>e d<strong>at</strong>a (such as NO) is an essential next step in d<strong>at</strong>a reduction.<br />
5. Propag<strong>at</strong>ion of error problems. To m<strong>at</strong>ch a single 24 hr PM 2.5 RRAMP filter, one<br />
has to sum 96 individual 1 ½ hr mass measurements or 48 3 hr elemental values<br />
from the DRUM samplers.<br />
6. Dilution of the mass signal. The aerosols are spread over 8 size modes, resulting<br />
in almost a reduction of 10 in the amount of mass available to analyze on each<br />
stage.<br />
2. Analysis<br />
The UC Davis DELTA Group performs analyses by 7 different non-destructive<br />
methods, also described in public<strong>at</strong>ions and the 135 page DRUM <strong>Quality</strong> Assurance<br />
85
Document, l<strong>at</strong>est version 1/2005 (DQAP ver. 1/05), posted on the DELTA web site<br />
http://delta.ucdavis.edu.<br />
c. Mass<br />
Analysis was completed for mass values every 1 ½ hours in 8 size modes for the<br />
entire period. Each strip was analyzed <strong>at</strong> least 2 times, and the standard devi<strong>at</strong>ion of the<br />
d<strong>at</strong>a are included in the d<strong>at</strong>a file. An example of the precision repe<strong>at</strong>ed measurements of<br />
DRUM strip is shown below.<br />
200<br />
<strong>Quality</strong> Assurance Precision Test of RRAMP DRUM strips<br />
UC Davis DELTA Group soft beta ray mass analysis<br />
Denio DRUM #8 Stage 8 0.26 > Dp > 0.09 microns<br />
Run #1 Run #2<br />
Micrograms/cm2<br />
150<br />
100<br />
50<br />
0<br />
26 36 46 56 66 76 86 96 106 116 126 136 146 156 166<br />
31 41 51 61 71 81 91 101 111 121 131 141 151 161 171<br />
Figure 1 Precision test for mass<br />
Millimeters along DRUM strip<br />
Note th<strong>at</strong> since the strip was remounted, the test also valid<strong>at</strong>es rel<strong>at</strong>ive time precision.<br />
Any measurements where the analysis differs by more than ± 10% are independently rerun<br />
until agreement is achieved.<br />
As mentioned above, comparisons with 24 hr filters are difficult. There have been<br />
2 recent comparisons completed and one in progress (the US EPA PMRC Center tests <strong>at</strong><br />
Davis) in rural conditions where the lack of ultra fine particul<strong>at</strong>e mass should not be a<br />
major effect. The first was with IMPROVE and the N<strong>at</strong>ional Park Service <strong>at</strong> Yosemite<br />
NP, 2002. (Final Report, 2004) Despite having to average 144 soft beta mass<br />
measurement (d<strong>at</strong>a taken every hour in 6 size modes), there is good overall agreement (r 2<br />
= 0.74, slope = 1.14). However, the worst agreement occurred on 4 successive days with<br />
the arrival of fresh forest fire smoke from massive fires in Oregon.<br />
86
Sum of 144 soft beta DRUM analyses<br />
15<br />
10<br />
5<br />
Yosemite NP DRUM-IMPROVE Comparison<br />
Summer, 2002<br />
Oregon forest fires<br />
0<br />
0 5 10 15<br />
IMPROVE 24 hr Filter<br />
Figure 2 DRUM mass versus filters <strong>at</strong> Yosemite NP<br />
r2 = 0.74<br />
The second test involved a comparison of DRUM mass <strong>at</strong> Davis to the district PM 2.5 d<strong>at</strong>a<br />
<strong>at</strong> Woodland, roughly 10 miles away.<br />
87
Aerosols <strong>at</strong> Davis High School<br />
Mass, Winter, 2005<br />
Woodland PM2.5 Davis High, inlet to 0.15 microns Rain (cm) x 10<br />
Micrograms/m3<br />
40<br />
30<br />
20<br />
10<br />
Federal annual<br />
PM2.5 standard<br />
Wind from<br />
SJV<br />
0<br />
15 16 17 18 19 20 21 22 23 24 25 26 27 28 29 30 31 1 2 3<br />
January<br />
February<br />
Figure 3 DRUM versus district filter sampler, Yolo County<br />
In summary, DRUM mass d<strong>at</strong>a are vital for elucid<strong>at</strong>ing temporal and size<br />
behavior of aerosols while suffering some loss of accuracy and precision when compared<br />
to standard filter methods.<br />
c. Compositional Analysis of Elements<br />
The samples collected by the DRUM sampler are designed to allow highly<br />
sensitive elemental analysis by the new DELTA Group designed aerosol analysis system<br />
of the x-ray micro beam of the Advanced Light Source, Lawrence Berkeley NL (Bench et<br />
al, 2002). The method, synchrotron-induced x-ray fluorescence (S-XRF) has been used<br />
by the DELTA Group since 1992, (Cahill et al, 1992) but in its present form since 1999.<br />
88
Table 2 S-XRF comparison, all blind tests since 1999<br />
<strong>Study</strong> and d<strong>at</strong>e Methods Average r<strong>at</strong>io,<br />
Al to Fe<br />
Std.<br />
dev.<br />
BRAVO, 1999 PIXE vs 0.99 0.04<br />
S-XRF<br />
BRAVO, 1999 CNL XRF vs<br />
S-XRF<br />
FACES, 2001 ARB XRF vs<br />
S-XRF<br />
FACES, 2001 ARB RAAS<br />
vs S-XRF<br />
ARB LTAD 2005 DRI XRF vs<br />
S-XRF<br />
Average r<strong>at</strong>io,<br />
Cu to Pb<br />
Std.<br />
dev.<br />
1.24 0.14<br />
0.93 0.21 1.02 0.08<br />
(0.98) 0.27 (0.74) 0.23<br />
1.037 0.085 0.907 0.009<br />
All prior studies Average 0.984 0.15 0.977 0.115<br />
The S-XRF system has been tested in blind inter-comparisons since 1999, and all<br />
of these are shown above. Typically 32 elements are recorded for each analysis, all of<br />
which can be traced back to NIST primary (SRM # 1832, SRM # 1833) or secondary<br />
(Microm<strong>at</strong>ter thin film) standards. Over 250,000 S-XRF analyses have been done by the<br />
DELTA Group since completion of the system in 1999.<br />
The sensitivity of S-XRF is typically about 10 x better than standard XRF since<br />
the polarized x-rays elimin<strong>at</strong>e over 90% of the x-ray background and the beam intensity<br />
is almost unlimited. This allows the standard analysis dur<strong>at</strong>ion of 30 seconds to achieve a<br />
sensitivity for a DRUM sampler of about 0.01 ng/m 3 for elements between titanium and<br />
bromine, and roughly 0.03 ng/m 3 for most other elements reported. Below we show the<br />
MDLs for the RRAMP program, Stage 8 (0.26 to 0.09 µm diameter) of the 8 DRUM<br />
impactor.<br />
S-XRF analysis of<br />
RRAMP<br />
Elements MDLs (ng/m 3 ) Elements MDLs (ng/m 3 )<br />
Sodium 2.0 Cobalt 0.02<br />
Magnesium 0.14 Nickel 0.02<br />
Aluminum 0.09 Copper 0.03<br />
Silicon 0.15 Zinc 0.05<br />
Phosphorus 0.20 Gallium 0.001<br />
Sulfur 0.20 Arsenic 0.001<br />
Chlorine 0.02 Selenium 0.002<br />
Potassium 0.02 Bromine 0.005<br />
Calcium 0.05 Rubidium 0.01<br />
Titanium 0.015 Strontium 0.02<br />
Vanadium 0.003 Yttrium 0.15<br />
Chromium 0.003 Zirconium 0.15<br />
Manganese 0.005 Molybdenum 0.25<br />
Iron 0.05 Lead 0.15<br />
89
Minimum detected limits for organic analyses are a much more complex problem<br />
for organics than for elements due to the need for complex particle analysis protocols and<br />
presence of interferences. However, with the use of isotopically labeled organic<br />
compounds introduced <strong>at</strong> the very beginning of the analytical process, robust values have<br />
been achieved for RRAMP.<br />
Minimum detectable limits (pg/m 3 ) of particul<strong>at</strong>e PAHs observed <strong>at</strong> the <strong>Roseville</strong> Rail<br />
Yard in the Summer of 2005. The MDL is for a single stage (or filter) since the chemical<br />
needs to be detected on only one stage to be detected for the whole sampling period.<br />
Compound<br />
8-stage DRUM<br />
Sampler<br />
Lundgren<br />
Sampler<br />
Phenanthrene 2.8 1.4<br />
Anthracene 7.9 3.9<br />
1-methylphenanthrene 0.61 0.30<br />
Fluoranthene 1.3 0.65<br />
Pyrene 1.5 0.72<br />
Benz[a]anthracene<br />
a<br />
a<br />
Chrysene + triphenylene 8.9 4.4<br />
Benzo [b+k]fluoranthene 3.5 1.7<br />
Benzo[e]pyrene 0.69 0.34<br />
Benzo[a]pyrene 0.71 0.35<br />
Perylene 4.4 2.2<br />
Indo[1,2,3-cd]pyrene 4.0 1.9<br />
Dibenz[a,h]anthracene 2.7 1.3<br />
Benzo[g,h,i]perylene 3.2 1.6<br />
Coronene 5.5 2.7<br />
a Compound not reported due to an interference.<br />
90
Appendix B<br />
Delta Group DRUM Public<strong>at</strong>ions<br />
History: The <strong>Air</strong> <strong>Quality</strong> Group (AQG, 1971 – 1997) and the Detection and<br />
Evalu<strong>at</strong>ion in Long-range Transport of Aerosols (DELTA Group, 1997 – present) have<br />
always preferred on fundamental and scientific grounds to perform experiments with<br />
continuous sampling of size and compositionally resolved aerosols. The samplers used<br />
have varied in time (typical time resolutions have and can be varied <strong>at</strong> will):<br />
1. Lundgren sampler 1972-1974 , thereafter 5 stages, slots, 4 hr resolution, 160<br />
L/min<br />
2. Multiday sampler 1973 – 1981 3 stages, slots, 24 hr resolution 35<br />
L/min<br />
3. DRUM samplers<br />
a. Jetted 8 DRUM 1985 – 1995 8 stages, jets, 3 hr resolution, 1.0<br />
L/min<br />
b. DELTA 8 DRUM 1996 – 8 stages, slots, 3 hr resolution 10.0<br />
L/min<br />
c. DELTA 8 DRUM, 2001 – 8 stages, slots, 3 hr resolution 16.7<br />
L/min<br />
d. DELTA 3 DRUM, 2001 – 3 stages, slots, 3 hr resolution 22.5<br />
L/min<br />
e. 8 DRUM upgrade, 2005 – 8 stages, slots, 3 hr resolution 16.7<br />
L/min<br />
The public<strong>at</strong>ions below are roughly separ<strong>at</strong>ed by instrument in inverse<br />
chronological order. The numbers are the identifiers in the Master AQG/DELTA master<br />
public<strong>at</strong>ion list<br />
Public<strong>at</strong>ions from DRUM samplers (slotted, 3 and 8 stage, types b through e)<br />
04-4 Cahill, T. A., Cliff, S.S., Shackelford, J.F., Meier, M., Dunlap, M., Perry, K.D.,<br />
Bench, G., and Leifer, R. Very fine aerosols from the World Trace Center<br />
collapse piles: Anaerobic inciner<strong>at</strong>ion? ACS Symposium Series 919, 152-163<br />
(2005)<br />
04-3 Seinfeld, J.H., Carmichael, G.R., Arimoto, R, Conant, W. C., Brechtel, F. J.,<br />
B<strong>at</strong>es, T. S., Cahill, T. A., Clarke, A.D., Fl<strong>at</strong>au, B.J., Huebert, B.J., Kim, J.,<br />
Markowicx, K.M., Masonis, S.J., Quinn, P.K., Russell, L.M., Russell, P.B.,<br />
Shimizu, A., Shinozuka, Y., Song, C.H., Tang, Y., Uno, I., Vogelmann, A.M.,<br />
Weber, R.J., Woo, J-H., Zhang, Y. ACE-Asia: Regional Clim<strong>at</strong>ic and<br />
Atmospheric Chemical Effects of Asian Dust and Pollution, Bulletin American<br />
Meteorological Society 85 (3): 367+ MARCH 2004<br />
04-2 Han, J.S, K.J. Moon, J.Y. Ahn, Y.D. Hong, Y.J Kim, S. Y. Rhu, Steven S. Cliff,<br />
and Thomas A. Cahill, Characteristics of Ion Components and Trace Elements of<br />
Fine Particles <strong>at</strong> Gosan, Korea in Spring Time from 2001 to 2002, Environmental<br />
Monitoring and Assessment 00: 1-21, 2003<br />
91
04-1 Thomas A. Cahill, Steven S. Cliff, Michael Jimenez-Cruz, James F. Shackelford,<br />
Michael Dunlap, Michael Meier, Peter B. Kelly, Sarah Riddle, Jodye Selco,<br />
Graham Bench, P<strong>at</strong>rick Grant, Dawn Ueda, Kevin D. Perry, and Robert Leifer,<br />
Analysis of Aerosols from the World Trade Center Collapse Site, New York,<br />
October 2 to October 30, 2001. Aerosol Science and Technology 38; 165–183<br />
(2004)<br />
03-1 Cahill, C.F. Asian Aerosol Transport to Alaska during ACE-Asia. J. Geophys.<br />
Res. J. Geophys. Res., 108 (D23), 8664 (2003)<br />
03-4 Reuter, John E., Cahill, Thomas A., Cliff, Steven S., Goldman, Charles R.,<br />
Heyvaert, Alan C., Jassby, Alan D., Lindstrom, Susan, and Rizzo, Davis M., An<br />
Integr<strong>at</strong>ed W<strong>at</strong>ershed Approach to <strong>Study</strong>ing Ecosystem health <strong>at</strong> Lake Tahoe,<br />
CA-NV, in Managing for Healthy Ecosystems Rapport et al, ed., CRC Press, New<br />
York, 1283-1298 (2003)<br />
01-1 V. Shutthanandan, S. Thevuthasan, R. Disselkamp, A. Stroud, A. Cavanaugh, E.M.<br />
Adams, D.R. Baer, L. Barrie, S.S. Cliff, T.A. Cahill. Development of PIXE,<br />
PESA and transmission ion microscopy capability to measure aerosols by size and<br />
time. 2001 Nuclear Instruments and Methods in Physics Research B: Beam<br />
Interactions with M<strong>at</strong>erials and Atoms.<br />
01-4 Graham Bench, P.G. Grant, D. Ueda, S.S. Cliff, K.D. Perry, and T. A. Cahill. The<br />
use of STIM and PESA to respectively measure profiles of aerosol mass and<br />
hydrogen content across Mylar rot<strong>at</strong>ing drum impactor samples. 2001 Aerosol<br />
Science and Technology 36:642-651.<br />
00-1 Miller, Alan E. and Thomas A. Cahill. Size and compositional analyses of<br />
biologically active aerosols from a CO 2 and diode laser plume. 2000<br />
Intern<strong>at</strong>ional Journal of PIXE. Vol. 9, Nos. 3 & 4.<br />
99-3 Perry, Kevin D., Thomas A. Cahill, Russell C. Schnell, and Joyce M. Harris.<br />
Long-range transport of anthropogenic aerosols to the NOAA Baseline St<strong>at</strong>ion <strong>at</strong><br />
Mauna Loa Observ<strong>at</strong>ory, Hawaii. 1999 Journal of Geophysical Research<br />
Atmospheres. Vol. 104, No. D15, Pages 18,521-18,533.<br />
98-2 Pryor, S.C., R. J. Barthelmie, L. L. S. Geernaert, T. Ellerman, and K. Perry.<br />
Aerosols in the Western Baltic: Results from ASEPS ’97. Submitted to the 5 th<br />
Intern<strong>at</strong>ional Aerosol Conference, Edinburgh, 12-18 th September, 1998.<br />
97-1 Cahill, Thomas A., and Kevin D. Perry. Asian Transport of Aerosols to Mauna<br />
Loa Observ<strong>at</strong>ory, Spring. 1994 Clim<strong>at</strong>e Monitoring and Diagnostics Labor<strong>at</strong>ory,<br />
No. 23, Summary Report 1994-1995, U.S. Department of Commerce N<strong>at</strong>ional<br />
Oceanic and Atmospheric Administr<strong>at</strong>ion Environmental Research<br />
Labor<strong>at</strong>ories/CMDL 94-95, pp 114-116.<br />
Public<strong>at</strong>ions from DRUM samplers (jetted 8 drum, type a)<br />
97-8 Perry, Kevin, Cahill, T.A., Eldred, R. A., Dutcher, D.D, Gill, T.E. Long-range<br />
transport of North African dust to the eastern United St<strong>at</strong>es. 1996 Journal of<br />
Geophysical Research-Atmospheres, 102, D10, 11,225-11,238.<br />
97-10 Cahill, C<strong>at</strong>herine F., D.D Dutcher, P.H. Wakabayashi, M. Geever, and S.G.<br />
Jennings. 1997 The size-resolved chemical composition of n<strong>at</strong>ural and<br />
anthropogenic aerosols <strong>at</strong> Mace Head, Ireland. Proceedings of a Specialty<br />
92
Conference sponsored by <strong>Air</strong> & Waste Management Associ<strong>at</strong>ion and the<br />
American Geophysical Union. Visual <strong>Air</strong> <strong>Quality</strong>: Aerosol and Global Radi<strong>at</strong>ion<br />
Balance, Vol. I, pp. 487-497.<br />
97-11 Perry, Kevin D., T.A. Cahill, R.C. Schnell, J.M. Harris. 1997 Long-range<br />
transport of anthropogenic aerosols to the NOAA Baseline St<strong>at</strong>ion <strong>at</strong> Mauna Loa<br />
Observ<strong>at</strong>ory, Hawaii. Proceedings of a Specialty Conference sponsored by <strong>Air</strong> &<br />
Waste Management Associ<strong>at</strong>ion and the American Geophysical Union. Visual <strong>Air</strong><br />
<strong>Quality</strong>: Aerosol and Global Radi<strong>at</strong>ion Balance, Vol. I, pp. 130-139.<br />
97-16 Cahill, Thomas A., K.D. Perry, Dutcher, D.D, R.A. Eldred, D.E. Day. 1997<br />
Size/compositional profiles of aerosols <strong>at</strong> Gre<strong>at</strong> Smoky Mountains N<strong>at</strong>ional Park<br />
during SEAVS. Proceedings of a Specialty Conference sponsored by <strong>Air</strong> &<br />
Waste Management Associ<strong>at</strong>ion and the American Geophysical Union. Visual <strong>Air</strong><br />
<strong>Quality</strong>: Aerosol and Global Radi<strong>at</strong>ion Balance, Vol. II, pp. 1049-1056.<br />
96-6 T.A. Cahill, P, Wakabayashi, T. James. Chemical St<strong>at</strong>e of Sulf<strong>at</strong>e <strong>at</strong> Shenandoah<br />
N<strong>at</strong>ional Park During Summer 1991 Nuclear Instruments and Methods in<br />
Physics Research B: Beam Interactions with M<strong>at</strong>erials and Atoms, 109/110<br />
(1996) 542-547.<br />
95-4 Cahill, Thomas A. Compositional Analysis of Atmospheric Aerosols. 1995<br />
Particle-Induced X-Ray Emission Spectrometry, Edited by Sven A. E. Johansson,<br />
John L. Campbell, and Klas G. Malmqvist. Chemical Analysis Series, Vol. 133,<br />
pp. 237-311. John Wiley & Sons, Inc.<br />
94-5 Reid, Jeffrey S., Thomas A. Cahill, and Micheal R. Dunlap.<br />
Geometric/aerodynamic equivalent diameter r<strong>at</strong>ios of ash aggreg<strong>at</strong>e aerosols<br />
collected in burning Kuwaiti well fields. 1994 Atmospheric Environment, Vol.28,<br />
No. 13, pp. 2227-2234.<br />
93-1 Cahill, Thomas A. and Paul Wakabayashi. Compositional analysis of sizesegreg<strong>at</strong>ed<br />
aerosol samples. Chapter in the ACS book Measurement Challenges<br />
in Atmospheric Chemistry. Leonard Newman, Editor. Chapter 7, Pp. 211-228<br />
(1993).<br />
90-1 Hering, Susanne V., Bruce R. Appel, W. Cheng, F. Salaymeh, Steven H. Cadle,<br />
P<strong>at</strong>ricia A. Mulawa, Thomas A. Cahill, Robert A. Eldred, Marcelle Surovik,<br />
Dennis Fitz, James E. Howes, Kenneth T. Knapp, Leonard Stockburger, Barbara J.<br />
Turpin, James J. Huntzicker, Xin-Qui Zhang, and Peter H. McMurry. Comparison<br />
of sampling methods for carbonaceous aerosols in ambient air. Aerosol Science<br />
and Technology. 12:200-213 (1990).<br />
90-2 Cahill, Thomas A., Marcelle Surovik, and Ian Wittmeyer. Visibility and aerosols<br />
during the 1986 carbonaceous species methods comparison study. Aerosol<br />
Science and Technology. 12:149-160 (1990).<br />
90-5 Cahill, Thomas A. Analysis of air pollutants by PIXE: The second decade.<br />
Nuclear Instruments and Methods in Physics Research, North-Holland. B49:345-<br />
350 (1990).<br />
88-1 Raabe, Otto G., David A. Bra<strong>at</strong>en, Richard L. Axelbaum, Stephen V. Teague, and<br />
Thomas A. Cahill. Calibr<strong>at</strong>ion Studies of the DRUM Impactor. Journal of<br />
Aerosol Science. 19.2:183-195 (1988).<br />
93
88-2 Cahill, Thomas A. Investig<strong>at</strong>ion of particul<strong>at</strong>e m<strong>at</strong>ter by size and composition<br />
during WATOX, January 1986. Global Biogeochemical Cycles. 2.1:47-55, Paper<br />
No. 8J0052, March (1988).<br />
88-4 Cahill, Thomas A., Marcelle Surovik, Robert A. Eldred, P<strong>at</strong>rick J. Feeney, and<br />
Nehz<strong>at</strong> Motallebi. Visibility and particul<strong>at</strong>e size <strong>at</strong> the 1986 "Carbon Shoot-out"<br />
and 1987 "WHITEX" programs. Proceedings of the <strong>Air</strong> Pollution Control<br />
Associ<strong>at</strong>ion 81st Annual Meeting. Dallas, TX, June 19-24. Paper No.<br />
88-54.2:1-20 (1988).<br />
88-7 Annegarn, H.J., T.A. Cahill, JPF Sellschop, and A. Zucchi<strong>at</strong>ti. Time sequence<br />
particul<strong>at</strong>e sampling and nuclear analysis. Adri<strong>at</strong>ico Research Conference on<br />
Aerosols. Trieste, Italy, July 22-25, 1986. Physica Scripta. 37:282-290 (1988).<br />
87-4 Annegarn, H., Zucchi<strong>at</strong>ti, A., Sellschop, J., Booth-Jones, P. PIXE characteriz<strong>at</strong>ion<br />
of airborne dust in the mining environment. Fourth Intern<strong>at</strong>ional PIXE<br />
Conference, Tallahassee, FL, June 9-13, 1986. Nuclear Instruments and Methods<br />
in Physics Research. B22:289-295 (1987).<br />
87-7 Cahill, Thomas A., P<strong>at</strong>rick J. Feeney, and Robert A. Eldred. Size-time<br />
composition profile of aerosols using the drum sampler. Fourth Intern<strong>at</strong>ional<br />
PIXE Conference. Tallahassee, FL, June 9-13, 1986. Nuclear Instruments and<br />
Methods in Physics Research. B22:344-348 (1987).<br />
87-9 Feeney, P.J., T.A. Cahill, H.J. Annegarn, R. Dixon, and P. Beveridge. Solarpowered<br />
aerosol samplers for use with PIXE analysis. Fourth Intern<strong>at</strong>ional PIXE<br />
Conference. Tallahassee, FL, June 9-13, 1986. Nuclear Instruments and Methods<br />
in Physics Research. B22:349-352 (1987).<br />
87-13 Eldred, Robert A., Thomas A. Cahill, P<strong>at</strong>rick J. Feeney, and William C. Malm.<br />
Regional p<strong>at</strong>terns in particul<strong>at</strong>e m<strong>at</strong>ter from the N<strong>at</strong>ional Park Service network,<br />
June 1982 to May 1986. In Transactions TR-10; Visibility Protection: Research<br />
and Policy Aspects. P. Bhardwaja, Editor. Pittsburgh, PA: APCA, Pp. 386-396<br />
(1987).<br />
87-14 Cahill, Thomas A., P<strong>at</strong>rick J. Feeney, Robert A. Eldred, and William C. Malm.<br />
Size/time/composition d<strong>at</strong>a <strong>at</strong> Grand Canyon N<strong>at</strong>ional Park and the role of<br />
ultrafine sulfur particles. In Transactions TR-10; Visibility Protection: Research<br />
and Policy Aspects. P. Bhardwaja, Editor. Pittsburgh, PA: APCA, Pp. 657-667<br />
(1987).<br />
86-1 Bra<strong>at</strong>en, D.A. and T.A. Cahill. Size and composition of Asian dust transported to<br />
Hawaii. Atmospheric Environment (Gre<strong>at</strong> Britain). 20:1105-1109 (1986).<br />
86-7 Cahill, T.A. Physical methods in air pollution research: The second decade.<br />
Physics in Environmental and Biomedical Research. S. Onori and E. Tabet,<br />
Editors. World Scientific Pub. Co., Pp. 55-61 (1986).<br />
85-3 Cahill, T.A., C. Goodart, J.W. Nelson, R.A. Eldred, J.S. Nasstrom, and P.J.<br />
Feeney. Design and evalu<strong>at</strong>ion of the drum impactor. Proceedings of<br />
Intern<strong>at</strong>ional Symposium on Particul<strong>at</strong>e and Multi-phase Processes. Teoman<br />
Ariman and T. Nej<strong>at</strong> Veziroglu, Editors. Hemisphere Publishing Corpor<strong>at</strong>ion,<br />
Washington, D.C. 2:319-325. (1985).<br />
94
Public<strong>at</strong>ions from the Multiday 2 drum sampler (plus afterfilter)<br />
90-11 Motallebi, Nehz<strong>at</strong>, Thomas A. Cahill, and Robert G. Flocchini. Influence of<br />
particul<strong>at</strong>e size on st<strong>at</strong>istical studies of visibility <strong>at</strong> California regions. Atmosfera.<br />
Pp. 111-126 (1990).<br />
90-12 Motallebi, Nehz<strong>at</strong>, Robert G. Flocchini, Leonard O. Myrup, and Thomas A. Cahill.<br />
A principal component analysis of visibility and air pollution in six California<br />
cities. Atmosfera. Pp. 127-141 (1990).<br />
82-3 Cahill, T.A. and D.A. Bra<strong>at</strong>en. Size characteristics of Asian dust sampled <strong>at</strong><br />
Mauna Loa Observ<strong>at</strong>ory. Geophysical Monitoring for Clim<strong>at</strong>ic Change. J. Harris<br />
and B. Bodhaine, Editors. Summary Report No. 11 (1982).<br />
81-1 Flocchini, R.G., T.A. Cahill, Marc L. Pitchford, R.A. Eldred, P.J. Feeney, and L.L.<br />
Ashbaugh. Characteriz<strong>at</strong>ion of particles in the arid West. Atmospheric<br />
Environment. 15:2017-2030 (1981).<br />
81-3 Cahill, Thomas A. Innov<strong>at</strong>ive aerosol sampling devices based upon PIXE<br />
capabilities. Nuclear Instruments and Methods. 181:473-480 (1981).<br />
81-4 Cahill, Thomas A. Ion beam analysis of environmental samples. Symposium on<br />
<strong>Recent</strong> Developments in Biological and Chemical Research with Short Lived<br />
Radioisotopes. American Chemical Society Meeting. Honolulu, Hawaii, 1979.<br />
Short-Lived Radionuclides in Chemistry and Biology. John W. Root and Kenneth<br />
A. Krahn, Editors. No. 27:511-522. Advances in Chemistry Series, No. 197<br />
(1981).<br />
81-6 Leifer, R., L. Hinchliffe, I. Fisenne, H. Franklin, E. Knutson, M. Olden, W.<br />
Sedlacek, E. Mroz, T. Cahill. Measurements of the str<strong>at</strong>ospheric plume from the<br />
Mount St. Helens eruption: Radioactivity and chemical composition. Science.<br />
214:904-907 (1981).<br />
81-7 Cahill, T.A., B.H. Kusko, L.L. Ashbaugh, J.B. Barone, R.A. Eldred, and E.G.<br />
Walther. Regional and local determin<strong>at</strong>ions of particul<strong>at</strong>e m<strong>at</strong>ter and visibility in<br />
the southwestern United St<strong>at</strong>es during June and July, 1979. Symposium on<br />
Plumes and Visibility. Grand Canyon, AZ, 1980. Atmospheric Environment.<br />
15:2011-2016 (1981).<br />
81-8 Pitchford, A., Pitchford, M., Malm, W., Flocchini, R., Cahill, T., Walther, E.<br />
Regional analysis of factors affecting visual air quality. Symposium on Plumes<br />
and Visibility. Grand Canyon, AZ, 1980. Atmospheric Environment.<br />
15:2043-2054 (1981).<br />
81-9 Macias, E.S., J.O. Zwicker, J.R. Ouimette, S.V. Hering, S.K. Friedlander, T.A.<br />
Cahill, G.A. Kuhlmey, and L.W. Richards. Regional haze in the southwestern US,<br />
II: Source Composition. Symposium on Plumes and Visibility. Grand Canyon,<br />
AZ, 1980. Atmospheric Environment. 15:1971-1986 (1981).<br />
81-10 Flocchini, R., Cahill, T., Ashbaugh, L., Eldred, R., Feeney, P., Shadoan, D.<br />
Regional scale synoptic air monitoring for visibility evalu<strong>at</strong>ion based on PIXE<br />
analyses. Nuclear Instruments and Methods. 181:407-410 (1981).<br />
81-11 Flocchini, Robert G., Thomas A. Cahill, Lowell L. Ashbaugh, Robert A. Eldred,<br />
and Marc Pitchford. Seasonal behavior of particul<strong>at</strong>e m<strong>at</strong>ter <strong>at</strong> three rural Utah<br />
sites. Atmospheric Environment. 15:315-320 (1981).<br />
95
81-12 Pitchford, Marc, Robert G. Flocchini, Ronald G. Draftz, Thomas A. Cahill,<br />
Lowell L. Ashbaugh, and Robert A. Eldred. Silicon in submicron particles in the<br />
Southwest. Atmospheric Environment. 15:321-333 (1981).<br />
81-13 Cahill, T.A. Size-chemical profiles of environmental samples by PIXE.<br />
Proceedings of the American Nuclear Society Meeting. San Francisco, CA. IEEE<br />
Series: Terrestrial and Extr<strong>at</strong>errestrial Radi<strong>at</strong>ion II. Pp. 71-73 (1981).<br />
81-15 Barone, J.B., L.L. Ashbaugh, B.H. Kusko, and T.A. Cahill. The effect of Owens<br />
Dry Lake on air quality in the Owens Valley with implic<strong>at</strong>ions for the Mono Lake<br />
area. Atmospheric Aerosol: Source/<strong>Air</strong> <strong>Quality</strong> Rel<strong>at</strong>ionships. P. Radke, Editor.<br />
No. 18:327-346. ACS Symposium Series, No. 167 (1981).<br />
81-16 Cahill, Thomas A., Lowell L. Ashbaugh, and Bruce Kusko. Size-elemental<br />
profiles of fine particul<strong>at</strong>e m<strong>at</strong>ter <strong>at</strong> Mauna Loa and Hilo, Hawaii. Geophysical<br />
Monitoring for Clim<strong>at</strong>ic Change. J.J. DeLuisi, Editor. Summary Report No. 9,<br />
December, P. 103 (1981).<br />
80-3 Cahill, T.A., J. Barone, R.A. Eldred, R.G. Flocchini, D.J. Shadoan, and T.M.<br />
Dietz. Influence of sulfur size distribution on optical extinction. Environmental<br />
and Clim<strong>at</strong>ic Impact of Coal Utiliz<strong>at</strong>ion. J.J. Singh and A. Deepak, Editors.<br />
Academic Press, Pp. 213-244 (1980).<br />
80-4 Cahill, T.A. Proton microprobes and particle-induced x-ray analytical systems.<br />
Annual Reviews Nuclear and Particle Science. 30:211-252 (1980).<br />
79-2 Cahill, Thomas A. Comments on surface co<strong>at</strong>ings for lundgren-type impactors.<br />
Aerosol Measurement. Dale A. Lundgren, Editor. University Presses of Florida,<br />
Pp. 131-134 (1979).<br />
78-2 Eldred, Robert A., Thomas A. Cahill, and Robert G. Flocchini. Bromine loss<br />
from automotive particul<strong>at</strong>es <strong>at</strong> California sites. Proceedings of the 71st Annual<br />
Meeting of the <strong>Air</strong> Pollution Control Associ<strong>at</strong>ion. June 25-30. Paper No.<br />
78-69.6:2-15 (1978).<br />
78-3 Wesolowski, J.J., W. John, W. Devor, T.A. Cahill, P.J. Feeney, G. Wolfe, R.<br />
Flocchini. Collection surfaces of cascade impactors. In X-ray fluorescence<br />
analysis of environmental samples. Dzubay, T., Editor. Ann Arbor Science, Pp.<br />
121-130 (1978).<br />
78-8 Flocchini, Robert G., Thomas A. Cahill, Robert A. Eldred, Lowell L. Ashbaugh,<br />
and John B. Barone. Sulfur size distribution by season and site in California.<br />
Proceedings of the 71st Annual Meeting of the <strong>Air</strong> Pollution Control Associ<strong>at</strong>ion.<br />
Houston, TX, June 25-30. Paper No. 78-39.6:3-15 (1978).<br />
77-4 Cahill, Thomas A. X-ray analysis of environmental pollutants. Environmental<br />
Pollutants. T.Y. Toribara et al., Editors. Plenum Press, Pp. 457-463 (1977).<br />
76-3 Flocchini, Robert G., Thomas A. Cahill, Danny J. Shadoan, Sandra J. Lange,<br />
Robert A. Eldred, P<strong>at</strong>rick J. Feeney, Gordon W. Wolfe, Dean C. Simmeroth, and<br />
Jack K. Suder. Monitoring California's aerosols by size and elemental composition.<br />
Environmental Science and Technology. 10:76-82 (1976).<br />
76-4 Cahill, T.A., R.G. Flocchini, R.A. Eldred, P.J. Feeney, S. Lange, D. Shadoan, and<br />
G. Wolfe. Monitoring of smog aerosols with elemental analysis by acceler<strong>at</strong>or<br />
beams. Proceedings of the 17th M<strong>at</strong>erials Research Symposium. Gaithersburg,<br />
MD, October 7-11, 1974. N<strong>at</strong>ional Bureau of Standards Special Public<strong>at</strong>ion,<br />
422:1119-1136 (1976).<br />
96
Public<strong>at</strong>ions from Lundgren 4 drum sampler (plus afterfilter)<br />
80-5 Cahill, T.A. and L.L. Ashbaugh. Size/composition profiles of resuspended fly ash.<br />
Environmental and Clim<strong>at</strong>ic Impact of Coal Utiliz<strong>at</strong>ion. J.J. Singh and A. Deepak,<br />
Editors. Academic Press, Pp. 569-573 (1980).<br />
78-5 Cahill, Thomas A. Results of highway particul<strong>at</strong>e investig<strong>at</strong>ions in California.<br />
Proceedings Federal Highway Administr<strong>at</strong>ion Symposium on Environmental<br />
Impacts of Highway Transport<strong>at</strong>ion. Charlottesville, VA. (1978).<br />
75-2 Feeney, P.J., T.A. Cahill, R.G. Flocchini, R.A. Eldred, D.J. Shadoan, and T. Dunn.<br />
Effect of roadbed configur<strong>at</strong>ion on traffic derived aerosols. Journal of the <strong>Air</strong><br />
Pollution Control Associ<strong>at</strong>ion. 25:1145-1147 (1975).<br />
75-3 Ensor, D.S, T.A. Cahill, and L.E. Sparks. Elemental analysis of fly ash from<br />
combustion of a low sulfur coal. Proceedings of the 68th Annual Meeting-<strong>Air</strong><br />
Pollution Control Associ<strong>at</strong>ion. Boston, MA. Paper No. 75-33.7:1-18 (1975).<br />
75-5 Cahill, Thomas A. Ion-excited x-ray analysis of environmental samples. Chapter<br />
1 of New uses for ion acceler<strong>at</strong>ors. James Ziegler, Editor. Plenum Press, Pp.<br />
1-72 (1975).<br />
74-4 Azevedo, J., R.G. Flocchini, T.A. Cahill, and P.R. Stout. Elemental composition<br />
of particul<strong>at</strong>es near a beef c<strong>at</strong>tle feedlot. Journal of Environmental <strong>Quality</strong>.<br />
3:171-174 (1974).<br />
74-5 Cahill, T.A., R.G. Flocchini, R.A. Eldred, P.J. Feeney, S. Lange, D. Shadoan, and<br />
G. Wolfe. Use of ion beams for monitoring California's aerosols. Proceedings of<br />
the 2nd Annual NSF-RANN Trace Contaminants Conference. Asilomar, Pacific<br />
Grove, CA. Paper No. LBL-32l7:133-134 (1974).<br />
97