#*+,-*.+/0*.1& 02-/34&567;,*8/+2-,&/*&'/9+0-/.&
#*+,-*.+/0*.1& 02-/34&567;,*8/+2-,&/*&'/9+0-/.&
#*+,-*.+/0*.1& 02-/34&567;,*8/+2-,&/*&'/9+0-/.&

Create successful ePaper yourself
Turn your PDF publications into a flip-book with our unique Google optimized e-Paper software.
T O U R I S M V I C T O R I A<br />
International Tourism Expenditure in Victoria<br />
Year ending June 2008-2012<br />
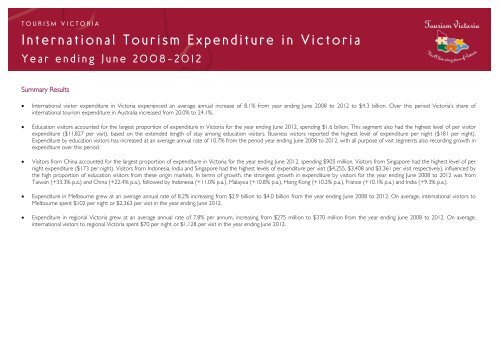
Summary Results<br />
<br />
<br />
<br />
<br />
<br />
International visitor expenditure in Victoria experienced an average annual increase of 8.1% from year ending June 2008 to 2012 to $4.3 billion. Over this period Victoria’s share of<br />
international tourism expenditure in Australia increased from 20.0% to 24.1%.<br />
Education visitors accounted for the largest proportion of expenditure in Victoria for the year ending June 2012, spending $1.6 billion. This segment also had the highest level of per visitor<br />
expenditure ($11,827 per visit), based on the extended length of stay among education visitors. Business visitors reported the highest level of expenditure per night ($181 per night).<br />
Expenditure by education visitors has increased at an average annual rate of 10.7% from the period year ending June 2008 to 2012, with all purpose of visit segments also recording growth in<br />
expenditure over this period.<br />
Visitors from China accounted for the largest proportion of expenditure in Victoria for the year ending June 2012, spending $905 million. Visitors from Singapore had the highest level of per<br />
night expenditure ($173 per night). Visitors from Indonesia, India and Singapore had the highest levels of expenditure per visit ($4,255, $3,408 and $3,361 per visit respectively), influenced by<br />
the high proportion of education visitors from these origin markets. In terms of growth, the strongest growth in expenditure by visitors for the year ending June 2008 to 2012 was from<br />
Taiwan (+33.3% p.a.) and China (<strong>+2</strong>2.4% p.a.), followed by Indonesia (+11.0% p.a.), Malaysia (+10.8% p.a.), Hong Kong (+10.2% p.a.), France (+10.1% p.a.) and India (+9.3% p.a.).<br />
Expenditure in Melbourne grew at an average annual rate of 8.2% increasing from $2.9 billion to $4.0 billion from the year ending June 2008 to 2012. On average, international visitors to<br />
Melbourne spent $1<strong>02</strong> per night or $2,363 per visit in the year ending June 2012.<br />
Expenditure in regional Victoria grew at an average annual rate of 7.8% per annum, increasing from $275 million to $370 million from the year ending June 2008 to 2012. On average,<br />
international visitors to regional Victoria spent $70 per night or $1,128 per visit in the year ending June 2012.
T O U R I S M V I C T O R I A<br />
International Tourism Expenditure in Victoria<br />
Year ending June 2008-2012<br />
International Expenditure in Victoria by Purpose of Visit<br />
Total Expenditure<br />
Expenditure Per Night<br />
Expenditure Per Visitor<br />
Expenditure by International Visitors in Victoria<br />
Ave Ann<br />
Yearly<br />
($ million) Change Change<br />
($)<br />
($)<br />
2008 2011 2012 2008-12 2011-12 2008 2011 2012 2008 2011 2012<br />
Holiday 864 899 1,078 +5.7% p.a. 19.8% 1<strong>02</strong> 93 96 1,213 1,146 1,309<br />
VFR 542 751 788 +9.8% p.a. 5.0% 93 88 83 1,697 1,835 1,886<br />
Business 450 530 509 +3.1% p.a. -4.1% 180 190 181 1,653 1,905 1,776<br />
Education 1,048 1,645 1,577 +10.7% p.a. -4.1% 1<strong>02</strong> 112 117 10,173 11,913 11,827<br />
Other 256 335 367 +9.4% p.a. 9.8% 57 58 52 3,005 3,178 3,180<br />
Total 3,169 4,164 4,331 +8.1% p.a. 4.0% 100 100 98 2,124 2,427 2,437<br />
Note 1: Figures may not add to the total due to rounding<br />
Note 2: Visitor expenditure includes expenditure on packages attributable to destination<br />
Source: Tourism Research Australia expenditure allocation method applied to year ending June 2008 to 2012 International Visitor Survey data.
T O U R I S M V I C T O R I A<br />
International Tourism Expenditure in Victoria<br />
Year ending June 2008-2012<br />
International Expenditure in Victoria by Origin Market<br />
Expenditure by International<br />
Total Expenditure<br />
Ave Ann<br />
Visitors in Victoria<br />
($ million)<br />
Change Change<br />
$<br />
$<br />
Year Ending June 2008 2011 2012 2008-12 2011-12 2008 2011 2012 2008 2011 2012<br />
Strong Growth Markets<br />
China 404 838 905 <strong>+2</strong>2.4% p.a. 8.0% 97 104 115 2,460 3,799 3,230<br />
India 154 320 220 +9.3% p.a. -31.4% 85 83 59 4,148 5,091 3,408<br />
Indonesia 115 168 175 +11.0% p.a. 4.3% 108 96 153 4,166 4,279 4,255<br />
Core Markets<br />
Malaysia 201 315 304 +10.8% p.a. -3.6% 124 135 147 4,069 3,415 3,350<br />
Singapore 241 293 281 +3.9% p.a. -4.0% 157 172 173 3,797 3,274 3,361<br />
New Zealand 330 328 333 +0.3% p.a. 1.7% 134 137 131 1,413 1,268 1,250<br />
UK 327 287 286 -3.3% p.a. -0.2% 93 76 84 1,535 1,396 1,556<br />
USA 219 200 218 -0.1% p.a. 9.1% 125 121 117 1,624 1,566 1,627<br />
Rest of World Markets<br />
Hong Kong 105 143 156 +10.2% p.a. 8.6% 101 122 108 2,727 3,018 3,261<br />
Thailand 1<strong>02</strong> 129 78 -6.5% p.a. -39.4% 108 116 103 4,529 4,184 3,301<br />
Korea 108 1<strong>02</strong> 138 +6.3% p.a. 35.3% 82 82 84 2,577 2,861 3,079<br />
Japan 92 61 85 -1.8% p.a. 41.0% 66 73 76 1,659 1,704 2,231<br />
Taiwan 37 74 115 +33.3% p.a. 56.8% 72 109 76 1,767 3,014 3,224<br />
Germany 85 71 92 +1.8% p.a. 28.4% 100 76 82 1,343 1,220 1,442<br />
Nordic 39 53 42 <strong>+2</strong>.5% p.a. -20.4% np 100 np 1,461 1,767 1,572<br />
Canada 69 62 78 +3.1% p.a. 25.9% 90 89 89 1,677 1,617 2,056<br />
France 43 60 63 +10.1% p.a. 4.5% 63 72 59 1,612 1,895 1,939<br />
Italy 35 35 47 +7.6% p.a. 37.3% np 56 69 1,703 1,380 1,869<br />
Netherlands 25 27 24 -0.6% p.a. -9.8% np np np 1,337 1,248 1,381<br />
TOTAL 3,169 4,164 4,331 +8.1% p.a. 4.0% 100 100 98 2,124 2,427 2,437<br />
Yearly<br />
Expenditure Per Night<br />
‘np’ denotes estimates not published by Tourism Research Australia<br />
Note 1: Figures may not add to the total due to rounding<br />
Note 2: Visitor expenditure includes expenditure on packages attributable to destination<br />
Source: Tourism Research Australia expenditure allocation method applied to year ending June 2008 to 2012 International Visitor Survey data.<br />
Expenditure Per Visitor
T O U R I S M V I C T O R I A<br />
International Tourism Expenditure in Victoria<br />
Year ending June 2008-2012<br />
International Expenditure in Regional Victoria<br />
Total Expenditure<br />
Expenditure Per Night Expenditure Per Visitor<br />
Nominal Expenditure by International<br />
Overnight Visitors in Victoria<br />
($ million)<br />
Ave Ann<br />
Change<br />
Yearly<br />
Change<br />
$<br />
$<br />
Year Ending June 2008 2011 2012 2008-12 2011-12 2008 2011 2012 2008 2011 2012<br />
Total Victoria 3,169 4,164 4,331 +8.1% p.a. 4.0% 100 100 98 2,124 2,427 2,437<br />
Regional Victoria 275 295 370 +7.8% p.a. 25.8% 69 64 70 839 866 1,128<br />
Victoria's Campaign Regions<br />
Great Ocean Road 85 98 126 +10.2% p.a. 28.4% 104 86 103 533 578 810<br />
Melbourne 2,894 3,869 3,960 +8.2% p.a. 2.4% 105 105 1<strong>02</strong> 2,073 2,408 2,363<br />
Mornington Peninsula 51 53 37 -8.1% p.a. -30.6% 75 78 np 1,227 1,418 995<br />
Note 1: Figures may not add to the total due to rounding<br />
Note 2: Visitor expenditure includes expenditure on packages attributable to destination<br />
Note 3: Regions with all data suppressed in at least one of the sub-regions have been excluded from this table.<br />
Source: Tourism Research Australia expenditure allocation method applied to year ending June 2008 to 2012 International Visitor Survey data.<br />
Note that Tourism Research Australia has reviewed the modelled data and provided revised historical data.<br />
Therefore slight variations in expenditure can occur between this factsheet and previously released factsheets.<br />
Fact sheet produced by Tourism Victoria Research Unit, December 2012.