PIP Peanuts 2002 - OSU Fact Sheets - Oklahoma State University
PIP Peanuts 2002 - OSU Fact Sheets - Oklahoma State University
PIP Peanuts 2002 - OSU Fact Sheets - Oklahoma State University

Create successful ePaper yourself
Turn your PDF publications into a flip-book with our unique Google optimized e-Paper software.
Partners in<br />
rogress<br />
P artners E A N U T in S<br />
rogress<br />
P E A N U T S<br />
P artners in<br />
rogress<br />
P E A N U T S<br />
Peanut Research<br />
at <strong>OSU</strong> <strong>2002</strong><br />
Supported by the<br />
<strong>Oklahoma</strong> Peanut Commission<br />
National Peanut Board<br />
<strong>Oklahoma</strong> <strong>State</strong> <strong>University</strong><br />
Division of Agricultural Sciences<br />
and Natural Resources<br />
<strong>Oklahoma</strong> Agricultural Experiment Station<br />
<strong>Oklahoma</strong> Cooperative Extension Service<br />
In cooperation with<br />
U.S. Department of Agriculture -<br />
Agricultural Research Service<br />
P-994
P P<br />
artners in<br />
rogress<br />
P E A N U T S
P P<br />
artners in<br />
rogress<br />
P E A N U T S<br />
P artners in<br />
rogress<br />
P E A N U T S<br />
Peanut Research<br />
at <strong>OSU</strong> <strong>2002</strong><br />
Supported by the<br />
<strong>Oklahoma</strong> Peanut Commission<br />
National Peanut Board<br />
<strong>Oklahoma</strong> <strong>State</strong> <strong>University</strong><br />
Division of Agricultural Sciences and Natural Resources<br />
<strong>Oklahoma</strong> Agricultural Experiment Station<br />
<strong>Oklahoma</strong> Cooperative Extension Service<br />
In cooperation with<br />
U.S. Department of Agriculture - Agricultural Research Service<br />
P-994<br />
Printed on recycled paper using soy-based ink.<br />
The pesticide information presented in this publication was current with federal and state regulations at the time of printing. The user is<br />
responsible for determining that the intended use is consistent with the label of the product being used. Use pesticides safely. Read and<br />
follow label directions. The information given herein is for educational purposes only. Reference to commercial products or trade names is<br />
made with the understanding that no discrimination is intended and no endorsement by the Cooperative Extension Service is implied.<br />
<strong>Oklahoma</strong> <strong>State</strong> <strong>University</strong>, in compliance with Title VI and VII of the Civil Rights Act of 1964, Executive Order 11246 as amended, Title IX of the Education<br />
Amendments of 1972, Americans with Disabilities At of 1990, and other federal laws and regulations, does not discriminate on the basis of race, color, national<br />
origin, sex, age, religion, disability, or status as a veteran in any of its policies, practices, or procedures. This includes but is not limited to admissions, employment,<br />
financial aid, and educational services.<br />
This report of the <strong>Oklahoma</strong> Agricultural Experiment Station is printed and issued by <strong>Oklahoma</strong> <strong>State</strong> <strong>University</strong> as authorized by the Dean of the Division of<br />
Agricultural Sciences and Natural Resources and has been prepared and distributed at a cost of $2112.00 for 500 copies. 0303 JA.
P artners in<br />
rogress<br />
P E A N U T S<br />
Table of Contents<br />
Foreword ____________________________________________________________ 1<br />
Peanut Production Challenges Reinforce the Perfect Partnership ___________ 2<br />
Peanut Breeding______________________________________________________ 3<br />
Management of Arthropods in <strong>Peanuts</strong> _________________________________ 10<br />
Field Studies for the Control of Peanut Diseases _________________________ 26<br />
Development of Integrated Strategies for Management of Soilborne<br />
Peanut Diseases ________________________________________________ 38<br />
Identification of New Sources of Resistance to Sclerotinia<br />
Blight in <strong>Peanuts</strong> ________________________________________________ 43<br />
Management of Sclerotinia Blight and Verticillium Wilt in <strong>Peanuts</strong> __________ 48<br />
Research on Peanut Disease: Resistance to Sclerotinia<br />
and Southern Blights in <strong>Oklahoma</strong>_________________________________ 51<br />
Improving Resistance to Sclerotinia Blight in Four Selected<br />
Peanut Breeding Lines or Cultivars ________________________________ 53<br />
Results of Applied Research on <strong>Peanuts</strong>________________________________ 55<br />
i
Foreword<br />
P artners in<br />
rogress<br />
P E A N U T S<br />
This publication is the eighth in a<br />
series of annual reports from the <strong>OSU</strong><br />
Division of Agricultural Sciences and<br />
Natural Resources summarizing work<br />
supported by the <strong>Oklahoma</strong> Peanut<br />
Commission.<br />
In his opening comments, <strong>Oklahoma</strong><br />
Peanut Commission Executive Secretary<br />
Mike Kubicek describes the partnerships<br />
used to keep <strong>Oklahoma</strong> peanut producers<br />
viable in an ever changing market place.<br />
With these perfect partnerships, growers<br />
can rest assured that researchers are<br />
working to keep them competitive.<br />
Our Partners in Progress series is<br />
intended to highlight the most recent<br />
significant research and extension activities.<br />
With all the work accomplished, it is<br />
important to keep in mind that additional<br />
research and educational activity needs<br />
to come in the future if progress is to<br />
continue.<br />
In partnership with the <strong>Oklahoma</strong><br />
Peanut Commission and the National<br />
Peanut Board, we strive to conduct<br />
research that is directed toward the needs<br />
of the state’s producers. This report is just<br />
one way in which we communicate results<br />
to producers as rapidly as possible.<br />
D.C. Coston, Associate Director<br />
<strong>Oklahoma</strong> Agricultural Experiment Station<br />
Division of Agricultural Sciences and Natural Resources<br />
<strong>Oklahoma</strong> <strong>State</strong> <strong>University</strong><br />
<strong>Oklahoma</strong> <strong>State</strong> <strong>University</strong><br />
Division of Agricultural Sciences and Natural Resources<br />
Mission <strong>State</strong>ment<br />
The Mission of the <strong>Oklahoma</strong> <strong>State</strong> <strong>University</strong> Division of Agricultural Sciences<br />
and Natural Resources is to discover, develop, disseminate, and preserve knowledge<br />
needed to enhance the productivity, profitability, and sustainability of agriculture;<br />
conserve and improve natural resources; improve the health and well-being<br />
of all segments of our society; and to instill in its students the intellectual curiosity,<br />
discernment, knowledge, and skills needed for their individual development and<br />
contribution to society.<br />
1
P artners in<br />
rogress<br />
P E A N U T S<br />
Peanut Production Challenges<br />
Reinforce the Perfect Partnership<br />
Mike Kubicek, Executive Secretary<br />
<strong>Oklahoma</strong> Peanut Commission<br />
“And he gave it as his opinion, that<br />
whoever could make two ears of corn<br />
or two blades of grass grow upon a<br />
spot of ground where only one grew<br />
before, would deserve better of mankind,<br />
and do more essential service<br />
to his country,…than the whole race<br />
of politicians put together.”<br />
Jonathan Swift<br />
in Gulliver’s Travels<br />
In <strong>2002</strong>, the politicians changed the peanut<br />
production landscape with the passage<br />
and signing of the New Farm Bill. Farmers<br />
questioned, “Why would the U.S. government<br />
give up a peanut program that costs<br />
zero in taxes to launch a new marketing<br />
loan program that will cost taxpayers an estimated<br />
$350 million annually?” Secondly,<br />
and perhaps most importantly, “Who can<br />
afford to produce $355 peanuts in <strong>Oklahoma</strong><br />
under the new program, when it was<br />
tough to make it under the old program at<br />
$610?”<br />
Thus the “big challenge” is to maximize<br />
yields, while managing inputs, ultimately<br />
staying competitive and profitable. Profit<br />
or loss has always been a function of<br />
yield, price, and cost. All the more reason<br />
to reinforce the relationship of producers,<br />
the <strong>Oklahoma</strong> Peanut Commission, USDA,<br />
and <strong>Oklahoma</strong> <strong>State</strong> <strong>University</strong> researchers<br />
and extension educators – “the perfect<br />
partnership.”<br />
For almost four decades <strong>Oklahoma</strong>’s peanut<br />
producers have financially supported<br />
research and extension efforts aimed at<br />
improving their profitability and the quality<br />
of their product. The resulting technologies,<br />
variety development, and management<br />
recommendations have annually<br />
been published and willingly adopted by<br />
producers.<br />
The <strong>2002</strong> version of the Partners in Progress<br />
Report should be of interest to every<br />
producer since the challenge to remain viable<br />
appears to be more critical than ever<br />
before. USDA estimated that the <strong>2002</strong><br />
<strong>Oklahoma</strong> peanut crop set a record per<br />
acre yield of 2800 pounds, yet at the same<br />
time forecasted the total crop in the state<br />
to be the third smallest production in the<br />
past forty years. Not reported, of course,<br />
was the fact that hundreds of <strong>Oklahoma</strong><br />
producers opted not to plant last year because<br />
of the uncertainty in farming peanuts<br />
under the new program.<br />
What will the future hold for <strong>Oklahoma</strong> peanut<br />
producers? We are entering a new era<br />
for farmers who are able to be innovative<br />
and adopt new technologies for management<br />
and marketing strategies. Our USDA<br />
and <strong>University</strong> “peanut team” will continue<br />
to provide unbiased research and educational<br />
programs under more limited funding<br />
and personnel – all challenges for sure.<br />
Many changes have occurred that will continue<br />
to challenge the way we produce and<br />
market peanuts in the state. Rest assured,<br />
our peanut partners will continue to focus<br />
on efforts resulting in positive changes to<br />
improve <strong>Oklahoma</strong>’s peanut industry.<br />
2
Peanut Breeding<br />
K. E. Dashiell and B. E. Greenhagen, Plant and Soil Sciences<br />
N. O. Maness, Horticulture and Landscape Architecture<br />
H. A. Melouk, USDA/ARS<br />
P artners in<br />
rogress<br />
P E A N U T S<br />
<strong>2002</strong> progress made possible through OPC support<br />
• Tamrun 96, Tamrun OL 01, Tamrun OL 02, Spanco, and Tamspan 90 continue<br />
to be among the best varieties.<br />
• Results from irrigated and dryland trials indicate that varieties can be<br />
developed that will give high yields and require fewer irrigations or less<br />
water per irrigation.<br />
The major objectives of the peanut breeding<br />
project have been to develop high yielding,<br />
early maturing peanut cultivars with resistance<br />
to Sclerotinia blight and improved<br />
post harvest characteristics for <strong>Oklahoma</strong>.<br />
Emphasis is on the development of runner<br />
and Spanish market types.<br />
Compared to one year ago, the prices<br />
<strong>Oklahoma</strong> producers received for their<br />
<strong>2002</strong> peanut crops were reduced by 34 to<br />
42 percent. Because of this drastic change,<br />
caused by the new peanut program that<br />
began during <strong>2002</strong>, there is an urgent need<br />
to find ways to reduce the cost of peanut<br />
production.<br />
Improving disease resistance is the major<br />
area where the peanut breeding project will<br />
be able to reduce the cost of production. This<br />
will reduce the cost related to the purchase<br />
and application of fungicides to control<br />
diseases. A very aggressive research effort<br />
is being conducted to identify new breeding<br />
lines with higher levels of resistance to<br />
Sclerotinia blight and early leaf spot.<br />
Peanut quality continues to be a high priority<br />
for the breeding project. The major<br />
emphasis is on developing varieties with<br />
the high oleic acid trait. This trait gives<br />
roasted peanut products a much longer<br />
shelf life and also some additional health<br />
benefits for consumers when compared<br />
to peanuts that do not have the high oleic<br />
acid trait. There are indications from the<br />
peanut processing industry that they<br />
prefer high oleic acid peanuts for most<br />
of their products and in a few years they<br />
may only purchase peanuts with the high<br />
oleic acid trait.<br />
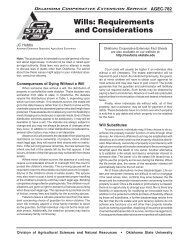
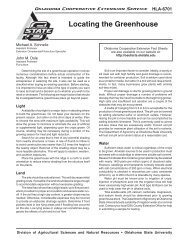
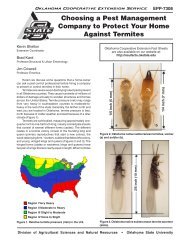
During the <strong>2002</strong> growing season, several<br />
peanut breeding trials were conducted at<br />
the Caddo Research Station near Ft. Cobb,<br />
OK, and the the most important results from<br />
these trials are presented in this report. The<br />
total rainfall and irrigation for each month is<br />
presented in Figure 1. For some of the trials<br />
the Total Sound Mature Kernels (TSMK) was<br />
multiplied by the yield to get a value called<br />
TSMK YLD. This value is an estimate of the<br />
relative gross return per acre of each of the<br />
entries. Emphasis is on this as a relative<br />
value, meaning that it estimates the ranking<br />
and relative performance of each entry<br />
for gross value.<br />
3
P artners in<br />
rogress<br />
P E A N U T S<br />
<strong>2002</strong> Rain and Irrigation – Ft. Cobb<br />
7<br />
6<br />
5<br />
4<br />
3<br />
2<br />
1<br />
0<br />
6 6<br />
5.89<br />
4.7<br />
3<br />
2.83<br />
1.95<br />
1.33 1.42<br />
.88<br />
May June July Aug. Sept. Oct. Nov.<br />
Rain Irrigation<br />
Figure 1. Total rainfall and irrigation for each month at the Caddo<br />
Research Station.<br />
The Uniform Peanut Performance Test<br />
(UPPT) had 20 breeding lines and five<br />
varieties developed by the major peanut<br />
breeding projects in the U.S. (Table 1). A<br />
randomized complete block design with<br />
four replications was used. This trial was<br />
irrigated (Figure 1) and had fungicide<br />
sprays to control the major diseases. All of<br />
the entries in this trial were runners except<br />
for Jupiter, VT 9506102-6, and NC 7, which<br />
are Virginias because of their large seed<br />
size as measured by their seed weight.<br />
Tamrun 96, which was the most popular<br />
variety planted by farmers in <strong>Oklahoma</strong>,<br />
was the top entry in this trial. An <strong>Oklahoma</strong><br />
breeding line 8-4-010 and Tamrun OL 01, a<br />
variety jointly released in Texas and <strong>Oklahoma</strong>,<br />
also performed well as their yields<br />
were not significantly different from Tamrun<br />
96. Tamrun OL 02 did not perform as well<br />
as Tamrun 96 or Tamrun OL 01.<br />
All of the breeding lines in the UPPT and<br />
other trials in this report that begin with<br />
“TX” and the recently released varieties<br />
Tamrun OL 01, Tamrum OL 02, and Olin<br />
were developed and evaluated by the<br />
South West High Oleic Peanut Program<br />
(SWHOPP) that is funded by the Texas<br />
Peanut Producers Board and the <strong>Oklahoma</strong><br />
Peanut Commission. The organizations<br />
that conduct the research for SWHOPP are<br />
the Texas Agricultural Experiment Station,<br />
<strong>Oklahoma</strong> Agricultural Experiment Station,<br />
and the United <strong>State</strong>s Department of<br />
Agriculture, Agricultural Research Service<br />
(USDA-ARS).<br />
There were three advanced trials (Advanced<br />
Runner Irrigated 1, Advanced<br />
Runner Irrigated 2, and Advanced Spanish<br />
Irrigated) conducted during <strong>2002</strong> at Ft.<br />
Cobb. Each of these trials was irrigated and<br />
had a split-plot design with the fungicide<br />
treatment being the main plot and varieties<br />
the sub-plot. There were four replications<br />
and four different fungicide treatments as<br />
described in Table 2.<br />
4
Table 1. Uniform Peanut Performance Test – Caddo County, <strong>2002</strong>.<br />
Entry Name TSMK YLD Yield Grade Seed Weight<br />
(TSMK x Yield) (lb/A) (% TSMK) (g/100 seeds)<br />
P artners in<br />
rogress<br />
P E A N U T S<br />
Tamrun 96 2987 4029 74.1 62.4<br />
8-4-010 2980 3824 77.8 61.1<br />
Tamrun OL 01 2943 3872 76.0 71.2<br />
Jupiter 2874 3993 71.7 91.6<br />
TX 994336 2888 3920 73.6 61.9<br />
TX 977066 2791 3787 73.7 66.0<br />
8-4-003 2604 3340 77.8 61.2<br />
GA 962533 2548 3654 69.9 60.0<br />
Okrun 2519 3352 75.2 57.3<br />
C156-47 2495 3303 75.7 64.6<br />
TX 977239 2479 3364 73.6 57.0<br />
TX 977116 2473 3279 75.4 61.7<br />
Tamrun OL 02 2465 3388 72.7 59.3<br />
GA 942516 2372 3122 76.1 71.6<br />
GA 962569 2364 3376 70.1 70.3<br />
NC7 X VGP 9 94-2 2295 3061 74.9 56.2<br />
Florunner 2242 3025 74.1 58.3<br />
NC7 X VGP 9 94-4 2166 2952 73.5 55.5<br />
VT 9506102-6 1949 2771 70.3 92.9<br />
TX 966151 1957 2698 72.4 54.5<br />
NC 7 1838 2672 68.5 82.6<br />
UF 98511 1818 2505 71.8 56.9<br />
UF 00620 1761 2456 71.8 60.8<br />
UF 98326 1684 2323 70.8 60.8<br />
C11-2-39 1429 2118 66.8 57.4<br />
LSD 0.05 498 622 4.2 5.5<br />
In the Advanced Runner Irrigated 1 trial the<br />
effect of the fungicide treatments (Table 3)<br />
were as expected for the disease ratings.<br />
When fungicides were applied to control<br />
both leaf spot and Sclerotinia there was very<br />
little disease; and when fungicides were<br />
applied to control leaf spot there was very<br />
little leaf spot, but severe Sclerotinia. Also,<br />
when fungicides were applied to control<br />
Sclerotinia there was very little Sclerotinia,<br />
but a moderate level of defoliation caused<br />
by leaf spot. When no fungicides were applied<br />
Sclerotinia was severe, but leaf spot<br />
was moderate. There was no yield gain<br />
caused by controlling leaf spot as the no<br />
disease control plots averaged 1697 lbs/A<br />
and the control leaf spot plots yielded 1719<br />
lbs/A. The yields almost doubled when fungicides<br />
were applied to control Sclerotinia<br />
as these plots averaged 3395 lbs/A and the<br />
plots where all diseases were controlled averaged<br />
3308 lbs/A.<br />
The variety X fungicide treatment interaction<br />
was not significant, so the yield and<br />
disease results are only given for the average<br />
across all four fungicide treatments<br />
(Table 4). As in the UPPT trial, Tamrun 96<br />
5
P artners in<br />
rogress<br />
P E A N U T S<br />
Table 2. Fugicide spray treatments – Ft. Cobb, <strong>2002</strong>.<br />
• No Disease Control – no fungicides<br />
+ SCLEROTINIA*<br />
• Control Leaf Spot – Bravo and Folicur block program<br />
+ SCLEROTINIA<br />
• Control Sclerotinia – Omega<br />
• Control all Diseases – Bravo and Folicur block program plus Omega<br />
* Sclerotinia inoculum was applied to encourage the spread of Sclerotinia blight.<br />
Table 3. Summary of fungicide treatments in the Advanced Runner 1<br />
Irrigated Peanut Performance Trial – Caddo County, <strong>2002</strong>.<br />
Treatment Yield Leaf spot Sclerotinia Sclerotinia<br />
Name (lb/A) defoliation incidence intensity<br />
(%) (1-64) (1-5)<br />
Control Sclerotinia 3395 20.2 4.9 1.0<br />
Control All Diseases 3008 3.3 10.1 1.2<br />
Control Leaf Spot 1719 0.3 58.2 2.7<br />
No Disease Control 1697 11.5 59.4 2.7<br />
LSD 0.05 501 7.3 8.2 0.5<br />
6<br />
was the top line for yield. This consistently<br />
good performance of Tamrun 96<br />
is impressive. There were only five other<br />
varieties that had yields that were not significantly<br />
less than Tamrun 96 and they were<br />
TX 977006, TX 994313, Southwest Runner,<br />
Tamrun OL 01, and Tamrun OL 02. Southwest<br />
Runner continues to have the best<br />
resistance to Sclerotinia blight, but it also<br />
has the most defoliation caused by leaf spot.<br />
In this and other trials, we have not identified<br />
any breeding lines with relatively good resistance<br />
to both leaf spot and Sclerotinia blight.<br />
Combining the better leaf spot resistance<br />
found in lines such as TX 994313 with the<br />
high levels of resistance to Sclerotinia blight
Table 4. Summary of variety performance in the Advanced Runner 1<br />
Irrigated Peanut Performance Trial – Caddo County, <strong>2002</strong>.<br />
Treatment Yield Leaf spot Sclerotinia Sclerotinia<br />
Name (lb/A) defoliation incidence intensity<br />
(%) (1-64) (1-5)<br />
Tamrun 96 2972 10.9 26.8 1.3<br />
TX 977066 2955 10.3 34.5 1.6<br />
TX 994313 2931 6.9 32.3 1.6<br />
SW Runner 2916 22.5 3.4 1.0<br />
Tamrun OL 01 2819 9.1 34.8 1.9<br />
Tamrun OL 02 2804 13.4 34.0 1.8<br />
UF 00627 2632 10.3 32.5 1.9<br />
8-4-003 2553 5.0 35.4 1.9<br />
UF 98604 2508 8.1 33.4 1.7<br />
UF 99621 2444 8.4 35.5 2.3<br />
94-2 2429 11.3 35.4 1.8<br />
GA 962569 2401 14.1 31.0 1.4<br />
94-4 2363 8.8 34.8 1.9<br />
Okrun 2320 5.6 35.6 2.1<br />
8-4-010 2314 4.7 33.3 1.9<br />
TX 966151 2284 5.9 36.4 1.8<br />
UF 00618 2260 7.5 36.8 2.1<br />
Andru II 2257 5.6 32.4 2.0<br />
GP-1 2143 7.5 36.7 1.9<br />
Florunner 2142 4.7 37.1 2.6<br />
UF 98511 2114 7.5 36.8 2.4<br />
UF 97611 2012 5.0 35.9 2.3<br />
UF 00620 1901 10.0 37.7 2.6<br />
LSD 0.05 285 4.5 3.7 0.4<br />
P artners in<br />
rogress<br />
P E A N U T S<br />
found in Southwest Runner is an important<br />
goal of the breeding project.<br />
The top yielding lines in the Advanced<br />
Runner Irrigated 2 trial were Tamrun 96,<br />
Tamrun OL 01, Tamrun OL 02, Southwest<br />
Runner, and six breeding lines developed<br />
by SWHOPP. Florunner, Okrun, and several<br />
other breeding lines had poor yields and<br />
also were susceptible to Sclerotinia blight.<br />
Spanco was the highest yielding line in<br />
the Advanced Spanish Irrigated trial with<br />
an average yield across the four fungicide<br />
treatments of 3100 lbs/A. The yields for<br />
Pronto, Tamspan 90, and Olin were significantly<br />
less than Spanco at 2756, 2876,<br />
and 1685 lbs/A, respectively.<br />
The varieties in the three Advanced trials<br />
were planted in three more trials (Advanced<br />
Runner Dryland 1, Advanced Runner Dryland<br />
2, and Advanced Spanish Dryland)<br />
with a randomized complete block design,<br />
three replications, and no irrigation.<br />
7
P artners in<br />
rogress<br />
P E A N U T S<br />
The top six lines in the Advanced Runner<br />
Irrigated 1 trial did not yield well in the dryland<br />
trial (Table 5). Out of 23 varieties in the<br />
trial they ranked 13, 15, 18, 20, 22, and 23<br />
for yield. The six lines that did very well<br />
with irrigation and had poor yields without<br />
irrigation all were developed in <strong>Oklahoma</strong><br />
or Texas. In the dryland trial (Table 5), the<br />
top four varieties UF 00620, UF 00627,<br />
GP-1, and UF 98604 all were developed<br />
in Florida. These top four varieties in the<br />
dryland were ranked 7, 9, 19, and 23 with<br />
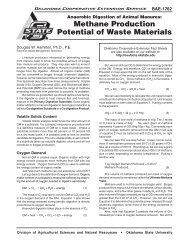
irrigation. These very different results that<br />
were observed in the dryland and irrigated<br />
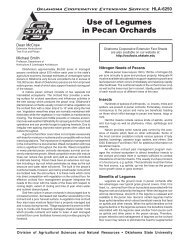
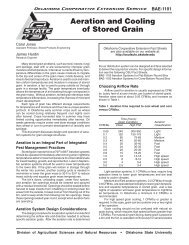
trials are shown in Figure 2. The three varieties<br />
that were developed in Texas and<br />
<strong>Oklahoma</strong> (Southwest Runner, Tamrun OL<br />
01, and Tamrun 96) did well with irrigation,<br />
but had a very big yield loss when grown<br />
dryland. The three varieties developed<br />
in Florida (UF 98511, UF 97611, and UF<br />
00620) were low yielding when irrigated,<br />
but had very little yield loss when grown<br />
without irrigation.<br />
The results from the Advanced Runner<br />
Irrigated 2 and Advanced Runner Dryland<br />
2 trials were similar to those obtained in the<br />
Advanced Runner Irrigated and Dryland<br />
1 Trials. Tamrun 96 had one of the highest<br />
yields with irrigation and one of the poorest<br />
yields without it. Also, the top three yielding<br />
varieties in the dryland trial ranked 19, 21,<br />
and 22, out of 23 varieties in the irrigated<br />
trial.<br />
Table 5. Advanced Runner 1 Dryland Peanut Performance Test – Caddo<br />
County, <strong>2002</strong>.<br />
Entry Name TSMK Yield Yield Grade Seed Weight<br />
(TSMK x Yield) (lb/A) (% TSMK) (g/100 seeds)<br />
UF 00620 1051.05 2000.53 52.3 40.9<br />
UF 00627 937.75 1581.07 60.0 45.3<br />
GP-1 922.81 1564.93 58.6 42.7<br />
UF 98604 897.53 1645.60 53.6 42.6<br />
NC7 X VGP 9 94-4 886.69 1548.80 57.1 38.9<br />
UF 99621 884.99 1500.40 58.8 48.1<br />
8-4-010 840.19 1500.40 54.9 43.7<br />
NC7 X VGP 9 94-2 835.00 1387.47 60.2 38.7<br />
GA 962569 781.10 1435.87 54.4 51.2<br />
Okrun 772.98 1516.53 50.8 38.3<br />
Tamrun OL 01 771.24 1339.07 57.6 53.6<br />
UF 00618 766.54 1435.87 53.3 45.2<br />
TX 977066 772.03 1371.33 56.4 52.1<br />
UF 98511 753.60 1339.07 56.3 44.2<br />
TX 966151 718.22 1290.67 55.2 41.1<br />
UF 97611 717.53 1403.60 51.2 40.7<br />
TX 994313 705.03 1306.80 54.2 44.3<br />
8-4-003 681.33 1306.80 52.8 41.7<br />
Florunner 596.16 1339.07 43.8 38.9<br />
Andru II 592.40 1129.33 52.1 42.8<br />
SW Runner 506.80 1145.47 44.5 32.4<br />
Tamrun 96 468.82 855.07 54.8 46.2<br />
Tamrun OL 02 417.63 806.67 51.5 48.7<br />
LSD 0.05 250.77 393.62 6.9 5.5<br />
8
The trial results support conclusions made<br />
by Dashiell in his 1979 <strong>Oklahoma</strong> <strong>State</strong><br />
<strong>University</strong> Thesis titled “Genotype X Environment<br />
Interaction Studies on Economic<br />
Characters of Peanut.” He concluded,<br />
“When peanuts are grown as a full-season<br />
crop different genotypes do not perform<br />
consistently between irrigated and dryland<br />
locations for percent total sound mature<br />
kernels (% TSMK), thus, different cultivars<br />
could be selected for irrigated or dryland<br />
locations. There is some evidence that<br />
different cultivars could be selected for<br />
irrigated or dryland locations that have<br />
greater pod yield and gross return.”<br />
The results described for the Advanced<br />
Runner trials and the results from the 1979<br />
Genotype X Environment Interaction study<br />
support each other. These results indicate<br />
that there is a need to develop different<br />
varieties for irrigated and dryland locations<br />
in <strong>Oklahoma</strong>. However, almost all of the<br />
experienced peanut producers and peanut<br />
research and extension workers think<br />
that there will be very little dryland peanut<br />
production in <strong>Oklahoma</strong>’s future. Therefore,<br />
there is no need to develop varieties for dryland<br />
production. However, these results also<br />
seem to indicate that we can breed peanut<br />
varieties that can give high yields in an<br />
environment with less irrigation. There is a<br />
need to combine the high yield and disease<br />
resistance properties of varieties like Tamrun<br />
96, TX 994313, and Southwest Runner<br />
(Table 4) with the ability to have good yields<br />
with less water from varieties like UF 00620<br />
and UF 00627 (Table 5).<br />
When the disease resistant varieties that<br />
can produce high yields with less irrigation<br />
have been developed they will cost less<br />
to produce because the irrigation system<br />
will not be used as often. Another added<br />
benefit will be less disease pressure because<br />
the humidity in the crop canopy will<br />
be reduced. This should mean that producers<br />
can reduce the use of fungicides<br />
even more and further reduce the cost of<br />
production.<br />
P artners in<br />
rogress<br />
P E A N U T S<br />
<strong>2002</strong> Advanced Runner 1 – Ft. Cobb<br />
UF 00620<br />
UF 97611<br />
UF 98511<br />
Tamrun OL 02<br />
Southwest Runner<br />
Tamrun 96<br />
500 1000 1500 2000 2500 3000<br />
Irrigated<br />
Dryland<br />
Figure 2. The differences between dryland and irrigated peanut trials.<br />
9
P artners in<br />
rogress<br />
P E A N U T S<br />
Management of Arthropods<br />
in <strong>Peanuts</strong><br />
P. G. Mulder, S. K. Seuhs, M. T. Stacey, and K. E. Jackson<br />
Department of Entomology and Plant Pathology<br />
<strong>2002</strong> progress made possible through OPC support<br />
• Evaluations conducted in ro-till peanuts in <strong>2002</strong>, to assess the effects of varying<br />
levels of insecticide and fungicide applications on subsequent insect populations<br />
revealed few differences in arthropod populations; however, large differences<br />
were detected in the level of leafspot infection and subsequent defoliation<br />
from the disease.<br />
• Significant differences in yield were recovered between peanuts receiving the<br />
maximum number of pesticide treatments and those treated minimally or not<br />
at all; however, no differences in yield were recovered between peanuts treated<br />
with moderate or minimal amounts of pesticides and untreated plants.<br />
• Studies conducted on two varieties under three variations in tillage practices<br />
showed no differences between arthropod populations recovered from either<br />
variety; however, some minor differences were observed between tillage practices.<br />
• Between tillage types and varieties, no differences were detected in yield or<br />
grade in trials conducted in Eakly, OK.<br />
• Studies conducted on runner type peanuts using two different herbicide approaches<br />
and grown in ro-till and no-till systems in Ft. Cobb, OK, revealed<br />
no differences in arthropod populations in the two tillage systems; however,<br />
more beneficial arthropods were detected in peanuts treated with Valor than<br />
in those left weed free.<br />
• Between tillage types and herbicide treatments, no differences were detected in<br />
yield or grade for the two herbicide treatments; however, greater yields were<br />
obtained in peanuts grown in ro-till systems versus those in no-till.<br />
• A study conducted on Spanish and runner type peanuts to assess the effects<br />
of various miticides found a significant advantage to use Kelthane initially;<br />
however, all insecticides eventually reduced mite populations similarly and<br />
maintained that control until the combination of rains and irrigation confounded<br />
the trial.<br />
• After water compromised the efficacy testing, only peanuts treated with Capture<br />
witnessed a significant resurgence in mite populations.<br />
10<br />
• No significant differences in yields were recovered between any of the peanuts<br />
treated with miticides or the untreated plants. Likewise, no differences in yields<br />
were detected between the various treatments.
Pest Management<br />
of Arthropod Populations<br />
in Reduced Tillage<br />
Since the advent of the new peanut farm<br />
program, it has become imperative to find<br />
avenues of reducing inputs into the peanut<br />
ecosystem. With this need in mind, in <strong>2002</strong>,<br />
we began the task of evaluating how the<br />
use of varying levels of pesticides (both insecticides<br />
and fungicides) could be scaled<br />
back in an attempt to reduce production<br />
costs, while affording the plants protection<br />
from damaging arthropods equal to<br />
previously used methods of management.<br />
If managing the insects and diseases in a<br />
judicious manner, based on insect thresholds<br />
and disease advisory alerts, can help<br />
in holding down the cost of production with<br />
no accompanying yield loss, then this certainly<br />
represents an appreciable savings<br />
for the grower.<br />
Three experiments at two locations across<br />
the major peanut production areas of <strong>Oklahoma</strong><br />
were conducted to ascertain the effects<br />
of varying levels of pesticide inputs<br />
and tillage on arthropod and disease pests<br />
in <strong>Oklahoma</strong>.<br />
Comparative Studies<br />
on Chemical Inputs<br />
in Ro-Till <strong>Peanuts</strong><br />
Tables 1 through 6 present the results of<br />
varying levels of insecticide and fungicide<br />
management on thrips in a ro-till peanut<br />
field in Eakly, OK. Runner-type peanuts (variety<br />
Tamrun 96) were planted May 21 on<br />
the farm of Dr. Roger Musick. Prior to planting,<br />
a burndown treatment of Roundup herbicide<br />
was applied on May 7 to the existing<br />
wheat stubble and volunteer plants (peanut<br />
and weeds). Four levels of management<br />
were chosen for each plot area to reflect<br />
the varying levels of cost and approaches<br />
often used by growers. Each plot consisted<br />
of peanuts planted four rows wide and<br />
25 ft long. The four treatments were replicated<br />
four times. An in-furrow application of<br />
Temik was made after planting by using a<br />
hand-powered Precision Granular Applicator.<br />
Application was made in a 7-inch band,<br />
over the open furrow, and calibrated to deliver<br />
the prescribed amount of insecticide.<br />
The furrow was then covered by hand using<br />
a garden hoe. The in-furrow application of<br />
Orthene was made with a CO 2<br />
pressurized<br />
applicator calibrated to deliver 15 gpa. The<br />
post-emergent application of Orthene was<br />
applied after 90% emergence on June 6<br />
using a CO 2<br />
wheelbarrow plot sprayer<br />
calibrated to deliver 20 gpa. Monitoring for<br />
insect populations occurred throughout the<br />
season. Initial readings of thrips populations<br />
on terminal leaves were conducted 4, 7, 13,<br />
and 23 days after treatment (DAT) with the<br />
Orthene post-emergent spray. Three subsequent<br />
readings were also made on peanut<br />
blooms at 36, 43, and 49 DAT. In addition,<br />
sweep samples were taken using a standard<br />
15-inch insect sweep net to determine<br />
the populations of grasshoppers, defoliating<br />
caterpillars, potato leafhoppers, and beneficial<br />
arthropods within each treatment area.<br />
Near the end of the season, the effects<br />
of fungicide treatments on leafspot were<br />
measured by estimating the percentage of<br />
visible infection and defoliation in each plot<br />
area. Finally, yield and grade were determined<br />
by digging, combining, drying, and<br />
weighing peanuts from the two middle rows<br />
of each plot.<br />
Tables 1 and 2 show the effects of insecticides<br />
on early-season thrips populations,<br />
before fungicides were applied. Populations<br />
were relatively low and on only one<br />
day (13 DAT) was there any significant differences<br />
in infestations in terminal leaves<br />
(Table 1). Once the plants began to bloom,<br />
significantly more thrips were recovered in<br />
P artners in<br />
rogress<br />
P E A N U T S<br />
11
P artners in<br />
rogress<br />
P E A N U T S<br />
peanuts treated with Orthene in-furrow than<br />
plants treated with Temik (36 DAT). This<br />
scenario occurred again 49 DAT, when<br />
differences were also observed between<br />
peanuts treated with Orthene in-furrow and<br />
those receiving Orthene post-emergent.<br />
Irrespective of these differences, populations<br />
of thrips remained very light throughout<br />
the test period. Sampling conducted<br />
later in the season also revealed few differences<br />
in other arthropod populations<br />
(Tables 3 and 4). No significant differences<br />
in populations of grasshoppers or defoliating<br />
caterpillars were observed from the two<br />
sample dates (Tables 3 and 4, respectively).<br />
The peanuts treated with Orthene in-furrow<br />
had significantly more potato leafhoppers<br />
than those treated with Orthene post-emergent<br />
or the untreated plants 92 days after<br />
planting (DAP) (Table 3). Approximately 1<br />
1⁄2 weeks later, peanuts treated with Temik<br />
had significantly more potato leafhoppers<br />
than the untreated plants or those treated<br />
with Orthene post-emergent (Table 3).<br />
While the numbers of beneficial organisms<br />
was similar across all treated and untreated<br />
peanuts at 92 DAP, peanuts treated with<br />
Orthene in-furrow had significantly more<br />
beneficial organisms than the untreated<br />
plants at 106 DAP (Table 4).<br />
Large differences were observed in the<br />
percentage of leafspot and subsequent<br />
defoliation, most likely due to variations in<br />
fungicide blocks. The six treatment block<br />
had significantly less leafspot and defoliation<br />
than all the other treated plants or the<br />
untreated plots (Table 5). No differences<br />
were observed between the four treatment<br />
and two treatment blocks or between either<br />
of these approaches and the untreated<br />
peanuts (Table 5). The differences seen<br />
in defoliation from leafspot also were<br />
observed for yield. Yields in peanuts treated<br />
with Temik and the six treatment block<br />
of fungicides were significantly greater<br />
than the untreated plants; however, this<br />
difference did not hold up (statistically)<br />
between the peanuts treated with the six<br />
treatment block and the other treatments<br />
(Table 5). Based on grade, yield, and the<br />
cost of control, the peanuts receiving the<br />
maximum inputs had the greatest return<br />
per acre (Table 6) and interestingly, because<br />
of the associated costs and lack of<br />
yield differences between the four or two<br />
block treatments and untreated peanuts,<br />
the latter returned more dollars per acre<br />
(Table 6).<br />
Table 1. Effect of insecticides on thrips populations in terminal leaves<br />
– Musick Farm, Eakly, OK, <strong>2002</strong>.*<br />
Thrips Population 1<br />
Treatment/Rate 4 DAT 7 DAT 13 DAT 23 DAT<br />
(a.i./A) 2<br />
Total thrips Total thrips Total thrips Total thrips<br />
1) Temik 15G/1.0 lb 10.3 a 3.8 a 1.0 ab 2.0 a<br />
2) Orthene 75S IF/0.50 lb 5.3 a 2.3 a 2.3 a 0.5 a<br />
3) Orthene 75S Post/0.50 lb 4.3 a 5.4 a 0.5 b 1.8 a<br />
4) Untreated 6.5 a 3.8 a 2.0 ab 2.3 a<br />
DAT = Days after treatment (Orthene-post).<br />
*<br />
Means, within columns, followed by the same letter are not significantly different (P=0.05; LSD).<br />
1<br />
Thrips populations represent a mean of the total (adults and larvae) sampled from 5 leaves/plot.<br />
2<br />
Temik and Orthene IF were applied at plant, in furrow. Orthene 75S post was applied as a postemergence<br />
spray on June 6, <strong>2002</strong>.<br />
12
Table 2. Effect of insecticides on thrips populations in blooms – Musick<br />
Farm, Eakly, OK, <strong>2002</strong>.*<br />
Thrips Population 1<br />
Treatment/Rate 36 DAT 43 DAT 49 DAT<br />
(a.i./A) 2 Total thrips Total thrips Total thrips<br />
1) Temik 15G/1.0 lb 4.0 b 7.0 a 4.8 bc<br />
2) Orthene 75S IF/0.50 lb 8.3 a 6.8 a 8.5 a<br />
3) Orthene 75S Post/0.50 lb 5.3 ab 5.8 a 3.5 c<br />
4) Untreated 6.3 ab 6.8 a 7.3 ab<br />
DAT = Days after treatment (Orthene-post).<br />
*<br />
Means, within columns, followed by the same letter are not significantly different (P=0.05; LSD).<br />
1<br />
Thrips populations represent a mean of the total (adults and larvae) sampled from 5 blooms/plot.<br />
2<br />
Temik and Orthene IF were applied at plant, in furrow. Orthene 75S post was applied as a postemergence<br />
spray on June 6, <strong>2002</strong>.<br />
P artners in<br />
rogress<br />
P E A N U T S<br />
Table 3. Effect of pesticides on grasshopper and potato leafhopper<br />
populations in ro-till peanuts – Musick Farm, Eakly, OK, <strong>2002</strong>.*<br />
Grasshoppers 1 Potato Leafhoppers 1<br />
Treatment/Rate (a.i./A) 2 92 DAP 106 DAP 92 DAP 106 DAP<br />
1) Temik 15G/1.0 lb 3.0 a 3.5 a 8.5 ab 20.0 a<br />
2) Orthene 75S IF/0.50 lb 2.5 a 3.5 a 14.0 a 12.3 ab<br />
3) Orthene 75S Post/0.50 lb 2.5 a 3.8 a 6.8 b 6.8 b<br />
4) Untreated 3.8 a 3.0 a 6.0 b 10.3 b<br />
DAP = Days after planting.<br />
*<br />
Means, within columns, followed by the same letter are not significantly different (P=0.05; LSD).<br />
1<br />
Insect populations represent a mean of the total (adults and nymphs) sampled from 4 sweeps/plot.<br />
2<br />
Temik and Orthene IF were applied at plant, in furrow. Orthene 75S post was applied as a postemergence<br />
spray on June 6, <strong>2002</strong>.<br />
13
P artners in<br />
rogress<br />
P E A N U T S<br />
Table 4. Effect of pesticides on defoliating caterpillars and beneficial<br />
arthropod populations in ro-till peanuts – Musick Farm, Eakly, OK, <strong>2002</strong>.*<br />
Defoliating Caterpillars 1 Beneficial Arthropods 1<br />
Treatment/Rate (a.i./A) 2 92 DAP 106 DAP 92 DAP 106 DAP<br />
1) Temik 15G/1.0 lb 3.5 a 0.5 a 1.5 a 3.0 ab<br />
2) Orthene 75S IF/0.50 lb 3.0 a 0.8 a 2.8 a 3.8 a<br />
3) Orthene 75S Post/0.50 lb 3.3 a 0.8 a 2.0 a 2.8 ab<br />
4) Untreated 2.5 a 2.3 a 1.8 a 1.0 b<br />
DAP = Days after planting.<br />
*<br />
Means, within columns, followed by the same letter are not significantly different (P=0.05; LSD).<br />
1<br />
Insect populations represent a mean of the total (adults and nymphs) sampled from 4 sweeps/plot.<br />
Defoliating caterpillars include corn earworm, beet armyworm, loopers, etc. Beneficial arthropods include<br />
spiders, damsel bugs, big-eyed bugs, red-cross beetles, etc.<br />
2<br />
Temik and Orthene IF were applied at plant, in furrow. Orthene 75S post was applied as a postemergence<br />
spray on June 6, <strong>2002</strong>.<br />
Table 5. Effect of insecticides and varying levels of fungicides on<br />
percent of peanut leaf spot, percent of subsequent defoliation, and yield<br />
– Musick Farm, Eakly, OK, <strong>2002</strong>.*<br />
Treatment/Rate % Leafspot % Defoliation Yield<br />
(a.i./A)<br />
(lbs/A)<br />
Temik 15G/1.0 lb+ 6 TRT block 1 10.0 a 1.3 a 4337.9 a<br />
Orthene 75S IF/0.50 lb+ 4 TRT block 2 56.3 b 21.3 b 3575.5 ab<br />
Orthene 75S Post/0.50 lb+ 2 TRT block 3 50.0 b 23.8 b 3639.1 ab<br />
Untreated 78.7 b 57.5 b 3257.9 b<br />
DAP = Days after planting.<br />
*<br />
Means, within columns, followed by the same letter are not significantly different (P=0.05; LSD).<br />
1<br />
Six treatment block consists of 1 st application of Bravo (45 DAP), followed by 2 nd application of Abound<br />
14 days later, followed by 3 rd application of Bravo 14 days later, followed by 4 th apllication of Abound<br />
14 days later, followed by 5 th and 6 th applications of Bravo two weeks apart and 14 days after the 4 th<br />
application.<br />
2<br />
Four treatment block consists of 1 st application of Bravo (45 DAP), followed by 2 nd and 3 rd application<br />
of Abound at 60 and 90 DAP, respectively, followed by 4 th application Bravo three weeks later.<br />
3<br />
Two treatment block consists of 1 st and 2 nd applications of Abound at 60 and 90 DAP.<br />
14
Table 6. Effect of insecticides applied for thrips and fungicides applied<br />
for disease control on peanut grade, value, and return per acre – Eakly,<br />
OK, <strong>2002</strong>.<br />
Treatment/Rate Mean Mean Cost Return<br />
(a.i./A) Grade Value ($/A) 1 ($/A) 2<br />
(% TSMK) ($/A)<br />
Temik 15G/1.0 lb+ 6 TRT block 73 765.37 130.59 634.78<br />
Orthene 75S IF/0.50 lb+ 4 TRT block 73.5 634.50 94.79 539.71<br />
Orthene 75S Post/0.50 lb+ 2 TRT block 73 640.53 75.58 564.95<br />
Untreated 74.5 581.03 0 581.03<br />
1<br />
Treatment costs = Cost of insecticide only for at-plant applications (Temik and Orthene IF); for Orthene<br />
post applied: cost = insecticide cost ($7.40) + application cost ($3.00). Bravo1.5 pts/A = $9.60, Abound<br />
18.4 fl.oz./A = $32.59,<br />
2<br />
Partial return = crop value - treatment costs.<br />
P artners in<br />
rogress<br />
P E A N U T S<br />
Effects of Tillage Pratices<br />
on Seasonal Arthropod<br />
Populations<br />
Information found in Tables 7 to 21 present<br />
the results from monitoring the pest and<br />
beneficial arthropod complex throughout<br />
the season at two locations in <strong>Oklahoma</strong>.<br />
Thrips, defoliating caterpillars, leafhoppers,<br />
and grasshoppers were monitored<br />
similarly to the previous test. No insecticides<br />
were applied throughout this test. In<br />
the Eakly location, thrips were monitored<br />
within terminal leaves 20, 23, 29, and 34<br />
DAP (Tables 7 and 8). These insects were<br />
also monitored in peanut blooms 36, 43,<br />
and 49 DAP (Table 9). Defoliating caterpillars,<br />
grasshoppers, potato leafhoppers,<br />
and beneficial arthropods were all<br />
monitored 92 and 106 DAP (Tables 10 to<br />
13, respectively). Yield and grade results<br />
are presented in Table 14. In the Ft. Cobb<br />
location, thrips populations within terminal<br />
leaves were monitored 28, 32, 38, and 48<br />
DAP (Tables 15 and 16). Thrips populations<br />
were also monitored within blooms 61 and<br />
68 DAP (Table 17). Defoliating caterpillars,<br />
grasshoppers, potato leafhoppers, and<br />
beneficial arthropods were monitored 100<br />
and 114 DAP (Tables 18 to 21). The effects<br />
of tillage and herbicide treatments on yield<br />
and grade are presented in Table 22.<br />
Throughout the trial conducted in Eakly, no<br />
differences in arthropod populations, yield,<br />
or grade were detected between the two<br />
varieties of peanuts. Thrips populations<br />
were similar in terminals and blooms during<br />
each sampling period with the exception of<br />
those recovered from conventional tillage at<br />
the Eakly location 23 DAP. On this sampling<br />
date, significantly more thrips were recovered<br />
in peanuts planted within conventional<br />
tillage than in plants grown within a ro-till<br />
situation (Table 7). Defoliating caterpillars,<br />
grasshoppers, and potato leafhopper populations<br />
were statistically similar in all tillage<br />
and herbicide treatments at both locations.<br />
At both locations, no significant differences<br />
were detected in the beneficial arthropod<br />
populations in any of the tillage practices<br />
(Table 13). At Ft. Cobb, significantly more<br />
beneficial arthropods were recovered<br />
in peanuts receiving the Valor herbicide<br />
treatment than in those grown in a weed<br />
free environment (Table 21).<br />
15
P artners in<br />
rogress<br />
P E A N U T S<br />
Based on results of yield analysis, no<br />
significant differences in yield and grade<br />
were detected between peanuts grown<br />
under any of the three tillage practices at<br />
the Eakly location (Table 14). At Ft. Cobb,<br />
significantly greater yields were obtained<br />
in peanuts grown within ro-till systems than<br />
in no-till (Table 22). No other yield or grade<br />
differences were detected at this location<br />
(Table 22).<br />
Table 7. Effects of tillage practices on thrips populations – Musick<br />
Farms, Eakly, OK, <strong>2002</strong>.*<br />
Mean No. Thrips /10 Quadrifoliate leaves<br />
20 DAP 23 DAP<br />
Variety<br />
Variety<br />
Tillage TR96 TROL01 Mean TR96 TROL01 Mean<br />
No-Till 25.3 37 31.2 a 12.3 14 13.2 a<br />
Ro-Till 44 45 44.7 a 10.7 12 11.3 a<br />
Conv.-Till 50 50.7 50.3 a 23.7 18.7 21.2 b<br />
Mean 40 a 44 a 16 a 14 a<br />
DAP = Days after planting.<br />
* Overall means, within either tillage or variety, followed by the same letter are not significantly different<br />
(P= 0.05; ANOVA).<br />
Table 8. Effects of tillage practices on thrips populations – Musick<br />
Farms, Eakly, OK, <strong>2002</strong>.*<br />
Mean No. Thrips /10 Quadrifoliate leaves<br />
29 DAP 34 DAP<br />
Variety<br />
Variety<br />
Tillage TR96 TROL01 Mean TR96 TROL01 Mean<br />
No-Till 6.7 8.7 7.7 a 2.3 3.0 2.2 a<br />
Ro-Till 4.7 10.0 7.3 a 1.3 3.3 2.3 a<br />
Conv.-Till 4.0 7.7 5.8 a 2.6 1.7 2.2 a<br />
Mean 5.1 a 8.8 a 2.1 a 2.5 a<br />
DAP = Days after planting.<br />
* Overall means, within either tillage or variety, followed by the same letter are not significantly different<br />
(P= 0.05; ANOVA).<br />
16
P artners in<br />
rogress<br />
P E A N U T S<br />
Table 9. Effects of tillage practices on thrips populations in blooms<br />
– Musick Farms, Eakly, OK, <strong>2002</strong>.*<br />
Mean No. Thrips /10 Blooms<br />
36 DAP 43 DAP 49 DAP<br />
Variety Variety Variety<br />
Tillage TR96 TROL01 Mean TR96 TROL01 Mean TR96 TROL01 Mean<br />
No-Till 9.7 10 9.8 a 12.7 11.3 12.0 a 15.7 19.7 17.7 a<br />
Ro-Till 15 9 12.0 a 7.3 10.3 8.8 a 22.7 21 21.8 a<br />
Conv. Till 11.7 12.7 12.2 a 9 8.3 8.7 a 18 17 17.5 a<br />
Mean 12.1 a 10.6 a 9.7 a 10.0 a 18.8 a 19.2 a<br />
DAP = Days after planting.<br />
* Overall means, within either tillage or variety, followed by the same letter are not significantly different<br />
(P= 0.05; ANOVA).<br />
Table 10. Effects of tillage practices on defoliating caterpillar populations<br />
– Musick Farms, Eakly, OK, <strong>2002</strong>.*<br />
Mean No. Defoliators /10 Sweeps<br />
92 DAP 106 DAP<br />
Variety<br />
Variety<br />
Tillage TR96 TROL01 Mean TR96 TROL01 Mean<br />
No-Till 2.0 1.0 1.5 a 1.0 0.0 0.5 a<br />
Ro-Till 1.0 2.3 1.7 a 1.3 0.0 1.2 a<br />
Conv.-Till 2.0 1.0 1.5 a 1.0 1.3 1.2 a<br />
Mean 1.7 a 1.4 a 1.1 a 0.4 a<br />
DAP = Days after planting.<br />
* Overall means, within either tillage or variety, followed by the same letter are not significantly different<br />
(P= 0.05; ANOVA).<br />
17
P artners in<br />
rogress<br />
P E A N U T S<br />
Table 11. Effects of tillage practices on grasshopper populations –<br />
Musick Farms, Eakly, OK, <strong>2002</strong>.*<br />
Mean No. Grasshoppers /10 Sweeps<br />
92 DAP 106 DAP<br />
Variety<br />
Variety<br />
Tillage TR96 TROL01 Mean TR96 TROL01 Mean<br />
No-Till 3.3 3.7 3.5 a 2.7 3.7 3.2 a<br />
Ro-Till 3.7 4.3 4.0 a 4.7 5.7 5.2 a<br />
Conv.-Till 4.3 2.0 3.2 a 5.3 2.0 3.7 a<br />
Mean 3.8 a 3.3 a 4.2 a 3.8 a<br />
DAP = Days after planting.<br />
* Overall means, within either tillage or variety, followed by the same letter are not significantly different<br />
(P= 0.05; ANOVA).<br />
Table 12. Effects of tillage practices on potato leafhopper populations<br />
– Musick Farms, Eakly, OK, <strong>2002</strong>.*<br />
Mean No. Leafhoppers /10 Sweeps<br />
92 DAP 106 DAP<br />
Variety<br />
Variety<br />
Tillage TR96 TROL01 Mean TR96 TROL01 Mean<br />
No-Till 11.7 10.3 11.0 a 31.7 16.3 24.0 a<br />
Ro-Till 9.3 6.0 7.3 a 20.0 22.3 21.2 a<br />
Conv.-Till 11.0 16.3 13.7 a 26.0 37.3 31.7 a<br />
Mean 10.7 a 10.9 a 25.0 a 25.3 a<br />
DAP = Days after planting.<br />
* Overall means, within either tillage or variety, followed by the same letter are not significantly different<br />
(P= 0.05; ANOVA).<br />
18
P artners in<br />
rogress<br />
P E A N U T S<br />
Table 13. Effects of tillage practices on beneficial arthropod populations<br />
– Musick Farms, Eakly, OK, <strong>2002</strong>.*<br />
Mean No. Beneficials/10 Sweeps<br />
92 DAP 106 DAP<br />
Variety<br />
Variety<br />
Tillage TR96 TROL01 Mean TR96 TROL01 Mean<br />
No-Till 1.0 1.7 1.3 a 2.7 2.7 2.7 a<br />
Ro-Till 1.7 1.0 1.3 a 3.7 0.7 2.2 a<br />
Conv.-Till 2.3 3.0 2.7 b 1.3 2.0 1.7 a<br />
Mean 1.7 a 1.9 a 2.6 a 1.8 a<br />
DAP = Days after planting.<br />
* Overall means, within either tillage or variety, followed by the same letter are not significantly different<br />
(P= 0.05; ANOVA).<br />
Table 14. Effects of tillage practices on peanut variety yield and grade<br />
– Musick Farms, Eakly, OK, <strong>2002</strong>.*<br />
Tillage Variety Yield (lb/A) Yield (lb/A) Grade Grade<br />
System Tillage Variety (%TSMK) 1 (%TSMK) 1<br />
Conv.- Till 3540 a 76 ab<br />
Tamrun 96 3555 a 76 a<br />
Tamrun OL 01 3525 a 77 a<br />
Ro- Till 3079 a 77 a<br />
Tamrun 96 2921 a 76 a<br />
Tamrun OL 01 3237 a 77 a<br />
No-Till 3037 a 75 b<br />
Tamrun 96 2950 a 75 a<br />
Tamrun OL 01 3125 a 76 a<br />
* Means, within columns, followed by the same letter are not significantly different (P=0.05; LSD).<br />
1<br />
%TSMK = % Total Sound Mature Kernels.<br />
19
P artners in<br />
rogress<br />
P E A N U T S<br />
Table 15. Effects of tillage practices on thrips populations in terminals<br />
of seedling peanuts – Repp Farms, Ft. Cobb, OK, <strong>2002</strong>.*<br />
Mean No. Thrips/10 Quadrifoliate leaves<br />
28 DAP 32 DAP<br />
Tillage Valor/ Weed Free Mean Valor/ Weed Free Mean<br />
32 oz Pre 32 oz Pre<br />
No-Till 19.8 23.5 21.6 a 10.5 12.8 11.6 a<br />
Ro-Till 17.5 22.3 19.9 a 6.5 6.3 6.4 a<br />
Mean 18.6 a 22.9 a 8.5 9.5<br />
DAP = Days after planting.<br />
* Overall means, within either tillage or variety, followed by the same letter are not significantly different<br />
(P= 0.05; ANOVA).<br />
Table 16. Effects of tillage practices on thrips populations in terminals<br />
of seedling peanuts – Repp Farms, Ft. Cobb, OK, <strong>2002</strong>.*<br />
Mean No. Thrips /10 Quadrifoliate leaves<br />
38 DAP 48 DAP<br />
Tillage Valor/ Weed Free Mean Valor/ Weed Free Mean<br />
32 oz Pre 32 oz Pre<br />
No-Till 12.3 7.5 9.9 a 18.8 9.8 14.3 a<br />
Ro-Till 9.8 8.3 9.0 a 16.5 22.5 19.5 a<br />
Mean 11.0 a 7.9 a 17.6 a 16.1 a<br />
DAP = Days after planting.<br />
* Overall means, within either tillage or variety, followed by the same letter are not significantly different<br />
(P= 0.05; ANOVA).<br />
20
P artners in<br />
rogress<br />
P E A N U T S<br />
Table 17. Effects of tillage practices on thrips populations in blooms<br />
– Repp Farms, Ft. Cobb, OK, <strong>2002</strong>.*<br />
Mean No. Thrips/10 Blooms<br />
61 DAP 68 DAP<br />
Tillage Valor/ Weed Free Mean Valor/ Weed Free Mean<br />
32 oz Pre 32 oz Pre<br />
No-Till 32.3 27.0 29.6 a 17.0 20.8 18.9 a<br />
Ro-Till 27.0 26.3 26.6 a 17.8 13.3 15.5 a<br />
Mean 29.6 a 26.6 a 17.4 a 17.0 a<br />
DAP = Days after planting.<br />
* Overall means, within either tillage or variety, followed by the same letter are not significantly different<br />
(P= 0.05; ANOVA).<br />
Table 18. Effects of tillage practices on defoliating caterpillar populations<br />
in peanuts – Repp Farms, Ft. Cobb, OK, <strong>2002</strong>.*<br />
Mean No. Defoliators/10 Sweeps<br />
100 DAP 114 DAP<br />
Tillage Valor/ Weed Free Mean Valor/ Weed Free Mean<br />
32 oz Pre 32 oz Pre<br />
No-Till 1.5 0.0 0.8 a 0.5 0.0 0.3 a<br />
Ro-Till 0.3 1.3 0.8 a 0.3 0.0 0.1 a<br />
Mean 0.9 a 0.6 a 0.4 a 0.0 a<br />
DAP = Days after planting.<br />
* Overall means, within either tillage or variety, followed by the same letter are not significantly different<br />
(P= 0.05; ANOVA).<br />
21
P artners in<br />
rogress<br />
P E A N U T S<br />
Table 19. Effects of tillage practices on grasshopper populations in<br />
peanuts – Repp Farms, Ft. Cobb, OK, <strong>2002</strong>.*<br />
Mean No. Grasshoppers/10 Sweeps<br />
100 DAP 114 DAP<br />
Tillage Valor/ Weed Free Mean Valor/ Weed Free Mean<br />
32 oz Pre 32 oz Pre<br />
No-Till 3.5 3.8 3.6 a 1.5 2.3 1.9 a<br />
Ro-Till 2.5 1.0 1.8 a 1.0 1.0 1.0 a<br />
Mean 3.0 a 2.4 a 1.2 a 1.6 a<br />
DAP = Days after planting.<br />
* Overall means, within either tillage or variety, followed by the same letter are not significantly different<br />
(P= 0.05; ANOVA).<br />
Table 20. Effects of tillage practices on potato leafhopper populations<br />
in peanuts – Repp Farms, Ft. Cobb, OK, <strong>2002</strong>.*<br />
Mean No. Leafhoppers/10 Sweeps<br />
100 DAP 114 DAP<br />
Tillage Valor/ Weed Free Mean Valor/ Weed Free Mean<br />
32 oz Pre 32 oz Pre<br />
No-Till 23.3 12.5 17.9 a 17.8 25.3 21.5 a<br />
Ro-Till 25.8 14.3 20.0 a 25.8 16.5 21.1 a<br />
Mean 24.5 a 13.4 a 21.8 a 20.9 a<br />
DAP = Days after planting.<br />
* Overall means, within either tillage or variety, followed by the same letter are not significantly different<br />
(P= 0.05; ANOVA).<br />
22
P artners in<br />
rogress<br />
P E A N U T S<br />
Table 21. Effects of tillage practices on beneficial arthropod populations<br />
in peanuts – Repp Farms, Ft. Cobb, OK, <strong>2002</strong>.*<br />
Mean No. Beneficials /10 Sweeps<br />
100 DAP 114 DAP<br />
Tillage Valor/ Weed Free Mean Valor/ Weed Free Mean<br />
32 oz Pre 32 oz Pre<br />
No-Till 2.5 0.3 1.4 a 2.3 3.3 2.8 a<br />
Ro-Till 3.5 0.5 2.0 a 3.5 3.5 3.0 a<br />
Mean 3.0 a 0.4 b 2.9 a 3.4 a<br />
DAP = Days after planting.<br />
* Overall means, within either tillage or variety, followed by the same letter are not significantly different<br />
(P= 0.05; ANOVA).<br />
Table 22. Effects of tillage practices on yield and grade of peanuts<br />
– Repp Farms, Ft. Cobb, OK, <strong>2002</strong>.*<br />
Yield (lbs/A)<br />
Grade (% TSMK)<br />
Tillage Valor/ Weed Free Mean Valor/ Weed Free Mean<br />
32 oz Pre 32 oz Pre<br />
No-Till 5191 5133 5162 a 73 74 73.5 a<br />
Ro-Till 5293 5685 5489 b 76 77 76.5 a<br />
Mean 5242 a 5409 a 74.5 a 75.5 a<br />
DAP = Days after planting.<br />
* Overall means, within either tillage or variety, followed by the same letter are not significantly different<br />
(P= 0.05; ANOVA).<br />
23
P artners in<br />
rogress<br />
P E A N U T S<br />
Miticide Evaluation Studies<br />
Six chemical miticides were evaluated for<br />
efficacy in controlling TSSM in peanuts.<br />
One portion of a five acre field was selected<br />
because of uniform infestation by TSSM.<br />
The field selected was planted in two strips<br />
on 36-inch rows on May 7. The two strips<br />
of peanuts consisted of alternating rows of<br />
Spanish (Tamspan 90) and runner (Tamrun<br />
96) type peanuts. Management practices<br />
in the designated area were modified to<br />
increase mite populations. These practices<br />
included application of Lorsban 15G (2 lb<br />
AI/A) on July 9 and one application each of<br />
Asana (0.035 lb AI/A) and Orthene (0.5 lb<br />
AI/A) on July 17 and 24, respectively. Following<br />
an application of Orthene, irrigation<br />
was suspended to further accentuate mite<br />
populations. The selected area became<br />
heavily and uniformly infested with mites.<br />
Plots were arranged within the area in a<br />
split-plot design with six replicates. Each<br />
plot was 25 ft long by four rows wide and<br />
consisted of two rows each of Spanish and<br />
runner type peanuts. Five applications of<br />
foliar fungicides were made to the plot area<br />
to prevent disease related problems (leaf<br />
spot and southern blight). Miticide treatments<br />
were applied on August 15 using<br />
a CO 2<br />
-pressurized bicycle sprayer calibrated<br />
to deliver 20 gpa at 22 psi through<br />
seven 11004 flat fan nozzles when traveling<br />
at 3 mph. Pretreatment counts were taken<br />
in each plot on August 15 just prior to application.<br />
Post-treatment counts were made<br />
on August 19, 22, 29 and September 4 or<br />
4, 7, 14, and 20 DAT, respectively. Treatments<br />
were evaluated by comparing mite<br />
control on 10 randomly selected plants per<br />
plot. Population densities of mites were<br />
estimated by sampling an area of 0.35<br />
in 2 (2.25 cm 2 ) on each plant. Yields were<br />
determined by digging, combining, drying,<br />
and weighing peanuts from all rows of each<br />
plot. Data were analyzed using ANOVA and<br />
LSD procedures.<br />
Weather conditions for the first seven days<br />
after treatment were good for activity of<br />
mites with no rainfall and a mean daily<br />
high temperature of 95.9° F. Seven DAT the<br />
irrigation system was restarted because the<br />
first half of August was so dry, and plants<br />
began to suffer (to the point of dying). The<br />
following day, the site received 1.28 inches<br />
of rain. The combination of irrigation and<br />
rainfall helped plants recover, but nearly<br />
eliminated mites across the entire area,<br />
with some exceptions. The only miticide<br />
that exhibited significantly fewer mites 4<br />
DAT was Kelthane (Table 23). By 7 DAT, all<br />
chemically treated peanuts had significantly<br />
fewer mites than the untreated plants. In<br />
addition, no significant differences in mite<br />
populations were observed between any<br />
of the treatments (Table 23). Throughout<br />
the first week, significantly more mites were<br />
recovered in runner type peanuts than in<br />
Spanish types (Table 23). After irrigation<br />
and subsequent rains both peanut types<br />
had similar mite populations until the final<br />
sampling period. Irrigation and/or rainfall,<br />
generally prevents mite populations from<br />
building up in peanuts. This is quite obvious<br />
based on results obtained in this trial after<br />
the heavy rainfall and irrigation (14 DAT and<br />
beyond), particularly in the untreated plots.<br />
The one exception to this scenario was the<br />
peanuts treated with Capture. Mite populations<br />
in these peanuts maintained a high<br />
population level and actually increased<br />
during the final two sampling periods (Table<br />
23). These high mite populations were<br />
significantly greater than any of the other<br />
peanuts receiving a chemical treatment, as<br />
well as the untreated plants. No significant<br />
differences in yield were detected between<br />
any of the whole plot (chemicals) or split<br />
plot (peanut type) treatments.<br />
24
Table 23. Effect of miticides on mite populations in runner and Spanish<br />
peanuts – Perkins, OK, <strong>2002</strong>.<br />
Treatment/ Rate Pre-Treatment 4 DAT 7 DAT 14 DAT 20 DAT 29 DAT Yield<br />
Formulation lb. AI/A Aug 15 Aug 19 Aug 22 Aug 29 Sept 4 Sept 13 Lbs/A*<br />
P artners in<br />
rogress<br />
P E A N U T S<br />
Aramite/4L 0.375 151.5 a 130.3 a 12.9 a 0.2 a 0.0 a 0.0 a 1986.7 a<br />
Aramite/4L 0.5 144.8 a 101.8 a 8.8 a 0.3 a 0.1 a 1.5 a 1937.5 a<br />
Comite/ 6.5EC 1.63 168.0 a 110.3 a 8.1 a 1.3 a 1.6 a 4.9 a 1866.0 a<br />
Capture/2EC 0.08 168.3 a 120.0 a 21.2 a 18.1 b 59.7 b 138.2 b 1800.5 a<br />
Kelthane/MF 0.75 178.8 a 19.3 b 15.3 a 5.2 a 3.3 a 1.9 a 1969.8 a<br />
Untreated ---- 162.2 a 136.6 a 132.1 b 4.2 a 2.8 a 0.5 a 1652.8 a<br />
Peanut Type Mean<br />
Spanish 140.1 a 91.1 a 18.9 a 4.6 a 10.1 a 18.7 a 1810.1 a<br />
Runner 184.4 b 114.9 b 47.3 b 5.1 a 12.4 a 30.3 b 1928.3 a<br />
DAT = Days after treatment.<br />
* Whole plot (chemical) and split plot (peanut type) means, within the same column followed by the same<br />
letter are not significantly different (ANOVA; LSD; P=0.05).<br />
25
P artners in<br />
rogress<br />
P E A N U T S<br />
Field Studies for the Control<br />
of Peanut Diseases<br />
J. P. Damicone and K. E. Jackson<br />
Department of Entomology and Plant Plant Pathology<br />
<strong>2002</strong> progress made possible through OPC support<br />
• Tamrun 96 continued to be the most profitable variety where Sclerotinia<br />
blight is a problem, while Tamspan 90 continues to have the best resistance.<br />
• The new runner varieties Tamrun OL 01 and Georgia Hi O/L showed<br />
moderate resistance to Sclerotinia blight and were more productive than<br />
Okrun, but not Tamrun 96.<br />
• Disease control and yield responses to Omega and Endura (BAS 510)<br />
fungicides for control of Sclerotinia blight were less than in previous years<br />
because of the extended wet weather in the fall, which delayed harvest.<br />
• Performance of Endura (BAS 510), a new fungicide for Sclerotinia blight, was<br />
inconsistent. Disease control with Endura was better when applications were<br />
made later in the season than recommended by the manufacturer.<br />
• Except where Sclerotinia blight was a problem, yield responses to fungicide<br />
programs generally resulted from the control of early leaf spot. Yield increases<br />
from fungicide programs were documented in far southwestern <strong>Oklahoma</strong><br />
for the first time as a result of leaf spot control.<br />
• Compared to full-season programs using six applications, adequate control<br />
of early leaf spot, but not southern blight, resulted from reduced numbers of<br />
fungicide applications. Yield loss from early leaf spot was prevented using<br />
reduced fungicide programs that were based on the calendar and the early<br />
leaf spot advisory program.<br />
• Headline, a new fungicide that will be available in 2003, was particularly<br />
effective against leaf spot in reduced fungicide programs.<br />
• As a result of the reduced value of peanuts under the new farm program,<br />
economic returns from fungicide programs were less than in previous years.<br />
26
Eleven field trials were completed in <strong>2002</strong><br />
that addressed the major peanut diseases<br />
growers face. Management strategies<br />
that were evaluated included chemical<br />
control, disease resistant varieties, and<br />
tillage. Efforts were made to develop and<br />
demonstrate a range of input levels for the<br />
disease management programs. Diseases<br />
studied included early leaf spot, pepper<br />
spot, southern blight, Sclerotinia blight,<br />
limb rot, and pod rot. Cooperation in these<br />
studies was provided by Ron Sholar and<br />
Jerald Nickels, Department of Plant and<br />
Soil Sciences; Phil Mulder, Department<br />
of Entomology and Plant Pathology; and<br />
Hassan Melouk, USDA/ARS in Stillwater.<br />
Appreciation is expressed to Gary Weger<br />
(Bryan County), Matt Meuller (Jackson<br />
County), and Roger Musick (Caddo<br />
County), who provided time and resources<br />
as on-farm cooperators for some of the<br />
trials. Bobby Weidenmaier, Jerry Howell,<br />
and Mike Brantes at the Caddo Research<br />
Station also are acknowledged for their<br />
valuable support and cooperation that<br />
made the trials at the research station a<br />
success.<br />
The studies on disease management<br />
in <strong>2002</strong> served several purposes. The<br />
first was to identify and refine better<br />
strategies for managing diseases. The<br />
second was to use the trials sites as<br />
demonstrations to show growers firsthand<br />
the benefits of disease management in<br />
peanut production. Trial sites in Bryan<br />
and Caddo counties were showcased<br />
during annual fall field tours. Results are<br />
summarized in this report. In interpreting<br />
the results, small differences in treatment<br />
values should not be overemphasized.<br />
Least significant difference (LSD) values<br />
are shown at the bottom of most tables.<br />
Unless two values differ by at least the<br />
LSD value shown, little confidence can be<br />
placed in the superiority of one treatment<br />
or variety over another.<br />
In <strong>2002</strong>, weather was generally favorable<br />
for the development of peanut diseases.<br />
Weather also was favorable for peanut<br />
production as most areas of the state<br />
received timely rains. Leaf spot appeared<br />
in most production areas of the state<br />
in June and July. Conditions remained<br />
favorable for leaf spot throughout most<br />
of the growing season. Levels of southern<br />
blight and limb rot were below normal in<br />
<strong>2002</strong> and did not become severe until<br />
September. Sclerotinia blight appeared<br />
in August and increased moderately<br />
until October. During October when the<br />
bulk of the state’s peanut acreage was<br />
harvested, cool rainy weather prevailed<br />
statewide. The wet conditions prevented<br />
harvest until November when frost, foliar<br />
diseases, and Sclerotinia blight had<br />
become severe. Trials in Jackson, Payne,<br />
and Caddo counties were harvested<br />
before the wet weather in the fall. Yields in<br />
these trials were high and only moderate<br />
damage from diseases occurred. Trials<br />
at the Caddo Research Station and in<br />
Bryan County were not harvested until<br />
November.<br />
Sclerotinia Blight<br />
Sclerotinia blight remains a destructive<br />
disease in <strong>Oklahoma</strong>. It occurs in all areas<br />
of the state except in far southwestern<br />
production areas. Trials on management<br />
of Sclerotinia blight were conducted at the<br />
Caddo Research Station. The trials were<br />
focused on evaluating fungicides and<br />
varieties, developing efficient fungicide<br />
programs, and determining the response of<br />
specific varieties to fungicide programs.<br />
Evaluation of Fungicides and<br />
Varieties<br />
Fungicide treatments applied to the<br />
susceptible variety Okrun were compared<br />
P artners in<br />
rogress<br />
P E A N U T S<br />
27
P artners in<br />
rogress<br />
P E A N U T S<br />
to untreated runner varieties and Tamspan<br />
90, a resistant Spanish variety. Runner<br />
varieties included Tamrun 96 and Tamrun<br />
OL 01, which have shown moderate<br />
resistance and improved yields where<br />
Sclerotinia blight is a problem. Fungicide<br />
treatments consisted of preventive and<br />
demand applications of Omega.<br />
Disease pressure was severe in this trial<br />
as it was harvested over two months after<br />
the last fungicide application (Table 1).<br />
Of the fungicide treatments applied to<br />
Okrun, Omega applied preventively at<br />
1.5 pt/A twice and a single application at<br />
2 pt/A reduced Sclerotinia blight compared<br />
to the check (untreated Okrun). A single<br />
application of Omega at 1 pt/A was<br />
not effective. Among the varieties not<br />
treated with fungicide, Tamspan 90<br />
showed excellent disease resistance,<br />
while AT1-1 was as susceptible as Okrun.<br />
Tamrun 96 and Georgia Hi O/L showed<br />
the best resistance of the runner varieties.<br />
Yield was increased above the Okrun<br />
check for all Omega treatments except<br />
the single application at 1 pt/A. Compared<br />
to the Okrun check, yield increases for<br />
effective Omega treatments exceeded<br />
1500 lb/A and for all varieties except<br />
AT1-1 exceeded 1000 lb/A. However,<br />
because of the severe disease pressure,<br />
yields of the resistant varieties were below<br />
3000 lb/A. Because of the high costs of<br />
Omega and the reduced value of peanuts<br />
in <strong>2002</strong>, returns ($/A) were similar among<br />
the Omega treatments and the resistant<br />
varieties.<br />
Evaluation of Endura (BAS 510)<br />
Endura is an experimental fungicide<br />
that has been tested at the Caddo<br />
Research Station since 1998 for control of<br />
Table 1. Control of Sclerotinia blight with fungicides or resistant<br />
varieties – Caddo Research Station, <strong>2002</strong>.<br />
Variety-Treatment Sclerotinia Yield Value Cost Return<br />
& rate/A blight (%) (lb/A) ($/A) ($/A) 1 ($/A) 2<br />
(no. applications)<br />
Okrun-Omega 4F 1 pt (1) 83 1844 340 48 292<br />
Okrun-Omega 4F 2 pt (1) 30 * 3057 * 564 93 471<br />
Okrun-Omega 4F 1.5 pt (2) 18 * 3420 * 631 141 490<br />
Tamspan 90-check 4 * 2722 * 484 0 484<br />
Tamrun 96-check 31 * 2701 * 469 0 469<br />
Tamrun OL-01-check 69 * 2635 * 469 0 469<br />
Georgia Hi O/L - check 15 * 2744 * 475 0 475<br />
AT 1-1 - check 99 1641 288 0 288<br />
Okrun-check 97 1336 244 0 244<br />
LSD (P=0.05) 3 22 510<br />
1 Treatment cost = cost of fungicide for Sclerotinia blight (Omega=$45/pt) + $3/A for application costs.<br />
2 Partial return = (crop value based on grade) - (treatment cost).<br />
3 Least significant difference. Values followed by an asterisk (*) are significantly different from the<br />
untreated Okrun check at P=0.05.<br />
28
Sclerotinia blight. Registration on peanuts<br />
is expected as soon as 2003. The<br />
fungicide also controls early leaf spot. In<br />
previous trials, its performance had been<br />
similar to that of Omega. In <strong>2002</strong>, the<br />
effectiveness of Endura was tested alone<br />
and in combination with Omega.<br />
Pressure from Sclerotinia blight was<br />
severe in this trial as infection was near<br />
100% and yields were below 2000<br />
lb/A for the untreated check (Table 2).<br />
All fungicides except Omega alone<br />
reduced levels of disease compared to<br />
the untreated check. Omega alternated<br />
with Endura provided the best disease<br />
control. All treatments increased yields<br />
compared to the check. Yield increases<br />
ranged from 700 lb/A for the Endura and<br />
Omega programs, to over 1500 lb/A for<br />
Endura alternated with Omega. Overall,<br />
Endura and Omega were less effective<br />
than in previous trials at this site. Disease<br />
control was excellent when the treatments<br />
were evaluated in September. However,<br />
because the trial was harvested more<br />
than two months after the last application,<br />
the disease increased dramatically during<br />
the wet weather in October.<br />
Variety Response to Fungicide<br />
Programs for Sclerotinia Blight<br />
Promising runner varieties were grown<br />
with and without fungicide treatment<br />
for Sclerotinia blight. Varieties included<br />
Tamrun 96, Tamrun OL 01, Georgia<br />
Green, Georgia Hi O/L, and AT1-1.<br />
Tamrun 96 and Tamrun OL 01 have<br />
previously shown moderate resistance.<br />
Georgia Green has been intermediate in<br />
reaction, while Georgia Hi O/L and AT1-1<br />
are new releases. These were compared<br />
to Okrun, a susceptible runner variety, and<br />
Tamspan 90, a resistant Spanish variety.<br />
Plots of each variety were left untreated,<br />
received a single application of Omega at<br />
2 pt/A made on demand, and two or three<br />
preventive applications of Endura (BAS<br />
510) on three week intervals.<br />
Levels of Sclerotinia blight were severe in<br />
this trial as evidenced by the near 100%<br />
infection level and yield below 2000 lb/A<br />
for the untreated Okrun check (Table 3).<br />
Levels of disease in untreated check plots<br />
ranged from only 6% for Tamspan 90 to<br />
99% for AT1-1. For the runner varieties,<br />
Tamrun OL 01 and Tamrun 96 showed<br />
P artners in<br />
rogress<br />
P E A N U T S<br />
Table 2. Evaluation of Endura (BAS 510) for control of Sclerotinia blight<br />
in the peanut variety Okrun – Caddo Research Station, <strong>2002</strong>.<br />
Treatment & rate/A Sclerotinia Yield Value<br />
(no. applications) blight (%) (lb/A) ($/A)<br />
Endura 70WG 9.1 oz (2) 67 * 2163 * 391<br />
Endura 70WG 9.1 oz (3) 49 * 2185 * 395<br />
Endura 70WG 9.1 oz (2) +<br />
Omega 4F 1 pt (2) 29 * 3282 * 593<br />
Omega 4F 1 pt (3) 87 2243 * 403<br />
check 96 1445 261<br />
LSD (P=0.05) 1 16 427<br />
1 Least significant difference. Values followed by an asterisk (*) are statistically different from the<br />
untreated check at P=0.05.<br />
29
P artners in<br />
rogress<br />
P E A N U T S<br />
the best resistance, while Georgia Hi O/L,<br />
AT1-1, and Okrun were most susceptible.<br />
Yield increases above Okrun for untreated<br />
plots ranged from 1000 lb/A for Georgia<br />
Hi O/L and Tamrun OL 01, to more than<br />
1500 lb/A for Tamrun 96.<br />
Fungicide programs reduced disease<br />
levels on all varieties except Tamspan<br />
90 and Tamrun 96. Generally, all spray<br />
programs reduced levels of Sclerotinia<br />
blight on the other varieties. Of the<br />
fungicide programs, three applications<br />
of Endura provided the best control.<br />
Fungicide programs increased yields<br />
compared to the untreated check for all<br />
varieties except Tamspan 90, Tamrun<br />
96, and Tamrun OL 01. Yield responses<br />
to fungicide programs were greatest for<br />
Okrun, Georgia Hi O/L, and AT1-1. Crop<br />
values ($/A) for untreated plots were<br />
improved over Okrun for all varieties<br />
except AT1-1 and was greatest for<br />
Tamrun 96. Partial returns (crop value<br />
less the treatment cost) could only be<br />
determined for Omega because the future<br />
cost of Endura was unknown. Omega,<br />
which costs $93/A, returned more than<br />
$100/A only for Okrun, Georgia Hi O/L,<br />
and AT1-1. Results demonstrated the<br />
importance of planting improved varieties<br />
were Sclerotinia blight is a problem.<br />
Table 3. Responses of peanut varieties to fungicide programs for control of<br />
Sclerotinia blight – Caddo Research Station, <strong>2002</strong>.<br />
Treatment & rate/A Okrun Tamspan Tamrun Tamrun Georgia Georgia AT 1-1<br />
(no. applications) 1 90 96 OL 01 Green Hi O/L<br />
Disease incidence (%)<br />
Omega 4F 2 pt (1) 74 3 17 11* 25* 38* 68*<br />
Endura 70WG 9.2 oz (2) 61* 6 25 14* 31* 32* 62*<br />
Endura 70WG 9.2 oz (3) 18* 1 13 4* 12* 7* 32*<br />
check 98 7 48 27 62 90 99<br />
LSD (P=0.05) 2 29 NS NS 11 23 28 27<br />
Yield (lb/A)<br />
Omega 4F 2 pt (1) 2940* 2931 4147 3285 2931 4147* 3076*<br />
Endura 70WG 9.2 oz (2) 2904* 2704 3857 3412 2695* 4120* 2704*<br />
Endura 70WG 9.2 oz (3) 3621* 3548 3930 3285 3058* 4710* 3140*<br />
check 1733 3013 3340 2859 2260 2813 1779<br />
LSD (P=0.05) 565 NS NS NS 308 603 886<br />
Value ($/A) 3<br />
Omega 4F 2 pt (1) 527 510 732 582 518 743 538<br />
Endura 70WG 9.2 oz (2) 521 471 681 604 477 738 473<br />
Endura 70WG 9.2 oz (3) 649 617 694 582 541 844 549<br />
check 311 524 590 506 400 504 311<br />
1 Omega was applied following first symptoms (on demand; August 8), while Endura was applied twice<br />
preventively (July 24 and August 14) and three times preventively (July 24, August 14, and August<br />
27).<br />
2 Least significant difference at P=0.05, NS=treatment effect not significant at P=0.05.<br />
3 Based on an average grade of 72 for Okrun, 71 for Tamspan 90, 71 for Tamrun 96, 72 for Tamrun 0L 01,<br />
71 for Georgia Green, 73 for Georgia Hi O/L, and 71 for AT 1-1.<br />
30
Unlike previous trials, the benefits of<br />
fungicide treatment were not additive to<br />
varietal selection for all varieties. Planting<br />
Tamrun 96 without fungicide treatment for<br />
Sclerotinia blight was among the most<br />
profitable strategies in this trial.<br />
Folicur and Abound also are effective<br />
against foliar diseases. Moncut must<br />
be tank-mixed with another fungicide to<br />
provide control of foliar diseases. In <strong>2002</strong>,<br />
two trials were conducted in Bryan County<br />
in a field with a history of southern blight.<br />
P artners in<br />
rogress<br />
P E A N U T S<br />
Timing and Rate of Omega<br />
Applications<br />
In this study, all of the spray programs were<br />
initiated when symptoms of Sclerotinia<br />
blight appeared. Single applications of<br />
1.0, 1.5, and 2.0 pt/A were made. Rates of<br />
0.5, 0.75, and 1.0 pt/A were applied three<br />
times on 10-day intervals. Rates of 0.75<br />
and 1.0 pt/A were applied twice on 21-<br />
day intervals. A preventive program of 1.5<br />
pt/A applied twice and a untreated check<br />
were included for comparison. Disease<br />
pressure was severe (77%) in check plots<br />
that yielded less than 2000 lb/A. In general,<br />
the spray programs were only moderately<br />
effective. The best Omega treatments had<br />
more than 40% infection and yielded from<br />
2700 to 3000 lb/A. The spray programs<br />
that provided the highest partial returns<br />
(crop value less the treatment cost), which<br />
ranged from $404 to $460/A, were the<br />
single applications at 1.5 and 2.0 pt/A,<br />
two applications at 0.75 and 1.0 pt/A on<br />
21-day intervals, and three applications at<br />
1.0 pt/A on 10-day intervals.<br />
Southern Blight and Limb<br />
Rot<br />
Southern blight is another damaging<br />
soilborne disease that is a problem<br />
statewide. Effective management of<br />
southern blight relies on the use of<br />
fungicides because varieties with<br />
resistance are not locally adapted and<br />
long crop rotations often are not feasible.<br />
Folicur, Abound, and Moncut have<br />
provided good to excellent disease control<br />
in fields with a history of southern blight.<br />
Effect of Reduced Spray Programs<br />
In an effort to reduce the costs of<br />
peanut production, fungicide programs<br />
consisting of two to four applications were<br />
compared to a full season program for<br />
control of soilborne and foliar diseases. A<br />
full-season program of six applications of<br />
Tilt/Bravo served as the check treatment.<br />
Southern blight pressure was heavy in this<br />
trial, but it developed late in the season<br />
and was unevenly distributed over the<br />
plots. Leaf spot became a problem in<br />
September, but most treatments provided<br />
adequate control in that defoliation was<br />
maintained below 50%. Harvest was<br />
delayed until October 31 due to wet<br />
conditions in October, but frost damage<br />
was not a problem at this site. Limb<br />
rot was prevalent at harvest, but its<br />
distribution was uneven.<br />
The Abound/Folicur treatment was the<br />
only spray program that statistically<br />
reduced southern blight compared to<br />
the Tilt/Bravo check (Table 4). The high<br />
(labeled) rate of Abound and the Omega<br />
treatment also appeared to be effective.<br />
The lack of effectiveness of the threespray<br />
Folicur program was surprising.<br />
The high rate of Abound and the Abound/<br />
Folicur programs were the only treatments<br />
that increased yields compared to the Tilt/<br />
Bravo check. In comparing partial returns<br />
(crop value less the treatment cost) to the<br />
Tilt/Bravo check, the high rate of Abound<br />
and the Abound/Folicur program returned<br />
more than $150/A, the low rate of Abound<br />
returned about $80/A, and the other<br />
programs were not profitable.<br />
31
P artners in<br />
rogress<br />
P E A N U T S<br />
Evaluation of Full-Season Spray<br />
Programs<br />
Full-season spray programs with Abound,<br />
Folicur, and Moncut were compared to<br />
the experimental fungicides Headline,<br />
AMS 21619A, and USF2010 for control<br />
of southern blight. A full-season program<br />
of Bravo on 14-day intervals served as<br />
a control. Unfortunately, southern blight<br />
did not develop to damaging levels in<br />
this study and all of the spray programs<br />
provided excellent leaf spot control. Limb<br />
rot was a problem at harvest, but treatment<br />
effects on this disease were not statistically<br />
different. Yields were high in this study,<br />
ranging from 3800 to 4400 lb/A. The high<br />
rate of AMS 21619A (4474 lb/A) and the<br />
Abound program (4447 lb/A) resulted in<br />
statistically increased yields compared to<br />
the Bravo check (3848 lb/A). However, the<br />
yield increases were not associated with<br />
any obvious differences in disease.<br />
Foliar Diseases<br />
Foliar diseases are widespread across all<br />
production areas of <strong>Oklahoma</strong> and can be<br />
damaging when severe. Where early leaf<br />
spot is not controlled, yield losses have<br />
averaged from 500 to 700 lb/A. However,<br />
losses exceeding 1000 lb/A are possible<br />
in years when weather patterns favor<br />
severe disease development. Pepper<br />
spot is a foliar disease that has increased<br />
in prevalence in recent years, particularly<br />
on runner varieties. However, the damage<br />
potential of this disease and effective<br />
treatments for its control have not been<br />
identified. Evaluation of new fungicides for<br />
Table 4. Evaluation of reduced fungicide programs for control of<br />
southern blight and limb rot on the variety Okrun – Bryan County,<br />
<strong>2002</strong>.<br />
Treatment & Rate/A Southern Limb rot Defoliation Yield Value<br />
(timing 1 ) blight (%) (%) (%) (lb/A) ($/A) 2<br />
Tilt/Bravo 18 fl oz (1-6) 26 40 1 2695 514<br />
Folicur 3.6F 7.2 fl oz (2,3,4) 28 30 21 2723 519<br />
Abound 2.1F 12.3 fl oz (2,4) 31 70 39 * 3067 584<br />
Abound 2.1F 18.4 fl oz (2,4) 14 23 46 * 3848 * 733<br />
Abound 2.1F 12.3 fl oz (2,4)<br />
Folicur 3.6F 7.2 fl oz (3) 6 * 34 15 3548 * 676<br />
Headline 2.1E 12 fl oz (1,3)<br />
Bravo 720 1.5 pt (2,4,5) 29 19 0 2886 550<br />
Bravo 720 1.5 pt +<br />
Omega 4F 1.5 pt (2,4) 15 20 4 3058 583<br />
LSD (P=0.05) 3 18 NS 30 540<br />
1 Spray numbers (1-6) correspond to the spray dates of July 5, July 23, August 6, August 20, September<br />
3, and September 18.<br />
2 Values based on grade, which averaged 78.<br />
3 Least significant difference; NS – treatment effect not significant at P=0.05. Means within a column<br />
followed by an asterisk (*) are significantly different from the Tilt/Bravo check.<br />
32
control of foliar diseases has been difficult<br />
in recent years due to drought conditions<br />
and resulting low disease pressure.<br />
Evaluation of Full-Season<br />
and Reduced Spray Programs<br />
Fungicides were compared for control<br />
of early leaf spot on Tamspan 90 and<br />
Tamrun 96 at the Agronomy Research<br />
Farm in Perkins and at the Caddo<br />
Research Station. New fungicides<br />
evaluated included Headline, which has<br />
provided superior control of early leaf<br />
spot in previous trials; and Stratego,<br />
a newly registered fungicide for foliar<br />
disease control. Full-season programs<br />
consisting of six applications applied<br />
on a 14-day schedule included Bravo,<br />
Tilt/Bravo, the Folicur block program,<br />
Stratego, and Bravo/Abound. Reduced<br />
fungicide programs included Tilt/Bravo<br />
applied according to the MESONET<br />
early leaf spot advisory, four calendarbased<br />
applications of Bravo alternated<br />
with Headline at 6 and 9 fl oz, and three<br />
calendar-based applications of Folicur<br />
alternated with Bravo.<br />
In Perkins, early leaf spot appeared in late<br />
July and increased during August and<br />
September to severe levels on Tamspan<br />
90. All spray programs reduced leaf spot<br />
during the growing season until late in<br />
the season. On the last evaluation date<br />
(Table 5), leaf spot levels on Tamspan 90<br />
for the reduced fungicide programs and<br />
the Folicur block did not statistically differ<br />
from the untreated check. The full-season<br />
Bravo program provided the best disease<br />
control. All spray programs reduced<br />
defoliation below 50% at the end of the<br />
season. Yields were increased compared<br />
to the untreated check for all spray<br />
programs. Yield increases ranged from<br />
400 lb/A for the Folicur block program to<br />
1000 lb/A for the high rate of Headline.<br />
Partial economic returns (crop value<br />
less treatment costs) were positive for<br />
all fungicide programs except the Folicur<br />
block and the Bravo/Abound programs.<br />
This was attributed to the lack of disease<br />
pressure from soilborne diseases and the<br />
high cost for the full-season Folicur and<br />
Abound programs. The results in Perkins<br />
were similar for Tamrun 96. At the Caddo<br />
Research Station, disease pressure<br />
from early leaf spot was negligible until<br />
October and never reached damaging<br />
levels on either Tamspan 90 or Tamrun 96.<br />
As a result, none of the spray programs<br />
increased yield and their use was not<br />
profitable.<br />
Tillage Effects on Peanut<br />
Diseases Control<br />
Reduced tillage is increasing in popularity<br />
as a means of reducing production costs<br />
and soil erosion. Previous research has<br />
shown that southern blight and leaf<br />
spot pressure may be greater in no-till<br />
production than conventional tillage.<br />
However, diseases were not increased<br />
when strip tillage (ro-till) was employed.<br />
However, this research needs to be<br />
verified in different locations. In addition,<br />
questions about the effectiveness of<br />
fungicide programs under reduced tillage<br />
have been posed. In <strong>2002</strong>, trials were<br />
conducted in Caddo County to address<br />
the impact of tillage on diseases and their<br />
management.<br />
Effectiveness of Full and Reduced<br />
Fungicide Programs Under Strip<br />
Tillage<br />
The trial was established in a field with<br />
a history of damage to AT-120, an early<br />
maturing runner variety, due to soilborne<br />
diseases such as pod rot. Because<br />
AT-120 is being replaced by AT1-1,<br />
P artners in<br />
rogress<br />
P E A N U T S<br />
33
P artners in<br />
rogress<br />
P E A N U T S<br />
Table 5. Effectiveness of full and reduced spray programs on control of<br />
early leaf spot on the variety Tamspan 90 – <strong>OSU</strong> Agronomy Research<br />
Farm, Perkins, <strong>2002</strong>.<br />
Treatment and rate/A Leaf Defoliation Yield Value Cost Return<br />
(timing 1 ) spot (%) (%) (lb/A) ($/A) 2 ($/A) 3 ($/A) 4<br />
Bravo 720 1.5 pt (1-6) 6 * 1 * 3616 * 566 72 494<br />
Bravo 720 1.5 pt (1,6)<br />
Folicur 3.6F 7.2 fl oz (2-5) 71 39 * 3049 * 477 123 354<br />
Bravo 720 1.5 pt (1,3,5,6)<br />
Abound 2.1F 18.5 fl oz (2,4) 30 * 10 * 3064 * 480 126 354<br />
Stratego 2.1E 7 fl oz (1-6) 34 * 13 * 3724 * 583 72 511<br />
Headline 250E 6 fl oz (1,3)<br />
Bravo 720 1.5 pt (2,5) 46 * 12 * 3499 * 548 ? ?<br />
Headline 2.08E 9 fl oz (1,3)<br />
Bravo 720 1.5 pt (2,5) 70 32 * 3746 * 586 ? ?<br />
Bravo 720 1.5 pt (1)<br />
Folicur 3.6F 7.2 fl oz (2,5) 75 45 * 3115 * 488 61 427<br />
Tilt/Bravo 18 fl oz (1-6) 39 * 3 * 3274 * 513 71 442<br />
Tilt/Bravo 18 fl oz (Adv.) 77 48 * 3398 * 532 48 484<br />
check 91 77 2643 414 0 414<br />
LSD (P=0.05) 5 24 13 324<br />
1 Spray numbers (1 - 6) correspond to the spray dates of June 24, July 8, July 22, August 5, August 16,<br />
and August 30. Adv. = Sprays applied according to the early leaf spot advisory program on June 24,<br />
July 17, August 15, September 10.<br />
2 Cost based on $5.98/pt for Bravo, $3.01/fl oz for Folicur, $1.95/fl oz for Abound, and $9.00/7 fl oz<br />
Stratego, and $3.00/application for application costs.<br />
3 Crop value was based on grade, which averaged 62.<br />
4 Partial return = (crop value) - (treatment cost).<br />
5 Least significant difference; means in a column followed by an asterisk (*) are significantly different<br />
from the untreated check at P=0.05.<br />
34<br />
fungicide programs were evaluated on this<br />
variety and Tamrun 96, which has shown<br />
resistance to pod rot and other soilborne<br />
diseases. Full and reduced fungicide<br />
programs were designed to control foliar<br />
and soilborne diseases. The full-season<br />
fungicide program consisted of the<br />
Folicur block program. Reduced fungicide<br />
programs included a four-spray Headline/<br />
Bravo alternation; two applications of<br />
Folicur, Abound, and Bravo/Moncut; and a<br />
single application of Abound.<br />
Pod rot developed at moderate levels on<br />
AT1-1, but not on Tamrun 96 confirming<br />
previous observations. However, yield<br />
responses to fungicide programs appeared<br />
to result primarily from control of early leaf<br />
spot, which became severe in the study.<br />
At the end of the season, the Folicur block<br />
and Headline/Bravo programs provided<br />
the best disease control on Tamrun 96<br />
(Table 6). All of the spray programs except<br />
Bravo/Moncut kept defoliation at 50%<br />
or less. Similarly, yield increases above<br />
the untreated check were statistically
significant for all spray programs except<br />
Bravo/Moncut. Yield increases ranged<br />
from 700 lb/A for the Abound programs<br />
and the reduced Folicur program to<br />
1400 lb/A for the Headline/Bravo program.<br />
Based on the costs of the fungicide<br />
programs, partial returns (crop value less<br />
treatment costs) were increased over the<br />
untreated check by $75 to $100/A for all of<br />
the spray programs except Bravo/Moncut.<br />
Had harvest of this trial been delayed, the<br />
Abound and reduced Folicur programs<br />
would likely have failed to prevent yield<br />
loss from early leaf spot.<br />
Impact of Tillage System on Disease<br />
Development<br />
Levels of disease were monitored in<br />
replicated plots of conventional tillage,<br />
strip tillage, and no tillage in Caddo<br />
County. Plots were planted with Tamrun<br />
OL 01 and Tamrun 96 and did not receive<br />
any fungicide applications. There were no<br />
differences in the onset of early leaf spot<br />
among the tillage systems.<br />
Seedling Disease<br />
Seedling disease is usually not a<br />
problem in peanut production. Fungicide<br />
treatments such as Vitavax PC and Tops<br />
PC are applied to commercial seeds to<br />
effectively control seedling disease. A<br />
trial was conducted at the <strong>OSU</strong> Agronomy<br />
Farm in Perkins in which experimental<br />
seed treatments were compared to<br />
Vitavax PC for control of seedling<br />
disease. The experimental treatments<br />
P artners in<br />
rogress<br />
P E A N U T S<br />
Table 6. Effect of full and reduced spray programs on control of early<br />
leaf spot on the variety Tamrun 96 grown under strip-till – Caddo<br />
County, <strong>2002</strong>.<br />
Treatment and rate/A Leaf Defoliation Yield Value Cost Return<br />
(timing 1 ) spot (%) (%) (lb/A) ($/A) 2 ($/A) 3 ($/A) 4<br />
Bravo 720 1.5 pt (1,6)<br />
Folicur 3.6F 7.2 fl oz (2-5) 7 * 0 * 5391 * 980 123 857<br />
Headline 2.08E 15 fl oz (1,3)<br />
Bravo 720 1.5 pt (2,5) 11 * 1 * 5781 * 1051 ? ?<br />
Bravo 720 1.5 pt +<br />
Moncut 70DF 1.0 lb (2,4) 72 62 4347 790 74 716<br />
Folicur 3.6F 7.2 fl oz (2,4) 67 50 5028 * 914 50 864<br />
Abound 2.08E 18.4 fl oz (2,4) 64 37 * 5191 * 943 78 893<br />
Abound 2.08E 18.4 fl oz (2) 67 50 5137 * 934 39 895<br />
check 75 57 4302 782 0 782<br />
LSD (P=0.05) 5 14 10 398<br />
1 Spray numbers (1-6) correspond to the spray dates of June 27, July 9, July 24, August 7, August 21,<br />
and September 4.<br />
2 Cost based on $5.98/pt for Bravo, $3.01/fl oz for Folicur, $1.95/fl oz for Abound, and $9.00/7 fl oz<br />
Stratego, $25/lb for Moncut, and $3.00/application for application costs.<br />
3 Crop value was based on grade, which averaged 74.<br />
4 Partial return = (crop value) - (treatment cost).<br />
5 Least significant difference; means in a column followed by an asterisk (*) are significantly different<br />
from the untreated check at P=0.05.<br />
35
P artners in<br />
rogress<br />
P E A N U T S<br />
36<br />
(A13845A, A13847A, and A13848A) were<br />
mixtures of the fungicides Apron, Maxim,<br />
and Abound at various ratios. For two of<br />
the treatments, Abound at 6 fl oz/A was<br />
sprayed in the planting furrow in addition<br />
to Vitavax PC and A13848A.<br />
All of the treatments dramatically increased<br />
plant stand compared to untreated seed.<br />
Plant stand for the treatments were similar<br />
statistically, ranging from 68% to 78%,<br />
compared to 8% for the untreated check.<br />
None of the experimental treatments<br />
increased the stand compared to Vitavax<br />
PC. The addition of Abound in-furrow<br />
did not increase the stand compared<br />
to respective seed treatments alone.<br />
All of the seed treatments increased<br />
yields compared to the 1162 lb/A for the<br />
untreated check. Yields for the treatments<br />
ranged from 3378 to 4156 lb/A. The only<br />
treatment that increased yields compared<br />
to Vitavax PC was the combination of<br />
A13848A and Abound in-furrow. However,<br />
the combination of Abound in-furrow with<br />
the Vitavax PC or A13848A seed treatments<br />
did not increase yields compared to<br />
the respective seed treatments alone.<br />
Results demonstrated the value of seed<br />
treatments in achieving an adequate<br />
stand and dramatically increasing yields<br />
compared to no seed treatment. However,<br />
the addition of an in-furrow application of<br />
Abound did not translate into an improved<br />
stand or increased yield.<br />
Disease Management in<br />
Southwestern <strong>Oklahoma</strong><br />
Peanut production is increasing in far<br />
southwestern <strong>Oklahoma</strong>. Growers in this<br />
part of the state have not experienced<br />
severe losses to disease because of low<br />
rainfall and humidity, and the soils do not<br />
have a long history of peanut production.<br />
However, foliar diseases, southern blight,<br />
limb rot, and pod rot have been identified<br />
as potentially damaging diseases in this<br />
new peanut area.<br />
In <strong>2002</strong>, a trial was conducted in Jackson<br />
County that was focused on determining the<br />
response of peanut varieties to fungicide<br />
programs (Table 7). Because high disease<br />
pressure was not anticipated, reducedinput<br />
spray programs were evaluated on<br />
the three most commonly grown varieties<br />
in the area. Varieties included Tamrun<br />
96, which has moderate resistance to<br />
several soilborne diseases, and AT-120<br />
and Okrun, which are susceptible to most<br />
soilborne diseases. Fungicide programs<br />
consisted of one or two applications,<br />
targeted at either foliar disease (Bravo,<br />
Tilt/Bravo), soilborne disease (Moncut), or<br />
both (Abound, Folicur, Headline).<br />
Early leaf spot was the primary disease<br />
at this site. The disease appeared in<br />
early August and increased to about<br />
90% infection and 70% defoliation in the<br />
untreated check plots at harvest. AT-120<br />
was slightly more susceptible to leaf spot<br />
than Okrun or Tamrun 96. For each variety,<br />
all of the spray programs except Moncut<br />
reduced levels of leaf spot compared to<br />
the untreated check. Disease control was<br />
excellent on September 24, but increased<br />
late in the season because the last<br />
applications were made in early August.<br />
Headline and Folicur provided the best<br />
disease control. On October 15 when<br />
the plots were dug, percent incidence of<br />
leaf spot/defoliation averaged 28/15 for<br />
Bravo, 17/3 for Folicur, 14/2 for Headline,<br />
92/77 for Moncut, 77/35 for the single<br />
application of Abound, 33/5 for two<br />
applications of Abound, and 68/26 for the<br />
advisory program using Tilt/Bravo. Yields<br />
and grades were high at this location.<br />
Yield responses to fungicide programs<br />
were similar for each variety. All of the<br />
fungicide programs yields increased
compared to the non-treated check.<br />
Yield increases ranged from 700 lb/A for<br />
Moncut to 1100 lb/A for Headline. The<br />
significant yield response from Moncut<br />
was surprising because it did not control<br />
leaf spot, and soilborne diseases such<br />
as southern blight and limb rot were<br />
not evident. Based on the cost of the<br />
fungicide programs, which ranged from<br />
$24/A for Bravo and Tilt/Bravo to $78/A<br />
for the two applications of Abound, all<br />
spray programs increased partial returns<br />
(crop value less treatment costs) above<br />
the untreated check. Increases in partial<br />
returns were $70/A for Moncut and<br />
more than $100 for the other fungicide<br />
programs. The partial return for Headline<br />
could not be determined because the<br />
cost for this fungicide is not yet known.<br />
P artners in<br />
rogress<br />
P E A N U T S<br />
Table 7. Effect of spray programs on yield and value of peanut varieties<br />
– Jackson County, <strong>2002</strong>.<br />
Treatment and rate/A AT-120 Okrun T-96 Mean 2<br />
(timing 1 )<br />
Yield (lb/A)<br />
Bravo WS 6F 1.5 pt (1,2) 6244 6216 5971 6144 a<br />
Folicur 3.6F 7.2 fl oz (1-2) 6688 6334 5781 6268 a<br />
Headline 2.1E 9.2 fl oz (1,2) 6416 6534 5980 6310 a<br />
Moncut 70DF 1.0 lb (1-2) 5699 6126 5899 5908 a<br />
Abound 2.1F 18.5 fl oz (1) 6289 6244 5971 6168 a<br />
Abound 2.1F 18.5 fl oz (1,2) 6598 6198 6162 6319 a<br />
Tilt/Bravo 18 fl oz (adv) 6153 5999 6098 6083 a<br />
check 5055 5236 5345 5212 b<br />
Mean 3 6143 a 6111 a 5901 a<br />
Value ($/A) 4<br />
Bravo WS 6F 1.5 pt (1,2) 1149 1179 1102 1143<br />
Folicur 3.6F 7.2 fl oz (1-2) 1230 1202 1067 1166<br />
Headline 2.1E 9.2 fl oz (1,2) 1180 1240 1104 1175<br />
Moncut 50W 1.2 lb (1-2) 1048 1162 1089 1100<br />
Abound 2.1F 18.5 fl oz (1) 1157 1185 1102 1148<br />
Abound 2.1F 18.5 fl oz (1,2) 1214 1176 1137 1176<br />
Tilt/Bravo 18 fl oz (adv) 1132 1138 1126 1132<br />
check 930 993 987 970<br />
Mean 1130 1159 1089<br />
1 Spray numbers 1 to 2 correspond to the spray dates of 1 = July 10 and 2 = August 7. Adv. = two sprays<br />
applied according to the MESONET early leaf spot advisory program on July 10 and August 5.<br />
2 Mean values over varieties followed by an asterisk (*) are significantly different from the untreated<br />
check at P=0.05.<br />
3 Mean values over treatments followed by the same letter are not significantly different at P=0.05.<br />
4 Values based on grade, which averaged 75 for AT-120, 77 for Okrun, and 75 for Tamrun 96.<br />
37
P artners in<br />
rogress<br />
P E A N U T S<br />
Development of Integrated<br />
Strategies for Management of<br />
Soilborne Peanut Diseases*<br />
K. E. Jackson and J. P. Damicone<br />
Department of Entomology and Plant Pathology<br />
H. A. Melouk, USDA-ARS<br />
<strong>2002</strong> progress made possible through OPC support<br />
• Incidence of Sclerotinia blight in research plots at the Caddo Research Station<br />
in <strong>2002</strong> increased dramatically near the end of the peanut growing season, thus,<br />
allowing a meaningful disease evaluation of the advanced breeding lines.<br />
• Differences in Sclerotinia blight incidence and yield between susceptible and<br />
resistant breeding lines were evident in several of the field studies.<br />
• Seven runner breeding lines, with high oleic content, exhibited good levels of<br />
resistance to Sclerotinia blight.<br />
• One runner breeding line, TX994374, with enhanced oleic content, produced<br />
1900 lb/A more than Florunner under moderately severe Sclerotinia pressure.<br />
• One runner breeding line, TX991720, with enhanced oleic content, had the<br />
lowest Sclerotinia incidence and the highest yield with a grade of 72.<br />
• Tamrun 96 and Southwest Runner had the lowest incidence of southern blight<br />
at the Yoakum location in Yoakum, TX and Bryan County, OK.<br />
• Yield of Tamrun 96 at the Yoakum location was superior to other peanut lines.<br />
• In six studies at four different <strong>Oklahoma</strong> locations, the advanced breeding<br />
line Tamrun OL 02, with enhanced high oleic content, had similar grades and<br />
incidences of Sclerotinia blight as Tamrun OL 01 and Tamrun 96. However,<br />
Tamrun OL 02 had yields of 250 lb/A and 380 lb/A less than Tamrun OL 01 and<br />
Tamrun 96, respectively.<br />
38<br />
Peanut yield and grade are affected by<br />
several soilborne diseases. Sclerotinia<br />
blight, one of the two major soilborne<br />
diseases, is continuing to be a major<br />
threat to peanut production in <strong>Oklahoma</strong><br />
and more so now with the new farm bill<br />
reducing peanut prices. Continuous<br />
cropping of peanuts favors a buildup of<br />
* Two Ph.D. graduate students are assisting in these<br />
investigations.<br />
sclerotial populations in soil to a level<br />
that often cause severe epidemics on an<br />
annual basis. Chemical management of<br />
Sclerotinia blight is necessary, but it is<br />
costly to growers under the current farm bill.<br />
The second important soilborne disease<br />
is southern blight, which causes economical<br />
losses if not managed. Therefore, the<br />
ultimate goal of this research is to develop<br />
a disease management system for peanut
production utilizing natural resistance with<br />
minimum inputs for sustaining profitability<br />
under the <strong>2002</strong> farm commodity program.<br />
Sclerotinia Blight Resistance<br />
Research<br />
This research has been conducted<br />
continually since 1982 to discover<br />
disease resistance in the peanut<br />
germplasm and breeding lines to the<br />
Sclerotinia blight fungus and other<br />
soilborne pathogens. The incidence of<br />
Sclerotinia blight in many of the research<br />
plots at the Caddo Research Station in<br />
<strong>2002</strong> increased dramatically near the<br />
end of the peanut growing season, thus,<br />
allowing a meaningful disease evaluation<br />
of the advanced breeding lines.<br />
Therefore, differences in Sclerotinia blight<br />
incidence and yield between susceptible<br />
and resistant breeding lines were evident<br />
in several of the field studies.<br />
Several advanced runner peanut lines,<br />
with enhanced oleic acid content, from<br />
the breeding program at Texas A&M<br />
<strong>University</strong> and <strong>Oklahoma</strong> <strong>State</strong> <strong>University</strong><br />
are being continually evaluated for<br />
resistance to Sclerotinia blight in field<br />
plots at multiple locations in <strong>Oklahoma</strong><br />
and Texas. Several runner-type peanut<br />
breeding lines with high oleic acid content<br />
exhibited less Sclerotinia than the cultivar<br />
Florunner. Performance (Sclerotinia<br />
reaction, yield, and grade) of a selected<br />
number of peanut breeding lines at the<br />
Caddo Research Station are shown in<br />
Tables 1 and 2.<br />
New sources of resistance to Sclerotinia<br />
blight were identified in new peanut<br />
germplasm from Ecuador and Peru that<br />
were evaluated at the Caddo Research<br />
Station in 2001 and <strong>2002</strong> (Table 3).<br />
Southern Blight Research<br />
A study at Yoakum, TX in cooperation with<br />
Texas A&M <strong>University</strong>, was conducted<br />
during the <strong>2002</strong> growing season to<br />
evaluate the reaction of selected<br />
advanced peanut breeding lines to the<br />
southern blight organism. Tamrun 96<br />
and Southwest Runner had the lowest<br />
incidence of southern blight at both<br />
the Yoakum, TX and Bryan County, OK<br />
locations as compared to other lines in the<br />
test. Comparison of the yields showed that<br />
Tamrun 96 was superior to the other lines<br />
in Yoakum. (Table 4).<br />
P artners in<br />
rogress<br />
P E A N U T S<br />
39
P artners in<br />
rogress<br />
P E A N U T S<br />
Table 1. Runner breeding line evaluation to Sclerotinia blight (Texrun<br />
1) – Caddo Research Station, Ft. Cobb, OK, <strong>2002</strong>.<br />
Entry 1 Yield Rank 2 % Sclerotinia Rank 4 Grade 5<br />
Blight 3<br />
Tamrun OL 01 3231 5 48.8 12 73<br />
Tamrun 96 3606 2 37.3 8.5 72<br />
Georgia Green 2819 15 33.5 6 75<br />
Flavor Runner 458 2105 17 63.3 17 73<br />
Florunner 1670 20 68.0 18 72<br />
TX977116 1936 18 76.0 19 75<br />
TX972056 3001 10 37.5 10 71<br />
TX994371 3400 3 41.8 11 67<br />
TX994392 3267 4 32.3 5 73<br />
TX971783 2977 12 30.0 3 73<br />
TX977045 2723 16 52.5 13 68<br />
TX993380 3110 8 53.5 14 70<br />
TX977239 2916 13 56.3 16 70<br />
Tamrun OL 02 2880 14 56.0 15 70<br />
TX977046 1803 19 80.5 20 70<br />
TX994374 3655 1 19.3 1 67<br />
TX944396 3025 9 34.3 7 71<br />
TX994399 3219 6 37.3 8.5 71<br />
TX994395 3171 7 31.5 4 67<br />
TX994389 2977 11 30.0 2 71<br />
LSD 0.05 653 22.4<br />
Pr > F 0.0001 0.0001<br />
1<br />
Planted May 13 and harvested November 11.<br />
2<br />
Rank highest to lowest.<br />
3<br />
Percent Sclerotinia blight was determined by dividing the number of infection loci by the number of<br />
potential infection loci and multiplying by 100. An infection locus is defined as an area of disease<br />
symptoms equal to or less than 6 inches long in a standard row. Evaluation date October 2.<br />
4<br />
Rank lowest to highest.<br />
5<br />
Average of 2 replications.<br />
40
Table 2. Runner breeding line evaluation to Sclerotinia blight (Texrun2)<br />
– Caddo Research Station, Ft. Cobb, OK, <strong>2002</strong>.<br />
Entry 1 Yield Rank 2 % Sclerotinia Rank 4 Grade 5<br />
Blight 3<br />
TX991706 3017 5 28.3 8 71<br />
TX991711 2920 8.5 19.7 3 71<br />
TX991712 2920 8.5 23.3 4.5 72<br />
TX991720 3388 1 14.7 1 72<br />
TX991713 2775 12 15.3 2 73<br />
TX991709 3259 3 24.3 7 72<br />
TX991701 2888 10 24.0 6 73<br />
TX991714 2710 13 35.7 13 70<br />
TX991710 2678 15 29.3 10.5 73<br />
TX991705 2968 7 29.3 10.5 71<br />
TX991716 2388 17 23.3 4.5 72<br />
TX991717 2227 18 51.7 16 70<br />
TX991722 2694 14 42.3 14 69<br />
TX991721 2000 20 62.3 20 68<br />
TX991719 2791 11 28.7 9 71<br />
TX991715 2468 16 35.7 12 71<br />
Tamrun 98 2130 19 57.0 19 72<br />
Tamrun 96 3372 2 51.0 15 72<br />
Tamrun OL 01 3065 4 55.7 17 70<br />
Tamrun OL 02 2969 6 56.0 18 71<br />
LSD 0.05 502 18.3<br />
Pr > F 0.0001 0.0001<br />
1<br />
Planted May 13 and harvested November 6.<br />
2<br />
Rank highest to lowest.<br />
3<br />
Percent Sclerotinia blight was determined by dividing the number of infection loci by the number of<br />
potential infection loci and multiplying by 100. An infection locus is defined as an area of disease<br />
symptoms equal to or less than 6 inches long in a standard row. Evaluation date October 2.<br />
4<br />
Rank lowest to highest.<br />
5<br />
Average of 2 replications.<br />
P artners in<br />
rogress<br />
P E A N U T S<br />
41
P artners in<br />
rogress<br />
P E A N U T S<br />
Table 3: Reaction of selected peanut lines to Sclerotinia minor in the<br />
greenhouse and in field plots (<strong>2002</strong>).<br />
Entry ID 1 Origin Botanical Type Disease AUDPC 3<br />
Incidence (%) 2<br />
PI 501274 ( R 88) Peru Runner/Virginia 3 74<br />
PI 501280 ( R 93) Peru Valencia 3 105<br />
PI 501286 ( R 98) Peru Valencia 53 55<br />
PI 501290 ( R 101) Peru Valencia 15 88<br />
PI 501980 ( R 116) Peru Unknown 13 82<br />
PI 501996 ( R 124) Peru Unknown 45 63<br />
PI 502014 ( R 137) Peru Unknown 15 78<br />
PI 502018 ( R 140) Peru Unknown 55 73<br />
PI 502036 ( R152) Peru Unknown 13 84<br />
PI 502074 ( R 179) Peru Unknown 23 94<br />
PI 502093 ( R 189) Ecuador Valencia 13 48<br />
PI 502128 ( R 213) Peru Unknown 8 91<br />
PI502156 ( R 228) Peru Unknown 33 73<br />
PI 497618 ( R 268) Ecuador Valencia 38 62<br />
Okrun USA Runner 70 109<br />
Southwest runner USA Runner 26 102<br />
1<br />
Identification number.<br />
2<br />
Disease incidence in field plots- <strong>2002</strong> Caddo Research Station, Ft. Cobb, OK.<br />
3<br />
AUDPC- Greenhouse evaluations in <strong>2002</strong>.<br />
Table 4. Southern blight cultivar evaluation – Yoakum, TX, <strong>2002</strong>.<br />
Entry Disease Yield<br />
incidence<br />
(Lb)/A<br />
Okrun 11.1 1965<br />
SW Runner 5.0 1665<br />
Tamrun 96 5.5 3127<br />
GA Green 12.5 1702<br />
Tamrun 98 12.8 1802<br />
Tamrun OL 01 10.3 2659<br />
Tamrun OL 02 11.8 2569<br />
GA 942007 9.5 2078<br />
LSD (P=0.1) 3.6 587<br />
42
Identification of New Sources<br />
of Resistance to Sclerotinia<br />
Blight in <strong>Peanuts</strong><br />
P artners in<br />
rogress<br />
P E A N U T S<br />
J. P. Damicone, Department of Entomology and Plant Pathology<br />
K. E. Dashiel, Department of Plant and Soil Sciences<br />
H. A. Melouk, USDA/ARS<br />
<strong>2002</strong> progress made possible through OPC support<br />
• Twenty germplasm lines from the USDA core collection were confirmed to be<br />
highly resistant to Sclerotinia blight.<br />
• Thirty-two additional germplasm lines from the USDA core collection were<br />
resistant.<br />
• Several of the highly resistant and resistant entries had yields that were<br />
statistically similar to Tamspan 90.<br />
Sclerotinia blight remains a destructive<br />
disease in <strong>Oklahoma</strong>. It is prevalent<br />
in all areas of the state except in far<br />
southwestern <strong>Oklahoma</strong>. In hopes of<br />
identifying new sources of resistance to<br />
Sclerotinia blight, the core collection, a<br />
subset of the USDA peanut germplasm<br />
collection comprising 745 entries, was<br />
obtained from Corley Holbrook, USDA/<br />
ARS Tifton, GA. The entries were planted<br />
in two-row, non-replicated plots at the<br />
Caddo Research Station in a field with<br />
a history of severe Sclerotinia blight in<br />
2001. Considerable variability in disease<br />
reaction was observed. A total of 81 lines<br />
were selected for further evaluation. Of the<br />
81 retained lines, 43 were highly resistant<br />
(0% disease) and 31 were resistant (less<br />
than 10% disease).<br />
Replicated trials with two-row plots<br />
were planted in <strong>2002</strong> at the Caddo<br />
Research Station in a field with a history<br />
of Sclerotinia blight. Seed availability<br />
was limited for some of the selections.<br />
Therefore, three trials containing two,<br />
three, and four replications each were<br />
established. Resistant (Tamspan 90),<br />
moderately resistant (Tamrun 96), and<br />
susceptible (Okrun) check varieties were<br />
included in each trial for reference.<br />
Stand establishment was excellent, but<br />
plant growth was slow, possibly because<br />
of nematode damage. Most of the rows<br />
never lapped. Development of Sclerotinia<br />
blight was also delayed along with the<br />
plant growth. Compared to nearby trials<br />
where Sclerotinia blight appeared in mid-<br />
August, sufficient disease development<br />
for evaluation did not occur until mid-<br />
September. The foliar disease pepper<br />
spot became severe in many of the<br />
entries. Sclerotinia blight increased to<br />
43
P artners in<br />
rogress<br />
P E A N U T S<br />
moderate levels throughout October<br />
when it remained too wet to harvest. The<br />
final disease evaluation was taken on<br />
October 30 when the vines exhibited a<br />
moderate level of frost damage. The plots<br />
were harvested on November 13 when<br />
frost damage was severe. Overall, plot<br />
yields were not significantly correlated<br />
with levels of Sclerotinia blight. This was<br />
attributed to the late-season disease<br />
development and the low yield potential<br />
for many of the entries.<br />
In Trial 1, which contained two replications,<br />
Okrun and Tamrun 96 were among the<br />
most susceptible entries to Sclerotinia<br />
blight, while Tamspan 90 was among<br />
the most resistant (Table 1). Three of the<br />
entries, along with Tamspan 90, were<br />
highly resistant and showed no infection.<br />
Another eight were resistant and had less<br />
than 10% infection. Of the highly resistant<br />
and resistant entries, lines 505 and 143<br />
had better yields than Tamspan 90. All<br />
of the other entries, which had appeared<br />
resistant or highly resistant in 2001, must<br />
have been escapes because they were<br />
more susceptible in <strong>2002</strong>. Except for<br />
entry 505, which was resistant to pepper<br />
spot and Sclerotinia blight, most of the<br />
entries that were resistant to pepper spot<br />
were susceptible to Sclerotinia blight, and<br />
Table 1. Reaction of selected peanut entries from the USDA core<br />
collection to Sclerotinia blight and pepper spot, Trial 1 (2 replications)<br />
– Caddo Research Station, <strong>2002</strong>.<br />
Entry Maturity Plant Type Sclerotinia Pepper Yield<br />
(1-6) 1 (1-6) 2 Blight (%) Spot (%) (lb/A)<br />
Okrun 3 3 46 0 2105<br />
329 4 2 41 0 1162<br />
Tamrun 96 3 3 32 0 2396<br />
238 3 4 32 0 1270<br />
466 3 5 32 5 617<br />
763 3 5 32 0 762<br />
599 3 5 22 0 690<br />
92 3 5 19 0 472<br />
804 3 4 19 0 472<br />
780 2 5 4 25 726<br />
828 3 5 4 40 653<br />
399 2 5 2 60 617<br />
820 2 5 2 5 762<br />
786 2 5 1 65 799<br />
505 3 5 1 7 1597<br />
273 3 4 1 25 1125<br />
67 2 5 1 35 907<br />
143 2 5 0 65 1888<br />
785 2 5 0 50 1053<br />
Tamspan 90 2 5 0 25 1270<br />
569 2 5 0 55 1234<br />
LSD 0.05 3 20 26 609<br />
1 1=early, 4=late<br />
2 1=very flat, 2=very erect<br />
3 Least significant difference.<br />
44
vice versa. Five entries (505, 273, 143,<br />
785, and 565) appeared to warrant further<br />
evaluation as sources of resistance to<br />
Sclerotinia blight.<br />
In Trial 2, which contained three<br />
replications, Okrun was susceptible to<br />
Sclerotinia blight, Tamrun 96 showed<br />
moderate resistance, and Tamspan 90<br />
was resistant (Table 2). Entries 570 and<br />
481 were highly resistant to Sclerotinia<br />
blight and showed no infection. Nine<br />
other entries were resistant to Sclerotinia<br />
blight and had less than 10% infection.<br />
Except for lines 321 and 766, which<br />
were resistant to both Sclerotinia blight<br />
and pepper spot, most of the entries that<br />
were resistant to Sclerotinia blight were<br />
susceptible to pepper spot and vice<br />
versa. Except for lines 158 and 128, most<br />
of the entries that were among the most<br />
susceptible to Sclerotinia blight in <strong>2002</strong><br />
had appeared resistant or highly resistant<br />
in 2001. Overall, yields were low in this<br />
trial as indicated by the low productivity of<br />
Tamrun 96 and Tamspan 90. Of the entries<br />
that were highly resistant or resistant to<br />
Sclerotinia blight, 766, 469, 321, and 821<br />
had yields that were statistically similar<br />
to Tamspan 90. All of the entries with an<br />
P artners in<br />
rogress<br />
P E A N U T S<br />
Table 2. Reaction of selected peanut entries from the USDA core<br />
collection to Sclerotinia blight and pepper spot, Trial 2 (3 replications)<br />
– Caddo Research Station, <strong>2002</strong>.<br />
Entry Maturity Plant Type Sclerotinia Pepper Yield<br />
(1-6) 1 (1-6) 2 Blight (%) Spot (%) (lb/A)<br />
Okrun 3 3 54 0 1791<br />
463 4 3 46 0 1839<br />
227 4 2 38 0 1307<br />
345 3 3 36 0 1283<br />
241 3 3 32 2 1355<br />
Tamrun96 3 3 22 0 2057<br />
158 4 3 20 0 1089<br />
723 3 3 15 10 1452<br />
128 3 4 12 13 605<br />
103 4 5 10 0 1234<br />
321 3 5 8 3 1234<br />
Georgia Hi O/L 3 2 6 0 2154<br />
766 3 5 4 7 1694<br />
409 3 5 4 33 823<br />
176 3 5 3 50 1016<br />
469 2 5 2 37 1379<br />
Tamspan 90 2 5 2 47 1742<br />
454 3 5 2 35 823<br />
821 2 5 2 53 1162<br />
570 2 5 0 67 532<br />
481 2 5 0 43 1065<br />
LSD 0.05 3 17 26 667<br />
1 1=early, 4=late<br />
2 1=very flat, 2=very erect<br />
3 Least significant difference.<br />
45
P artners in<br />
rogress<br />
P E A N U T S<br />
erect plant type were resistant or highly<br />
resistant to Sclerotinia blight. Entries with<br />
a more prostrate plant type, typical of<br />
runner varieties, were more susceptible to<br />
Sclerotinia blight.<br />
Pressure from Sclerotinia blight was lower<br />
in Trial 3, which contained four replications,<br />
compared to the other two trials. Okrun<br />
again was among the most susceptible<br />
entries in the trial, and Tamrun 96 was<br />
resistant with less than 10% infection<br />
(Table 3). The lower disease pressure<br />
was reflected in yields of 3000 lb/A or<br />
more for Okrun and Tamrun 96. Fifteen<br />
entries along with Tamspan 90 were highly<br />
resistant and had 0% Sclerotinia blight. All<br />
of these entries had upright plant types<br />
and were susceptible to pepper spot.<br />
The highly resistant entries 361, 379,<br />
380, 66, 391, 562, and 129 had yields<br />
that were similar statistically to Tamspan<br />
90. Another 17 entries were resistant and<br />
had less than 10% infection. Among the<br />
resistant entries, lines 464, 799, 374, 377,<br />
474, and 125 had yields that were similar<br />
statistically to Tamspan 90. Two resistant<br />
entries (464 and 582) had a prostrate<br />
(runner) plant type, but one (582) was<br />
low yielding. All of the entries that were<br />
not classified as resistant and had more<br />
than 10% Sclerotinia blight were resistant<br />
to pepper spot. However, some of the<br />
entries that were resistant to Sclerotinia<br />
blight were also resistant to pepper spot.<br />
Among the 81 entries selected from the<br />
core collection in 2001 for resistance to<br />
Sclerotinia blight, 74 produced sufficient<br />
seed for evaluation in replicated plots in<br />
<strong>2002</strong>. Of the 74 entries, 20 were confirmed<br />
to be highly resistant and another 32<br />
were confirmed to be resistant with less<br />
than 10% infection. Those with decent<br />
yield potential will be evaluated again in<br />
replicated trials in 2003 and their response<br />
to fungicide treatment will be determined<br />
to further confirm their resistance. Each<br />
entry in the core collection represents<br />
a larger group of related entries in the<br />
USDA peanut germplasm collection.<br />
Therefore, about 10 of the best entries will<br />
be selected and related germplasm from<br />
the USDA collection will be obtained and<br />
evaluated.<br />
46
Table 3. Reaction of selected peanut entries from the USDA core<br />
collection to Sclerotinia blight and pepper spot, Trial 3 (4 replications)<br />
– Caddo Research Station, <strong>2002</strong>.<br />
Entry Maturity Plant Type Sclerotinia Pepper Yield<br />
(1-6) 1 (1-6) 2 Blight (%) Spot (%) (lb/A)<br />
Okrun 3 3 32 0 3176<br />
679 3 3 31 0 2178<br />
326 4 3 29 0 2124<br />
457 4 3 26 0 1597<br />
341 3 3 19 0 2178<br />
352 3 3 18 0 1543<br />
459 3 3 15 0 1270<br />
532 3 6 10 0 2069<br />
461 3 4 9 0 1416<br />
464 4 3 7 0 1742<br />
799 3 4 7 0 2850<br />
Tamrun 96 3 3 6 0 3557<br />
125 2 5 5 0 1633<br />
474 3 5 5 32 1797<br />
632 3 4 4 12 1307<br />
582 3 3 4 2 926<br />
377 3 5 3 47 1779<br />
827 3 6 2 0 944<br />
81 2 5 1 70 962<br />
398 2 5 1 40 1398<br />
479 2 5 1 37 1434<br />
184 2 5 1 57 1089<br />
437 2 5 1 75 1053<br />
374 2 5 1 47 2124<br />
486 2 5 1 45 1307<br />
378 3 5 1 26 1488<br />
307 2 5 0 47 1307<br />
361 2 5 0 50 1761<br />
379 3 5 0 40 1888<br />
426 2 5 0 75 980<br />
380 3 5 0 32 1924<br />
460 2 5 0 45 1488<br />
60 2 5 0 69 817<br />
Tamspan 90 2 5 0 49 2015<br />
180 2 5 0 44 1488<br />
33 2 5 0 61 1089<br />
205 2 5 0 56 1488<br />
66 2 5 0 55 1652<br />
73 2 5 0 60 817<br />
391 3 5 0 42 1633<br />
562 2 5 0 50 1960<br />
129 2 5 0 55 1761<br />
LSD 0.05 3 10 18 459<br />
P artners in<br />
rogress<br />
P E A N U T S<br />
1 1=early, 4=late<br />
2 1=very flat, 2=very erect<br />
3 Least significant difference.<br />
47
P artners in<br />
rogress<br />
P E A N U T S<br />
Management of Sclerotinia<br />
Blight and Verticillium<br />
Wilt in <strong>Peanuts</strong><br />
K. E. Jackson, Department of Entomology and Plant Pathology<br />
H. A. Melouk, USDA-ARS<br />
<strong>2002</strong> progress made possible through OPC support<br />
• Tamrun 96 and Tamrun OL 01 performed the best overall in the three different<br />
environments.<br />
• Tamrun 96 and Tamrun OL 01, a high oleic acid cultivar, had an average yield<br />
greater than 4000 lb/A over the three locations and the greatest dollar value per<br />
acre.<br />
• All lines had grades lower that the standard cultivar, Okrun, which had a grade<br />
of 77.<br />
The objective of this research is to<br />
evaluate disease resistance in advanced<br />
peanut breeding lines, including the high<br />
oleic breeding lines, under field conditions<br />
to soilborne pathogens.<br />
Reaction of Peanut Lines to<br />
Southern Blight, Limb Rot,<br />
and Pod Rot in Small Field<br />
Plots at Chickasha, Liberty<br />
Bottom, and Martha<br />
Field plots were planted on April 30, May 14,<br />
and May 23, <strong>2002</strong>, in Martha, Chickasha,<br />
and Liberty Bottom, respectively. Plots at<br />
Chickasha and Martha were harvested on<br />
October 15, and on October 31 at Liberty<br />
Bottom.<br />
Eight peanut lines were included in<br />
this study at each location. Each plot<br />
consisted of two 20-ft rows, 3-ft apart, with<br />
four replications. Incidence of southern<br />
blight and yield at the three locations are<br />
presented in Table 1. Value per acre of<br />
the peanut lines at the three locations is<br />
presented in Table 2. Limb rot and pod rot<br />
data at the three locations are presented<br />
in Table 3.<br />
The cultivars of Tamrun 96 and Tamrun OL<br />
01 had an average of more than 4000 lb/A<br />
over the three locations and the greatest<br />
dollar value per acre. All cultivars had<br />
grades lower than the standard cultivar,<br />
Okrun, which had a grade of 77. The<br />
lowest disease severity and incidence<br />
was recorded in the cultivar Southwest<br />
Runner; however, this cultivar was also<br />
one of the lowest yielding cultivars.<br />
The two cultivars from Georgia varied<br />
from location to location. For example<br />
Georgia Hi O/L had the highest yield in<br />
Bryan County, but had a yield significantly<br />
lower then the standard cultivar, Okrun,<br />
in Grady County. Georgia Green had the<br />
48
lowest yield and highest percent incidence<br />
of southern blight in Bryan County, but<br />
had one of the higher yields in Jackson<br />
County. The results of this study showed<br />
that Tamrun 96 and Tamrun OL 01<br />
performed the best overall in these three<br />
different environments, while the Georgia<br />
cultivars varied as to location.<br />
Incidence of Verticillium<br />
Wilt<br />
The incidence of verticillium wilt at<br />
Chickasha was negligible during the<br />
<strong>2002</strong> growing season for a meaningful<br />
evaluation, and therefore, disease<br />
readings were not taken. The other two<br />
locations (Martha and Liberty Bottom) did<br />
not have history of verticillium wilt.<br />
The verticillium wilt fungus isolate that was<br />
recovered in 2000 from diseased Okrun<br />
grown in a commercial field in Seminole,<br />
TX, got contaminated with bacteria.<br />
Efforts are under way to clean the isolate<br />
for conducting pathogenicity tests on<br />
several peanut lines under greenhouse<br />
conditions.<br />
P artners in<br />
rogress<br />
P E A N U T S<br />
Table 1. Comparison of yields and percent incidence of southern blight<br />
on the advanced peanut breeding lines at three locations in <strong>Oklahoma</strong>,<br />
<strong>2002</strong>.<br />
Breeding Line Yield lb/A Percent Southern Blight<br />
Bryan 1 Grady Jackson Av Bryan Grady Jackson Av<br />
Okrun 2404 3639 5273 3772 21.6 0.0 9.7 10.4<br />
SW Runner 2849* 2 2568* 4801 3406 1.3 0.0 0.0 0.4<br />
Tamrun 96 3539* 4038 5236 4271 1.9 0.0 1.3 1.0<br />
Georgia Green 1924* 2949* 5636 3503 70.3* 0.0 15.9 28.8<br />
Tamrun 98 2577 3267 5527 3790 37.5 0.0 5.0 14.2<br />
Tamrun OL 01 3331* 3712 5799 4280 26.0 0.0 4.1 10.0<br />
Tamrun OL 02 3249* 3294 5109 3884 22.5 0.0 6.3 9.6<br />
Georgia Hi OL 3603* 2841* 5236 3987 12.5 0.0 2.8 5.1<br />
LSD 0.05 369 542 NS 3 31.4 NS<br />
Pr>F 0.0001 0.0002 0.6164 0.004 0.1644<br />
1 Plots at Bryan County were located at the Gary Weger Farm, Liberty Bottom, OK; Grady County plots<br />
were located at the Arthur Kell farm near Chickasha, OK; and Jackson County plots were located at<br />
Phil and Matt Muller farm near Martha, OK.<br />
2 * Breeding line mean significant from mean of the Okrun variety.<br />
3 NS = differences in breeding lines not significant.<br />
49
P artners in<br />
rogress<br />
P E A N U T S<br />
Table 2. Value per acre of the advanced peanut breeding lines at three<br />
locations in <strong>Oklahoma</strong>, <strong>2002</strong>.<br />
Breeding Line Value/A Grade<br />
Bryan 1 Grady Jackson Av Bryan Grady Jackson Av<br />
Okrun $464 $675 $991 $710 79 76 77 77<br />
SW Runner 473 414 832 573 68 66 71 68<br />
Tamrun 96 656 680 920 752 76 69 72 72<br />
Georgia Green 352 518 1059 643 75 72 77 75<br />
Tamrun 98 478 574 1025 692 76 72 76 75<br />
Tamrun OL 01 610 643 1033 762 75 71 73 73<br />
Tamrun OL 02 587 571 935 698 74 71 75 73<br />
Georgia Hi OL 659 520 983 721 75 75 73 74<br />
1 Plots at Bryan County were located at the Gary Weger Farm, Liberty Bottom, OK; Grady County plots<br />
were located at the Arthur Kell farm near Chickasha, OK; and Jackson County plots were located at<br />
Phil and Matt Muller farm near Martha, OK.<br />
Table 3. Comparison of limb rot and pod rot peanut diseases on the<br />
advanced peanut breeding lines at three locations in <strong>Oklahoma</strong>,<br />
<strong>2002</strong>.<br />
Breeding Line Percent Limb Rot Percent Pod Rot<br />
Bryan 1 Grady Jackson Av Bryan Grady Jackson Av<br />
Okrun 4.0 0.0 0.0 1.3 2.0 0.0 0.3 0.8<br />
SW Runner 0.8 0.0 0.0 0.3 0.0 0.0 0.0 0.0<br />
Tamrun 96 4.8 0.0 0.0 1.6 0.5 0.0 2.8 1.1<br />
Georgia Green 1.5 0.0 0.0 0.5 2.8 0.0 3.8 2.2<br />
Tamrun 98 2.1 0.0 0.0 0.7 0.5 0.0 0.3 0.3<br />
Tamrun OL 01 3.0 0.0 0.0 1.0 2.8 0.0 0.3 1.0<br />
Tamrun OL 02 4.5 0.0 0.0 1.5 0.8 0.0 0.3 0.3<br />
Georgia Hi OL 1.2 0.0 0.0 0.4 4.3 0.0 0.0 1.4<br />
LSD 0.05 NS 2 NS<br />
Pr>F 0.2634 0.3531<br />
1 Plots at Bryan County were located at the Gary Weger Farm, Liberty Bottom, OK; Grady County plots<br />
were located at the Arthur Kell farm near Chickasha, OK; and Jackson County plots were located at<br />
Phil and Matt Muller farm near Martha, OK.<br />
2 NS = differences in breeding lines not significant.<br />
50
Research on Peanut Disease:<br />
Resistance to Sclerotinia and<br />
Southern Blights in <strong>Oklahoma</strong><br />
P artners in<br />
rogress<br />
P E A N U T S<br />
K. E. Jackson and J. P. Damicone<br />
Department of Entomology and Plant Pathology<br />
H. A. Melouk, USDA-ARS<br />
<strong>2002</strong> progress made possible through OPC support<br />
• Lowering the relative humidity from 100% to about 70% in the incubation chamber<br />
24 hours after inoculation with Sclerotinia produced more realistic Sclerotinia<br />
reaction on Okrun and Southwest Runner, which mimics field evaluations.<br />
• Calcium content in peanut shells increased by at least 30% in response to calcium<br />
application in the form of calcium sulfate (gypsum) or calcium chloride.<br />
• A procedure for reproducing peanut pod breakdown by the southern blight fungus<br />
under greenhouse and laboratory conditions was developed.<br />
Background<br />
<strong>Peanuts</strong> are an important economic crop<br />
for <strong>Oklahoma</strong>. Pressure from soilborne<br />
diseases are limiting and increasing peanut<br />
production costs. Sclerotinia and southern<br />
blights are soilborne diseases that are<br />
economically important to peanut production<br />
in <strong>Oklahoma</strong>. Much progress has been made<br />
in management of sclerotinia blight through<br />
the release of several resistant peanut<br />
cultivars since 1990. Research is continuing<br />
to identify new resistant peanut breeding lines<br />
for both diseases, therefore, development<br />
of improved screening methodology under<br />
greenhouse and field conditions is needed<br />
to accelerate the development and release of<br />
additional resistant cultivars. Enhancement of<br />
calcium content in the cell walls of plants may<br />
play a role in increasing plant resistance to<br />
pectolytic and macerating enzymes produced<br />
by fungi such as the Sclerotinia and southern<br />
blight pathogens. Therefore, the effect of<br />
calcium nutrition, applied as calcium chloride,<br />
on altering Sclerotinia and southern blights<br />
disease reactions needs to be investigated<br />
in advanced peanut breeding lines under<br />
greenhouse and field conditions.<br />
Research Objectives<br />
1 To initiate research to determine postinoculation<br />
physical environmental<br />
parameters under greenhouse conditions<br />
that produce Sclerotinia response in peanut<br />
lines mimicking field reaction. This research<br />
will be conducted in the greenhouse and in<br />
small field plots.<br />
2 To initiate research to investigate the<br />
effect of applying calcium chloride, under<br />
greenhouse and field conditions, to<br />
enhance the content of calcium in the shell<br />
and kernels of several advanced peanut<br />
breeding lines.<br />
3 To initiate studies to determine the effect<br />
of increased calcium content in the peanut<br />
shell and kernels and on the ability of<br />
Sclerotinia and southern blight pathogens<br />
to degrade peanut pods under greenhouse<br />
and field conditions.<br />
4 To initiate studies to determine the rate<br />
of degradation of cell walls isolated<br />
from peanut shells that have normal and<br />
increased calcium content, by pectolytic<br />
and macerating enzymes produced by the<br />
Sclerotinia and southern blight fungi.<br />
51
P artners in<br />
rogress<br />
P E A N U T S<br />
Research progress in <strong>2002</strong><br />
In objective 1, research was initiated to<br />
vary post inoculation relative humidity in the<br />
incubation chambers under the greenhouse.<br />
Lowering the relative humidity from 100% to<br />
about 70% in the incubation chamber 24 hours<br />
after inoculation with Sclerotinia produced<br />
more realistic Sclerotinia reaction on Okrun<br />
and Southwest Runner, which mimics field<br />
evaluations (Tables 1 and 2).<br />
In objective 2, greenhouse experiments were<br />
conducted to determine the effect of applying<br />
calcium on the calcium content of peanut<br />
shells and kernels. Calcium content in peanut<br />
shells increased by at least 30% in response<br />
to calcium application in the form of calcium<br />
sulfate (gypsum) or calcium chloride. Calcium<br />
content of peanut kernels did not increase in<br />
response to applying calcium. This step is<br />
necessary to research objectives 2 and 3.<br />
In objective 3, a procedure for reproducing<br />
peanut pod breakdown by the southern blight<br />
fungus under greenhouse and laboratory<br />
conditions was developed. A manuscript<br />
describing this technique was submitted to<br />
Peanut Science for publication. This technique<br />
will have a wide application to study factors<br />
influencing the interaction between peanut<br />
pods and the southern blight fungus and other<br />
pod-infecting pathogens under controlled<br />
conditions. Also, this technique will facilitate<br />
progress on research objectives 3 and 4.<br />
Table 1: Reaction parameter of S. minor, over post inoculation relative<br />
humidity regimes, in Okrun and Southwest runner peanut cultivars.<br />
Reaction parameter<br />
Cultivar DI(%) 1 LL(mm) 2 AUDPC 3<br />
Okrun 4 86 a 42.9 a 84.6 a<br />
Southwest Runner 5 81 a 28.9 b 56.7 b<br />
1<br />
DI(%) = Disease incidence at 6 day PI<br />
2<br />
LL(mm) = Length of lesion (mm) at 6 day PI<br />
3<br />
AUDPC = area under disease progress curve<br />
4<br />
OK = A Sclerotinia susceptible cultivar<br />
5<br />
SW = A Sclerotinia resistant cultivar<br />
Values in each reaction parameter followed by the same letter are not significantly different at P > 0.05<br />
Table 2: Response of Okrun (OK) and Southwest runner (SW) peanut<br />
cultivars to inoculation with S. minor under post inoculation (PI) high and<br />
low relative humidity (RH).<br />
Cultivar Response Parameters<br />
PI Treatment DI(%) 1 LL(mm) 2 AUDPC 3<br />
Continuous High OK 4 96 a 64.0 a 129.4 a<br />
RH SW 5 100 a 47.5 b 93.6 b<br />
Lower RH<br />
24 hours PI OK 66 a 21.9 a 39.8 a<br />
SW 73 a 10.4 b 19.8 b<br />
1<br />
DI(%) = Disease incidence at 6 day PI<br />
2<br />
LL(mm) = Length of lesion (mm) at 6 day PI<br />
3<br />
AUDPC = area under disease progress curve<br />
4<br />
OK = A Sclerotinia susceptible cultivar<br />
5<br />
SW = A Sclerotinia resistant cultivar<br />
Values in each reaction parameter followed by the same letter are not significantly different at P > 0.05.<br />
52
Improving Resistance to<br />
Sclerotinia Blight in Four<br />
Selected Peanut Breeding<br />
Lines or Cultivars<br />
P artners in<br />
rogress<br />
P E A N U T S<br />
K. E. Dashiell and J. R. Sholar, Plant and Soil Sciences<br />
K. D. Chenault and H. A. Melouk, USDA/ARS<br />
T. N. Douglas, MS Graduate Student, Plant and Soil Sciences<br />
The major disease that reduces peanut<br />
yields in <strong>Oklahoma</strong> is Sclerotinia blight.<br />
Some varieties such as Southwest Runner<br />
and Tamspan 90 have been developed that<br />
have good levels of resistance, but a higher<br />
level of resistance is needed. During 2001,<br />
several transgenic lines that were developed<br />
by the USDA to have higher levels<br />
of resistance to Sclerotinia blight were field<br />
tested at Ft. Cobb. These transgenic lines<br />
were confirmed to have a higher level of<br />
resistance than Okrun, the line they were<br />
originally developed from.<br />
The objective of this project is to develop<br />
peanut cultivars with improved levels of<br />
resistance to Sclerotinia blight. The backcross<br />
breeding procedure is being used.<br />
The transgenic parents used have been<br />
confirmed to have higher levels of resistance<br />
and relatively stable inheritance of<br />
the resistance. The recurrent parents were<br />
selected because of their good agronomic<br />
performance and because they have high<br />
oleic acid content.<br />
The number of F 1<br />
seeds harvested was<br />
56 (Table 1) but only two F 1<br />
plants were<br />
confirmed to have the gene or genes for<br />
resistance to Sclerotinia. This lack of stable<br />
inheritance associated with transgenic<br />
plants has also been reported in other<br />
crops. The two F 1<br />
plants that have been<br />
confirmed to have the chitinase and glucanase<br />
genes are presently being backcrossed<br />
to UF00627 and TX 994336.<br />
53
P artners in<br />
rogress<br />
P E A N U T S<br />
Table 1. The parents, number of F 1<br />
seeds harvested, and the number<br />
of F 1<br />
plants that were confirmed transgenic during <strong>2002</strong>.<br />
Parents<br />
Transgenic* Recurrent F 1<br />
seeds Confirmed F 1<br />
Harvested Transgenic<br />
654 UF 00627 2 1<br />
654 TX 994336 6 1<br />
654 Tamrun OL 01 2 0<br />
87 Tamrun OL 01 6 0<br />
87 TX 994336 6 0<br />
87 UF 00627 11 0<br />
87 Tamrun OL 02 3 0<br />
540 UF 00627 4 0<br />
540 TX 994336 10 0<br />
540 Tamrun OL 02 6 0<br />
Total 56 2<br />
* 654 = OKRUN with chitinase and glucanase genes.<br />
* 87 = OKRUN with chitinase and glucanase genes.<br />
* 540 = OKRUN with chitinase gene.<br />
Date Planted March 14, <strong>2002</strong><br />
Date Harvested August <strong>2002</strong><br />
54
Results of Applied<br />
Research on <strong>Peanuts</strong><br />
P artners in<br />
rogress<br />
P E A N U T S<br />
J. R. Sholar and J. K. Nickels<br />
Department of Plant and Soil Sciences<br />
<strong>2002</strong> progress made possible through OPC support<br />
• In four variety tests, runner peanut varieties averaged 1774 lb/A and 4% TSMK<br />
higher than Spanish varieties. Tamrun 96 continued to be an excellent performer<br />
and is the top performing variety that is commercially available.<br />
• At the Eddie Repp Farm Test, ro-till (also known as strip till) produced significantly<br />
higher yields and grades than did the no-till plots. This indicates that some<br />
soil disturbance in the seeding zone is preferable to total no-till for peanuts.<br />
• Late season nitrogen applications did not result in increased peanut yields or<br />
improve peanut grades.<br />
• In a test to evaluate peanut variety response to several commercially available<br />
herbicides, none of the herbicides reduced peanut yield and quality, demonstrating<br />
that there is good tolerance to herbicides available to growers.<br />
• Inoculation tests showed that new inoculants can produce higher numerical<br />
yields, but rarely are the differences statistically significant. Grades were not<br />
affected by the treatments.<br />
• A seeding rate test demonstrated that there is no difference in yields from varying<br />
seeding rates provided an adequate amount of seed is planted.<br />
Background<br />
The <strong>Oklahoma</strong> and U.S. peanut continues<br />
to undergo changes. Rising production<br />
costs, disease problems, etc. have continued<br />
to result in a shift of peanuts from<br />
eastern <strong>Oklahoma</strong> to southwest <strong>Oklahoma</strong>.<br />
Five southwestern counties now account<br />
for 25% of <strong>Oklahoma</strong>’s 70,000 acre peanut<br />
crop. <strong>Oklahoma</strong>’s peanut acreage has<br />
dropped from 125,000 acres in 1980 to<br />
70,000 acres planted in <strong>2002</strong>. However,<br />
peanuts remain one of the few farm commodities<br />
offering acceptable potential for<br />
a positive return to growers. Profit margins<br />
are very narrow as costs of production<br />
have risen and prices paid to producers<br />
have remained as established by the 1996<br />
Farm Bill. Growers must adopt innovative<br />
management strategies to remain competitive<br />
in the peanut industry. The following<br />
applied research was conducted to assist<br />
growers, so they can remain competitive in<br />
the peanut industry. The applied research<br />
55
P artners in<br />
rogress<br />
P E A N U T S<br />
in peanuts conducted by the Department<br />
of Plant and Soil Sciences focuses on the<br />
introduction and demonstration of new and<br />
appropriate technology for <strong>Oklahoma</strong> conditions.<br />
The objective is to assist growers<br />
in developing management strategies that<br />
will result in a more economical production.<br />
The importance that the peanut industry<br />
has placed on delivery of a high quality<br />
product is also a focal point.<br />
1. Variety Tests<br />
The purpose of the variety testing program<br />
is to evaluate the performance of new varieties<br />
and to compare that performance to<br />
varieties currently available. In <strong>2002</strong>, variety<br />
tests were conducted in Caddo, Grady,<br />
Bryan, and Jackson counties. Sclerotinia<br />
blight was not a major problem at any of<br />
the locations in <strong>2002</strong>.<br />
Yields were very good at all locations. The<br />
field at Jackson County has only a very<br />
recent history of peanut production. This<br />
no doubt contributed to the extremely high<br />
yields. In this test, Tamrun OL 01 yielded<br />
5418 lb/A.<br />
Grades reflect the fact that the crop was<br />
set uniformly and grades were higher than<br />
in some years. The highest grade obtained<br />
was 77% TSMK for OK 8-4-10, an experimental<br />
line.<br />
The following varieties have demonstrated<br />
the best potential for being planted in <strong>Oklahoma</strong>:<br />
Tamrun 96 - This variety was developed by<br />
Texas A&M <strong>University</strong> and was released in<br />
1996. It continues to be the top performing<br />
variety in <strong>Oklahoma</strong> tests. It has resistance<br />
to Tomato Spotted Wilt Virus (TSWV), a disease<br />
that to date has resulted in relatively<br />
small problems in <strong>Oklahoma</strong>. However,<br />
this disease is causing severe losses in<br />
the southeastern U.S. and in some areas<br />
of Texas.<br />
In 2000, this variety averaged 4010 lb/A at<br />
six locations, in 2001 it averaged 4260 lb/A<br />
at six locations, and in <strong>2002</strong>, it averaged<br />
4892 lb/A at four locations. This variety<br />
tends to grade 1 to 2% lower than Okrun.<br />
It has consistently been the highest yielding<br />
variety in statewide variety tests con-<br />
Peanut acreage, yield, and value.<br />
Year Acres Yield Total Value<br />
Planted (lb/A) (Millions $)<br />
<strong>2002</strong> 70,000 2800 34<br />
2001 85,000 2200 50<br />
2000 84,800 1800 50<br />
1999 85,400 2271 55<br />
1998 89,200 2326 60.6<br />
1997 94,200 2352 63<br />
1996 98,400 2355 67.7<br />
1995 103,400 2334 69.7<br />
56
ducted during 1997-2001. Tamrun 96 also<br />
has demonstrated some Sclerotinia blight<br />
resistance. As an example, in the 1998 test<br />
in Bryan County under Sclerotinina blight<br />
pressure, Tamrun 96 yielded 3872 lb/A<br />
compared to 2105 lb/A for Okrun.<br />
Georgia Green – Released by the <strong>University</strong><br />
of Georgia, was first tested in <strong>Oklahoma</strong><br />
variety tests in 1998. The performance of<br />
this variety was good at all locations in<br />
1998 and 1999. Georgia Green tends to<br />
mature a little earlier and grade a little higher<br />
than Tamrun 96. In 6 tests in 2000, Georgia<br />
Green averaged 3860 lb/A while Tamrun<br />
96 averaged 4010 lb/A. In the same tests,<br />
Georgia Green averaged 71% TSMK and<br />
Tamrun 96 averaged 69% TSMK. In 6 tests<br />
in 2001, Georgia Green averaged 4125 lb/A<br />
while Tamrun 96 averaged 4260 lb/A. In the<br />
same tests, Georgia Green averaged 72%<br />
TSMK and Tamrun 96 averaged 69% TSMK.<br />
In <strong>2002</strong>, Georgia Green averaged 4573 lb/A<br />
with a grade of 75 at four locations.<br />
P artners in<br />
rogress<br />
P E A N U T S<br />
Peanut variety tests – <strong>2002</strong>.<br />
Average of Four Tests<br />
Variety Market Yield Grade Gross Return<br />
Type (lb/A) (%TSMK) ($/A)<br />
Spanco Sp 3474 70 597<br />
OLin Sp 2902 69 492<br />
Tamspan 90 Sp 2906 70 502<br />
LSD 0.05 NS 2.2<br />
Tamrun OL 01 Ru 5418 74 983<br />
OK-8-4-010 Ru 5086 77 964<br />
OK-8-4-003 Ru 5104 76 958<br />
TX-977053 Ru 5081 71 891<br />
Tamrun 96 Ru 4892 74 890<br />
Okrun Ru 4675 76 877<br />
Georgia Hi OL Ru 4700 74 858<br />
Georgia Green Ru 4573 75 851<br />
AT 120 Ru 4283 73 769<br />
LSD 0.05 NS 3.3<br />
Average of four counties (12 observations) on runner type - Bryan, Caddo, Grady, and Jackson. Average<br />
of three counties (9 observations) on Spanish type – Bryan, Caddo, and Jackson.<br />
Cultivars are ranked by gross returns ($/A).<br />
Average runner yield was 4868 lb/A.<br />
Average Spanish yield was 3094 lb/A.<br />
57
P artners in<br />
rogress<br />
P E A N U T S<br />
2. Variety X Herbicide Tests<br />
Three herbicides were tested on four<br />
varieties at three locations in 2000, 2001,<br />
and <strong>2002</strong>. The herbicides are listed in the<br />
table and the varieties used were Okrun,<br />
Tamrun 96, AT 120, and Tamspan 90. The<br />
purpose of the test was to determine if the<br />
varieties would respond differentially to the<br />
herbicides.<br />
We determined that under the environmental<br />
conditions of these years, all varieties<br />
tested had good tolerance to these herbicides.<br />
In these tests, there was no variety<br />
response, as measured by yield or grade,<br />
to the different herbicides.<br />
During 2001 in some <strong>Oklahoma</strong> peanut<br />
fields, we observed peanut injury when<br />
Valor was used as a preemerge treatment<br />
and heavy rainfall occurred during<br />
or immediately after the cracking stage of<br />
the peanuts. We attributed this injury to<br />
splashing of the herbicide onto the peanut<br />
plants. We have not experienced such<br />
environmental conditions at any of our<br />
test sites in any year and consequently<br />
have not observe this type of injury.<br />
Variety X herbicide summary – 2000-<strong>2002</strong>.<br />
Average of Three Tests/Year<br />
Herbicide Obs. Yield Grade<br />
(lb/A) (% TSMK)<br />
Strongarm 84 WG 96 3953 72<br />
0.45 oz/A<br />
Valor 50 WP 96 3979 72<br />
3 oz/A<br />
Cadre 70 DF 96 4082 73<br />
1.44 oz/A<br />
Weed Free 96 4018 72<br />
Hand Weeded<br />
Tests were conducted at:<br />
Caddo Research Station, Caddo County.<br />
Matt Muller Farm, Jackson County.<br />
Gary Weger Farm, Bryan County.<br />
58
3. Peanut Inoculation Tests<br />
Peanut inoculation tests were conducted<br />
on old peanut land and all tests were<br />
irrigated. In <strong>2002</strong>, <strong>Oklahoma</strong> crops suffered<br />
through a summer-long drought and<br />
only irrigated crops produced acceptable<br />
yields in the southwest. The Caddo County<br />
and Bryan County tests were irrigated with<br />
side-roll irrigation systems and the Jackson<br />
County test was flood irrigated.<br />
Yields were good at all locations and the<br />
correlations of variation were low in all tests.<br />
Yields were not statistically different at two<br />
locations; however, yields at the Caddo<br />
County test were significantly greater in<br />
the inoculation treatments. Grades were<br />
not affected by the treatments. Four of the<br />
five inoculant treatments produced yields<br />
that were numerically greater than the untreated<br />
check.<br />
P artners in<br />
rogress<br />
P E A N U T S<br />
Peanut inoculation tests – <strong>2002</strong>.<br />
Summary of Three Tests<br />
Treatment Yield Grade Gross Return<br />
(lb/A) (%TSMK) ($/A)<br />
Urbana-Rhizoflo/Granular 4952 75 906<br />
(infurrow) 5.5#/row acre<br />
Nitragin – Peanut Special (Seed Trt.) 4934 75 901<br />
7 oz /100# seed<br />
Urbana-Mega Prep (Seed Trt.) 4910 74 893<br />
4.4 oz/100# seed<br />
Nitragin – Lift Liquid (Seed Trt.) 4807 75 884<br />
1 oz/1000 row feet<br />
Untreated Control 4786 75 878<br />
Nitragin – Soil Implant/Granular 4659 74 844<br />
(infurrow) 5.6#/row acre<br />
LSD 0.05 ns ns ns<br />
59
P artners in<br />
rogress<br />
P E A N U T S<br />
4. Seeding Rate Test<br />
Growers frequently plant excessive seed<br />
in an attempt to increase peanut yields.<br />
A seeding rate demonstration was conducted<br />
to demonstrate that there is little<br />
Seeding rate test – 2001 and <strong>2002</strong><br />
Phillip and Matt Muller Farms<br />
Jackson County<br />
or no difference in yield results from varying<br />
seeding rates as long as an adequate<br />
amount of seed is planted. Previous<br />
research has indicated that seeding rates<br />
of 80-90 lbs/A will produce yields equal to<br />
yields from 100 lb/A or more. The results of<br />
this applied research confirmed what had<br />
been previously determined.<br />
Treatment Yield Grade<br />
(lb/A) (%TSMK) 1<br />
80 lb/A 5992 73<br />
90 lb/A 6235 74<br />
100 lb/A 5968 74<br />
LSD 0.05 NS NS<br />
1<br />
% TSMK = % Total Sound Mature Kernels<br />
Planting Date – May<br />
Variety – Tamrun 96<br />
Digging Date – October<br />
60<br />
5. Evaluate the Effects of<br />
Reduced Tillage on Peanut<br />
Production and Pest<br />
Management (Funded by<br />
National Peanut Board)<br />
Background<br />
Rising production costs and reduced<br />
income as a result of recent farm policy<br />
changes for peanuts will cause even<br />
greater pressure on peanut growers than<br />
that seen in recent years. As a result,<br />
<strong>Oklahoma</strong> growers have accelerated the<br />
adoption of minimum tillage (ro-till) and<br />
no tillage (no-till) systems as a means of<br />
reducing production costs and conserving<br />
soil resources. However, growers cannot<br />
insure no-till peanuts at the present time<br />
due to a lack of research information to<br />
justify this practice.<br />
Several reduced tillage tests were conducted<br />
in <strong>2002</strong>. The results will be combined<br />
with those of earlier tests to determine<br />
recommended production practices for<br />
<strong>Oklahoma</strong> peanut growers.<br />
Research Objective<br />
and Plan of Action<br />
1. Measure levels of weeds, insects,<br />
and diseases in conventional and<br />
reduced tillage systems. Field plots<br />
were established in <strong>2002</strong> that compared<br />
no-till, ro-till, and conventional tillage<br />
systems on a Spanish and a runner<br />
variety. Levels of leaf spot, southern<br />
and Sclerotinia blights, and limb rot
were measured in plots sprayed and<br />
not sprayed with fungicide periodically<br />
throughout the season.<br />
2. Determine the soilborne diseases,<br />
insects, weeds, yield, and quality<br />
responses of peanuts grown under<br />
conventional and reduced tillage<br />
systems to fungicide programs. Plots<br />
under no-till, ro-till, and conventional<br />
tillage systems were left unsprayed,<br />
while other plots received fungicide<br />
programs for leaf spot, and leaf spot<br />
and soilborne diseases. The disease,<br />
insect, weed, yield, quality, and crop<br />
value responses to the tillage and<br />
fungicide programs were measured.<br />
Results<br />
This research will begin to clarify the impact<br />
of tillage systems on disease development<br />
in peanuts. By applying results of this<br />
research, growers will be able to anticipate<br />
yield losses or gains due to reduced tillage<br />
for a range of fungicide inputs for the major<br />
types of peanuts grown in <strong>Oklahoma</strong>. This<br />
research will also add to the <strong>OSU</strong> database<br />
on no-till peanut production in <strong>Oklahoma</strong><br />
and may help growers secure crop insurance<br />
for no-till peanuts in the future. The<br />
impact of tillage practices on pests is<br />
described elsewhere in this document.<br />
The effects on peanut yields and quality<br />
are indicated below. In summary, at the<br />
Eddie Repp Farm Test, ro-till (also known<br />
as strip till) produced significantly higher<br />
yield and grade than did the no-till plots.<br />
This indicates that some soil disturbance<br />
in the seeding zone is preferable to total<br />
no-till. This supports results of previous<br />
research we have conducted. At the Crop<br />
Guard Farm location, the conventional till<br />
treatment yielded significantly more than<br />
either the no-till or ro-till treatments. This soil<br />
was more variable than the Repp location<br />
and tillage was more beneficial here. This<br />
also supports previous findings.<br />
P artners in<br />
rogress<br />
P E A N U T S<br />
Tillage test – <strong>2002</strong><br />
Eddie Repp Farm<br />
Caddo County<br />
Tillage Yield Grade Gross Returns<br />
System (lb/A) (%TSMK) ($/A)<br />
Ro-till 5324 75 987<br />
No-till 4864 73 874<br />
LSD 0.05 243 0.6 50<br />
61
P artners in<br />
rogress<br />
P E A N U T S<br />
Peanut tillage test – <strong>2002</strong><br />
Eddie Repp Farm<br />
Caddo County<br />
Tillage System Herbicide 1 Yield Grade Gross Return<br />
(lb/A) (%TSMK) 2 ($/A)<br />
Ro-till 5324 75 987<br />
Strongarm 5435 75 1003<br />
Valor 5041 76 937<br />
Cadre 5442 76 1014<br />
Weed Free 5414 77 1021<br />
Dual II Mag. 5255 75 975<br />
Pursuit 5483 75 1012<br />
Outlook 5338 76 989<br />
Dual II Mag. + 5186 74 949<br />
Pursuit<br />
No-till 4864 73 874<br />
Strongarm 5061 74 927<br />
Valor 4944 73 892<br />
Cadre 4757 71 832<br />
Weed Free 4888 74 893<br />
Dual II Mag. 4605 73 826<br />
Pursuit 5110 73 923<br />
Outlook 4840 71 853<br />
Dual II Mag. + 4709 73 850<br />
Pursuit<br />
1<br />
Standard labled herbicide rates and application methods were applied.<br />
2<br />
%TSMK = % Total Sound Mature Kernels<br />
62
Peanut tillage and variety test – <strong>2002</strong><br />
Crop Guard Research Farm<br />
Caddo County<br />
P artners in<br />
rogress<br />
P E A N U T S<br />
Tillage System Variety 1 Yield Grade Gross Return<br />
(lb/A) (%TSMK) 2 ($/A)<br />
Conv. Till 3540 76 662<br />
Tamrun 96 3555 76 663<br />
Tamrun OL 01 3525 77 660<br />
Ro-Till 3079 77 580<br />
Tamrun 96 2921 76 545<br />
Tamrun OL 01 3237 77 614<br />
No-Till 3037 75 561<br />
Tamrun 96 2950 75 541<br />
Tamrun OL 01 3125 76 581<br />
1<br />
Standard Variety Tamun 96 vs New Variety Tamrun OL 01.<br />
2<br />
%TSMK = % Total Sound Mature Kernels.<br />
6. Determine Yield Response<br />
to Late Season Nitrogen<br />
Applications (Funded by<br />
National Peanut Board)<br />
This work started in <strong>2002</strong> and should be<br />
continued in 2003 to get full advantage of<br />
lessons learned. We will measure peanut<br />
yield and quality as a function of nitrogen<br />
applied during late season. Field plots<br />
will be established at six locations. The<br />
practice of applying nitrogen to peanuts<br />
continues to be a controversial issue in<br />
<strong>Oklahoma</strong> and other states. Since peanuts<br />
are a leguminous plant, well-nodulated<br />
plants are generally thought to produce an<br />
adequate amount of nitrogen for the crop.<br />
However, some research continues to show<br />
advantages for nitrogen applications during<br />
the growing season. Some growers are<br />
using high rates of nitrogen in late season<br />
with the belief that yields will be boosted.<br />
The benefits of this practice have not been<br />
verified by research. Replicated research<br />
is needed to determine if this practice<br />
is beneficial. Nitrogen applications were<br />
made at either 106 days after planting<br />
or 120 days after planting. Nitrogen was<br />
applied as urea (46-0-0) and amounts<br />
shown were the pounds of actual nitrogen<br />
used per acre.<br />
Results<br />
Late season nitrogen applications did not<br />
result in increased peanut yields or improve<br />
peanut grades. Additional research<br />
is required.<br />
63
P artners in<br />
rogress<br />
P E A N U T S<br />
Peanut fertilization test – <strong>2002</strong><br />
Caddo County<br />
(Summary of Six Tests)<br />
Treatment Yield Grade Gross Return<br />
(lb/A) (%TSMK) 1 ($/A)<br />
Untreated Control 4461 73 800<br />
30 2 lbs/A N 3 @ 106 DAP 4561 74 827<br />
50 lbs/A N @ 106 DAP 4587 74 831<br />
100 lbs/A N @ 106 DAP 4775 73 861<br />
150 lbs/A N @ 106 DAP 4419 72 788<br />
200 lbs/A N @ 106 DAP 4476 73 803<br />
LSD 0.05 ns 0.7 ns<br />
1<br />
% TSMK = % Total Sound Mature Kernels<br />
2<br />
Amounts shown are pounds of actual N per acre.<br />
3<br />
N was applied as Urea (46-0-0).<br />
Average Yield – 4557 lbs/A<br />
Peanut fertilization test – <strong>2002</strong><br />
Eddie Repp Farms<br />
Caddo County<br />
Treatment Yield Grade Gross Return<br />
(lb/A) (%TSMK) 1 ($/A)<br />
Untreated Control 4895 72 876<br />
30 lbs/A N 2 @ 106 DAP 5190 76 968<br />
50 lbs/A N @ 106 DAP 4978 76 925<br />
100 lbs/A N @ 106 DAP 4923 77 926<br />
150 lbs/A N @ 106 DAP 4858 76 905<br />
200 lbs/A N @ 106 DAP 4997 75 926<br />
30 lbs/A N @ 120 DAP 5153 75 953<br />
50 lbs/A N @ 120 DAP 4858 75 895<br />
LSD 0.05 ns 1.6 ns<br />
1<br />
% TSMK = % Total Sound Mature Kernels<br />
2<br />
N = Urea (46-0-0)<br />
Nitrogen was applied as urea (46-0-0) and amounts shown were the pounds of actual nitrogen used per<br />
acre.<br />
Average Yield – 4982 lbs/A<br />
64
Peanut fertilization test – <strong>2002</strong><br />
John Clay Farm 1<br />
Caddo County<br />
P artners in<br />
rogress<br />
P E A N U T S<br />
Treatment Yield Grade Gross Return<br />
(lb/A) (%TSMK) 1 ($/A)<br />
Untreated Control 4465 74 806<br />
30 lbs/A N 2 @ 106 DAP 3899 73 698<br />
50 lbs/A N @ 106 DAP 4153 74 747<br />
100 lbs/A N @ 106 DAP 4233 73 759<br />
150 lbs/A N @ 106 DAP 4305 73 766<br />
200 lbs/A N @ 106 DAP 4160 72 736<br />
30 lbs/A N @ 120 DAP 3753 73 669<br />
50 lbs/A N @ 120 DAP 4131 73 737<br />
LSD 0.05 ns ns ns<br />
1<br />
% TSMK = % Total Sound Mature Kernels<br />
2<br />
N = Urea (46-0-0)<br />
Nitrogen was applied as urea (46-0-0) and amounts shown were the pounds of actual nitrogen used per<br />
acre.<br />
Average Yield – 4137 lbs/A<br />
Peanut fertilization test – <strong>2002</strong><br />
John Clay Farm 2<br />
Caddo County<br />
Treatment Yield Grade Gross Return<br />
(lb/A) (%TSMK) 1 ($/A)<br />
Untreated Control 4661 72 822<br />
30 lbs/A N 2 @ 106 DAP 5111 72 914<br />
50 lbs/A N @ 106 DAP 4908 74 888<br />
100 lbs/A N @ 106 DAP 4995 71 880<br />
150 lbs/A N @ 106 DAP 4908 69 836<br />
200 lbs/A N @ 106 DAP 4646 72 823<br />
30 lbs/A N @ 120 DAP 5009 71 875<br />
50 lbs/A N @ 120 DAP 4995 74 907<br />
LSD 0.05 ns 2.2 ns<br />
1<br />
% TSMK = % Total Sound Mature Kernels<br />
2<br />
N = Urea (46-0-0)<br />
Nitrogen was applied as urea (46-0-0) and amounts shown were the pounds of actual nitrogen used per<br />
acre.<br />
Average Yield – 4904 lbs/A<br />
65
P artners in<br />
rogress<br />
P E A N U T S<br />
Peanut fertilization test – <strong>2002</strong><br />
Caddo Research Station<br />
Caddo County<br />
Treatment Yield Grade Gross Return<br />
(lb/A) (%TSMK) 1 ($/A)<br />
Untreated Control 4385 74 794<br />
30 lbs/A N 2 @ 106 DAP 4574 74 826<br />
50 lbs/A N @ 106 DAP 4305 72 764<br />
100 lbs/A N @ 106 DAP 4639 72 821<br />
150 lbs/A N @ 106 DAP 4429 72 788<br />
200 lbs/A N @ 106 DAP 4276 71 750<br />
30 lbs/A N @ 120 DAP 4574 72 816<br />
50 lbs/A N @ 120 DAP 4407 71 775<br />
LSD 0.05 ns 1.3 ns<br />
1<br />
% TSMK = % Total Sound Mature Kernels<br />
2<br />
N = Urea (46-0-0)<br />
Nitrogen was applied as urea (46-0-0) and amounts shown were the pounds of actual nitrogen used per<br />
acre.<br />
Average Yield – 4449 lbs/A<br />
Peanut fertilization test – <strong>2002</strong><br />
Carlos Squires Farm<br />
Caddo County<br />
Treatment Yield Grade Gross Return<br />
(lb/A) (%TSMK) 1 ($/A)<br />
Untreated Control 4207 74 768<br />
30 lbs/A N 2 @ 106 DAP 5119 76 952<br />
50 lbs/A N @ 106 DAP 4635 75 852<br />
100 lbs/A N @ 106 DAP 5157 74 945<br />
150 lbs/A N @ 106 DAP 4077 74 741<br />
200 lbs/A N @ 106 DAP 4728 75 874<br />
30 lbs/A N @ 120 DAP 4598 75 849<br />
50 lbs/A N @ 120 DAP 4691 75 862<br />
LSD 0.05 ns ns ns<br />
1<br />
% TSMK = % Total Sound Mature Kernels<br />
2<br />
N = Urea (46-0-0)<br />
Nitrogen was applied as urea (46-0-0) and amounts shown were the pounds of actual nitrogen used per<br />
acre.<br />
Average Yield – 4652 lbs/A<br />
66
Peanut fertilization test – <strong>2002</strong><br />
Crop Guard Research Farm<br />
Caddo County<br />
P artners in<br />
rogress<br />
P E A N U T S<br />
Treatment Yield Grade Gross Return<br />
(lb/A) (%TSMK) 1 ($/A)<br />
Untreated Control 4196 72 747<br />
30 lbs/A N 2 @ 106 DAP 3768 72 672<br />
50 lbs/A N @ 106 DAP 4654 73 836<br />
100 lbs/A N @ 106 DAP 4835 73 874<br />
150 lbs/A N @ 106 DAP 3964 73 710<br />
200 lbs/A N @ 106 DAP 4240 73 757<br />
LSD 0.05 ns 0.6 ns<br />
1<br />
% TSMK = % Total Sound Mature Kernels<br />
2<br />
N = Urea (46-0-0)<br />
Nitrogen was applied as urea (46-0-0) and amounts shown were the pounds of actual nitrogen used per<br />
acre.<br />
Average Yield – 4276 lbs/A<br />
Appreciation is expressed for the cooperation and tremendous assistance<br />
from<br />
<strong>OSU</strong><br />
Otis Bales<br />
Caddo Research Station<br />
Bobby Weidenmaier, Agriculturist<br />
Mike Branties, Field Foreman<br />
Jerry Howell, Field Assistant<br />
Arthur Kell, Grady County<br />
Matt Muller, Jackson County<br />
Gary Weger, Bryan County<br />
Carlos Squires, Caddo County<br />
John and Stephen Clay, Caddo County<br />
Roger Musick, Crop Guard Research, Caddo County<br />
67
P P<br />
artners in<br />
rogress<br />
P E A N U T S