Multiparameter radar and in situ aircraft observation of graupel and ...
Multiparameter radar and in situ aircraft observation of graupel and ...
Multiparameter radar and in situ aircraft observation of graupel and ...

You also want an ePaper? Increase the reach of your titles
YUMPU automatically turns print PDFs into web optimized ePapers that Google loves.
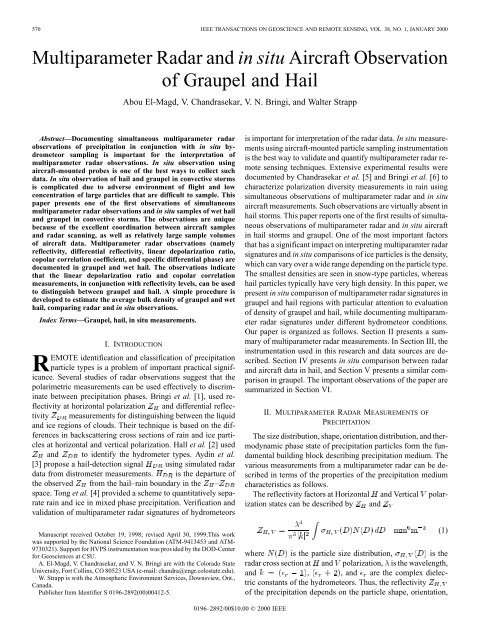
570 IEEE TRANSACTIONS ON GEOSCIENCE AND REMOTE SENSING, VOL. 38, NO. 1, JANUARY 2000<br />
<strong>Multiparameter</strong> Radar <strong>and</strong> <strong>in</strong> <strong>situ</strong> Aircraft Observation<br />
<strong>of</strong> Graupel <strong>and</strong> Hail<br />
Abou El-Magd, V. Ch<strong>and</strong>rasekar, V. N. Br<strong>in</strong>gi, <strong>and</strong> Walter Strapp<br />
Abstract—Document<strong>in</strong>g simultaneous multiparameter <strong>radar</strong><br />
<strong>observation</strong>s <strong>of</strong> precipitation <strong>in</strong> conjunction with <strong>in</strong> <strong>situ</strong> hydrometeor<br />
sampl<strong>in</strong>g is important for the <strong>in</strong>terpretation <strong>of</strong><br />
multiparameter <strong>radar</strong> <strong>observation</strong>s. In <strong>situ</strong> <strong>observation</strong> us<strong>in</strong>g<br />
<strong>aircraft</strong>-mounted probes is one <strong>of</strong> the best ways to collect such<br />
data. In <strong>situ</strong> <strong>observation</strong> <strong>of</strong> hail <strong>and</strong> <strong>graupel</strong> <strong>in</strong> convective storms<br />
is complicated due to adverse environment <strong>of</strong> flight <strong>and</strong> low<br />
concentration <strong>of</strong> large particles that are difficult to sample. This<br />
paper presents one <strong>of</strong> the first <strong>observation</strong>s <strong>of</strong> simultaneous<br />
multiparameter <strong>radar</strong> <strong>observation</strong>s <strong>and</strong> <strong>in</strong> <strong>situ</strong> samples <strong>of</strong> wet hail<br />
<strong>and</strong> <strong>graupel</strong> <strong>in</strong> convective storms. The <strong>observation</strong>s are unique<br />
because <strong>of</strong> the excellent coord<strong>in</strong>ation between <strong>aircraft</strong> samples<br />
<strong>and</strong> <strong>radar</strong> scann<strong>in</strong>g, as well as relatively large sample volumes<br />
<strong>of</strong> <strong>aircraft</strong> data. <strong>Multiparameter</strong> <strong>radar</strong> <strong>observation</strong>s (namely<br />
reflectivity, differential reflectivity, l<strong>in</strong>ear depolarization ratio,<br />
copolar correlation coefficient, <strong>and</strong> specific differential phase) are<br />
documented <strong>in</strong> <strong>graupel</strong> <strong>and</strong> wet hail. The <strong>observation</strong>s <strong>in</strong>dicate<br />
that the l<strong>in</strong>ear depolarization ratio <strong>and</strong> copolar correlation<br />
measurements, <strong>in</strong> conjunction with reflectivity levels, can be used<br />
to dist<strong>in</strong>guish between <strong>graupel</strong> <strong>and</strong> hail. A simple procedure is<br />
developed to estimate the average bulk density <strong>of</strong> <strong>graupel</strong> <strong>and</strong> wet<br />
hail, compar<strong>in</strong>g <strong>radar</strong> <strong>and</strong> <strong>in</strong> <strong>situ</strong> <strong>observation</strong>s.<br />
Index Terms—Graupel, hail, <strong>in</strong> <strong>situ</strong> measurements.<br />
I. INTRODUCTION<br />
REMOTE identification <strong>and</strong> classification <strong>of</strong> precipitation<br />
particle types is a problem <strong>of</strong> important practical significance.<br />
Several studies <strong>of</strong> <strong>radar</strong> <strong>observation</strong>s suggest that the<br />
polarimetric measurements can be used effectively to discrim<strong>in</strong>ate<br />
between precipitation phases. Br<strong>in</strong>gi et al. [1], used reflectivity<br />
at horizontal polarization <strong>and</strong> differential reflectivity<br />
measurements for dist<strong>in</strong>guish<strong>in</strong>g between the liquid<br />
<strong>and</strong> ice regions <strong>of</strong> clouds. Their technique is based on the differences<br />
<strong>in</strong> backscatter<strong>in</strong>g cross sections <strong>of</strong> ra<strong>in</strong> <strong>and</strong> ice particles<br />
at horizontal <strong>and</strong> vertical polarization. Hall et al. [2] used<br />
<strong>and</strong> to identify the hydrometer types. Ayd<strong>in</strong> et al.<br />
[3] propose a hail-detection signal us<strong>in</strong>g simulated <strong>radar</strong><br />
data from distrometer measurements. is the departure <strong>of</strong><br />
the observed from the hail–ra<strong>in</strong> boundary <strong>in</strong> the –<br />
space. Tong et al. [4] provided a scheme to quantitatively separate<br />
ra<strong>in</strong> <strong>and</strong> ice <strong>in</strong> mixed phase precipitation. Verification <strong>and</strong><br />
validation <strong>of</strong> multiparameter <strong>radar</strong> signatures <strong>of</strong> hydrometeors<br />
Manuscript received October 19, 1998; revised April 30, 1999.This work<br />
was supported by the National Science Foundation (ATM-9413453 <strong>and</strong> ATM-<br />
9730321). Support for HVPS <strong>in</strong>strumentation was provided by the DOD-Center<br />
for Geosciences at CSU.<br />
A. El-Magd, V. Ch<strong>and</strong>rasekar, <strong>and</strong> V. N. Br<strong>in</strong>gi are with the Colorado State<br />
University, Fort Coll<strong>in</strong>s, CO 80523 USA (e-mail: ch<strong>and</strong>ra@engr.colostate.edu).<br />
W. Strapp is with the Atmospheric Environment Services, Downsview, Ont.,<br />
Canada.<br />
Publisher Item Identifier S 0196-2892(00)00412-5.<br />
is important for <strong>in</strong>terpretation <strong>of</strong> the <strong>radar</strong> data. In <strong>situ</strong> measurements<br />
us<strong>in</strong>g <strong>aircraft</strong>-mounted particle sampl<strong>in</strong>g <strong>in</strong>strumentation<br />
is the best way to validate <strong>and</strong> quantify multiparameter <strong>radar</strong> remote<br />
sens<strong>in</strong>g techniques. Extensive experimental results were<br />
documented by Ch<strong>and</strong>rasekar et al. [5] <strong>and</strong> Br<strong>in</strong>gi et al. [6] to<br />
characterize polarization diversity measurements <strong>in</strong> ra<strong>in</strong> us<strong>in</strong>g<br />
simultaneous <strong>observation</strong>s <strong>of</strong> multiparameter <strong>radar</strong> <strong>and</strong> <strong>in</strong> <strong>situ</strong><br />
<strong>aircraft</strong> measurements. Such <strong>observation</strong>s are virtually absent <strong>in</strong><br />
hail storms. This paper reports one <strong>of</strong> the first results <strong>of</strong> simultaneous<br />
<strong>observation</strong>s <strong>of</strong> multiparameter <strong>radar</strong> <strong>and</strong> <strong>in</strong> <strong>situ</strong> <strong>aircraft</strong><br />
<strong>in</strong> hail storms <strong>and</strong> <strong>graupel</strong>. One <strong>of</strong> the most important factors<br />
that has a significant impact on <strong>in</strong>terpret<strong>in</strong>g multiparamter <strong>radar</strong><br />
signatures <strong>and</strong> <strong>in</strong> <strong>situ</strong> comparisons <strong>of</strong> ice particles is the density,<br />
which can vary over a wide range depend<strong>in</strong>g on the particle type.<br />
The smallest densities are seen <strong>in</strong> snow-type particles, whereas<br />
hail particles typically have very high density. In this paper, we<br />
present <strong>in</strong> <strong>situ</strong> comparison <strong>of</strong> multiparameter <strong>radar</strong> signatures <strong>in</strong><br />
<strong>graupel</strong> <strong>and</strong> hail regions with particular attention to evaluation<br />
<strong>of</strong> density <strong>of</strong> <strong>graupel</strong> <strong>and</strong> hail, while document<strong>in</strong>g multiparameter<br />
<strong>radar</strong> signatures under different hydrometeor conditions.<br />
Our paper is organized as follows. Section II presents a summary<br />
<strong>of</strong> multiparameter <strong>radar</strong> measurements. In Section III, the<br />
<strong>in</strong>strumentation used <strong>in</strong> this research <strong>and</strong> data sources are described.<br />
Section IV presents <strong>in</strong> <strong>situ</strong> comparison between <strong>radar</strong><br />
<strong>and</strong> <strong>aircraft</strong> data <strong>in</strong> hail, <strong>and</strong> Section V presents a similar comparison<br />
<strong>in</strong> <strong>graupel</strong>. The important <strong>observation</strong>s <strong>of</strong> the paper are<br />
summarized <strong>in</strong> Section VI.<br />
II. MULTIPARAMETER RADAR MEASUREMENTS OF<br />
PRECIPITATION<br />
The size distribution, shape, orientation distribution, <strong>and</strong> thermodynamic<br />
phase state <strong>of</strong> precipitation particles form the fundamental<br />
build<strong>in</strong>g block describ<strong>in</strong>g precipitation medium. The<br />
various measurements from a multiparameter <strong>radar</strong> can be described<br />
<strong>in</strong> terms <strong>of</strong> the properties <strong>of</strong> the precipitation medium<br />
characteristics as follows.<br />
The reflectivity factors at Horizontal <strong>and</strong> Vertical polarization<br />
states can be described by <strong>and</strong><br />
where is the particle size distribution, is the<br />
<strong>radar</strong> cross section at <strong>and</strong> polarization, is the wavelength,<br />
<strong>and</strong> , , <strong>and</strong> are the complex dielectric<br />
constants <strong>of</strong> the hydrometeors. Thus, the reflectivity<br />
<strong>of</strong> the precipitation depends on the particle shape, orientation,<br />
(1)<br />
0196–2892/00$10.00 © 2000 IEEE
EL-MAGD et al.: MULTIPARAMETER RADAR AND IN SITU AIRCRAFT OBSERVATION 571<br />
<strong>and</strong> thermodynamic phase as well as the transmitted wave polarization<br />
state. The differential reflectivity is def<strong>in</strong>ed as<br />
the ratio <strong>of</strong> the reflectivity at horizontal <strong>and</strong> vertical polarizations<br />
<strong>and</strong> is given by<br />
TABLE I<br />
CSU-CHILL RADAR CHARACTERISTICS<br />
Seliga <strong>and</strong> Br<strong>in</strong>gi [7] show that there are differences <strong>in</strong> the<br />
backscatter<strong>in</strong>g cross sections <strong>of</strong> ra<strong>in</strong> at horizontal <strong>and</strong> vertical<br />
polarizations. They exploited the existence <strong>of</strong> a relationship<br />
between ra<strong>in</strong>drop shape <strong>and</strong> size <strong>and</strong> showed that <strong>in</strong> ra<strong>in</strong><br />
is related to the median volume diameter <strong>in</strong> ra<strong>in</strong>fall. The<br />
specific differential phase is def<strong>in</strong>ed as [8]<br />
(2)<br />
where <strong>and</strong> are the forward scatter<strong>in</strong>g amplitudes for horizontally<br />
<strong>and</strong> vertically polarized waves, <strong>and</strong> <strong>in</strong>dicates a real<br />
part <strong>of</strong> a complex number. The one-way differential propagation<br />
phase between two range locations <strong>and</strong> is def<strong>in</strong>ed<br />
as<br />
(3)<br />
(4)<br />
Thus, is the specific differential phase propagation between<br />
the horizontal <strong>and</strong> vertical polarization. In the case <strong>of</strong><br />
ra<strong>in</strong>, is a measure <strong>of</strong> the mean <strong>of</strong> the mass-weighted axis<br />
ratio <strong>of</strong> the drops <strong>and</strong> is approximately related to the fourth moment<br />
<strong>of</strong> ra<strong>in</strong>drop size distribution.<br />
The correlation coefficient between horizontally <strong>and</strong><br />
vertically polarized returns is def<strong>in</strong>ed as<br />
where <strong>and</strong> are the backscatter amplitudes at <strong>and</strong><br />
states. The is ma<strong>in</strong>ly <strong>in</strong>fluenced by the variability <strong>in</strong> the<br />
ratio <strong>of</strong> the vertical-to-horizontal size <strong>of</strong> <strong>in</strong>dividual hydrometeors.<br />
When particle size is large compared to the wavelength,<br />
the is affected significantly by the differential phase shift<br />
upon scatter<strong>in</strong>g between the horizontal <strong>and</strong> vertical states. The<br />
value <strong>of</strong> is for ra<strong>in</strong>. In a mixture <strong>of</strong> different hydrometeors,<br />
the is reduced due to the broader spread <strong>in</strong> the<br />
composite distribution <strong>of</strong> shapes <strong>and</strong> sizes compared to a distribution<br />
<strong>of</strong> s<strong>in</strong>gle hydrometeor type. The decrease <strong>in</strong> correlation<br />
would be largest if the reflectivity-weighted distribution <strong>of</strong> the<br />
two hydrometeor types is comparable.<br />
The ratio <strong>of</strong> the cross-polar signal power to the copolar power,<br />
l<strong>in</strong>ear depolarization ratio (LDR) is def<strong>in</strong>ed as<br />
(5)<br />
(6)<br />
where is the vertically polarized backscatter amplitude<br />
when the <strong>in</strong>cident wave is at horizontal state. The LDR depends<br />
on the orientation, shape, <strong>and</strong> size distributions as well as on the<br />
composition <strong>of</strong> scatterers.<br />
III. DATA SOURCES AND INSTRUMENTATION<br />
The data presented <strong>in</strong> this paper were collected by the<br />
CSU-CHILL <strong>radar</strong> <strong>and</strong> the T-28 <strong>aircraft</strong> equipped with the high<br />
volume particle sampler (HVPS) probe. In the follow<strong>in</strong>g, we<br />
describe the details <strong>of</strong> the <strong>in</strong>strumentation <strong>and</strong> the data set.<br />
A. CSU-CHILL Radar<br />
CSU-CHILL <strong>radar</strong> is an S-b<strong>and</strong> cm dual l<strong>in</strong>ear-polarization,<br />
pulsed-Doppler <strong>radar</strong>. The <strong>radar</strong> is equipped with an<br />
antenna <strong>of</strong> 1 beam with matched patterns at horizontal <strong>and</strong><br />
vertical polarizations. The <strong>radar</strong> has a high power signal processor<br />
that can calculate the multiparamemter <strong>radar</strong> measurements<br />
such as , , , <strong>and</strong> , LDR <strong>and</strong> Doppler<br />
velocity <strong>in</strong> real time. The characteristic features <strong>of</strong> the <strong>radar</strong><br />
relevant to this paper are listed <strong>in</strong> Table I.<br />
B. Aircraft Observations<br />
The <strong>aircraft</strong> data used <strong>in</strong> this paper were collected by the T-28<br />
<strong>aircraft</strong>, operated by South Dakota School <strong>of</strong> M<strong>in</strong>es <strong>and</strong> Technology<br />
(SDSM&T), Rapid City. The T-28 is an armored stormpenetrat<strong>in</strong>g<br />
research <strong>aircraft</strong>. It carries a suite <strong>of</strong> state-<strong>of</strong>-the-art
572 IEEE TRANSACTIONS ON GEOSCIENCE AND REMOTE SENSING, VOL. 38, NO. 1, JANUARY 2000<br />
Fig. 1.<br />
HVPS probe <strong>in</strong>stalled under the right w<strong>in</strong>g <strong>of</strong> the T-28 <strong>aircraft</strong>.<br />
Fig. 3. Storm cell location, June 22, 1995.<br />
Fig. 2.<br />
HVPS optical design.<br />
<strong>in</strong>strumentation that can accurately characterize microphysical<br />
populations rang<strong>in</strong>g from cloud droplets a few microns <strong>in</strong> diameter<br />
to hailstones the size <strong>of</strong> golf balls. Dur<strong>in</strong>g the summer <strong>of</strong><br />
1995, the T-28 <strong>aircraft</strong> was equipped with an HVPS <strong>in</strong>strument.<br />
The HVPS is capable <strong>of</strong> measur<strong>in</strong>g particles sizes up to 5 cm, by<br />
tak<strong>in</strong>g two-dimensional (2-D) digital pictures <strong>of</strong> hydrometeors<br />
that pass through a 4.5 cm 20 cm plane that is normal to the<br />
direction <strong>of</strong> <strong>aircraft</strong> flight. This plane is a curta<strong>in</strong> <strong>of</strong> light that is<br />
projected onto a 256 pixel, l<strong>in</strong>ear array, which is sampled at a<br />
rate proportional to the speed <strong>of</strong> the <strong>aircraft</strong>. The pixel spac<strong>in</strong>g <strong>in</strong><br />
the sample plane is 200 m. As particles pass through the light<br />
plane, they create shadows on the l<strong>in</strong>ear array that are converted<br />
by a one-bit analog to digital converter. Thus, as a particle passes<br />
through the sample plane, the sequential slices produce a digital<br />
2-Dimage <strong>of</strong> the particle. Fig. 1 shows the high-volume spectrometer<br />
<strong>in</strong>stalled under the right w<strong>in</strong>g <strong>of</strong> the T-28, <strong>and</strong> Fig. 2<br />
shows the the optical design <strong>of</strong> the HVPS.<br />
Fig. 4. T28 flight tracks, June 22, 1995.<br />
C. Data Description<br />
1) June 22, 1995 Hailstorm: A severe hailstorm occurred<br />
on June 22, 1995 near Fort Coll<strong>in</strong>s, CO. This storm grew to<br />
a height <strong>of</strong> 12.5 km, <strong>and</strong> upon collaps<strong>in</strong>g, produced heavy<br />
ra<strong>in</strong> <strong>and</strong> hail with maximum sizes <strong>of</strong> 3–4 cm. Fig. 3 shows<br />
a sample plan position <strong>in</strong>dicator (PPI) <strong>of</strong> the reflectivity<br />
factor. We can see from Fig. 3 that the <strong>in</strong>tense part <strong>of</strong> the<br />
storm is located at 45–50 km range to the northeast <strong>of</strong> the<br />
CSU-CHILL <strong>radar</strong>. The <strong>radar</strong> cont<strong>in</strong>uously scanned the storm<br />
with approximately a 2 m<strong>in</strong> resolution for about an hour. At the<br />
same time, the T-28 <strong>aircraft</strong> made several penetrations through<br />
the storm, collect<strong>in</strong>g samples <strong>of</strong> hail stones. On 22 June, the<br />
T-28 made four flights through the storm cell located 35 km
EL-MAGD et al.: MULTIPARAMETER RADAR AND IN SITU AIRCRAFT OBSERVATION 573<br />
(a)<br />
(b)<br />
(c)<br />
(d)<br />
(e)<br />
Fig. 5. Vertical section <strong>of</strong> <strong>radar</strong> measurements for the June 22, 1995 hail storm: (a) Z , (b) Z , (c) , (d) K , <strong>and</strong> (e) LDR.<br />
northeast <strong>of</strong> the <strong>radar</strong> (Fig. 3). The flights were at altitudes<br />
between 2.5–3.5 km above ground level to collect data <strong>in</strong> the<br />
hail region. Fig. 4 shows the T-28 flight tracks dur<strong>in</strong>g the<br />
time <strong>in</strong>terval 17:26:19 to 17:45:19 universal time (UT). The<br />
storm was characterized by heavy ra<strong>in</strong> mixed with hail. Near<br />
zero dB, was observed on-ground co<strong>in</strong>cident with high<br />
, <strong>in</strong>dicat<strong>in</strong>g that the hail shaft extended to the ground.<br />
Fig. 5 shows a vertical section through the storm. The various<br />
panels (a)–(e) show reflectivity, , , , <strong>and</strong> LDR,<br />
respectively. The vertical section <strong>of</strong> reflectivity shows strong<br />
vertical development with reflectivities <strong>in</strong> excess <strong>of</strong> 60 dB up<br />
to 7.5 km altitude. The measurement shows ra<strong>in</strong>fall <strong>in</strong><br />
the front end <strong>of</strong> the storm (35–38 km), followed by hail. This<br />
<strong>in</strong>ference is also confirmed by <strong>and</strong> LDR signatures. The<br />
region from 42 km <strong>and</strong> beyond is marked by hail mixed with<br />
ra<strong>in</strong> on the ground, <strong>in</strong>dicated by high <strong>and</strong> low .In<br />
summary, the vertical section <strong>of</strong> <strong>radar</strong> data shown <strong>in</strong> Fig. 5<br />
<strong>in</strong>dicates it is a severe hail storm.
574 IEEE TRANSACTIONS ON GEOSCIENCE AND REMOTE SENSING, VOL. 38, NO. 1, JANUARY 2000<br />
Fig. 7. T-28 <strong>aircraft</strong> flight tracks, June 20, 1995.<br />
Fig. 6. Storm cell location, June 20, 1995.<br />
2) June 20, 1995 Storm: On June 20, 1995, the T-28 <strong>aircraft</strong><br />
made extensive penetrations through a convective cell, which<br />
formed 20 km east <strong>of</strong> the <strong>radar</strong>. Fig. 6 shows a sample PPI <strong>of</strong> reflectivity<br />
factor. Most <strong>of</strong> the penetrations were made at constant<br />
altitudes <strong>of</strong> 4 km above ground level. The T-28 flight tracks are<br />
shown <strong>in</strong> Fig. 7. The CSU-CHILL measurements show that this<br />
storm had echoes <strong>in</strong> excess <strong>of</strong> 40 dBZ along the T-28 tracks. The<br />
HVPS images <strong>of</strong> this storm showed conical <strong>graupel</strong> particles <strong>of</strong><br />
sizes up to 1.4 cm.<br />
Thus, the data sources provide <strong>in</strong> <strong>situ</strong> <strong>observation</strong>s <strong>of</strong> precipitation<br />
particles such as ra<strong>in</strong>, hail, <strong>and</strong> <strong>graupel</strong>. The data set is<br />
unique <strong>in</strong> several aspects, namely<br />
a) large sample volume data us<strong>in</strong>g <strong>aircraft</strong>;<br />
b) hail samples us<strong>in</strong>g <strong>aircraft</strong> <strong>in</strong> high reflectivity;<br />
c) simultaneous coord<strong>in</strong>ated multiparameter <strong>radar</strong> measurements.<br />
In the follow<strong>in</strong>g section, we present detailed analysis <strong>of</strong> comparison<br />
between <strong>radar</strong> <strong>and</strong> <strong>in</strong> <strong>situ</strong> <strong>aircraft</strong> <strong>observation</strong>s.<br />
IV. IN SITU COMPARISON OF RADAR AND AIRCRAFT<br />
MEASUREMENTS IN RAIN–HAIL MIXTURE<br />
The constant altitude PPI (CAPPI) <strong>of</strong> the storm is shown <strong>in</strong><br />
Fig. 8 at the altitude <strong>of</strong> the <strong>aircraft</strong> correspond<strong>in</strong>g to the flight<br />
tim<strong>in</strong>gs <strong>of</strong> the T-28 penetrations. Also shown on the CAPPI are<br />
the T-28 flight tracks. Dur<strong>in</strong>g the flight, the HVPS collected<br />
samples <strong>of</strong> hydrometeors along the path. Sample images <strong>of</strong> hydrometeors<br />
from HVPS are shown <strong>in</strong> Fig. 9. We can see the<br />
presence <strong>of</strong> smooth hail particles. Based on the HVPS <strong>observation</strong>s<br />
along the flight track, the size distributions were estimated.<br />
Fig. 10 shows sample size distributions along the path. For a<br />
given particle size distribution, the multiparameter <strong>radar</strong> <strong>observation</strong>s<br />
can be estimated us<strong>in</strong>g (1)–(6). One <strong>of</strong> the unknowns <strong>in</strong><br />
this process that cannot be provided by HVPS image is the density<br />
<strong>of</strong> the ice particles. For a given size distribution, the reflectivity<br />
is very sensitive to density <strong>of</strong> ice particles <strong>in</strong> comparison to<br />
other parameters such as shape or orientation distribution. This<br />
can be demonstrated by the follow<strong>in</strong>g example. Consider a precipitation<br />
medium where ra<strong>in</strong> is mixed with hail, <strong>and</strong> the ra<strong>in</strong><br />
<strong>and</strong> hail distribution are as follows.<br />
1) Ra<strong>in</strong> Distribution: Marshall Palmer exponential distribution<br />
with ra<strong>in</strong>fall rate <strong>of</strong> 75 mm/hr−1. The shape <strong>of</strong> ra<strong>in</strong>drops is<br />
described by equilibrium shape [9].<br />
2) Hail Distribution: Exponential hail distribution with a<br />
hailfall rate <strong>of</strong> 30 mm hr−1 [10]. The shape <strong>of</strong> hail is modeled as<br />
spheroidal, with an orientation distribution. Fig. 11 shows the<br />
variation <strong>of</strong> as a function <strong>of</strong> axis ratio <strong>of</strong> hail particles <strong>and</strong><br />
bulk density for the model assumed here. We can see from the results<br />
<strong>of</strong> Fig. 11 that reflectivity factor is most sensitive to density<br />
<strong>of</strong> ice particles <strong>in</strong> comparison to other factors such as shape <strong>and</strong><br />
orientation distribution. Therefore, to match reflectivity measurements,<br />
it is sufficient (as a first approximation) to vary density<br />
<strong>and</strong> keep the other parameters such as shape <strong>and</strong> orientation<br />
constant as those <strong>of</strong> spherical particles. We have used the follow<strong>in</strong>g<br />
procedure to compare <strong>radar</strong> <strong>and</strong> <strong>aircraft</strong> measurements.<br />
Based on experimentally observed distributions, we compute reflectivity<br />
accord<strong>in</strong>g to (1). We assume spherical shape for hail<br />
<strong>and</strong> compute the reflectivity factor. The del<strong>in</strong>eation between<br />
ra<strong>in</strong> <strong>and</strong> hail particles was made with comb<strong>in</strong>ations <strong>of</strong> <strong>in</strong>formation<br />
such as HVPS images <strong>of</strong> large particles, discont<strong>in</strong>uities<br />
<strong>in</strong> particle size distributions, <strong>and</strong> large deviations from equilibrium<br />
shape <strong>of</strong> ra<strong>in</strong>drops. The reflectivities <strong>of</strong> ra<strong>in</strong> <strong>and</strong> hail<br />
portions are calculated <strong>and</strong> added to compute the total reflectivity.<br />
The density <strong>of</strong> hail is varied so that the <strong>in</strong> <strong>situ</strong> simulated<br />
reflectivity is matched po<strong>in</strong>twise to the reflectivity observed<br />
by the <strong>radar</strong>. Fig. 12(a) shows the comparison <strong>of</strong> reflectivities<br />
assum<strong>in</strong>g a spherical model for hail <strong>in</strong> the ra<strong>in</strong>/hail mixture.<br />
Fig. 12(b) shows the correspond<strong>in</strong>g best estimates <strong>of</strong> density <strong>of</strong><br />
hail for each sampled distribution along the path. We can see that
EL-MAGD et al.: MULTIPARAMETER RADAR AND IN SITU AIRCRAFT OBSERVATION 575<br />
Fig. 8.<br />
Simultaneous <strong>aircraft</strong> track <strong>and</strong> <strong>radar</strong> data (CAPPI) for June 22, 1995 storm.<br />
the density estimates are <strong>in</strong> the range expected for hail. Once the<br />
density is fixed, the best shape <strong>and</strong> orientation parameters are<br />
chosen to match the LDR <strong>and</strong> measurements, assum<strong>in</strong>g an<br />
average hail particle density. The average density is obta<strong>in</strong>ed as<br />
the mean <strong>of</strong> the estimates shown <strong>in</strong> Fig. 12(b) to be 0.932 g/cm3.<br />
The correspond<strong>in</strong>g axis ratio <strong>of</strong> hail particles was assumed to be<br />
about 0.7 with a Gaussian cant<strong>in</strong>g angle distribution <strong>of</strong> 30 st<strong>and</strong>ard<br />
deviation. The value <strong>of</strong> LDR measured by the <strong>radar</strong> <strong>and</strong><br />
<strong>in</strong>ferred by the <strong>aircraft</strong> measurement is about −22 dB. The<br />
values observed were nearly zero, <strong>and</strong> <strong>observation</strong>s were<br />
about 0.93. In pr<strong>in</strong>ciple, the problem <strong>of</strong> match<strong>in</strong>g multiparameter<br />
<strong>radar</strong> <strong>and</strong> <strong>in</strong> <strong>situ</strong> <strong>observation</strong>s from <strong>aircraft</strong>-based particle<br />
size distributions <strong>in</strong> the hail region is complicated. However,<br />
we have developed a simple first-order approximation to match<br />
them vary<strong>in</strong>g the average density <strong>of</strong> hail particles.<br />
V. IN SITU COMPARISON OF RADAR AND AIRCRAFT<br />
MEASUREMENTS IN THE GRAUPEL REGION OF CONVECTIVE<br />
STORM<br />
On June 20, 1995, the T-28 collected extensive <strong>in</strong> <strong>situ</strong> data <strong>in</strong><br />
the ice phase <strong>of</strong> a storm consist<strong>in</strong>g predom<strong>in</strong>antly <strong>of</strong> <strong>graupel</strong><br />
particles. Most <strong>of</strong> the <strong>aircraft</strong> flights through the storm were<br />
made at a constant altitude <strong>of</strong> 4 km above ground. Fig. 13 shows<br />
CAPPI <strong>of</strong> the storm at the altitude <strong>of</strong> the <strong>aircraft</strong>, at the tim<strong>in</strong>gs<br />
<strong>of</strong> the T-28 flights. The flight tracks are also shown on Fig. 13.
576 IEEE TRANSACTIONS ON GEOSCIENCE AND REMOTE SENSING, VOL. 38, NO. 1, JANUARY 2000<br />
(a)<br />
Fig. 11. Variation <strong>of</strong> simulated Z signature with axis ratio <strong>and</strong> bulk density<br />
for ra<strong>in</strong>/hail mixture.<br />
(b)<br />
Fig. 9. (a) HVPS images <strong>of</strong> hydrometeors <strong>and</strong> (b) 2D-HVPS hail image,<br />
17:28:31, June 22, 1995 at 2.5 km altitude.<br />
(a)<br />
Fig. 10. Particle size distribution 17:30:19 to 17:31:19 on June 20, 1995<br />
measured by HVPS.<br />
Dur<strong>in</strong>g the flight the HVPS collected samples <strong>of</strong> hydrometeors<br />
along the path. Sample images <strong>of</strong> hydrometeors from HVPS are<br />
shown <strong>in</strong> Fig. 14. We can see from Fig. 14 that the particles were<br />
conical <strong>graupel</strong>. From the HVPS images, the size distributions<br />
were estimated along the T-28 flight track. Fig. 15 shows sample<br />
size distribution along the path. Similar to the procedure used <strong>in</strong><br />
the last section, we try to match the reflectivities measured by<br />
<strong>radar</strong> with that simulated from <strong>in</strong> <strong>situ</strong> measured-particle size distribution.<br />
The density <strong>of</strong> the ice particles is varied for each <strong>observation</strong><br />
po<strong>in</strong>t to match the reflectivities. The <strong>radar</strong>-measured<br />
(b)<br />
Fig. 12. (a) Radar <strong>and</strong> <strong>in</strong> <strong>situ</strong> comparison <strong>of</strong> Z , June 22, 1995 <strong>and</strong> (b)<br />
estimated hail density along the T-28 flight track, June 22, 1995.<br />
reflectivity <strong>and</strong> the <strong>in</strong>ferred reflectivity from <strong>aircraft</strong> measurements<br />
are shown <strong>in</strong> Fig. 16(a), whereas the correspond<strong>in</strong>g density<br />
values to match the reflectivities are shown <strong>in</strong> Fig. 16(b). We<br />
can see from Fig. 16 that on the average, the density <strong>of</strong> <strong>graupel</strong><br />
is <strong>in</strong>ferred to be about 0.55 g/cm3. The <strong>graupel</strong> particles were
EL-MAGD et al.: MULTIPARAMETER RADAR AND IN SITU AIRCRAFT OBSERVATION 577<br />
(a)<br />
(b)<br />
Fig. 14. (a) The 2D-HVPS <strong>graupel</strong> image, 16:17:25, June 20, 1995 at 4.0 km<br />
altitude <strong>and</strong> (b) 2D-HVPS <strong>graupel</strong> image, 16:32:30, June 20, 1995 at 4.0 km<br />
altitude.<br />
Fig. 13. Simultaneous <strong>aircraft</strong> track <strong>and</strong> <strong>radar</strong> data (CAPPI) for June 20, 1995<br />
storm.<br />
modeled as conical shapes with smooth edges <strong>and</strong> r<strong>and</strong>om orientation<br />
[9]. The average LDR values <strong>in</strong> <strong>graupel</strong> measured by<br />
the <strong>radar</strong> <strong>and</strong> <strong>in</strong>ferred by the <strong>aircraft</strong> measurement is about −26<br />
dB, whereas the values were close to zero dB, <strong>and</strong> the<br />
<strong>observation</strong>s were close to 0.97.<br />
VI. SUMMARY AND CONCLUSION<br />
Document<strong>in</strong>g the <strong>in</strong> <strong>situ</strong> <strong>observation</strong> <strong>of</strong> hydrometeor type <strong>in</strong><br />
conjunction with multiparameter <strong>radar</strong> measurements is <strong>of</strong> great<br />
Fig. 15. Sample particle size distribution based on HVPS images from the<br />
June 20, 1995 storm, 165 710 to 165 740.<br />
importance <strong>in</strong> the <strong>in</strong>terpretation <strong>of</strong> multiparameter <strong>radar</strong> measurements.<br />
This paper reports one <strong>of</strong> the first measurements<br />
<strong>of</strong> , , LDR, <strong>and</strong> <strong>in</strong> conjunction with <strong>in</strong> <strong>situ</strong> hydrometeor<br />
<strong>observation</strong>s <strong>in</strong> hail <strong>and</strong> <strong>graupel</strong> <strong>in</strong> convective storms.<br />
The T-28 is a unique armored <strong>aircraft</strong> that is capable <strong>of</strong> fly<strong>in</strong>g<br />
through hail storms. The <strong>in</strong> <strong>situ</strong> <strong>observation</strong>s were unique with<br />
respect to the HVPS. Prior <strong>in</strong> <strong>situ</strong> <strong>observation</strong>s with the T-28<br />
were conducted with 2D-P probes that did not have the adequate<br />
sample volume to sample large hail particles. The large<br />
sample volume <strong>of</strong> the HVPS probe was critical <strong>in</strong> sampl<strong>in</strong>g the<br />
low concentration <strong>of</strong> large hail particles. The <strong>in</strong> <strong>situ</strong> <strong>observation</strong><br />
<strong>and</strong> the correspond<strong>in</strong>g multiparameter <strong>radar</strong> <strong>observation</strong>s <strong>of</strong> the
578 IEEE TRANSACTIONS ON GEOSCIENCE AND REMOTE SENSING, VOL. 38, NO. 1, JANUARY 2000<br />
be<strong>in</strong>g zero completes the <strong>in</strong>formation. Thus, it appears<br />
that a comb<strong>in</strong>ation <strong>of</strong> LDR, , <strong>and</strong> reflectivity measurements<br />
can potentially be used <strong>in</strong> a classification scheme to identify wet<br />
hail <strong>and</strong> <strong>graupel</strong>. The problem <strong>of</strong> match<strong>in</strong>g <strong>radar</strong> measurements<br />
<strong>and</strong> <strong>in</strong> <strong>situ</strong> <strong>observation</strong> based on simulation <strong>of</strong> <strong>radar</strong> measurements<br />
is complicated due to a wide variability <strong>of</strong> shape <strong>and</strong><br />
the orientation distribution <strong>of</strong> particles <strong>and</strong> their density. Nevertheless,<br />
we have used a simple approach to make a quantitive<br />
comparison <strong>of</strong> <strong>radar</strong> <strong>and</strong> <strong>in</strong> <strong>situ</strong> <strong>observation</strong>s. The quantative<br />
comparison yielded a density estimate <strong>of</strong> wet hail <strong>of</strong> about<br />
0.93 g/cm3 <strong>and</strong> <strong>of</strong> <strong>graupel</strong> <strong>of</strong> about 0.55 g/cm3. Thus, the <strong>in</strong><br />
<strong>situ</strong> verification provides <strong>in</strong>formation on the bulk density <strong>of</strong> ice<br />
particles <strong>in</strong> addition to document<strong>in</strong>g the particle type <strong>and</strong> size<br />
distribution.<br />
(b)<br />
ACKNOWLEDGMENT<br />
The authors acknowledge the assistance provided by the<br />
SDSM&T staff <strong>in</strong> decod<strong>in</strong>g the HVPS data <strong>and</strong> H. Liu <strong>in</strong> the<br />
preparation <strong>of</strong> this manuscript.<br />
Fig. 16. (a) Radar <strong>and</strong> <strong>in</strong> <strong>situ</strong> comparison <strong>of</strong> Z <strong>and</strong> (b) June 20, 1995,<br />
estimated <strong>graupel</strong> density; June 20, 1995.<br />
(b)<br />
TABLE II<br />
COMPARISON OF THE MICROPHYSICAL PROPERTIES OF JUNE 20,1995 AND<br />
JUNE 22, 1995 STORMS<br />
REFERENCES<br />
[1] V. N. Br<strong>in</strong>gi, R. M. Rasmussen, <strong>and</strong> J. Vivekan<strong>and</strong>an, “<strong>Multiparameter</strong><br />
<strong>radar</strong> measurements <strong>in</strong> Colorado convective storms Part I,” Graupel<br />
Melt<strong>in</strong>g Studies, vol. 43, pp. 2545–2563, 1986.<br />
[2] M. P. M. Hall, J. W. F. Goddard, <strong>and</strong> S. M. Cherry, “Identification <strong>of</strong><br />
hydrometeors <strong>and</strong> other targets by dual-polarization <strong>radar</strong>,” Radio Sci.,<br />
vol. 19, no. 1, pp. 132–140, 1984.<br />
[3] K. Ayd<strong>in</strong>, T. A. Seliga, <strong>and</strong> V. Balaji, “Remote sens<strong>in</strong>g <strong>of</strong> hail with a<br />
dual l<strong>in</strong>ear polarization <strong>radar</strong>,” J. Climate Appl. Meteorol., vol. 25, pp.<br />
1475–1484, 1986.<br />
[4] “<strong>Multiparameter</strong> <strong>radar</strong> <strong>observation</strong>s <strong>of</strong> time evolution <strong>of</strong> convective<br />
storms”, to be published.<br />
[5] V. Ch<strong>and</strong>rasekar, W. A. Cooper, <strong>and</strong> V. N. Br<strong>in</strong>gi, “Axis ratios <strong>and</strong> oscillations<br />
<strong>of</strong> ra<strong>in</strong>drops,” J. Atmos. Sci., vol. 45, pp. 1323–1333, 1988.<br />
[6] V. N. Br<strong>in</strong>gi, V. Ch<strong>and</strong>rasekar, <strong>and</strong> R. Xiao, “Ra<strong>in</strong>drop axis ratios <strong>and</strong><br />
size distributions: An assesment <strong>of</strong> multiparameter <strong>radar</strong> algorithms,”<br />
IEEE Trans. Geosci. Remote Sens<strong>in</strong>g, vol. 36, no. 3, pp. 703–715, 1998.<br />
[7] T. A. Seliga <strong>and</strong> V. N. Br<strong>in</strong>gi, “Potential use <strong>of</strong> <strong>radar</strong> differential reflectivity<br />
measurements at orthogonal polarizations for measur<strong>in</strong>g precipitation,”<br />
J. Appl. Meteorol., vol. 15, pp. 69–76, 1976.<br />
[8] , “Differential reflectivity <strong>and</strong> differential phase shift: Applications<br />
<strong>in</strong> <strong>radar</strong> meteorology,” Radio Sci., vol. 13, pp. 271–275, 1978.<br />
[9] H. R. Pruppacher <strong>and</strong> J. D. Klett, Microphysics <strong>of</strong> Clouds <strong>and</strong> Precipitation.<br />
Dordrecht, The Netherl<strong>and</strong>s: D. Reidel.<br />
[10] L. Cheng <strong>and</strong> M. English, “A relationship between hailstones concentration<br />
<strong>and</strong> size,” J. Atmos. Sci., vol. 40, pp. 204–213, 1983.<br />
[11] K. Ayd<strong>in</strong>, T. A. Seliga, <strong>and</strong> V. N. Br<strong>in</strong>gi, “Differential <strong>radar</strong> scatter<strong>in</strong>g<br />
properties <strong>of</strong> model hail <strong>and</strong> mixed-phase hydrometeors,” <strong>in</strong> Radio Sci.,<br />
1984, vol. 19, ch. Ch. 29a, pp. 58–66.<br />
Abou El-Magd, photograph <strong>and</strong> biography not available at the time <strong>of</strong> publication.<br />
V. Ch<strong>and</strong>rasekar, photograph <strong>and</strong> biography not available at the time <strong>of</strong> publication.<br />
two cases are summarized <strong>in</strong> Table II. Based on the results <strong>of</strong><br />
Table II, we can see that critically dist<strong>in</strong>guish<strong>in</strong>g features <strong>of</strong><br />
these two cases are found <strong>in</strong> <strong>observation</strong>s <strong>of</strong> LDR <strong>and</strong><br />
<strong>in</strong> conjunction with reflectivity levels. The values <strong>of</strong> <strong>and</strong><br />
V. N. Br<strong>in</strong>gi, photograph <strong>and</strong> biography not available at the time <strong>of</strong> publication.<br />
Walter Strapp, photograph <strong>and</strong> biography not available at the time <strong>of</strong> publication.