Chapter 2 - Sedibeng District Municipality
Chapter 2 - Sedibeng District Municipality
Chapter 2 - Sedibeng District Municipality

Create successful ePaper yourself
Turn your PDF publications into a flip-book with our unique Google optimized e-Paper software.
ANALYSIS 2011/12 CHAPTER 2<br />
2.1 OUR AREA:<br />
2.1.1 GEOGRAPHICAL AREA<br />
The <strong>Sedibeng</strong> <strong>District</strong> <strong>Municipality</strong> is a Category C municipality found in Gauteng Province. It is the only<br />
area of the Gauteng Province that is situated on the banks of Vaal River and Vaal Dam in the Southernmost<br />
part of the Province, covering the area formerly known as the Vaal Triangle. It includes the towns<br />
of Vereeniging, Vanderbijlpark, Meyerton and Heidelberg as well as the historic townships of Evaton,<br />
Sebokeng, Boipatong, Bophelong, Sharpeville, and Ratanda, which have a rich political history and<br />
heritage. The massive improvement in road network axis of East/ West and North and South with the<br />
N17, N1, N3, and R59-highways transverse the <strong>District</strong>, and it is seen as one of the most accessible<br />
<strong>District</strong>s in the country and Southern Africa. This accessibility has improved even more, and making the<br />
<strong>District</strong> an ideal site for investors who wish to focus on export via the N3 route to Durban Port and the<br />
N1 and the R59 routes to OR Tambo International Airport. The R59-corridor and the northern parts of<br />
the Midvaal Local <strong>Municipality</strong> seem to be the primary areas of over-flow of industrial relocation from<br />
Central Gauteng and further a field into the <strong>District</strong>.<br />
Total size of geographical area(km 2 )<br />
<strong>Sedibeng</strong> <strong>District</strong><br />
<strong>Municipality</strong><br />
Emfuleni Local<br />
<strong>Municipality</strong><br />
Midvaal Local<br />
<strong>Municipality</strong><br />
Lesedi Local<br />
<strong>Municipality</strong><br />
4,185 km 2 968 km 2 1,728 km 2 1,489 km 2<br />
(Source: Global Insight, 2009)<br />
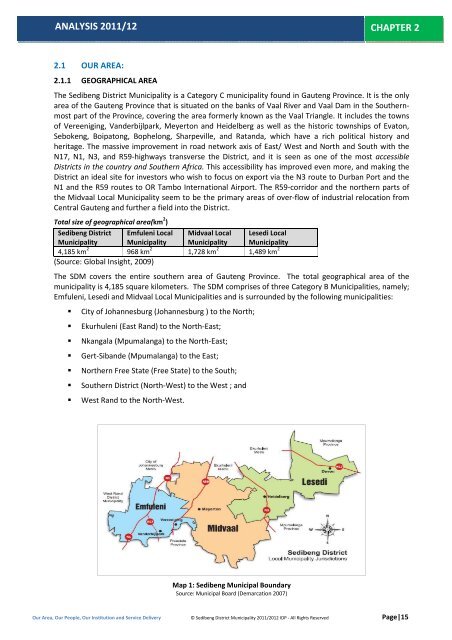
The SDM covers the entire southern area of Gauteng Province. The total geographical area of the<br />
municipality is 4,185 square kilometers. The SDM comprises of three Category B Municipalities, namely;<br />
Emfuleni, Lesedi and Midvaal Local Municipalities and is surrounded by the following municipalities:<br />
<br />
<br />
<br />
<br />
<br />
<br />
<br />
City of Johannesburg (Johannesburg ) to the North;<br />
Ekurhuleni (East Rand) to the North-East;<br />
Nkangala (Mpumalanga) to the North-East;<br />
Gert-Sibande (Mpumalanga) to the East;<br />
Northern Free State (Free State) to the South;<br />
Southern <strong>District</strong> (North-West) to the West ; and<br />
West Rand to the North-West.<br />
Map 1: <strong>Sedibeng</strong> Municipal Boundary<br />
Source: Municipal Board (Demarcation 2007)<br />
Our Area, Our People, Our Institution and Service Delivery © <strong>Sedibeng</strong> <strong>District</strong> <strong>Municipality</strong> 2011/2012 IDP - All Rights Reserved Page|15
ANALYSIS 2011/12 CHAPTER 2<br />
2.1.2 MAJOR PROVINCIAL AND ARTERIAL ROADS (DEVELOPMENT CORRIDORS)<br />
The <strong>District</strong> has an extensive road network at both the national and regional level, including the N1 tollroad,<br />
the R59 in the West and the N3 in the Eastern section of the <strong>District</strong>, which traverse the <strong>District</strong><br />
and connect with the Ekurhuleni Metro and City of Johannesburg Metropolitan. All major routes are<br />
predominantly on a North-South axis and tend to converge on the City of Johannesburg. The regional<br />
main roads in the <strong>District</strong> tend to radiate out from or converge on the commercial centres of<br />
Vereeniging and Heidelberg. The R42 provides the main East-West linkage across the <strong>District</strong>. The<br />
highest concentration of roads in the <strong>District</strong> is situated in the Emfuleni area which has the highest<br />
population density, extensive residential areas, proximity to large services centre (for example,<br />
Vereeniging and Vanderbijlpark). It also provides connectivity to Johannesburg and the Free State<br />
Province. The following identified roads provide important linkages and should be optimized to link<br />
historically disadvantaged communities to areas of major employment. These include:<br />
<br />
<br />
<br />
<br />
<br />
<br />
<br />
<br />
Provincial Route R29 – main East-West linkage running parallel to the N17 in the North-Eastern<br />
part of the study area, linking Devon / Impumelelo with Vischkuil / Endicott and further West<br />
with Springs in Ekurhuleni.<br />
Provincial Route R42 – this is the main East-West linkage through the <strong>District</strong>, stretching from<br />
the N1 at Loch Vaal in the South-West through Vanderbijlpark, Vereeniging, Heidelberg, and<br />
Nigel to Vischkuil / Endicott in the North-Eastern part of the study area and onwards towards<br />
Delmas in Mpumalanga.<br />
Provincial Route R59 – The main North-South linkage through the study area, linking<br />
Vereeniging/Vanderbijlpark with Meyerton and northwards towards Alberton in Ekurhuleni.<br />
Provincial Route R82 – a secondary North-South link, linking Vereeniging with De Deur and<br />
Walkerville and Johannesburg towards the North.<br />
Provincial Route R54 – the main link between Sebokeng, Vereeniging and Vaal Marina in the<br />
South.<br />
Provincial Route R553 – [Golden Highway] – an important North-South link between<br />
Vanderbijlpark through Sebokeng/Evaton towards Johannesburg in the North.<br />
R57 from the N1 Southwards – towards Metsimaholo Local <strong>Municipality</strong>.<br />
R28 linking North-West Province from the West with Vereeniging.<br />
Map 2: Major Provincial and Arterial Roads<br />
Source: Municipal Board (Demarcation 2007)<br />
Our Area, Our People, Our Institution and Service Delivery © <strong>Sedibeng</strong> <strong>District</strong> <strong>Municipality</strong> 2011/2012 IDP - All Rights Reserved Page|16
ANALYSIS 2011/12 CHAPTER 2<br />
2.1.3 ENVIRONMENTAL HEALTH MANAGEMENT<br />
Environmental quality has been an ongoing concern in the <strong>Sedibeng</strong> Region for a number of years. The<br />
Growth and Development Strategy through the pillar of “Reviving Our Environment” finally gives the<br />
region the means to comprehensively address this issue and ensure that its citizens live in an<br />
environment that supports a positive quality of life for them, their children and future generations. The<br />
Environmental Division developed an Environmental Programme of Action (EPoA) as one of the<br />
outcomes of the regional environmental retreat that was held in June 2007. The aim of the EPoA is to<br />
provide strategic guidance for the environmental revival as envisaged in the <strong>Sedibeng</strong> Growth and<br />
Development Strategy. The aim of the EPoA is to assist in ensuring a consistent approach across the<br />
municipalities and other key government stakeholders towards environmental management in the<br />
region. The EPoA identified three priority areas for intervention to address major environmental<br />
challenges namely: only 3 are mentioned i.e. water, waste and air quality.<br />
• Water pollution;<br />
• Waste; and<br />
• Air quality.<br />
2.1.3.1 Water Pollution<br />
<strong>Sedibeng</strong> is face with serious water pollution challenges in river systems and water bodies, notably the<br />
Kliprivier and Blesbokspruit which are polluted from runoffs from industrial areas, townships and waste<br />
water treatment works.<br />
Figure 1: Kliprivier<br />
The Kliprivier is one of the most polluted rivers in the <strong>Sedibeng</strong> <strong>District</strong> as a result of mining and<br />
industrial activities in the upper catchments, outside the borders of the <strong>Sedibeng</strong>. (Source: Strategic<br />
Environmental Focus 2009).<br />
The state of <strong>Sedibeng</strong>’s surface and ground water quality is influenced by activities within and beyond<br />
the boundaries of <strong>Sedibeng</strong>. External pressures, emanating from mining and industrial activities on the<br />
West Rand (Roodepoort and Randfontein) and East Rand (Germiston, Boksburg, Brakpan and Springs),<br />
are major contributing factors to the current state of surface and ground water quality in <strong>Sedibeng</strong>. The<br />
largest internal pressures are limited to the industrialised and urban areas in Emfuleni, including<br />
Meyerton, Vanderbijlpark and Vereeniging. Rural areas in Midvaal and Lesedi, where agricultural<br />
activities dominate, have a lesser, but nonetheless important, influence on the surface and ground<br />
Our Area, Our People, Our Institution and Service Delivery © <strong>Sedibeng</strong> <strong>District</strong> <strong>Municipality</strong> 2011/2012 IDP - All Rights Reserved Page|17
ANALYSIS 2011/12 CHAPTER 2<br />
water quality. Heidelberg and Devon, which are the main urban areas of Lesedi, also contribute to<br />
surface and groundwater deterioration through urban associated pollution.<br />
The main pressures on the quality of surface and groundwater resources in the <strong>Sedibeng</strong> <strong>District</strong> are the<br />
following:<br />
<br />
<br />
<br />
<br />
<br />
<br />
<br />
<br />
<br />
<br />
Mining activities, including physical mining practices and mining effluent release from mineral<br />
extraction and mine dumps;<br />
Industrial activities;<br />
Water treatment works;<br />
Informal settlements, which usually lack services;<br />
Poorly serviced high-density residential settlements;<br />
High-density urban areas;<br />
Coal combustion on the Mpumalanga Highveld, which results in acid rain in the <strong>Sedibeng</strong><br />
<strong>District</strong>;<br />
Water abstraction for urban and agricultural use;<br />
Flow reduction in streams and rivers as a result of dams and weirs; and<br />
Agricultural activities.<br />
Source: Strategic Environmental Focus 2008: <strong>Sedibeng</strong> <strong>District</strong> <strong>Municipality</strong> – State of the Environment Report.<br />
2.1.3.2 Waste<br />
<strong>Sedibeng</strong>’s history with regards to waste management is not that different to the South African situation<br />
in general. The issue of waste as with most Local, provincial and national departments has many facets<br />
including economical, physical, social and political. Waste management has traditionally taken place on<br />
an ad-hoc basis to meet the current needs, with very little foresight into the future needs of an everincreasing<br />
population. Identification of landfill sites has generally taken the form of unplanned site<br />
location with little or no thought of design to reduce potential impacts to the environment,<br />
neighbouring communities, etc. With the development of the minimum requirements by the<br />
Department of Water Affairs and Forestry (DWAF) for waste disposal by landfill the identification of<br />
landfill sites now take a much more pro-active approach in reducing further negative consequences<br />
related to an activity such as planning and design.<br />
Local authorities in <strong>Sedibeng</strong> have indicated that they have neither sufficient funding nor adequate<br />
trained staff, to effectively plan and execute their waste management functions in a sustainable<br />
manner.<br />
Communities have also not been involved in the identification of the landfills, which has resulted in<br />
community resistance and/or limited support. The level of services varied by area and in particular the<br />
previously disadvantaged areas have been left without proper waste management services.<br />
In order for <strong>Sedibeng</strong> to address waste management it needs to address the following:<br />
<br />
<br />
<br />
<br />
<br />
Waste prevention;<br />
Waste minimization;<br />
Resource recovery;<br />
Treatment; and<br />
Safe disposal<br />
Source:(Strategic Environmental Focus 2008: <strong>Sedibeng</strong> <strong>District</strong> <strong>Municipality</strong> – State of the Environment Report)<br />
Our Area, Our People, Our Institution and Service Delivery © <strong>Sedibeng</strong> <strong>District</strong> <strong>Municipality</strong> 2011/2012 IDP - All Rights Reserved Page|18
ANALYSIS 2011/12 CHAPTER 2<br />
2.1.3.3 Air Quality<br />
<strong>Sedibeng</strong> <strong>District</strong> <strong>Municipality</strong> is generally characterized by poor air quality, particularly within the<br />
Emfuleni and Midvaal Municipalities. A series of studies undertaken over the years have clearly<br />
indicated the negative impact of pollution on the health of people living and working in the area. As a<br />
result the Vaal area (including Emfuleni and Midvaal) was declared a Priority Area in terms of the<br />
National Environmental Management: Air Quality Act in 2006.<br />
The proposed Highveld Priority Area will include Lesedi along with areas of Mpumalanga, effectively<br />
making the whole <strong>Sedibeng</strong> region a priority area in terms of known ambient air quality problems.<br />
Recent data from Department of Environmental Affairs and Tourism’s (DEAT) air quality monitoring<br />
stations in the Vaal shows particulate matter as being the key problem, with levels well over<br />
international standards. (Source: EPoA Version 0.2, 2nd October 2007).<br />
2.1.4 SEDIBENG ECONOMIC REVIEW<br />
The economy of <strong>Sedibeng</strong> <strong>District</strong> <strong>Municipality</strong> has for the largest part of its existence been dominated<br />
by heavy manufacturing and still is the dominant feature of regional economy. There are two main subsector<br />
of manufacturing, namely (1) fabricated metal and (2) chemicals. In the metal sector, the Arcelor-<br />
Mittal (formerly ISCOR) steel plant, the Cape Gate Davsteel wire and steel plant and the ferromanganese<br />
plant of Samancor, are the three main large baseline plants in the <strong>District</strong>, while DCD-Dorbyl Heavy<br />
Engineering is the biggest manufacturer of massive engineered products in Southern Africa. SASOL, of<br />
which the primary plant in the <strong>District</strong> is based in the Metsimaholo Local <strong>Municipality</strong> in the Free State,<br />
is the major player in the chemical industry sector in the <strong>District</strong>.<br />
It is envisaged that the manufacturing sector will remain the dominant economic sector in the <strong>District</strong><br />
for the foreseeable future. It is therefore a sector in which efforts to revitalize the regional economy<br />
need to be consolidated and diversified. Given the backward and forward linkages in the manufacturing<br />
sector, mainly within the same sector and with agriculture and mining, it is also a significant economic<br />
multiplier.<br />
Other important sectors in the <strong>District</strong> economy include services, trade, transport, electricity,<br />
construction and agriculture. Some economists observed that the recession was bottom out for those in<br />
the services sector, but at the same time, there was still a long road to go to recovery. Meanwhile other<br />
Economists saw a very good recovery in couple of years ahead, with a number of new shopping centres<br />
in the pipeline and massive new residential developments (10,000-20,000 ) being planned by the private<br />
sector.<br />
2.1.4.1 Dual nature of the economy<br />
<strong>Sedibeng</strong> <strong>District</strong> <strong>Municipality</strong> is characterized by dual economy consisting of formal and informal.<br />
According to Wikipedia (2010), formal economy is defined as the economic activity that is regulated and<br />
monitored by the government, contributing to the Gross National Product (GNP) of the country,<br />
whereas the informal economy is an activity that is neither taxed nor monitored by a government, and is<br />
excluded from the government’s Gross National Product (GNP).<br />
2.1.4.1.1 Informal sector<br />
Informal sector covers a vast range of labour market activities, composing of two groups of different<br />
nature (Worldbank, 2010). Firstly, it results from coping behaviour of individuals and families in<br />
Our Area, Our People, Our Institution and Service Delivery © <strong>Sedibeng</strong> <strong>District</strong> <strong>Municipality</strong> 2011/2012 IDP - All Rights Reserved Page|19
ANALYSIS 2011/12 CHAPTER 2<br />
economic climate where earning opportunities are limited. Secondly, informal sector is a product of<br />
rational behavior of entrepreneurs that desire to escape state regulations.<br />
Two Types of Informal Sectors<br />
Coping Strategies (Survivalist)<br />
111Casual jobs, temporary jobs, unpaid jobs,<br />
subsistence agriculture and multiple job holding<br />
Illegal business activities<br />
Tax evasion, avoidance of labour<br />
regulation and no company<br />
registration<br />
Source: The World Bank Group, 2010<br />
No record of support and intervention for the informal sector was mentioned throughout <strong>Sedibeng</strong><br />
<strong>District</strong> <strong>Municipality</strong> however, an Informal Trader Strategy has been adopted to develop key<br />
programmes and support.<br />
2.1.4.1.2 Formal Sector<br />
As defined above, formal sector economy is a well-structured, organized, accounted and regulated<br />
sector of the economy. Below, a detailed analysis of formal sector in <strong>Sedibeng</strong> <strong>District</strong> <strong>Municipality</strong> is<br />
given.<br />
2.1.4.1.2.1 Sectoral Analysis<br />
The percentage contribution of economic sectors to the total GVA is used to measure how much each<br />
sector has contributed to the economy’s GVA. The manufacturing sector played a noteworthy role in<br />
the economy of the SDM. The share of the sector to the economy of the <strong>District</strong> municipality was 51.2%<br />
in 1996; 43.3% in 2001 and 35.3% in 2009. It is however worrying that the contribution of the sector to<br />
the <strong>District</strong>’s economy was on a decline. The manufacturing sector was also the largest employer in the<br />
<strong>District</strong>, absorbing just over 24% of the <strong>District</strong> municipality’s economically active population. The<br />
manufacturing sector was the <strong>District</strong>’s comparative advantage, which means the <strong>District</strong> could export<br />
manufactured products to other <strong>District</strong>s. Other key sectors were trade, finance and community<br />
services, which also absorbed a significant amount of the <strong>District</strong>’s economically active population.<br />
The secondary and tertiary sectors were key sectors to the economy of the SDM, both contributing<br />
significantly to the <strong>District</strong>’s economy. The Primary sector was on the other hand the least contributor to<br />
the <strong>District</strong>’s economy.<br />
The table below illustrates the contribution of the three (3) sectors to the total <strong>District</strong> economy.<br />
<strong>Sedibeng</strong> <strong>District</strong> Sectoral Economic Analysis in terms of percentage<br />
Year<br />
Gross Value Added by <strong>District</strong> (GVA-R)<br />
Primary Sector Secondary Sector Tertiary Sector<br />
Agriculture Mining Manufacturing Electricity Construction Trade Transport Finance<br />
Community<br />
services<br />
2006 1.5% 0.4% 41.1% 4.1% 3.1% 8.0% 5.3% 15.2% 21.3%<br />
2007 1.7% 0.4% 41.2% 4.0% 3.3% 7.8% 5.0% 16.3% 20.2%<br />
2008 1.4% 0.4% 40.8% 3.9% 3.7% 7.9% 5.4% 16.4% 20.2%<br />
2009 1.4% 0.2% 35.7% 4.3% 4.4% 8.5% 5.8% 17.4% 22.4%<br />
2010 1.4% 0.2% 35.4% 4.4% 4.2% 8.3% 5.8% 17.5% 22.8%<br />
(Source: Global Insight, 2010)<br />
Our Area, Our People, Our Institution and Service Delivery © <strong>Sedibeng</strong> <strong>District</strong> <strong>Municipality</strong> 2011/2012 IDP - All Rights Reserved Page|20
ANALYSIS 2011/12 CHAPTER 2<br />
<br />
Primary Sector<br />
The primary sector of the economy consists of the agricultural as well as the mining sectors. Mining<br />
contributes 0.3% while agriculture contributes 1.8 % to the <strong>Sedibeng</strong> GVA and together contributing<br />
2.1% which is an increase of 0.1% compared to the 2008 figures of 2.0%. There has been a steady<br />
increase in the activity in this sector since 2001 from 1.8% to 2.1 in 2009, with the growth rate of 0.3% in<br />
8 years.<br />
GVA Growth Rates in the Primary Sector, 2001-2010<br />
Primary sector Annual growth<br />
GP - DC42 <strong>Sedibeng</strong> <strong>District</strong> <strong>Municipality</strong> (%, Constant 2005 prices)<br />
20.0%<br />
15.0%<br />
10.0%<br />
5.0%<br />
0.0%<br />
1997 1998 1999 2000 2001 2002 2003 2004 2005 2006 2007 2008 2009 2010 2011 2012 2013 2014<br />
-5.0%<br />
-10.0%<br />
-15.0%<br />
-20.0%<br />
-25.0%<br />
(Source: Global Insight, 2010)<br />
Source: IHS Global Insight Regional eXplorer version 493<br />
<br />
Secondary Sector<br />
The secondary sector of the economy consists of manufacturing, electricity and construction. The<br />
manufacturing sector is the largest contributor to the economy of <strong>Sedibeng</strong> contributing 40.8%.<br />
Together they contribute 47.7% of a total <strong>Sedibeng</strong> economy representing a decrease of 4.6% compared<br />
to 2008 figures of 52.3%. Although the data for the <strong>District</strong> suggests that the manufacturing sector is<br />
undergoing a slow, but steady decline, and the service sector is growing, manufacturing is still the<br />
largest sector and twice the size of any other single sector.<br />
GVA Growth Rates in the Secondary Sector, 2001-2010<br />
Secondary sector Annual growth<br />
GP - DC42 <strong>Sedibeng</strong> <strong>District</strong> <strong>Municipality</strong> (%, Constant 2005 prices)<br />
15.0%<br />
10.0%<br />
5.0%<br />
0.0%<br />
1997 1998 1999 2000 2001 2002 2003 2004 2005 2006 2007 2008 2009 2010 2011 2012 2013 2014<br />
-5.0%<br />
-10.0%<br />
-15.0%<br />
-20.0%<br />
(Source: Global Insight, 2010)<br />
Source: IHS Global Insight Regional eXplorer version 493<br />
Our Area, Our People, Our Institution and Service Delivery © <strong>Sedibeng</strong> <strong>District</strong> <strong>Municipality</strong> 2011/2012 IDP - All Rights Reserved Page|21
ANALYSIS 2011/12 CHAPTER 2<br />
<br />
Tertiary Sector<br />
The tertiary sector is basically the services sector as well as the government and contributes 50.2 % to<br />
the <strong>Sedibeng</strong> GVA. This sector has seen an increase of 4.5% compared to 2008 45.7%.<br />
GVA Growth Rates in the Tertiary Sector, 2001 – 2010<br />
Tertiary sector Annual growth<br />
GP - DC42 <strong>Sedibeng</strong> <strong>District</strong> <strong>Municipality</strong> (%, Constant 2005 prices)<br />
10.0%<br />
8.0%<br />
6.0%<br />
4.0%<br />
2.0%<br />
0.0%<br />
1997 1998 1999 2000 2001 2002 2003 2004 2005 2006 2007 2008 2009 2010 2011 2012 2013 2014<br />
-2.0%<br />
-4.0%<br />
-6.0%<br />
(Source: Global Insight, 2010)<br />
Source: IHS Global Insight Regional eXplorer version 493<br />
<br />
Economic Growth<br />
Economic output in the <strong>Sedibeng</strong> <strong>District</strong> <strong>Municipality</strong> (DM) varied during 1996, 2001 and 2009. The<br />
total Gross Value Added (GVA) of the <strong>District</strong> municipality declined from R16, 7 billion in 1996 to R14, 5<br />
billion in 2001. This was a 2.8% decline in output between the two years. The GVA however increased<br />
from R14, 5 billion in 2001 to R19, 5 billion in 2009.<br />
The sectors that contributed significantly to the overall economic growth in the <strong>District</strong> were<br />
manufacturing, trade, finance and community (government) services (Global Insight, 2009).<br />
Total growth rate of Gross Domestic Product by <strong>District</strong>, 2009<br />
GDP-R Total Growth<br />
GP - DC42 <strong>Sedibeng</strong> <strong>District</strong> <strong>Municipality</strong><br />
10.0%<br />
8.0%<br />
6.0%<br />
4.0%<br />
2.0%<br />
0.0%<br />
1997 1998 1999 2000 2001 2002 2003 2004 2005 2006 2007 2008 2009 2010 2011 2012 2013 2014<br />
-2.0%<br />
-4.0%<br />
-6.0%<br />
-8.0%<br />
-10.0%<br />
Source: IHS Global Insight Regional eXplorer version 493<br />
(Source: Global Insight, 2010)<br />
The decline in the <strong>Sedibeng</strong> GDPR shown in the above graph for the period 2008 – 2009 can be<br />
attributed to the global meltdown crisis that has affected both the Local and international economies.<br />
However, the projections seem to point to an upwards swing in 2010 and beyond.<br />
Our Area, Our People, Our Institution and Service Delivery © <strong>Sedibeng</strong> <strong>District</strong> <strong>Municipality</strong> 2011/2012 IDP - All Rights Reserved Page|22
ANALYSIS 2011/12 CHAPTER 2<br />
<br />
Location Quotients<br />
A specific regional economy has a comparative advantage over other regional economies if it can<br />
produce efficiently the same goods. The location quotient is one way of measuring this comparative<br />
advantage by taking into account production and employment. If the location quotient is larger than<br />
one for a specified sector and <strong>District</strong>, then that <strong>District</strong> has a comparative advantage in that sector. This<br />
is because the share of that sector of the specified regional economy is greater than the same sector in<br />
the national economy.<br />
Location quotient<br />
Year<br />
Community<br />
Agriculture Mining Manufacturing Electricity Construction Trade Transport Finance services<br />
2006 0.50 0.04 2.35 1.76 1.06 0.58 0.54 0.70 1.02<br />
2007 0.51 0.04 2.43 1.74 1.05 0.59 0.55 0.72 0.99<br />
2008 0.45 0.04 2.48 1.69 1.06 0.60 0.59 0.75 1.00<br />
2009 0.46 0.02 2.36 1.75 1.13 0.64 0.62 0.80 1.05<br />
(Source: Global Insight, 2010)<br />
<br />
Tress Index<br />
The Tress index indicates the level of concentration (or diversification) in an economic <strong>District</strong>. A Tress<br />
index value of 0 means that all economic sectors in the <strong>District</strong> contribute equally to gross value added,<br />
whereas a Tress index of 1 means that one economic sector contributes to all Gross Value Added.<br />
Graph showing tress index in the <strong>District</strong>.<br />
Tress index<br />
GP - DC42 <strong>Sedibeng</strong> <strong>District</strong> <strong>Municipality</strong><br />
70<br />
68<br />
66<br />
64<br />
62<br />
60<br />
58<br />
56<br />
54<br />
1996 1997 1998 1999 2000 2001 2002 2003 2004 2005 2006 2007 2008 2009<br />
Source: IHS Global Insight Regional eXplorer version 493<br />
(Source: Global Insight 2010)<br />
At 67.16 in 1996; 65.11 in 2001 and 58.82 in 2009, the SDM’s tress index was high, indicating that the<br />
<strong>District</strong>’s economy was not too diverse and relied on a handful of economic sectors. An ideal situation is<br />
where the <strong>District</strong>’s economy is diverse and dependent on a number of economic sectors. Since the<br />
economy of the <strong>District</strong> is highly dependent on the manufacturing sector, the occurrence of events such<br />
as interest rate hikes, power failures( load shedding), labour strikes, insurgency and political instability<br />
will negatively impact the key sectors and ultimately the economy of the <strong>District</strong>(Global Insight, 2009)<br />
Our Area, Our People, Our Institution and Service Delivery © <strong>Sedibeng</strong> <strong>District</strong> <strong>Municipality</strong> 2011/2012 IDP - All Rights Reserved Page|23
ANALYSIS 2011/12 CHAPTER 2<br />
<br />
Labour Force Profile<br />
Table showing Population of Employed People across all sectors.<br />
Race Male Female Total<br />
Black 153,212 82.4% 131,602 85.8% 284,814 83.9%<br />
White 28,695 15.4% 19,057 12.4% 47,752 14.1%<br />
Coloured 2,071 1.1% 1,822 1.2% 3,893 1.1%<br />
Asian 1,939 1.0% 897 0.6% 2,836 0.8%<br />
Total 185,917 100.0% 153,379 100.0% 339,296 100.0%<br />
(Source: Global Insight, 2010)<br />
The total number of the Economic Active Population across all sectors is 325 763. This represents 40.4%<br />
of the population of the <strong>District</strong>. The Blacks account for 83.9% of the economically active, followed by<br />
Whites at 14.1%, Coloureds at 1.1% and Asians at 0.8%. There was a decline in the total number of the<br />
economically active population from 339 296 in 2009 to 325 763in 2010. These represents 13 633 jobs<br />
lost. The male population accounted for 54.8% while females comprised of 45.2% of the economically<br />
active population.<br />
Sectoral Employment Figures in different Sectors of the Economy<br />
Total Employment Composition<br />
GP - DC42 <strong>Sedibeng</strong> <strong>District</strong> <strong>Municipality</strong>, 2009<br />
2%<br />
13%<br />
0%<br />
1 Agriculture<br />
24%<br />
2 Mining<br />
3 Manufacturing<br />
4 Electricity<br />
19%<br />
5 Construction<br />
1%<br />
7%<br />
6 Trade<br />
7 Transport<br />
8 Finance<br />
9 Community services<br />
Households<br />
12%<br />
5%<br />
17%<br />
Source: IHS Global Insight Regional eXplorer version 493<br />
(Source: Global Insight, 2010)<br />
The above diagram presents the total employment composition across all sectors of the economy within<br />
<strong>Sedibeng</strong>, showing the manufacturing sector as the largest contributor in terms of employment with<br />
24% and followed by the Community Services sector with 19%.<br />
Population of Unemployed People.<br />
Male Female Total<br />
Black 50 592 94.89% 60 090 95.84% 110 682 95.43%<br />
White 2 267 4.25% 2 256 3.59% 4 524 3.9%<br />
Coloured 289 0.54% 267 0.42% 557 0.48%<br />
Asian 134 0.25% 81 0.13% 215 0.19%<br />
Total 53 283 100.00% 62 694 100.00% 115 977 100.00%<br />
(Source: Global Insight, 2010)<br />
The above table shows unemployment by race and by gender in the <strong>Sedibeng</strong> <strong>District</strong>. The Black<br />
population accounts for 95.43% of the unemployed population with Black females recording the highest<br />
figures of unemployment in the <strong>District</strong> at 95.84%. The White population accounts for 3.9% of the<br />
unemployed, while Coloureds, Asians are at 0.48% and 0.19% respectively.<br />
Our Area, Our People, Our Institution and Service Delivery © <strong>Sedibeng</strong> <strong>District</strong> <strong>Municipality</strong> 2011/2012 IDP - All Rights Reserved Page|24
ANALYSIS 2011/12 CHAPTER 2<br />
SDM Unemployment Rate<br />
Unemployment rate, official definition (%)<br />
GP - DC42 <strong>Sedibeng</strong> <strong>District</strong> <strong>Municipality</strong>, Total - Total<br />
120,000<br />
40.0%<br />
100,000<br />
35.0%<br />
Number of unemployed people<br />
80,000<br />
60,000<br />
40,000<br />
30.0%<br />
25.0%<br />
20.0%<br />
15.0%<br />
10.0%<br />
Unemployment rate<br />
20,000<br />
5.0%<br />
0<br />
1996 1997 1998 1999 2000 2001 2002 2003 2004 2005 2006 2007 2008 2009<br />
0.0%<br />
Number of unemployed people<br />
Unemployment rate<br />
Source: IHS Global Insight Regional eXplorer version 493<br />
(Source: Global Insight, 2010)<br />
The above diagram shows labour force participation as well as unemployment rates in <strong>Sedibeng</strong>. There<br />
seems to be an increase in the labour force participation rate in the period 1996 to 2008. A similar trend<br />
can be observed with the unemployment rate in the period 1996 to 2002. Since then, the<br />
unemployment has been on the decline. A drastic decline was experienced in the period 2002 to 2004<br />
and in 2005 to 2008.<br />
Labour force overview<br />
Labour Overview, Total<br />
GP - DC42 <strong>Sedibeng</strong> <strong>District</strong> <strong>Municipality</strong><br />
70.0%<br />
60.0%<br />
50.0%<br />
40.0%<br />
30.0%<br />
20.0%<br />
10.0%<br />
0.0%<br />
1996 1997 1998 1999 2000 2001 2002 2003 2004 2005 2006 2007 2008<br />
Labour Force Participation Rate<br />
Unemployment rate (Official)<br />
(Source: Global Insight, 2010)<br />
Source: Global Insight Regional eXplorer version 421<br />
The numbering of “Labour Force” used by Statistics South Africa is “All persons of working age (15-65<br />
years) who are employed or unemployed”.’ Labour Market” on the other hand is defined as, “All those<br />
of working age (5-65 years) the employed, the unemployed and the not economically active”. In 2007,<br />
67.71% of the population in the <strong>District</strong> was between the ages of 15-65 (i.e. the labour market).<br />
However, only 44% of the population was located in the labour force, signalling a huge section of the<br />
workforce being located in the “not economically active-category.<br />
2.1.5 TOURISM<br />
The <strong>Sedibeng</strong> <strong>District</strong> <strong>Municipality</strong> has embarked on a major drive to promote and develop the Tourism<br />
industry in the <strong>District</strong> as part of the attempt to diversify the economy and promote new or<br />
underdeveloped sectors. Special emphasis is on the development of township tourism. The <strong>District</strong>with<br />
Our Area, Our People, Our Institution and Service Delivery © <strong>Sedibeng</strong> <strong>District</strong> <strong>Municipality</strong> 2011/2012 IDP - All Rights Reserved Page|25
ANALYSIS 2011/12 CHAPTER 2<br />
its diverse tourism offerings, embedded in rich cultural and natural heritage products, has the potential<br />
to grow into a major tourism destination. SDM has been classified as an area with above average<br />
tourism potential.<br />
The classification is based on the following:<br />
• Natural Resources<br />
• Cultural Heritage Resources<br />
• Scenic Attractions<br />
• Close proximity to Johannesburg and major travelling routes<br />
• Proximity to markets and airports<br />
• Strong infrastructure<br />
• Inland water resources<br />
• Tertiary Education Facilities<br />
• Quality medical facilities<br />
2.1.6.1 Tourism Promotion and Development<br />
A Tourism Development Strategy for the area was developed and adopted in 2003 and principles,<br />
programmes and projects were encapsulated in the <strong>Sedibeng</strong> Growth and Development Strategy (2004)<br />
and the <strong>Sedibeng</strong> 2010 Strategy (2007). The Tourism Strategies have the following goals namely:<br />
• Develop a common understanding of the tourism industry, defining the roles and responsibilities<br />
of government in particular and the broader stakeholder groups, in growing the Tourism<br />
Industry in <strong>Sedibeng</strong>.<br />
• Develop and formulate strategies to be implemented by each stakeholder group in relation to<br />
their respective roles taking the strengths and weaknesses of the <strong>Sedibeng</strong> Tourism Sector into<br />
consideration<br />
• Build the capacity of the three major stakeholder groupings (Government, Private Sector and<br />
Community) to grow tourism and subsequently create economic and job opportunities.<br />
Programmes to promote and develop tourism in the <strong>District</strong><br />
• Tourism product development<br />
• Tourism marketing and promotion (Website, Promotional material, Exhibitions)<br />
• Tourism institutional arrangements (Reviving of Local Tourism Associations, Establishment of a<br />
<strong>District</strong> Tourism Organization)<br />
• Training and Capacity building<br />
• SMME Support<br />
The Tourism Department has conducted an audit on the graded and non-graded accommodation<br />
facilities in the <strong>District</strong> and continues to audit other establishments as an ongoing process. Sixty-six (66)<br />
establishments have already been graded in the <strong>District</strong> and 115 establishments have been identified for<br />
grading. These establishments’ details have been submitted for grading. There is an approximately 3100<br />
beds in establishments, ranging from luxury to budget accommodation to offer to tourist coming to the<br />
<strong>District</strong>. Packages have been designed by stakeholders to ensure that the quality of leisure activities is of<br />
a high-standard for international tourists, but will also ensure that Local residents will also be able to<br />
take advantage of these offerings.<br />
Our Area, Our People, Our Institution and Service Delivery © <strong>Sedibeng</strong> <strong>District</strong> <strong>Municipality</strong> 2011/2012 IDP - All Rights Reserved Page|26
ANALYSIS 2011/12 CHAPTER 2<br />
2.1.6.2 Marketing and Exhibitions<br />
The Tourism Department is involved with many exhibitions and events on an annual basis. This platform<br />
is an excellent marketing tool to raise the tourism profile of the <strong>District</strong>. A Generic Tourism Brochure<br />
and profiling the tourism offerings in the <strong>District</strong> has been printed and distributed. A promotional<br />
tourism DVD is being developed in partnership with private sector as a destination marketing tool to<br />
promote the <strong>District</strong> as a collective.<br />
2.1.6.3 Capacity Building and Skills Development<br />
<strong>Sedibeng</strong> in partnership with the Department of Tourism, Tourism Enterprise Partnership, Gauteng<br />
Enterprise Propeller, Gauteng Tourism Authority and tertiary institutions are conducting skills<br />
development and tourism awareness workshops on a regular basis to emerging and established tourism<br />
establishments.<br />
2.1.6.4 Infrastructure, Signage and Routes Development<br />
The SDM has developed 11 Tour routes throughout the <strong>District</strong>. These include two Struggle Routes<br />
through Sharpeville, Boipatong, Evaton and Sebokeng. Two more routes are in the process of being<br />
developed. A total of 293 Tourism signs have been erected in the <strong>District</strong>.<br />
2.1.6.5 Institutional Arrangements<br />
Roles and responsibilities of Tourism Stakeholders (Public Sector, Private Sector and Communities) were<br />
defined in a process implementing the Gauteng Tourism Institutional Framework, which resulted in the<br />
establishment of an Interim Regional Tourism Association.<br />
The Interim Regional Tourism Association has the following objectives:<br />
• To assist the <strong>Sedibeng</strong> <strong>District</strong> <strong>Municipality</strong> in implementing the Gauteng Tourism Institutional<br />
Framework;<br />
• To provide a platform for all stakeholders in the tourism industry to provide their inputs<br />
regarding their needs and expectations;<br />
• To collate views and information in order to assist the <strong>Sedibeng</strong> <strong>District</strong> <strong>Municipality</strong> to make<br />
informed decisions regarding effective and optimal governance and management of the tourism<br />
industry in its area;<br />
• To encourage stakeholders to organise themselves and elect representatives of any particular<br />
sector within the industry;<br />
• To promote active participation of all stakeholders in the structures and systems that may be<br />
developed;<br />
• To serve as an interim Regional Tourism Association until a final municipal entity is established.<br />
Our Area, Our People, Our Institution and Service Delivery © <strong>Sedibeng</strong> <strong>District</strong> <strong>Municipality</strong> 2011/2012 IDP - All Rights Reserved Page|27
ANALYSIS 2011/12 CHAPTER 2<br />
2.2 OUR PEOPLE:<br />
Our <strong>District</strong> of <strong>Sedibeng</strong> is moderately populated. The statistics below and comparative analysis provide<br />
a base on which development within the municipality’s area of jurisdiction can be made. According to<br />
Global Insight 2010figures, the total population of <strong>Sedibeng</strong> 2010 is 805 168. According to Statistic SA<br />
Community Survey 2007, with its limitations, the total population of <strong>Sedibeng</strong> 800 819. The below<br />
figures provides us with and age breakdown of <strong>Sedibeng</strong> population, an age breakdown comparison<br />
with South Africa as well as the growth rate estimates.<br />
Population pyramid for sedibeng 2009<br />
Population Pyramid, Total, 2008<br />
GP - DC42 <strong>Sedibeng</strong> <strong>District</strong> <strong>Municipality</strong><br />
Male<br />
75+<br />
70-74<br />
65-69<br />
60-64<br />
55-59<br />
50-54<br />
45-49<br />
40-44<br />
35-39<br />
30-34<br />
25-29<br />
20-24<br />
15-19<br />
10-14<br />
05-09<br />
00-04<br />
Female<br />
50,000 40,000 30,000 20,000 10,000 0 10,000 20,000 30,000 40,000 50,000<br />
(Source: Global Insight, 2010)<br />
Source: Global Insight Regional eXplorer version 421<br />
The above graph presents the age breakdown of the <strong>Sedibeng</strong> population. It illustrates a typical<br />
developing region population pyramid with the dominance of people under the working age.<br />
Furthermore, it shows that there is a higher population between the ages 10 – 14 followed by 05 – 09.<br />
The smallest population is between the ages 70 – 74 followed by 75+. The population between ages 10 –<br />
14 share a significant distribution of males and females. This may indicate that the population in the<br />
<strong>Sedibeng</strong> <strong>District</strong> may have an equal distribution of males and females in the future.<br />
2.2.1 DISTRIBUTION OF POPULATION PER MUNICIPALITY SUB AREA<br />
Emfuleni Local <strong>Municipality</strong> represents 80.9% of the entire <strong>Sedibeng</strong> <strong>District</strong> <strong>Municipality</strong> population,<br />
which effectively means that more people reside in the Emfuleni. Although Emfuleni represents the<br />
largest population of SDM, it is Midvaal that has the biggest land area of 41.3% followed by Lesedi at<br />
35.6%. Areas that were previously dominated by whites are experiencing a change, witnessing more<br />
white people leaving the area and people from other races coming in to stay. The table below illustrates<br />
the population distribution by gender and population groups in <strong>Sedibeng</strong>.<br />
Distribution of Population per <strong>Municipality</strong><br />
<strong>Sedibeng</strong><br />
<strong>District</strong><br />
<strong>Municipality</strong><br />
Emfuleni Local<br />
<strong>Municipality</strong><br />
Midvaal Local<br />
<strong>Municipality</strong><br />
Lesedi Local<br />
<strong>Municipality</strong><br />
African<br />
Male 336,118 276,709 26,520 32,890<br />
Female 331,255 273,743 26,040 31,473<br />
White<br />
Male 59,603 42,934 11,642 5,027<br />
Female 60,302 44,102 11,073 5,126<br />
Coloured<br />
Male 5,007 3,713 652 641<br />
Female 5,176 3,924 673 578<br />
Asian<br />
Male 3,892 3,325 188 379<br />
Female 3,818 3,264 168 385<br />
Total 805,168 651,713 76,957 76,498<br />
(Source: Global Insight, 2010)<br />
Our Area, Our People, Our Institution and Service Delivery © <strong>Sedibeng</strong> <strong>District</strong> <strong>Municipality</strong> 2011/2012 IDP - All Rights Reserved Page|28
ANALYSIS 2011/12 CHAPTER 2<br />
<br />
Population Density<br />
Population Density is defined as the number of persons per square kilometres.<br />
<strong>Sedibeng</strong><br />
<strong>District</strong><br />
<strong>Municipality</strong><br />
Emfuleni Local<br />
<strong>Municipality</strong><br />
Midvaal Local<br />
<strong>Municipality</strong><br />
Black 159.48 568.86 30.41 43.23<br />
White 28.65 89.95 13.14 6.82<br />
Coloured 2.43 7.89 0.77 0.82<br />
Asian 1.84 6.81 0.21 0.51<br />
Total 192.40 673.51 44.52 51.39<br />
(Source: Global Insight, 2010)<br />
Lesedi Local<br />
<strong>Municipality</strong><br />
In <strong>Sedibeng</strong> the density levels were approximately 190 km 2 in 2001 and this increased to approximately<br />
192 km 2 in 2008. Population density levels in <strong>Sedibeng</strong> have settled to 91 km 2 between 2001 and 2008.<br />
2.2.2 URBANISATION<br />
<strong>Sedibeng</strong><br />
<strong>District</strong><br />
<strong>Municipality</strong><br />
Emfuleni Local<br />
<strong>Municipality</strong><br />
Midvaal Local<br />
<strong>Municipality</strong><br />
Black 89.6% 95.7% 40.5% 76.8%<br />
White 84.7% 91.1% 66.3% 71.5%<br />
Coloured 85.0% 95.9% 36.5% 67.6%<br />
Asian 92.1% 96.0% 89.0%<br />
Total 88.8% 95.1% 48.2% 76.0%<br />
(Source: Global Insight, 2010)<br />
Lesedi Local<br />
<strong>Municipality</strong><br />
The table above illustrate that Emfuleni has the highest number of people living in urban areas at 95.1%<br />
with Midvaal reflecting the lowest rate at 48.2%. <strong>Sedibeng</strong> urbanization figures have been declining<br />
from 93.6% in 2000, to 92.2% in 2007 and 88.8% in 2008.<br />
Number of household by population Groups<br />
<strong>Sedibeng</strong><br />
<strong>District</strong><br />
<strong>Municipality</strong><br />
Emfuleni Local<br />
<strong>Municipality</strong><br />
Midvaal Local<br />
<strong>Municipality</strong><br />
Black 201,047 160,992 22,565 17,489<br />
White 43,378 32,077 7,933 3,368<br />
Coloured 2,811 2,021 507 284<br />
Lesedi Local<br />
<strong>Municipality</strong><br />
Asian 2,033 1,754 98 181<br />
Total 249,269 196,844 31,102 21,323<br />
(Source: Global Insight, 2010)<br />
2.2.3 MIGRATION<br />
Growth in population is influenced through a triangulation of fertility (babies that are born), mortality<br />
(deaths) and migration (people moving in and out of the area). Migration plays an important role,<br />
especially in Gauteng, the largest recipient of in-migration in South Africa. Yet, unlike Gauteng as a<br />
whole <strong>Sedibeng</strong> is no longer a major recipient of new migrants and there are indications that young<br />
people are leaving the area to look for better work opportunities elsewhere in the Gauteng Province and<br />
the other Provinces.<br />
Historical patterns of migration into <strong>Sedibeng</strong> <strong>District</strong> came from Free State in the main, as the <strong>District</strong> is<br />
the first stop into Gauteng. Major migration into the <strong>District</strong> comes primarily from farm dwellers and<br />
poor people from rural areas, who migrate because of economic prospects of urban areas and all sorts<br />
Our Area, Our People, Our Institution and Service Delivery © <strong>Sedibeng</strong> <strong>District</strong> <strong>Municipality</strong> 2011/2012 IDP - All Rights Reserved Page|29
ANALYSIS 2011/12 CHAPTER 2<br />
of abuses in the farms, thus migrate to seek better opportunities, especially jobs, better wages,<br />
improved amenities and housing as well as security of tenure.<br />
The current trends of migration at present show that the majority of people coming to this <strong>District</strong> are<br />
students who come to study at institutions of higher education.<br />
The main attraction of young people into this area is to further their studies at North West University<br />
Vaal Campus, Vaal University of Technology, and <strong>Sedibeng</strong> College as well as other independent or<br />
private institutions.<br />
This influx of students migration into SDM has had a positive impact in the regional and provincial<br />
economy, since even the national trends indicate that after successful completion or even drop out of<br />
their studies, students hardly return to their respective homes but seek jobs in that area.<br />
2.2.4 HIV AND AIDS PREVALENCE<br />
Number of HIV Positive Individuals<br />
HIV+/AIDS profile<br />
GP - DC42 <strong>Sedibeng</strong> <strong>District</strong> <strong>Municipality</strong><br />
120,000<br />
8,000<br />
7,000<br />
100,000<br />
6,000<br />
80,000<br />
5,000<br />
HIV+<br />
60,000<br />
4,000<br />
AIDS<br />
3,000<br />
40,000<br />
2,000<br />
20,000<br />
1,000<br />
0<br />
0<br />
1996 1997 1998 1999 2000 2001 2002 2003 2004 2005 2006 2007 2008<br />
HIV+<br />
AIDS<br />
Source: Global Insight Regional eXplorer version 421<br />
(Source: Global Insight, 2010)<br />
The graph above shows a steady decline in the number of people living with HIV, between 2004 and<br />
2008 in <strong>Sedibeng</strong> <strong>District</strong>. According to Global Insight (2010), the number of HIV+ estimates is 86 481<br />
and AIDS related Deaths is 7 495. This is further attested by the National HIV and Syphilis Prevalence<br />
Survey Report for 2009, which shows that the <strong>Sedibeng</strong>’s HIV-prevalence rate has decrease from 31.8%<br />
2008to 28.9% in 2009. There is evidence that the overall HIV prevalence in Gauteng province has<br />
remained level from 2007 to 2009.<br />
The highest HIV prevalence of 34.0% was recorded in Ekurhuleni, followed by Metsweding with a<br />
prevalence of 33.3%. Ekurhuleni, West Rand and Metsweding <strong>District</strong>s have shown an HIV prevalence<br />
increase of 2.5%, 2.3% and 8.2% respectively. All the health <strong>District</strong>s in Gauteng recorded HIV<br />
prevalence above 25% among 15-49 year old women.<br />
The results illustrate the positive impact of various HIV and AIDS programmes the <strong>District</strong> launched and<br />
implemented in the past two to three years, including the ward-based approach to the mitigation of the<br />
socio-economic impacts of HIV&AIDS in the <strong>District</strong>. The <strong>District</strong> is convinced that with the continuing<br />
decline in the HIV-prevalence, over time the AIDS-related illnesses will also slow down, especially with<br />
the full-scale provision of the antiretroviral drugs.<br />
Our Area, Our People, Our Institution and Service Delivery © <strong>Sedibeng</strong> <strong>District</strong> <strong>Municipality</strong> 2011/2012 IDP - All Rights Reserved Page|30
ANALYSIS 2011/12 CHAPTER 2<br />
2.2.5 CRIME<br />
The crime statistics in the <strong>District</strong> has shown a steady decline, particularly between 2003 and 2007. This<br />
can be largely attributed to the CCTV and the CPF community patrollers in our townships.<br />
Graph showing Crime rate in the <strong>District</strong><br />
Crime Overview<br />
GP - DC42 <strong>Sedibeng</strong> <strong>District</strong> <strong>Municipality</strong><br />
400<br />
350<br />
300<br />
250<br />
200<br />
150<br />
100<br />
50<br />
0<br />
1996 1997 1998 1999 2000 2001 2002 2003 2004 2005 2006 2007<br />
Overall Violent Property<br />
Source: Global Insight Regional eXplorer version 421<br />
(Source: Global Insight, 2010)<br />
The graph above indicates that the crime rate in the <strong>District</strong> was high between 1997 and 2000. The<br />
analysis is specifically on the violent and business robberies.<br />
2.2.6 HUMAN DEVELOPMENT INDEX<br />
The Human Development Index (HDI) is a composite, relative index that attempts to quantify the extent<br />
of human development of a community. It is based on measures of life expectancy, literacy and income.<br />
It is thus seen as a measure of people’s ability to live a long and healthy life, to communicate, to<br />
participate in the life of the community and to have sufficient resources to obtain a decent living. The<br />
HDI assume a maximum level of 1, indicating a high level of human development, and a minimum value<br />
of 0, indicating no human development.<br />
Human Development Index<br />
<strong>Sedibeng</strong><br />
<strong>District</strong><br />
<strong>Municipality</strong><br />
Population<br />
group<br />
Emfuleni Local<br />
<strong>Municipality</strong><br />
Midvaal Local<br />
<strong>Municipality</strong><br />
African 0.52 0.53 0.45 0.47<br />
White 0.88 0.87 0.89 0.89<br />
Coloured 0.57 0.60 0.52 0.46<br />
0.75 0.75<br />
Total 0.60 0.60 0.63 0.56<br />
(Source: Global Insight, 2010)<br />
Lesedi Local<br />
<strong>Municipality</strong><br />
The Human development index table depicts the HDI composition by population group in the period<br />
2009-2010 for <strong>Sedibeng</strong> <strong>District</strong> and its Local municipalities. HDI levels for Whites are the highest at 0.88<br />
followed by Asians at 0.75, Coloureds at 0.6 and Blacks at 0.52. The overall development level of<br />
<strong>Sedibeng</strong> <strong>District</strong> has remained the same from 2009-2010 at 0.60.<br />
2.2.7 GINI COEFFICIENT<br />
The Gini coefficient is a summary statistic of income inequality, which varies from 0 (in the case of<br />
perfect equality where all households earn equal income) to 1 (in the case where one household earns<br />
Our Area, Our People, Our Institution and Service Delivery © <strong>Sedibeng</strong> <strong>District</strong> <strong>Municipality</strong> 2011/2012 IDP - All Rights Reserved Page|31
ANALYSIS 2011/12 CHAPTER 2<br />
all the income and other households earn nothing). In practice the coefficient is likely to vary from<br />
approximately 0, 25 to 0, 70.<br />
Population<br />
Group<br />
<strong>Sedibeng</strong><br />
<strong>District</strong><br />
<strong>Municipality</strong><br />
Emfuleni Local<br />
<strong>Municipality</strong><br />
Midvaal Local<br />
<strong>Municipality</strong><br />
African 0.58 0.57 0.53 0.64<br />
White 0.45 0.43 0.44 0.45<br />
Coloured 0.67 0.66 0.65<br />
Asian 0.53 0.53<br />
Total 0.66 0.63 0.72 0.70<br />
(Source: Global Insight, 2010)<br />
Lesedi Local<br />
<strong>Municipality</strong><br />
2.2.8 INCOME LEVELS<br />
The following section shows how many houses are in each of the predefined income categories, starting<br />
at the lowest income category R0 - R2 400 per annum up to R2 400 000 per annum and includes<br />
payments in kind from employers, old age pensions, income from informal sector activities, etc.<br />
Number of households by income category<br />
Income category African White Coloured Asian Total<br />
0-2400 1,032 0 94 0 1,126<br />
2400-6000 2,561 15 47 0 2,623<br />
6000-12000 19,820 64 751 34 20,670<br />
12000-18000 22,951 18 421 50 23,440<br />
18000-30000 32,072 42 260 102 32,477<br />
30000-42000 29,108 147 308 125 29,688<br />
42000-54000 21,673 203 191 100 22,167<br />
54000-72000 19,798 340 215 268 20,621<br />
72000-96000 16,367 1,987 163 301 18,818<br />
96000-132000 13,231 4,297 146 123 17,797<br />
132000-192000 10,733 5,926 119 284 17,061<br />
192000-360000 10,410 12,693 144 415 23,662<br />
360000-600000 3,872 8,675 43 176 12,766<br />
600000-1200000 1,467 5,775 43 109 7,394<br />
1200000-2400000 354 1,759 0 18 2,132<br />
2400000+ 56 377 0 1 435<br />
Total 205,507 42,317 2,944 2,107 252,876<br />
2.2.9 POVERTY<br />
Reducing poverty has become a major focus of development policy. To inform policy, research on<br />
poverty has focused on income or consumption based poverty measures. Yet it is now increasingly<br />
realized that poverty is multidimensional, encompassing all important human requirements. Poverty is<br />
now widely viewed in terms of capability deprivation.<br />
The income approach views poverty simply as lack of income (or consumption). Poverty exists when<br />
some persons in the society have so little income that they cannot satisfy socially defined basic needs.<br />
But lack of income is not the only kind of deprivation people may suffer. Indeed, people can suffer acute<br />
deprivation in many aspects of life, beyond those defined as basic needs, even if they possess adequate<br />
command over commodities (for example, ill health or lack of education and so on). The conceptual<br />
distinction between deprivation of this kind and that primarily resulting from inadequacy of income is of<br />
fundamental importance (Southern African Regional Poverty Network (SARPN)).<br />
Our Area, Our People, Our Institution and Service Delivery © <strong>Sedibeng</strong> <strong>District</strong> <strong>Municipality</strong> 2011/2012 IDP - All Rights Reserved Page|32
ANALYSIS 2011/12 CHAPTER 2<br />
The percentage of people living in poverty in <strong>Sedibeng</strong> is estimated at 37.5 %, with the coloured<br />
community constituting the highest percentage at 60.6%, followed by the black community at 43.9%.<br />
Whites have the lowest percentage of people living in poverty at 0.8%.<br />
Percentage of people in poverty<br />
Population<br />
Group<br />
<strong>Sedibeng</strong><br />
<strong>District</strong><br />
<strong>Municipality</strong><br />
Emfuleni Local<br />
<strong>Municipality</strong><br />
Midvaal Local<br />
<strong>Municipality</strong><br />
African 43.9% 42.7% 46.5% 52.8%<br />
White 0.8% 0.9% 0.7% 1.1%<br />
Coloured 61.6% 57.2% 66.2% 84.5%<br />
Asian 13.0% 12.9% 18.9% 11.3%<br />
Total 37.5% 37.0% 33.2% 46.0%<br />
(Source: Global Insight, 2010)<br />
Lesedi Local<br />
<strong>Municipality</strong><br />
2.2.10 Level of Education in the <strong>District</strong><br />
The level of education is measured only for persons aged 15 and above. In other words, one needs to be<br />
older than 15 before they can be classified into one of the listed education categories.<br />
Graph showing level of Education in the <strong>District</strong><br />
Progress in Education<br />
GP - DC42 <strong>Sedibeng</strong> <strong>District</strong> <strong>Municipality</strong>, Total<br />
180000<br />
160000<br />
140000<br />
120000<br />
100000<br />
No schooling<br />
80000<br />
Grade 0-2<br />
Grade 3-6<br />
60000<br />
Grade 7-9<br />
Grade 10-11<br />
Less than matric & certif/dip<br />
40000<br />
Matric only<br />
Matric & certificate / diploma<br />
Matric & Bachelors degree<br />
20000<br />
Matric & Postgrad degree<br />
0<br />
1996 1997 1998 1999 2000 2001 2002 2003 2004 2005 2006 2007 2008<br />
(Source: Global Insight, 2009)<br />
Source: Global Insight Regional eXplorer version 421<br />
Literacy Rate<br />
Functional literacy is defined as the proportion of persons aged 20 and above that has completed Grade<br />
seven (7). There is a 29% of non-attendance of school or other educational facilities in <strong>Sedibeng</strong>.<br />
Children are exposed to Early Childhood Development through the introduction of grade – R in most of<br />
the primary schools. Training is offered to the care-givers to address literacy – rate. The Department of<br />
Education is providing A.B.E.T in all its institutions.<br />
Population Group Illiterate Literate %<br />
African 107,266 320,157 74.9%<br />
White 3,270 86,471 96.4%<br />
Coloured 1,125 5,383 82.7%<br />
Asian 409 5,025 92.5%<br />
Total 112,071 417,036 78.8%<br />
(Source: Global Insight, 2009)<br />
Our Area, Our People, Our Institution and Service Delivery © <strong>Sedibeng</strong> <strong>District</strong> <strong>Municipality</strong> 2011/2012 IDP - All Rights Reserved Page|33
ANALYSIS 2011/12 CHAPTER 2<br />
2.2.11 Development Diamond<br />
The development diamond gives an overview of development in the <strong>District</strong> compared to the national<br />
total. Four variables; the Gini coefficient, HDI, percentage of people in poverty and the literacy rate are<br />
used to depict the overall development in the <strong>District</strong>.<br />
Human Development Diamond<br />
Total Development Diamond<br />
GP - DC42 <strong>Sedibeng</strong> <strong>District</strong> <strong>Municipality</strong>, 2008<br />
Gini<br />
70%<br />
60%<br />
South Africa<br />
50%<br />
GP - DC42 <strong>Sedibeng</strong> <strong>District</strong> <strong>Municipality</strong><br />
40%<br />
30%<br />
Worse<br />
20%<br />
10%<br />
Illiterate<br />
0%<br />
Better<br />
HDI (inverse)<br />
% in Poverty<br />
Source: Global Insight Regional eXplorer version 421<br />
The above-mentioned diagram is an illustration of Development Diamond in the <strong>District</strong> using four<br />
variables; (a) Gini coefficient, (b) Human Development Index (HDI), (c) percentage of people living in<br />
poverty and (d) the literacy rate.Gini coefficient is used to measure inequalities, and literacy rate is used<br />
to measure numeracy, reading, and writing abilities about people, whilst the poverty rate measurement<br />
use the definition of indigent policy. Human Development Index (HDI) measures access to education,<br />
provision of quality of education, including Early Child Development (ECD), and access to health.<br />
The optimum Gini co-efficient is zero, representing an absolute equality in society and the above<br />
illustration point to the fact that in <strong>Sedibeng</strong> <strong>District</strong> <strong>Municipality</strong>, our Gini- coefficient is about 68 %,<br />
which is 0.68. The four quadrants represent our variables be greater, extent of illiteracy, poverty,<br />
underdevelopment inequality. The diagram indicates the SDM level of illiteracy, percentage of poverty,<br />
underdevelopment and inequalities are better than the national averages in all variables. Therefore, the<br />
larger Development diamond, the less developed the <strong>District</strong>. The smaller (close to the center) the more<br />
developed the <strong>District</strong> is considered to be.<br />
Our Area, Our People, Our Institution and Service Delivery © <strong>Sedibeng</strong> <strong>District</strong> <strong>Municipality</strong> 2011/2012 IDP - All Rights Reserved Page|34
ANALYSIS 2011/12 CHAPTER 2<br />
2.3 OUR INSTITUTION:<br />
2.3.1 Political Overview<br />
Council, with its elected political representatives, represents the highest political decision making body<br />
in the institution. The Executive Mayor, together with the members of the Mayoral Committee, has<br />
direct political oversight over policy implementation, decision implementation and the various parts of<br />
the administration. These structures have been fully functional and have convened regularly, have<br />
always had a quorum and been exemplary in procedure and process. Their work has been consolidated<br />
by the PMT (Political Management Team) which comprises the Executive Mayor, the Speaker and the<br />
Chief Whip. By invitation on specific matters, the Municipal Manager is invited to the PMT.<br />
The nature of reports tabled the PMT indicates a will for strong political control, intervention and<br />
oversight. The political representatives have translated political will into reports, programmes and<br />
events which serves to give expression to political mandates. The communities remain the single most<br />
important beneficiaries of all these efforts, and therefore it is important to reflect on the actual<br />
experiences in interaction with communities. Three areas are worth mentioning; Izimbizo, Stakeholder<br />
Relations and Public Protests.<br />
2.3.1.1 Izimbizo<br />
Direct public engagements with communities have seen transacted on a direct basis through public<br />
Izimbizo. These have on all occasions been very well attended. They have been vibrant and open and<br />
often marked by robust expressions of community needs and demands. These events have been orderly<br />
and procedural. Despite the lack of distinction between the role of a local council and a district council,<br />
inputs made at these Izimbizo have been very useful to <strong>Sedibeng</strong> <strong>District</strong> <strong>Municipality</strong> for purposes of<br />
measuring community needs, community dissatisfaction, and on occasion community appreciation<br />
when delivery has taken place. Greater administrative processing of all inputs, its dissemination to locals<br />
if applicable, subsequent actions and report backs on progress needs to be further refined.<br />
2.3.1.2 Stakeholder Relations<br />
Stakeholder engagements are organised, but the lack of consistency in stakeholder engagements often<br />
leads to engagements, which take place mostly, during IDP consultations being undermined. During the<br />
IDP process there is a sense of engagement for the purposes of compliance, rather than a sense of<br />
engagements to meaningfully engage to solicit views and help develop sectors. One of the reasons for a<br />
lack of strong, systematic and coordinated engagements relates to the stakeholder database at<br />
<strong>Sedibeng</strong>.<br />
The stakeholder database in the municipality is fragmented. It is structured according to respective<br />
directorates and therefore managed separately. There is a need for a consolidated database, held within<br />
a database program (such as MS Access), that can generate significant reporting and analysis of trends<br />
and communication with stakeholders.<br />
The public participation Summit that was convened is a step in the right direction towards achieving<br />
democratic, developmental governance at a <strong>District</strong> level.<br />
Our Area, Our People, Our Institution and Service Delivery © <strong>Sedibeng</strong> <strong>District</strong> <strong>Municipality</strong> 2011/2012 IDP - All Rights Reserved Page|35
ANALYSIS 2011/12 CHAPTER 2<br />
The Public Participation Summit deliberated extensively on the following matters:<br />
• Solidify social cohesion<br />
• Developmental aspects of Public Participation<br />
• Governance approach to Public Participation<br />
• Two-tier system of Public Participation<br />
Implementation of the outcomes of the Summit will go a long way in addressing some of the challenges<br />
facing this area of political interphase.<br />
2.3.1.3 Public Protest<br />
In recent years there has been a sporadic eruption of service delivery unrests in South Africa. <strong>Sedibeng</strong><br />
<strong>District</strong> has not been immune to these public unrests (e.g. Ratanda, Sebokeng, Sharpeville, Midvaal,<br />
Rust-ter-vaal, and Evaton). These 'service delivery' protests are occurring despite government’s<br />
response to service delivery as part of its endeavor to improve the lives of the people. In total the<br />
<strong>District</strong> received six (6) and four (4) petitions during 2008/09 and 2009/10 financial year respectively.<br />
Some of the petitions were originating from individuals, others groups and even political parties for that<br />
matter. From the above, three (3) were delivered via a march, and the rest were hand delivered. The<br />
following are some of the primary issues of concern raised:<br />
• The needs of youth and people with disability empowerment,<br />
• Unlawful Evictions<br />
• Payment for water and electricity difficulties,<br />
• Lack of constructive stakeholder engagements,<br />
• Exorbitant billing problems,<br />
• Scrapping of arrears,<br />
• Refuse removals,<br />
• Lack of quality houses and roads construction,<br />
• Lifting of moratorium on land,<br />
• Allegations of corruption, tender irregularities and<br />
• Lack of compliance to environmental laws across the <strong>District</strong>.<br />
The issues noted above reflect that most of the issues raised, are relevant to the Local municipalities of<br />
<strong>Sedibeng</strong> and not the <strong>District</strong>. Communities however, do not make any distinction when organising<br />
protest actions. In ensuring responsive and accountable governance, the Petition Management<br />
Committee in conjunction with the affected Local municipalities was prompt on its investigations and<br />
deliberations. Petitions management in <strong>Sedibeng</strong> is misaligned between the <strong>District</strong> and the Local<br />
municipalities and requires better coordination.<br />
Hard evidence exists to show that in some instances, these protest have not been motivated by issues<br />
other than service delivery. The construction sector is also mobilizing itself in challenging the utilization<br />
of Local contractors in infrastructure development projects. This comes as a result of growing concerns<br />
that Local businesses do not benefit from infrastructure development projects initiated by government<br />
in the <strong>District</strong>. The manner in which government executes its capital projects, sometimes with the<br />
councillors at the epicentre of the project implementation in the wards, results in councillors more than<br />
often at odds with the communities, political organizations as well as the civic movement.<br />
Our Area, Our People, Our Institution and Service Delivery © <strong>Sedibeng</strong> <strong>District</strong> <strong>Municipality</strong> 2011/2012 IDP - All Rights Reserved Page|36
ANALYSIS 2011/12 CHAPTER 2<br />
Governance is one that every municipality strives to improve and refine constantly. Most of the<br />
structures and systems of the <strong>Municipality</strong> have been functional. The Section 80 Committees, the<br />
Mayoral Committee, the PMT, Council meetings, as well as administrative committees such as the<br />
Management Committee (MANCO), Bid Adjudication Committee, Budget Panel, IDP Steering Committee<br />
etc. Areas that can be improved include oversight, supervision, and support intervention structures.<br />
Ward committees (managed by Local municipalities) are functioning inconsistently and communities are<br />
not receiving timeous and adequate feedback. Stronger interface between chapter 9 institutions and<br />
Local government structures should also be encouraged. Some Section 79 Committees are not<br />
functioning optimally; the MPAC and Petition Management Committees have stepped up their oversight<br />
and accountability, and are set to have greater impact on accountability and oversight. The council in<br />
enhancing its stakeholder engagements with regard to oversight and accountability mechanisms of<br />
section 79 committees have identified the following challenges:<br />
There is a misalignment of petition policies and procedures between the <strong>District</strong> and its Locals. Lack of<br />
civic education and training, particularly with regard to the structures, policies, procedures and<br />
processes in ensuring a constructive engagement with the civil organisations, community based<br />
organization and the community at large. Low level of information dissemination with regard to the<br />
work of council committees<br />
A positive development was the launch of a Multiparty Women Caucus during 2010. This platform is to<br />
serve as a key vehicle in fast tracking women empowerment and an advisory and consultative body for<br />
the interests and concerns of women in the <strong>District</strong>. The Multiparty Women Caucus is directly linking<br />
with women based structures in the form of interface e.g. Progressive Women Movement of South<br />
Africa (PWMSA).<br />
There are intergovernmental structures in place where the political management team consisting of the<br />
Speaker, the Executive Mayor and the Chief Whip are part of as a means of strengthening the<br />
relationship between the <strong>District</strong> and the Local municipalities as well as with the province. The<br />
interaction with Local municipalities is not getting sufficient support from the <strong>District</strong>. An example of<br />
this that, while it is known that Local municipalities are struggling with ward committees, very little<br />
support is provided from the <strong>District</strong> in this regard. Furthermore national government has identified the<br />
need for the establishment of street committees, but up to thus far nothing was done at the level of the<br />
<strong>District</strong> to support the Local municipalities in that respect. Community based planning is another<br />
programme that was identified and equally little has been done, except for the joint strategic<br />
discussions that ensued between the <strong>District</strong> municipality and the Local municipalities.<br />
Oversight over the administration can be improved, particularly with regard to monitoring and<br />
evaluation, and resolutions tracking. The caucus of the ruling party has increased its political oversight in<br />
this regard. A daunting task is the lack of clear separation of powers between the council (legislative)<br />
and the executive, as well as the role clarification and delegations within the council. According to the<br />
Turn-around strategy on Local government, indications are that the following elements require vigorous<br />
attention (SA, 2009).<br />
• Ensure that municipalities meet the basic service needs of communities,<br />
• Build a clean, effective, efficient, responsive and accountable Local government,<br />
• Improved performance and professionalism in municipalities<br />
• Improved national and provincial policy, oversight and support<br />
• Strengthen partnerships between communities, civil society and Local government<br />
Our Area, Our People, Our Institution and Service Delivery © <strong>Sedibeng</strong> <strong>District</strong> <strong>Municipality</strong> 2011/2012 IDP - All Rights Reserved Page|37
ANALYSIS 2011/12 CHAPTER 2<br />
2.3.2 Institutional Development and Transformation<br />
The <strong>Sedibeng</strong> <strong>District</strong> <strong>Municipality</strong> was born out of the new system of Local government, which came<br />
into being between 1998 and 2000 when the Parliament of South Africa enacted a number of statutes<br />
which entirely transformed the systems, institutions and processes of Local government. For the<br />
majority of the population this was a dawn of a new era in which Local government included their voice<br />
and inputs in government activities for the first time. <strong>Sedibeng</strong> <strong>District</strong> <strong>Municipality</strong> arose out of the<br />
evolution of the former Regional Services Council and the former Lekoa-Vaal Metro Council. 2011 marks<br />
a significant year in the genesis of <strong>District</strong> Municipalities with significant debates about the future of<br />
<strong>District</strong> Municipalities.<br />
Back in 1994, government put in place a vision of municipal structures that would be both democratic<br />
and developmental, and which would aim to fulfill government’s constitutional mandates. The<br />
government transformed the entire systems, institutions and processes of Local government. This was<br />
to enable this sphere of government, closest to the communities which were previously disadvantaged;<br />
to have easy access to services as a whole and to have people oriented administrative structures and<br />
political office bearers.<br />
While addressing the vast service delivery challenges and backlogs created by the legacy of the past, the<br />
new municipal structures also had to face the challenges posed by rapid urbanization and in-migration<br />
unleashed by the collapse of the apartheid’s vision of spatial segregation and the increasing<br />
expectations for a better life for all South Africans.<br />
Government had to bring about new establishments, organizational structures and organizational<br />
designs which will have capacity to deliver municipal services and all delegated responsibilities as well as<br />
continuously build capacity to deliver.<br />
On the basis of empirical studies on Local government’s achievements and challenges, institutional<br />
development and transformation are identified as strategic challenges that municipalities have to<br />
address now and in the future. <strong>Municipality</strong>’s performance will be assessed on the basis of institutional<br />
development and transformation during this period until towards the 2011 Local government elections.<br />
Performance Management Systems (PMS) for the institution and staff need to be aligned to the<br />
strategic objectives of the organization as this will also form part of the assessment of each municipality.<br />
2.3.3 The Legislative Framework<br />
A number of statutes were enacted by Parliament between 1998 and 2003 to transform Local<br />
government, amongst these were the Municipal Structures Act (1998), the Municipal Demarcation Act<br />
(1998), the Municipal Systems Act (2000), the Local Government Elections Act (2000) and the Municipal<br />
Finance Management Act (2003) which also redefined the financial framework for municipal operations.<br />
2.3.4 Capacity Issues<br />
Local government structures had to expand their capacity to deliver a range of social services and<br />
decentralized functions from other spheres of government. This resulted in the need to recreate and<br />
develop structures, capacity and policy frameworks that will ensure achievement of objectives and<br />
mandates set out by the legislative frameworks and decentralization of functions.<br />
The targets set by the national government are cascaded to municipalities with an expectation to meet<br />
these targets and deliver services to all citizens. However there are sometimes challenges faced by<br />
municipalities with regard to implementation due to gaps between the skills required to perform and<br />
the existing capacity of these municipalities.<br />
Our Area, Our People, Our Institution and Service Delivery © <strong>Sedibeng</strong> <strong>District</strong> <strong>Municipality</strong> 2011/2012 IDP - All Rights Reserved Page|38
ANALYSIS 2011/12 CHAPTER 2<br />
The SDM has successfully achieved and managed to overcome a challenge of restructuring the<br />
organisation, then the process was concluded in 2008 and the new organogram was adopted and<br />
approved by Council. The organizational structure was amended to ensure effective service delivery as<br />
well as accommodate new functions that he municipality is expected to perform in line with the<br />
implementation of the Growth and Development Strategy (GDS) as well as flagship projects such as the<br />
Vaal 21 and Precincts development. The alignment of the IDP and the GDS is an important aspect to<br />
ensure growth of SDM’s Local economy and establishment of the <strong>District</strong>’s competitive edge. More<br />
resources need to be invested in this endeavour.<br />
2.3.5 Staffing Establishment<br />
<strong>Sedibeng</strong> <strong>District</strong> <strong>Municipality</strong> staff establishment currently comprises of 913 employees, councillors and<br />
appointed Community members serving on ad hoc committees which were established due to the<br />
transformation and the restructuring process of Council in order to effectively and efficiently achieve<br />
strategic objectives, thereby providing required service delivery.<br />
The table below depicts <strong>Sedibeng</strong> [Staff Growth] inclusive of Councillors from 1999 to June 2010<br />
1600<br />
1400<br />
1200<br />
1000<br />
800<br />
600<br />
400<br />
200<br />
0<br />
1420 1481 1361<br />
871 908<br />
763<br />
632 651 656 685<br />
426<br />
296<br />
1999 2000 2001 2002 2003 2004 2005 2006 2007 2008 2009 2010<br />
Between 1999 and 2001, the functions of the Lekoa Vaal Metropolitan Council, included Health Services<br />
traffic, security, vehicle licensing, libraries and fire and Emergency Medical Services (EMS) which were<br />
devolved to the local municipalities on their establishment in 2002. In 2004, EMS and Licensing were<br />
transferred back to SDM. The staff growth from 2004 occurred as a result of organizational redesign.<br />
2.3.5.1 Composition of the staff establishment<br />
The staffing establishment of the <strong>Municipality</strong> consists of officials appointed, on full time basis in terms<br />
of the Conditions of Employment negotiated at SALGBC, fixed term contract employees appointed on<br />
conditions of employment negotiated at the workplace and those appointed in terms of the Municipal<br />
Systems Act 32 of 2000.<br />
Our Area, Our People, Our Institution and Service Delivery © <strong>Sedibeng</strong> <strong>District</strong> <strong>Municipality</strong> 2011/2012 IDP - All Rights Reserved Page|39
ANALYSIS 2011/12 CHAPTER 2<br />
Out of the total staff establishment of the <strong>Municipality</strong> the table below depicts the number of full time<br />
employees.<br />
SDM FULL TIME EMPLOYEES AS AT 31 JANUARY 2011<br />
Current Profile by<br />
Occupational<br />
Levels<br />
MALE<br />
African<br />
Coloured<br />
Indian<br />
White<br />
T D/Male<br />
FEMALE<br />
African<br />
Coloured<br />
Indian<br />
White<br />
T Female<br />
Foreign<br />
Nationals<br />
Male<br />
Female<br />
TOTAL<br />
Full time<br />
employees<br />
TOTAL<br />
PERMANENT<br />
Non – permanent<br />
employees<br />
386 8 9 40 401 344 6 8 32 390 0 0 831<br />
386 8 9 40 401 344 6 8 32 390 0 0 831<br />
0 0 0 0 0 0 0 0 0 0 0 0 0<br />
GRAND TOTAL 386 8 9 40 401 344 6 8 32 390 0 0 831<br />
Disabilities(Includ<br />
ed in the Grand<br />
Total)<br />
4 0 0 2 4 2 0 0 3 5 0 0 11<br />
2.3.5.2 Fixed term contract employees<br />
These are employees appointed on fixed term contracts of employment at the discretion of the<br />
<strong>Municipality</strong><br />
SDM FIXED TERM CONTRACT EMPLOYEES AS AT 31 JANUARY 2011<br />
Current Profile by<br />
Occupational<br />
Levels<br />
MALE<br />
African<br />
Coloured<br />
Indian<br />
White<br />
T D/Male<br />
FEMALE<br />
African<br />
Coloured<br />
Indian<br />
White<br />
T Female<br />
Foreign<br />
Nationals<br />
Male<br />
Female<br />
TOTAL<br />
Fixed term<br />
contracts<br />
TOTAL<br />
PERMANENT<br />
Non – permanent<br />
employees<br />
15 1 0 0 16 3 1 0 0 4 0 0 20<br />
15 1 0 0 16 3 1 0 0 4 0 0 20<br />
0 0 0 0 0 0 0 0 0 0 0 0 0<br />
GRAND TOTAL 15 1 0 0 16 3 1 0 0 4 0 0 20<br />
Disabilities 0 0 0 0 0 0 0 0 0 0 0 0 0<br />
2.3.5.3 Fixed term contract employees<br />
In terms of the Municipal Systems Act 32 of 2000, the Municipal Manager and Managers reporting<br />
directly to him must be appointed on regulated term contracts of appointment.<br />
Our Area, Our People, Our Institution and Service Delivery © <strong>Sedibeng</strong> <strong>District</strong> <strong>Municipality</strong> 2011/2012 IDP - All Rights Reserved Page|40
ANALYSIS 2011/12 CHAPTER 2<br />
The matrix reflected below indicates all the employees appointed in terms of the Municipal Systems Act<br />
46 of 2000<br />
SDM FIXED TERM (SECTION 57) EMPLOYEES AS AT 31 JANUARY 2011<br />
Current Profile by<br />
Occupational<br />
Levels<br />
MALE<br />
African<br />
Coloured<br />
Indian<br />
White<br />
T D/Male<br />
FEMALE<br />
African<br />
Coloured<br />
Indian<br />
White<br />
T Female<br />
Foreign<br />
Nationals<br />
Male<br />
Female<br />
TOTAL<br />
SECTION 57 EMPL 4 1 1 0 6 1 0 0 0 1 0 0 7<br />
TOTAL<br />
PERMANENT<br />
Non – permanent<br />
employees<br />
4 1 1 0 6 1 0 0 0 1 0 0 7<br />
0 0 0 0 0 0 0 0 0 0 0 0 0<br />
GRAND TOTAL 4 1 1 0 6 1 0 0 0 1 0 0 7<br />
Disabilities 0 0 0 0 0 0 0 0 0 0 0 0 0<br />
2.3.5.4 Councillors<br />
The (913) staff establishment compliment includes 43 councillors (as at March 2011).<br />
The table below depicts the composition of the Municipal Council.<br />
SDM COUNCILLORS AS AT 31 JANUARY 2011<br />
Current Profile by<br />
Occupational<br />
Levels<br />
MALE<br />
African<br />
Coloured<br />
Indian<br />
White<br />
T D/Male<br />
FEMALE<br />
African<br />
Coloured<br />
Indian<br />
White<br />
T Female<br />
Foreign<br />
Nationals<br />
Male<br />
Female<br />
TOTAL<br />
Councillors 16 0 0 7 16 16 1 1 2 20 0 0 43<br />
GRAND TOTAL 16 0 0 7 16 16 1 1 2 20 0 0 43<br />
Disabilities(Include<br />
d in the Grand<br />
Total)<br />
0 0 0 0 0 0 0 0 1 1 0 0 1<br />
• Ad hoc Committee Members<br />
In terms of the Municipal Structures Act 117 of 1998 every <strong>Municipality</strong> must appoint, through<br />
the public process of advertising from among the communities, persons who have the<br />
capabilities to serve on the Bursary and Audit Committees.<br />
Our Area, Our People, Our Institution and Service Delivery © <strong>Sedibeng</strong> <strong>District</strong> <strong>Municipality</strong> 2011/2012 IDP - All Rights Reserved Page|41
ANALYSIS 2011/12 CHAPTER 2<br />
For the current financial year the composition of the both bursary and audit committees is as shown<br />
below.<br />
SDM AUDIT COMMITTEE MEMBERS AS AT 31 JANUARY 2011<br />
MALE<br />
FEMALE<br />
Foreign<br />
Nationals<br />
African<br />
Coloured<br />
Indian<br />
White<br />
T D/Male<br />
African<br />
Coloured<br />
Indian<br />
White<br />
T Female<br />
Male<br />
Female<br />
TOTAL<br />
Audit Committee 2 0 1 0 3 2 0 0 0 2 0 0 5<br />
GRAND TOTAL 2 0 1 0 3 2 0 0 0 2 0 0 5<br />
SDM BURSARY MEMBERS AS AT 31 JANUARY 2011<br />
Current Profile by<br />
Occupational<br />
Levels<br />
MALE<br />
African<br />
Coloured<br />
Indian<br />
White<br />
T D/Male<br />
FEMALE<br />
African<br />
Coloured<br />
Indian<br />
White<br />
T Female<br />
Foreign<br />
Nationals<br />
Male<br />
Female<br />
TOTAL<br />
Bursary<br />
Committee<br />
3 1 0 0 4 3 0 0 0 3 0 0 7<br />
GRAND TOTAL 3 1 0 0 4 3 0 0 0 3 0 0 7<br />
2.3.6 Institutional Arrangement<br />
In order to achieve the required levels of service delivery both the human and non-human capital have<br />
been synergised. The resultant human capital allocation is depicted in the table below.<br />
Clusters<br />
Staff compliment<br />
Office of the Speaker 09<br />
Office of the Executive Mayor 10<br />
Office of the Chief Whip 06<br />
Municipal Manager’s Office 08<br />
Corporate Services 263<br />
Treasury 32<br />
Community Services 309<br />
Strategic Planning & Economic Development 44<br />
Transport Infrastructure & Environment 177<br />
Total 858<br />
2.3.7 Employment Equity Plan<br />
This section serves to indicate current employee population by level, race and gender within the<br />
municipalities.<br />
Our Area, Our People, Our Institution and Service Delivery © <strong>Sedibeng</strong> <strong>District</strong> <strong>Municipality</strong> 2011/2012 IDP - All Rights Reserved Page|42
ANALYSIS 2011/12 CHAPTER 2<br />
Employee population by level, race and gender within the municipality.<br />
Current Profile by<br />
Occupational Levels<br />
MALE<br />
African<br />
Coloured<br />
Indian<br />
White<br />
T D/Male<br />
FEMALE<br />
African<br />
Coloured<br />
Indian<br />
White<br />
T Female<br />
Foreign<br />
Nationals<br />
Male<br />
Female<br />
TOTAL<br />
Top Management 20 3 1 2 24 5 0 0 0 5 0 0 31<br />
Senior management 36 0 2 11 38 12 1 2 4 19 0 0 68<br />
Professional/specialists/Mid<br />
Management<br />
Skilled Tech/Academic<br />
qualified/Jnr<br />
managers/Supervisors/Fore<br />
men<br />
91 1 2 22 94 61 2 4 17 84 0 0 200<br />
169 5 2 5 176 193 4 0 11 208 0 0 389<br />
Semi-skilled 8 0 0 0 8 15 0 2 0 17 0 0 25<br />
Unskilled 81 1 1 0 83 62 0 0 0 62 0 0 145<br />
TOTAL PERMANENT 405 10 8 40 423 348 7 8 32 395 0 0 858<br />
Non – permanent employees 0 0 0 0 0 0 0 0 0 0 0 0 0<br />
GRAND TOTAL 405 10 8 40 423 348 7 8 32 395 0 0 858<br />
Disabilities (Included in the<br />
Grand Total)<br />
2.3.8 Human Resources Strategy<br />
4 0 0 2 4 2 0 0 3 5 0 0 11<br />
The Human Resources Strategy assists the <strong>Municipality</strong> to retain staff within its ranks, attract suitable<br />
staff and better manage the workplace employer / employees relationship.<br />
In order to enhance its Human Resources Strategy, the Council has during the period under review,<br />
approved the following policies:<br />
• Termination of service<br />
• Absenteeism<br />
• Recruitment and selection (reviewed)<br />
• Performance Management and Development System<br />
• Disciplinary and Grievance Procedures (reviewed)<br />
2.3.8.1 Human Resources Development<br />
Currently capacity building and empowerment do not sufficiently respond to the complexities of Local<br />
government as the coalface of service delivery to the people.<br />
Both councillors and officials’ capacity building and empowerment require much more attention for the<br />
municipality to operate more effectively and efficiently. The <strong>Municipality</strong> as a learning organisation also<br />
values its Human capital and to that effect therefore employs a range of strategic interventions geared<br />
towards the development of the skills and competencies of both councillors and officials.<br />
Our Area, Our People, Our Institution and Service Delivery © <strong>Sedibeng</strong> <strong>District</strong> <strong>Municipality</strong> 2011/2012 IDP - All Rights Reserved Page|43
ANALYSIS 2011/12 CHAPTER 2<br />
2.3.8.2 Training and Development<br />
In line with the Workplace Skills Programme deriving from the Personal Development Plans, the<br />
following were undertaken:<br />
• Labour Relations oriented training for Shop stewards and Senior Management, i.e. disciplinary<br />
procedure.<br />
• Training on administrative support systems, i.e. computer literacy, records and financial<br />
management, Career Development, Coaching and Motivational Skills, Examiner of Driving<br />
Licenses and Events Management<br />
2.3.9 Occupational Health and Safety<br />
The health and safety of councillors and officials though critical, the institution focused more on the<br />
employees than on councilors, despite the fact that councillors also are part of the workplace<br />
environment. The policy was adopted by Council in October 2010 which detailed roles and<br />
responsibilities of various stakeholders in protecting people (staff and clients).<br />
Fifteen disabling incidents were recorded, the two of which were fatal and had external sources as<br />
cause.<br />
SDM INJURIES AND DISEASES AS AT 04 FEBRUARY 2011<br />
Current Profile<br />
by Occupational<br />
Levels<br />
MALE<br />
African<br />
Coloured<br />
Indian<br />
White<br />
T D/Male<br />
FEMALE<br />
African<br />
Coloured<br />
Indian<br />
White<br />
T Female<br />
Foreign<br />
Nationals<br />
Male<br />
Female<br />
TOTAL<br />
Non fatal 7 0 0 1 7 5 0 0 0 5 0 0 13<br />
Fatal 0 1 0 0 1 1 0 0 0 1 0 0 2<br />
TOTAL<br />
PERMANENT<br />
7 1 0 1 8 6 0 0 0 6 0 0 15<br />
GRAND TOTAL 7 1 0 1 8 6 0 0 0 6 0 0 15<br />
Disabilities 0 0 0 0 0 0 0 0 0 0 0 0 0<br />
2.3.10 Employee Assistance Programme<br />
In pursuance of implementing an effective Employee Assistance Programme (EAP) including HIV and<br />
AIDS workplace programme and support to employees and councillors on financial planning, for the<br />
period under review the following were attained:<br />
• Training of Peer Educators (HIV &AIDS)<br />
• Recognition of annual national days, i.e. World Aids Days concomitant with distribution<br />
of awareness and preventative material<br />
• Counseling (inclusive debriefing, clinical) in times of need, e.g. reported injury, death<br />
and stressful incidents including sexual harassment.<br />
• Coordination of Lifestyle Improvement Programmes<br />
Officials and councilors are dealing with personal issues such as mental illness, family problems financial<br />
challenges, health related or substance abuse; often result in a drop in productivity. Currently not much<br />
Our Area, Our People, Our Institution and Service Delivery © <strong>Sedibeng</strong> <strong>District</strong> <strong>Municipality</strong> 2011/2012 IDP - All Rights Reserved Page|44
ANALYSIS 2011/12 CHAPTER 2<br />
is done to address bio-psycho social factors in the work environment for both councilors and officials<br />
with regard to a powerful and effective therapeutic approach.<br />
2.3.11 Performance Management and Development System<br />
Since the conversion of the manual PMDS into an electronic version SDM has successfully migrated all<br />
staff performance information on the various fields on the web based version of the electronic PMDS<br />
system. After the procurement and installation of the SQL server for the new electronic PMDS system it<br />
will then be commissioned.<br />
• Completion of Performance Agreements and Plans for Municipal Manager, Executive Directors,<br />
Directors and Managers.<br />
• Completion of Performance Agreements and plans for all staff<br />
• Presentation of electronic PMDS on performance agreement, plans, PDP’s and reviews<br />
• Uploading of individual performance into the electronic performance management and<br />
development system (ePMDS)<br />
2.3.12 Work Study and Quality Assurance<br />
The <strong>Sedibeng</strong> <strong>District</strong> <strong>Municipality</strong> is continually researching processes by means of which it can improve<br />
service delivery processes in order to achieve this all important imperative it was then resolved, in the<br />
early part of the period under review to establish a division that will ensure:<br />
• Implementation of total Quality concepts, theories on Management practises.<br />
• Organizational development/ restructure the organisation.<br />
• Ongoing support for staff development and improvement on work methods and processes.<br />
• Continuous assessment and evaluation of Job Descriptions aligned to Council Strategy.<br />
In the short space of time within which the division has been conceived the following milestones have<br />
been achieved:<br />
• Researching and aligning Human Resources Policies to best practises within the sector.<br />
• Concept Standard Operating Procedures.<br />
• Assisting and advising Departments on Compilation of Job Descriptions in the TASK format<br />
2.3.13 Batho-Pele<br />
During the second part of the reporting period, the Batho Pele functionary and support staff have been<br />
appointed which is indicative of the firm stance the <strong>Municipality</strong> has taken to ensure that the all<br />
important Principles, Values and Norms that underpins Batho Pele “Putting People First” are entrenched<br />
and inculcated within the <strong>Sedibeng</strong> <strong>District</strong> <strong>Municipality</strong> workplace. In addition, to ensure community<br />
members are made conscious about the Municipal Service Rights.<br />
2.3.14 Labour Relations<br />
Despite the volatile workplace environment besetting most industries in the Country the <strong>Sedibeng</strong><br />
<strong>District</strong> <strong>Municipality</strong> managed its workplace relationships such that no major disruptive incidents<br />
occurred. The Local Labour Forum (LLF) meets on a scheduled basis.<br />
Our Area, Our People, Our Institution and Service Delivery © <strong>Sedibeng</strong> <strong>District</strong> <strong>Municipality</strong> 2011/2012 IDP - All Rights Reserved Page|45
ANALYSIS 2011/12 CHAPTER 2<br />
2.3.15 Staff Containment and Retention Strategy<br />
The Corporate Services Department is continuously refining and developing policies for the<br />
development of our human capital. Of the numerous policies being developed, two strategy / policies<br />
will require considerable efforts in the next financial year. These are a strategy on containing the cost of<br />
personnel and staff retention where skills are in short supply. Both these will require proper<br />
consultations with all stakeholders, and organised labour in particular. The issues listed below as<br />
possible components of the strategies, are all listed as possible areas of application, the feasibility of<br />
these must still be professionally examined and tested as viable.<br />
The rising cost of personnel and lack of matching increase in the Equitable Share poses a threat to the<br />
long-term sustainability of the <strong>District</strong>. Local government is expected to perform various functions which<br />
are entrenched by constitution. <strong>Sedibeng</strong> as a category C municipality has different functions allocated<br />
as per legislative requirement and in most instances is intended to act as a coordinator and mechanism<br />
through which provincial and national government link to Local government. The following factors have<br />
compounded the financial viability of the <strong>District</strong><br />
• Increases in the Equitable Share lagging behind actual increases.<br />
• Realignment of structures in line with national policy for designated groups.<br />
• The rate of salary increases which are negotiated at a central bargaining level.<br />
• The need to absorb workers at the conclusion of some programmes eg: EPWP programmes.<br />
The following area offer practical and implementable solutions to the problem:<br />
Provincialisation of EMS – This has been the subject of protracted discussions between<br />
municipalities across the Gauteng Province and the Provincial Department of Health. The<br />
current shortfall between the subsidy received and the cost of running the service on behalf of<br />
the Province amounts to R20m per annum and is continuously growing. Indications are that the<br />
province wants to take back this function. This move will relieve the <strong>Sedibeng</strong> <strong>District</strong><br />
<strong>Municipality</strong> of the R20m shortfall per annum and 260 staff members. The associated costs<br />
linked to the department will create a further relief in the financial strain.<br />
Age Profile – An in depth analysis is required of the age profile of the institution. This will<br />
identify possible staff who could be offered early retirement packages. Some staff are reaching<br />
retirement as a natural process of aging.<br />
Medical Boarding – Some staff members, due to ill health, have become unproductive. In some<br />
instances staffs have had to be contracted in to ensure that the work was done. Without<br />
violating labour laws, there is scope for dealing with such cases in an appropriate manner.<br />
Attrition – The institution has a natural rate of attrition. If flexibility exists to deploy staff<br />
according to the needs of the institution without filling these attrition vacancies, then this is a<br />
viable way of reducing the staff numbers. Hand in hand with this strategy goes the general<br />
moratorium of filling of vacancies and only in extreme loss of skills would a vacancy be filled.<br />
Structural Flexibility – This is an important agreement that has to be in place that allows<br />
movement of staff to accomplish several reduction measures. This needs to be negotiated with<br />
organised labour to ensure that they are partners in the process to achieve reduced cost and<br />
reduced numbers.<br />
Youth Advise Centres – These Centres were established with funding from Umsobomvu Youth<br />
Fund and are operational across the <strong>District</strong>s. These Centres were established with an MOU that<br />
Our Area, Our People, Our Institution and Service Delivery © <strong>Sedibeng</strong> <strong>District</strong> <strong>Municipality</strong> 2011/2012 IDP - All Rights Reserved Page|46
ANALYSIS 2011/12 CHAPTER 2<br />
<br />
<br />
<br />
<br />
these would be transferred to local Municipalities by June 2011. Local Municipalities have<br />
indicated that they are not ready for these transfers. A grace period should be allowed, and on a<br />
phased and mutually agreed basis, these Youth Centres must be transferred to local<br />
municipalities.<br />
Externally Funded Posts – Negotiations are currently underway to have the Sewer Scheme<br />
Project Management Unit (PMU) funded from the funding allocation from various sources<br />
towards the new Regional Sewer Scheme. This would remove several staff members from the<br />
payroll. The NPDF grant has recognised the need for skills in the Project management of the<br />
NDPG projects in the <strong>District</strong>. Discussions are underway for some posts to be funded from the<br />
available funds for technical assistance which was awarded to <strong>Sedibeng</strong>.<br />
Overtime – This has been a major contributory factor to increased costs of personnel. Currently<br />
R8 per annum is being consumed by overtime costs. This is largely in the EMS department.<br />
Stricter control would return large savings.<br />
Tools of Trade – Several staff members have over a period of time been allocated with cell<br />
phone allowances and more recently, 3G access. An analysis of the staff job descriptions<br />
indicate that these tools of trade are unwarranted and cannot be justified. In many instances,<br />
staff have moved department and migrated their allowance with them even though the new<br />
post does not require the devices. A complete recall of all these devices and a systematic<br />
allocation to only warranted users will greatly reduce the costs of these allowances.<br />
Travel Costs- Despite some employees enjoying locomotion allowances and the cost of running<br />
a considerable fleet, ad-hoc claims need to be curtailed.<br />
A well-conceived and compliant Cost Reduction Strategy will feature highly in the 2011/2012 financial<br />
year. Consistent with this reduction strategy care must be exercised not to shed critical skills required by<br />
the institution. A staff retention strategy must therefore go hand-in-hand with the reduction strategy.<br />
Our Area, Our People, Our Institution and Service Delivery © <strong>Sedibeng</strong> <strong>District</strong> <strong>Municipality</strong> 2011/2012 IDP - All Rights Reserved Page|47
ANALYSIS 2011/12 CHAPTER 2<br />
2.4 SERVICE DELIVERY:<br />
The Municipal Systems Act, 32 of 2000 enjoins the municipality to make provision for the receipt and<br />
consideration of petitions. The <strong>District</strong> has pursuant to the legal dictate adopted a policy on the<br />
management of petitions and has also constituted the Petitions Management Committee to inter alia<br />
consider all petitions lodged with the municipality. The recent sporadic political unrest is as a result of<br />
lack of providing timeous response or feedback on the issues raised by different communities with<br />
regard to service delivery. Even though the committee has stepped in terms of intervening, the <strong>District</strong><br />
has to properly coordinate its work and its Locals which currently are experiencing challenges to provide<br />
services at the expected standard. In addition public participation on how to deal with the submission of<br />
petition requires more attention.<br />
<strong>Sedibeng</strong> is the leading <strong>District</strong> <strong>Municipality</strong> in the areas of Gauteng in providing sustainable human<br />
settlement patterns in which a lot of capital investment has gone into building of housing for the poor<br />
on one hand, and the mixed as well as private sector driven housing development and higher end<br />
property development on the other hand. These developments have equally increased a number of<br />
community facilities such as schools, clinics, police stations and other public facilities. <strong>Sedibeng</strong> has<br />
adequate provision of water, sanitation and electricity and is in line to meet the targets of Millennium<br />
Development Goals. <strong>Sedibeng</strong> <strong>District</strong> <strong>Municipality</strong> has done well in terms of the establishment of<br />
human settlements, although the demand and supply factor appear to negate this. The Demand<br />
database launched in SDM proved that the demand to establish more settlements is a necessity. The<br />
barrier to new residential establishments is land acquisition and land ownership which will have to be<br />
addressed by government and private landowners.<br />
2.4.1 HEALTH AND SOCIAL DEVELOPMENT<br />
In terms of health services, there are three (3) public hospitals in <strong>Sedibeng</strong> <strong>District</strong> <strong>Municipality</strong>, namely<br />
Kopanong and Sebokeng Hospitals that are located in Emfuleni Local <strong>Municipality</strong> and Heidelberg<br />
Hospital which is within the Lesedi Local <strong>Municipality</strong>. In addition to these public hospitals there are five<br />
private hospitals of which four of the hospitals are within Emfuleni and one is located in Lesedi. Based<br />
on this scenario it is evident that hospitals services are clustered in Emfuleni Local <strong>Municipality</strong>.<br />
The Primary Health Care facilities (clinics) are clustered more in urban and service centres, while the<br />
rural areas are served through the mobile units. Emfuleni sub <strong>District</strong> has twenty one (21) clinics, four<br />
(4) Community Health Centres (CHC) and 4 mobile units. In Midvaal there are 4 clinics and 3 mobile<br />
units. In Lesedi there are 7 clinics and 3 mobile units.<br />
The table below illustrate the number of health facilities in the <strong>District</strong> per sub <strong>District</strong> and the type of<br />
service rendered by the facility:<br />
Sub <strong>District</strong><br />
Health<br />
Post<br />
Mobiles Satellites Clinics Community<br />
Day<br />
Centres<br />
Community<br />
Health<br />
Centres<br />
<strong>District</strong><br />
/<strong>District</strong>al<br />
Hospitals<br />
Emfuleni 0 4 0 21 0 4 2<br />
Lesedi 0 3 1 7 0 0 1<br />
Midvaal 0 3 0 4 0 0 0<br />
<strong>Sedibeng</strong> 0 10 1 32 0 4 3<br />
Our Area, Our People, Our Institution and Service Delivery © <strong>Sedibeng</strong> <strong>District</strong> <strong>Municipality</strong> 2011/2012 IDP - All Rights Reserved Page|48
ANALYSIS 2011/12 CHAPTER 2<br />
There are four (4) Maternity Obstetric Units (MOU’s) and all these are located to Emfuleni Sub <strong>District</strong>,<br />
and therefore there is a backlog of MOU’s in Lesedi and Midvaal. In light of this both Lesedi and Midvaal<br />
lack fully fledged Community Health Centres.<br />
The expansion of services is taking place in all clinic facilities within the context of Provincialisation. The<br />
table below illustrate the <strong>Sedibeng</strong> per sub <strong>District</strong> coverage of National immunization campaign of<br />
Measles, Polio and Vit A from April to May 2010:<br />
Sub <strong>District</strong> Coerage In %<br />
Emfuleni 100%<br />
Midvaal 94%<br />
Lesedi 96%<br />
<strong>Sedibeng</strong> 99%<br />
The table below shows TB cure rate from 2004/2005 to date<br />
Indicator 2004/05 2005/06 2006/07 2007/08 2008/09 2009/10<br />
TB cure rate 57% 66% 66.1% 72% 74% 77%<br />
There has been improvement on TB cure rate from 57% in 2004/05 to 77% in 2009/10.<br />
The table below indicate the H1N1 National immunization campaign in <strong>Sedibeng</strong> per sub <strong>District</strong>:<br />
Sub <strong>District</strong> 1 st phase 2 nd Phase Total<br />
administered<br />
Emfuleni 1252 42 156 43 408<br />
Lesedi 215 4992 5207<br />
Midvaal 42 4142 4187<br />
<strong>Sedibeng</strong> 1509 51290 52802<br />
The table above indicates exerted effort to manage and control communicable disease across the<br />
<strong>District</strong>. Outbreak response team have been established to keep surveillance of all communicable<br />
disease. During 2009/10 financial year a total of 42 confirmed cases of H1N1 were reported across the<br />
<strong>District</strong>. Awareness and immunization campaign were done.<br />
2.4.2 SERVICE DELIVERY PROFILE ON SOCIAL DEVELOPMENT<br />
The table below indicate the older person’s service centres and lunch on clubs registered and funded<br />
by Social Development within <strong>Sedibeng</strong> <strong>Municipality</strong> per sub <strong>District</strong>:<br />
Centre/Lunch on Emfuleni Midvaal Lesedi <strong>Sedibeng</strong><br />
club<br />
Service Centres 6 3 1 10<br />
Lunch on<br />
Clubs<br />
9 0 3 12<br />
2.4.3 EDUCATION<br />
Given the importance of education in the development of human capital for our developmental state, it<br />
is appropriate to consider some of the crucial ways on how to increase the general level of education as<br />
well as to change the distribution of skills in this <strong>District</strong>. According to Global Insight, the most equitable<br />
and the most cost-effective investment the state can make in education is the provision of general<br />
schooling, especially primary schooling.<br />
Our Area, Our People, Our Institution and Service Delivery © <strong>Sedibeng</strong> <strong>District</strong> <strong>Municipality</strong> 2011/2012 IDP - All Rights Reserved Page|49
ANALYSIS 2011/12 CHAPTER 2<br />
There are 148 primary schools and 88 secondary schools in <strong>Sedibeng</strong>. Of the total 236 schools within<br />
<strong>Sedibeng</strong>, 90.3% are public schools and the remaining 9.7% are either private or semi – private schools.<br />
Some of the schools, especially those in the previously disadvantaged township areas and the rural<br />
areas, have various upgrading needs, for example, more teachers, access to water and sewerage, access<br />
to electricity, road access, and upgrading of buildings.<br />
As far as tertiary education facilities are concerned, the most important one is the satellite campus of<br />
North West University situated in Vanderbijlpark. Other tertiary education facilities include the <strong>Sedibeng</strong><br />
College and the Vaal University of Technology.<br />
Table 5: Learner - Teacher Ratio, <strong>Sedibeng</strong> & Gauteng, 2007 & 2008<br />
Types of Schools <strong>Sedibeng</strong> Gauteng<br />
2007 2008 2007 2008<br />
Primary 32.0 32.1 34.3 33.8<br />
Secondary 30.4 30.4 31.8 29.5<br />
(Source: Gauteng Dept. of Education, 2008)<br />
The table above provides a comparison of the learner – teacher ratio between Gauteng and <strong>Sedibeng</strong><br />
for 2007 and 2008. In comparison with the learner – teacher ratio for Gauteng, <strong>Sedibeng</strong> had a lower<br />
ratio for primary schools for both years; however the situation might have changed in 2009.<br />
Approximately 12% of schools or 38 schools exceed the recommended learner to educator ratio. The<br />
ratio for was larger for secondary schools in <strong>Sedibeng</strong> at 30.4 in comparison to 29.5 in Gauteng. This<br />
indicates that there is still room for improvement for <strong>Sedibeng</strong> in the learner – teacher ratio in the<br />
secondary schools.<br />
2.4.4 LIBRARIES AND COMMUNITY HALLS<br />
There are 19 libraries and 22 community halls within <strong>Sedibeng</strong>. Midvaal and Lesedi are reasonably<br />
adequately provided for in terms of libraries and community halls, however serious shortages of these<br />
facilities exist within the more densely populated areas of Emfuleni. Furthermore there is a lack of these<br />
types of facilities, particularly libraries, within the rural areas, exacerbated by distance to urban areas<br />
and the lack readily available public transport.<br />
2.4.5 YOUTH DEVELOPMENT<br />
<strong>Sedibeng</strong> have so far advanced programmes of Youth Development by reaching out to our young people<br />
within rural areas such as Devon, Vischkuil, Sedaven, Waterdal and Maalbank including the Youth with<br />
Disability.A total of 267 young people from rural areas have been recruited into a two year learnership<br />
the (NARYSEC) programme established in partnership with the National Department of Rural<br />
Development and Land Reform. Amongst this young people a total of 23 have been absorbed by the<br />
SANDF while others are to be absorbed by the NAVY and the rest will be registered with FET Colleges for<br />
study.<br />
The Youth Advisory Centre is located in the <strong>District</strong> and continues to reach out to a number of young<br />
people across the <strong>District</strong> by providing services of demand such as Entrepreneurship advice, Job<br />
preparedness workshops, Internet access, CV writing skills, Monthly basic Computer Courses including<br />
Life Skills programmes.<br />
Our Area, Our People, Our Institution and Service Delivery © <strong>Sedibeng</strong> <strong>District</strong> <strong>Municipality</strong> 2011/2012 IDP - All Rights Reserved Page|50
ANALYSIS 2011/12 CHAPTER 2<br />
Since June 2010 to date, a total of 25797 people have so far accessed these various services through the<br />
Youth Advisory Centre in an endeavour to acquire skills for employability and livelihood opportunities.<br />
There are three young people with disability who have volunteered in the Youth Advisory Centre since<br />
inception have been recruited into an accredited learnership for a period of 12 Months in the <strong>District</strong><br />
and Department of Labour.<br />
A total number of sixty five (65) young people were recruited as fieldworkers to conduct the Youth<br />
Situational Analysis through a strategic partnership with Vaal University of Technology (VUT) and the<br />
National Youth Development Agency (NYDA). A draft report of this analysis (<strong>Sedibeng</strong> Youth Research)<br />
has been completed scheduled for Youth Conference in the current year.<br />
As part of redressing the imbalances of the past the <strong>District</strong> continues to provide Mayoral Bursaries to<br />
the needy students, for the financial year 2009/2010 a total of 81 deserving indigent students in their<br />
first, second and third year have been awarded bursaries through various institutions of Higher<br />
Learning.<br />
2.4.6 DESIGNATED GROUPS DEVELOPMENT<br />
The historical exclusion and inequality inherited from the past including lack of skills has resulted in the<br />
designated groups having lower levels of employment, lower levels of income, lower levels of education<br />
and fewer chances of upward mobility. Total emancipation will never be achieved unless equity related<br />
matters and women empowerment are addressed.<br />
2.4.7 PUBLIC SAFETY SERVICES<br />
There are 13 police stations situated in the <strong>District</strong>, 7 in Emfuleni, 3 in Midvaal, and 3 in Lesedi. There is<br />
a shortage of police stations, especially in the more densely populated urban areas in the western<br />
portion of the <strong>District</strong>.<br />
Through the CCTV Project which started in 2005, about 15 CCTV Street Surveillance Cameras have been<br />
installed in Vereeniging CBD. Two CCTV Street Surveillance Cameras were also installed in Sebokeng,<br />
eight (8) in Evaton and one (1) in Sharpeville. With expansion phase of the project, a new system has<br />
been introduced in Sebokeng and Evaton, whereby the optic fibre video transmission network has been<br />
replaced with a wireless video transmission network which support the ICT Connectivity functions. The<br />
wireless network provides broadband solutions that can serve the Youth Advisory Centres, Schools and<br />
Primary Health Centres.<br />
It further supports IP Mobility through ADSL, ISDN, etc. and Voice over IP (VoIP) Communication<br />
Network at minimal costs. Installation of CCTV Cameras in Sebokeng (06), Evaton (06), Sharpeville (04)<br />
and Meyerton (04) has been completed. The sleeves that will run optic fibre video transmission network<br />
have been laid underground from the Surveillance Centre to Vanderbijlaprk and Bedworthpark and the<br />
installation of cameras should be completed by the end of December 2011. The deployment of cameras<br />
will be as follows; Vanderbijlpark(24), Bedworthpark (04), Heidelberg (07), Ratanda (03), Meyerton (04)<br />
and Vereeniging (16).<br />
As far as traffic licensing is concerned, there are at present 4 licensing offices within the boundaries of<br />
the <strong>District</strong>. These are located in Vereeniging, Vanderbijlpark, Meyerton and Heidelberg.<br />
Our Area, Our People, Our Institution and Service Delivery © <strong>Sedibeng</strong> <strong>District</strong> <strong>Municipality</strong> 2011/2012 IDP - All Rights Reserved Page|51
ANALYSIS 2011/12 CHAPTER 2<br />
CCTV cameras have also been installed at all four Licensing Service Centres in the <strong>District</strong> to address<br />
issues of criminality.<br />
Various programs have been developed to address issues related to Social Crime Prevention. These<br />
include awareness programs in domestic violence, child prostitution and rape, schools safety, rural<br />
safety, alcohol and substance abuse and road safety. Through the regional Victim Empowerment Centre<br />
(Lehae la Bophelo), victims of crime are treated in relation to trauma counselling and further referrals to<br />
other institutions to receive professional assistance. The Centre situated at Itsose Primary School in<br />
Sharpeville.<br />
Community based structures in safety and security are continuously capacitated through skills<br />
development workshops whereby the Community Policing Forums, Youth Crime Prevention Desks and<br />
Community Patrollers are trained in crime prevention measures to ensure that partnerships are<br />
sustained and that communities are safe. Through these structures, awareness programs on schools<br />
safety, road safety, crime prevention and cleaning campaigns are conducted throughout the <strong>District</strong>.<br />
2.4.8 DISASTER MANAGEMENT PLAN<br />
The <strong>Sedibeng</strong> Disaster Management Centre is established in the administration of the <strong>Sedibeng</strong> <strong>District</strong><br />
<strong>Municipality</strong> to serve the area of the municipality as a whole. The department exercises its powers and<br />
performs its duties in terms of Section 44(1) of the Disaster Management Act, 2002. The department<br />
specialises in issues concerning disasters, disaster risk management and promote an integrated and coordinated<br />
approach to disaster risk management within the <strong>District</strong>.<br />
The department currently runs the <strong>Sedibeng</strong> Emergency Communication Centre (10177), which serves<br />
as a central facility within the Disaster Management Department to provide 24-hour emergency<br />
communications to facilitate the issuing of early warnings and co-ordinated responses to incidents. The<br />
centre serves the Midvaal and Emfuleni Local Municipalities. Lesedi currently handles its own<br />
emergency calls.<br />
The department further has a Multi Purpose vehicle, which highlights level of readiness in effective<br />
Incident Management, effective transportation means for people affected by disastrous incidents and<br />
effective management of mass events for the <strong>Sedibeng</strong> communities. The vehicle has the following<br />
features:<br />
• The Transporter<br />
o It can seat over 55 people, has a canvas cover for protection; It can be modified to be<br />
utilized as a cargo body and can also be used as a tipper. For instance, during floods, if there<br />
is a need for sand to be transported for flood prevention, the transporters can be used.<br />
• The Water Tanker<br />
o The tanker has the capacity to carry 5000 litres of water; It can carry drinking water and can<br />
also be utilized as a fire fighting vehicle.<br />
• Communication Pod<br />
o a weather station<br />
o CCTV<br />
o 20 tactical communication radio<br />
o Airband that can be linked to Emergency Management Air support<br />
o Generator<br />
o Air Conditioner and a fridge.<br />
o P.A system for information dissemination.<br />
Our Area, Our People, Our Institution and Service Delivery © <strong>Sedibeng</strong> <strong>District</strong> <strong>Municipality</strong> 2011/2012 IDP - All Rights Reserved Page|52
ANALYSIS 2011/12 CHAPTER 2<br />
The <strong>Sedibeng</strong> <strong>District</strong> has also, as a legacy of the World Cup, been able to setup a JOC Centre at a hall at<br />
the Vaal Teknorama Museum. This has been tested and used during the floods in early 2011.<br />
As far as Fire & Rescue Services within the <strong>District</strong> are concerned, the operational competency lies with<br />
the 3 Local municipalities. There are all in all 5 Fire Stations in <strong>Sedibeng</strong> (3 in Emfuleni, 1 in Midvaal, 1 in<br />
Lesedi). There is also a satellite fire station in Devon, but it is not fully operational.<br />
The Disaster Management and Fire-Coordination Unit at the <strong>District</strong> level only coordinate fire fighting<br />
services in terms of Sec 4 (1) j of the MSA, which include: which includes:<br />
i. Planning, co-ordination and regulation of Fire fighting Services<br />
ii. Specialized fire fighting services such as mountain, veld and chemical fires.<br />
iii. Co-ordination of the standardization of infrastructure, vehicles, equipment and procedures,<br />
iv. Training of fire officers.<br />
2.4.9 PUBLIC AWARENESS, EDUCATION AND TRAINING<br />
Comprehensive mechanisms for addressing public awareness, education and training have been put in<br />
place:<br />
PIER program;<br />
Capacity initiatives for Disaster Management responders; and<br />
Early Warning System on floods.<br />
2.4.10 SPORTS RECREATION ARTS, CULTURE &HERITAGE<br />
Heritage Routes and Sites<br />
The SDM has a rich and diverse cultural and political history. Promoting and developing the heritage of<br />
our <strong>District</strong> is a key priority area for <strong>Sedibeng</strong> to attract more people to the area. There are eight (8)<br />
heritage routes identified in the <strong>District</strong>. One (1) heritage route has been developed. One (1) heritage<br />
route has been launched. There are currently thirty five (35) heritage sites in the <strong>District</strong>, namely two (2)<br />
operational museums (Vaal Teknorama Museum and Sharpeville Human Rights Precinct) and 33 well<br />
maintained heritage sites. Teknorama Museum is being earmarked to for the establishment of a<br />
21 st century Digitised Museum as part of a turn around strategy. Below is a breakdown of the number of<br />
the heritage sites as per Local municipality:<br />
Lesedi Midvaal Emfuleni<br />
Heidelberg Klip Church Witkop Blockhouse Vaal Teknorama Museum<br />
Heidelberg Bakoond Diepkloof Farm Museum Sharpeville Human Rights Precincts<br />
Heidelberg Old Jail Redan Rock Engravings Maccauvlei Golf Course (Anglo<br />
Boer War)<br />
Heidelberg Volkskool (Primary & John le Roux On & Off Ramp Peace Negotiation Site<br />
Secondary)<br />
De Rust Victorian Manor<br />
Dr. Verwoerd Laerskool-Water Concentration Camp Cemetery<br />
Reservoir<br />
Heidelberg Standard Bank (60 Old Railway Bridge<br />
Graves of Leslie Family<br />
Strydom Street)<br />
Heidelberg Club (HF Verwoerd Street)<br />
Mine Disaster Cenotaph<br />
Heidelberg: A. G. Visser House<br />
Constitution Square<br />
St. Ninians Anglican Church Complex<br />
G.W. Stow Memorial<br />
Our Area, Our People, Our Institution and Service Delivery © <strong>Sedibeng</strong> <strong>District</strong> <strong>Municipality</strong> 2011/2012 IDP - All Rights Reserved Page|53
ANALYSIS 2011/12 CHAPTER 2<br />
Methodist Church<br />
Triumvirate Monument & Town Hall<br />
Heidelberg Motor Museum<br />
Peace Monument<br />
Vereeniging Klip Church<br />
Night Vigil Massacre Site<br />
Boipatong Massacre Site<br />
Macamel Church<br />
Wilberforce Community College<br />
Sylviavale Museum<br />
<br />
Sports Facilities<br />
<strong>Sedibeng</strong> <strong>District</strong> <strong>Municipality</strong> currently has 26 sports facilities many of which require upgrading. It is<br />
clear that there is an under-provision of sports fields and facilities, especially in the townships and rural<br />
areas. <strong>Sedibeng</strong> has a youth population (15-34 years) of 263 902 of which 131 116 youth are male and<br />
132 786 youth are female. The percentage of sports facilities to the youth population is 0.10%.<br />
A minimalist standards approach is needed around facilities to enable our communities to continue<br />
using the portion of land that they have being using for years as sports grounds. Amongst others many<br />
of our sports facilities are being vandalised and need a turnaround for the benefit of the community<br />
therefore President Park stadium in Vereeniging must be allocated to <strong>Sedibeng</strong> to establish <strong>District</strong><br />
Sports Hub to host multi sporting codes.<br />
According to a facility audit conducted on all sport facilities in <strong>Sedibeng</strong>, the following was a finding:<br />
Emfuleni Local<br />
<strong>Municipality</strong><br />
Lesedi Local<br />
<strong>Municipality</strong><br />
Midvaal<br />
Local<br />
<strong>Municipality</strong><br />
<strong>Sedibeng</strong><br />
<strong>District</strong><br />
<strong>Municipality</strong><br />
17 x facilities 4 x facilities 5 x facilities 26 Facilities<br />
(Source: Global Insight, 2010)<br />
2.4.11 BASIC SERVICE DELIVERY LEVELS<br />
<br />
Water<br />
<strong>Sedibeng</strong> is the leading <strong>District</strong> municipality in terms of basic service delivery. Improvements in access to<br />
services were exhibited in respect of piped water inside the dwelling, refuse removal by Local<br />
authorities, formal housing, sanitation and electricity. <strong>Sedibeng</strong> <strong>District</strong> <strong>Municipality</strong> has high water<br />
service levels, with 95.5% of the households having access to RDP water services with a backlog of 1.4%.<br />
Piped water<br />
inside<br />
dwelling<br />
Number of households by level of access to Water<br />
Piped<br />
water in<br />
yard<br />
Communal piped<br />
water: less than<br />
200m from dwelling<br />
(At RDP-level)<br />
Communal piped<br />
water: more than<br />
200m from<br />
dwelling (Below<br />
RDP)<br />
No formal<br />
piped water<br />
Total<br />
<strong>Sedibeng</strong><br />
<strong>District</strong><br />
<strong>Municipality</strong> 177,843 59,665 3,871 6,554 4,943 252,876<br />
(Source: Global Insight, 2010)<br />
Our Area, Our People, Our Institution and Service Delivery © <strong>Sedibeng</strong> <strong>District</strong> <strong>Municipality</strong> 2011/2012 IDP - All Rights Reserved Page|54
ANALYSIS 2011/12 CHAPTER 2<br />
<br />
Sanitation<br />
<strong>Sedibeng</strong> has high sanitation service levels, with 91.2% of the households having access to sanitation.<br />
<strong>Sedibeng</strong> has a sanitation backlog of 1.5%.<br />
Number of households by type of Toilet<br />
Flush<br />
toilet<br />
Ventilation<br />
Improved<br />
Pit (VIP)<br />
Bucket<br />
system<br />
No<br />
toilet<br />
Pit toilet<br />
Total<br />
<strong>Sedibeng</strong> <strong>District</strong><br />
<strong>Municipality</strong> 225,099 5,641 19,245 731 2,160 252,876<br />
(Source: Global Insight, 2010)<br />
The Statistics SA Community Survey of 2007 also indicates that <strong>Sedibeng</strong> has high sanitation service<br />
levels, with 98.4% of the households having access to sanitation. Emfuleni has the highest sanitation<br />
service levels in the <strong>District</strong> (99.1%), followed by Midvaal (98.3%) and then Lesedi with 91.7% of its<br />
households having access to sanitation. <strong>Sedibeng</strong> has a sanitation backlog of 1.5%. Lesedi has the largest<br />
backlog in the <strong>District</strong>, of 8.2% and contributes 44.8% to the <strong>District</strong> backlog and 1.7% to the provincial<br />
backlog. Emfuleni has the smallest backlog (0.8%) and contributes 44.2% to the <strong>District</strong> backlog and<br />
1.7% to the provincial backlog.<br />
<br />
Electricity<br />
The Global Insight indicates that 88.7% of the households in <strong>Sedibeng</strong> have access to electricity, with a<br />
backlog of 11.3% of household with no electricity.<br />
<strong>Sedibeng</strong> <strong>District</strong> <strong>Municipality</strong> 1,517 222,789 28,570 252,876<br />
(Source: Global Insight, 2010)<br />
The Community Survey 2007 indicates that 92.1% of the households in <strong>Sedibeng</strong> have access to<br />
electricity. Emfuleni has the highest percentage of households with access to electricity (93.4%) and<br />
Lesedi has the lowest percentage of households with access to electricity (81.4%). <strong>Sedibeng</strong> has an<br />
electricity backlog of 7.8%. Lesedi has the largest electricity backlog in the <strong>District</strong> (18.5%) and<br />
contributes 19.9% to the <strong>District</strong> backlog and 0.7% to the provincial backlog. Emfuleni has the smallest<br />
electricity backlog (6.5%), accounting for 67.1% of the <strong>District</strong> backlog and 2.4% of the provincial<br />
backlog.<br />
<br />
Refuse Removal<br />
In terms of refuse removal, 95.6% of the households in <strong>Sedibeng</strong> have access to refuse removal, having<br />
a backlog of 4.4%.<br />
Number of households by access to refuse removal<br />
Removed less<br />
Removed often than<br />
weekly by weekly by<br />
authority authority<br />
Number of households by electricity usage<br />
Electricity<br />
for lighting<br />
only<br />
Electricity for<br />
lighting and<br />
other purposes<br />
Not using<br />
electricity<br />
Removed by<br />
community<br />
members<br />
Personal<br />
removal<br />
(own<br />
dump)<br />
No refuse<br />
removal<br />
Total<br />
<strong>Sedibeng</strong> <strong>District</strong><br />
<strong>Municipality</strong> 241,507 211 666 6,314 4,178 252,876<br />
(Source: Global Insight, 2010)<br />
Total<br />
Our Area, Our People, Our Institution and Service Delivery © <strong>Sedibeng</strong> <strong>District</strong> <strong>Municipality</strong> 2011/2012 IDP - All Rights Reserved Page|55
ANALYSIS 2011/12 CHAPTER 2<br />
In terms of refuse removal, 84.8% of the households in <strong>Sedibeng</strong> have access to refuse removal.<br />
Emfuleni has the highest refuse removal levels (85.8%), followed by Lesedi with (82.6%) and then<br />
Midvaal with 78.2% of its households having access to refuse removal services. Midvaal has the largest<br />
refuse removal backlog (21.7%) and contributes 14.4% to the <strong>District</strong> backlog and 1.1% to the provincial<br />
backlog. Emfuleni has the smallest refuse removal backlog (14.1%) and accounts for 75.8% of the <strong>District</strong><br />
backlog and 6.2% of the provincial backlog.<br />
<br />
Housing<br />
Approximately 83.9 % of the population has access to formal housing and 16.1% has access to informal<br />
housing and other type of dwellings such Traditional dwelling. The majority of new low cost housing<br />
developments have been located in Emfuleni. Large housing developments which have been<br />
implemented within the SDM primarily focus on subsidized housing to eradicate existing housing<br />
backlog. Larger subsidized housing developments are being established on the periphery or as natural<br />
extensions to historically disadvantaged areas.<br />
Number of households by type of dwelling unit<br />
Very<br />
Formal Formal Informal Traditional<br />
Other dwelling<br />
type<br />
Total<br />
<strong>Sedibeng</strong><br />
<strong>District</strong><br />
<strong>Municipality</strong> 161,131 50,942 38,308 347 2,148 252,876<br />
(Source: Global Insight, 2010)<br />
Emfuleni Local <strong>Municipality</strong> Townships<br />
Construction of<br />
Houses/Units<br />
Houses completed &<br />
allocated<br />
Houses Completed<br />
Tshepiso North Ext 1 295 91 91<br />
Tshepiso North<br />
Ext 3 1500 971 971<br />
Tshepiso Proper 540+500 540 125<br />
Lakeside Ext 4 380 18 326 (Need to be rectified)<br />
Boipatong (OldXhasa) 1098 279 106<br />
Boipatong Backyard 750 450 450<br />
Kanana 2053 2030 20<br />
Eatonside&<br />
EvatonEstate<br />
1599 1599 1599<br />
Sebokeng Zone 24 247 55 76<br />
Our Area, Our People, Our Institution and Service Delivery © <strong>Sedibeng</strong> <strong>District</strong> <strong>Municipality</strong> 2011/2012 IDP - All Rights Reserved Page|56
ANALYSIS 2011/12 CHAPTER 2<br />
Lesedi Local <strong>Municipality</strong> Townships<br />
Kaydale<br />
Construction Of Houses/Units<br />
Houses<br />
completed &<br />
allocated<br />
2290 Feasibility study<br />
Houses<br />
Completed<br />
Planning<br />
stage<br />
Impumelelo Ext 2 1259 846 864<br />
Ratanda Ext 1,3,5,6 & 7 130 98<br />
98 units<br />
only but no<br />
land<br />
available<br />
for<br />
completion<br />
of project<br />
(32<br />
outstandin<br />
g)<br />
TokolohongAgrivilage 290 None 287<br />
Heidelburg Ext 23 95 95 95<br />
Kwazenzele Rural Projects 240 None 33<br />
Midvaal Local <strong>Municipality</strong> Townships<br />
Construction of houses<br />
Houses<br />
completed&<br />
allocated<br />
Houses<br />
Completed<br />
Lakeside Estate Ext 1 1247 1245 1245<br />
SiceloShiceka Proper 1089<br />
38 Temporally<br />
occupied 1051 1089<br />
Allocated<br />
Kliprivier 620 Feasibility study None<br />
Mamello 500 Feasibility study None<br />
2.4.12 INFORMAL SETTLEMENT<br />
Informal residential settlements can be defined as settlements that do not conform to any formal townplanning<br />
and tend to have limited access to basic engineering services such as water, sewerage and<br />
electricity. There are thirty five (35) informal settlements in <strong>Sedibeng</strong> with six (6) being in the process of<br />
being formalized. The six (6) projects’ infrastructure process will be completed by the end of March<br />
2011 and the top-structure process will commence in the next Financial Year. They are as follows:<br />
Tshepiso North Ext 1, Tshepiso North Ext 4, Sonderwater, New Village, Sebokeng Zone 24, and Tshepong<br />
Phase 2.<br />
2.4.13 RURAL DEVELOPMENT HOUSING<br />
Currently farm workers do not have access to formal housing. One of the reasons is considered to be<br />
related to the township establishment process as these areas are located outside the urban edge as<br />
approved by all authorities including the Province, <strong>District</strong> and Municipalities. The edge needs to be<br />
revised or conditional approval be given. The consequence is that farm workers are staying in informal<br />
settlements in main. Provincial authorities do not want to support the establishment of townships for<br />
Our Area, Our People, Our Institution and Service Delivery © <strong>Sedibeng</strong> <strong>District</strong> <strong>Municipality</strong> 2011/2012 IDP - All Rights Reserved Page|57
ANALYSIS 2011/12 CHAPTER 2<br />
farm workers as this is “outside the Edge”. Nation Government is in the process of finalizing the Rural<br />
Development Policy.<br />
2.4.14 TRANSPORT PLAN<br />
The integrated transport plan (ITP) for <strong>Sedibeng</strong> 2008 to 2013 is focused on developing transport<br />
infrastructure and operational plan for the <strong>District</strong> for 2010 and beyond. Significant progress has been<br />
made in rolling out ITP. Below is a summary of progress made to date:<br />
Collection and collating information on transport facilities location, utilization and capacity;<br />
Analyzing routes and services;<br />
Collating information relating to operating licenses and subsidized bus transport information;<br />
Cordon Surveys done;<br />
Reviewing relevant legal framework;<br />
Analysis of planned developments; and<br />
In terms of Integrated Transport Plan for <strong>Sedibeng</strong>, further studies that need to be undertaken are as<br />
follows;<br />
Strategy for Modal Integration of public transport (Mini-bus, buses and trains)<br />
Assessment and strategy to deal with Meter Taxis and scholar transport in the region.<br />
Provision of transport for people with special needs.<br />
Policy on management of public Transport Facilities and bylaws.<br />
Support Gauteng with finalisation of main Public transport corridors (including Gauteng) that is<br />
Integrated Public Transport Network Design Project.<br />
Assistance to Municipalities on Road Safety campaigns Traffic signals, Road signage.<br />
Develop freight Transport Management plan.<br />
Develop Airport turn around strategy or commercialization of current Airport<br />
Develop waterways plan for the region.<br />
Public Transport Status Quo:<br />
There are 35 Bus rank in <strong>Sedibeng</strong>, of which only two (2) are formal.<br />
There are 56 Taxi/Public Ranks in Sebokeng, of which only twelve (12) are formal. Major portion<br />
of ranks are in Emfuleni Local <strong>Municipality</strong>.<br />
Only 25% of mini-bus taxi ranks are in good condition, most ranks are either informal and/or<br />
temporally on street.<br />
Operating License Strategy<br />
Every route has oversupply of seats (including 30% contingency)<br />
Formal ranks are saturated (operating at over capacity conditions).<br />
High proportions of operators were issued with Operating License without considering<br />
oversupply.<br />
High proportions of vehicle registration from site do not correspond with registrar database<br />
(and OLS).<br />
Route compliance not strictly enforced.<br />
Provincial Department of Roads and Transport intends to establish Transport Operating License<br />
Administrative Body (TOLAB) in <strong>Sedibeng</strong> to assist Local operators.<br />
Our Area, Our People, Our Institution and Service Delivery © <strong>Sedibeng</strong> <strong>District</strong> <strong>Municipality</strong> 2011/2012 IDP - All Rights Reserved Page|58
ANALYSIS 2011/12 CHAPTER 2<br />
Rationalisation Plan<br />
Subsidized contracts bus services are mainly serving low income residential areas, long distance<br />
There are two hundred and fifty six (256) subsidized bus routes which majority are in Emfuleni<br />
Local <strong>Municipality</strong>.<br />
There are no subsidized operations in Lesedi Local <strong>Municipality</strong><br />
Only 6% of commuter trips in <strong>Sedibeng</strong> <strong>District</strong> <strong>Municipality</strong> are by rail, 15% by bus and the rest<br />
by taxi<br />
The operator extended routes at own cost to provide service while maintaining contract<br />
performance.<br />
Scholar trips and mini-bus taxis are not subsidized.<br />
Subsidized services are in direct completion with taxi operations for the majority of the routes.<br />
Our Area, Our People, Our Institution and Service Delivery © <strong>Sedibeng</strong> <strong>District</strong> <strong>Municipality</strong> 2011/2012 IDP - All Rights Reserved Page|59