Office Insight - Jones Lang LaSalle
Office Insight - Jones Lang LaSalle
Office Insight - Jones Lang LaSalle

You also want an ePaper? Increase the reach of your titles
YUMPU automatically turns print PDFs into web optimized ePapers that Google loves.
<strong>Jones</strong> <strong>Lang</strong> <strong>LaSalle</strong> Americas Research • Boston <strong>Office</strong> <strong>Insight</strong> • Q2 2012 2<br />
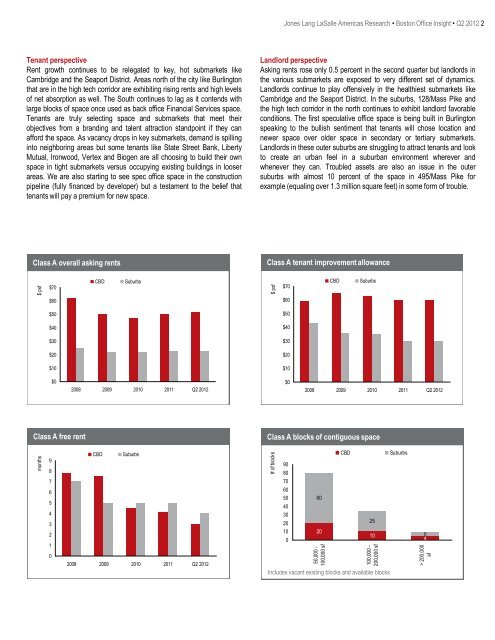
Tenant perspective<br />
Rent growth continues to be relegated to key, hot submarkets like<br />
Cambridge and the Seaport District. Areas north of the city like Burlington<br />
that are in the high tech corridor are exhibiting rising rents and high levels<br />
of net absorption as well. The South continues to lag as it contends with<br />
large blocks of space once used as back office Financial Services space.<br />
Tenants are truly selecting space and submarkets that meet their<br />
objectives from a branding and talent attraction standpoint if they can<br />
afford the space. As vacancy drops in key submarkets, demand is spilling<br />
into neighboring areas but some tenants like State Street Bank, Liberty<br />
Mutual, Ironwood, Vertex and Biogen are all choosing to build their own<br />
space in tight submarkets versus occupying existing buildings in looser<br />
areas. We are also starting to see spec office space in the construction<br />
pipeline (fully financed by developer) but a testament to the belief that<br />
tenants will pay a premium for new space.<br />
Landlord perspective<br />
Asking rents rose only 0.5 percent in the second quarter but landlords in<br />
the various submarkets are exposed to very different set of dynamics.<br />
Landlords continue to play offensively in the healthiest submarkets like<br />
Cambridge and the Seaport District. In the suburbs, 128/Mass Pike and<br />
the high tech corridor in the north continues to exhibit landlord favorable<br />
conditions. The first speculative office space is being built in Burlington<br />
speaking to the bullish sentiment that tenants will chose location and<br />
newer space over older space in secondary or tertiary submarkets.<br />
Landlords in these outer suburbs are struggling to attract tenants and look<br />
to create an urban feel in a suburban environment wherever and<br />
whenever they can. Troubled assets are also an issue in the outer<br />
suburbs with almost 10 percent of the space in 495/Mass Pike for<br />
example (equaling over 1.3 million square feet) in some form of trouble.<br />
Class A overall asking rents<br />
Class A tenant improvement allowance<br />
$ psf<br />
$70<br />
CBD<br />
Suburbs<br />
$ psf<br />
$70<br />
CBD<br />
Suburbs<br />
$60<br />
$60<br />
$50<br />
$50<br />
$40<br />
$40<br />
$30<br />
$30<br />
$20<br />
$20<br />
$10<br />
$10<br />
$0<br />
2008 2009 2010 2011 Q2 2012<br />
$0<br />
2008 2009 2010 2011 Q2 2012<br />
Class A free rent<br />
Class A blocks of contiguous space<br />
months<br />
9<br />
8<br />
7<br />
6<br />
5<br />
4<br />
3<br />
2<br />
1<br />
0<br />
CBD<br />
Suburbs<br />
2008 2009 2010 2011 Q2 2012<br />
# of blocks<br />
90<br />
80<br />
70<br />
60<br />
50<br />
40<br />
30<br />
20<br />
10<br />
0<br />
60<br />
20<br />
50,000 -<br />
100,000 sf<br />
CBD<br />
25<br />
10<br />
100,000 -<br />
200,000 sf<br />
Includes vacant existing blocks and available blocks<br />
Suburbs<br />
5<br />
4<br />
> 200,000<br />
sf