Australian Dairy Herd Improvement Report 2010.pdf
Australian Dairy Herd Improvement Report 2010.pdf
Australian Dairy Herd Improvement Report 2010.pdf

Create successful ePaper yourself
Turn your PDF publications into a flip-book with our unique Google optimized e-Paper software.
<strong>Australian</strong> <strong>Dairy</strong> <strong>Herd</strong><br />
<strong>Improvement</strong> <strong>Report</strong> 2010
ADHIS is an <strong>Australian</strong> <strong>Dairy</strong> Farmers Ltd initiative that receives<br />
the majority of its funding from <strong>Dairy</strong> Australia through the<br />
<strong>Dairy</strong> Services Levy.<br />
ADHIS acknowledges the contribution of the<br />
Victorian Department of Primary Industries.<br />
Enquiries<br />
ADHIS Pty Ltd ABN 97 006 475 378<br />
Level 2, Swann House<br />
22 William Street<br />
Melbourne Victoria 3000<br />
T 03 8621 4240<br />
F 03 8621 4280<br />
dabernethy@adhis.com.au<br />
www.adhis.com.au<br />
National <strong>Herd</strong> <strong>Improvement</strong> Association of Australia Inc. Reg No. A0008711E<br />
Unit 1/112 Synnot Street<br />
Werribee VIC 3030<br />
T 03 9742 7244<br />
F 03 9742 7696<br />
carol@nhia.org.au<br />
www.nhia.org.au<br />
Photo Acknowledgements: Thank you to all of the farmers who took time away from their businesses to enthusiastically<br />
participate in the photographs that appear in this report. Inside this report you will see Patrick Glass, Sue and Gavin Thorn,<br />
and Trevor and Leah Parish.<br />
Copyright ADHIS Pty Ltd 2010. All rights reserved ©.<br />
This <strong>Report</strong> is published for your information only. It is published with due care and attention to accuracy, but ADHIS and NHIA<br />
accept no liability if, for any reason, the information is inaccurate, incomplete or out of date whether negligent or otherwise.<br />
All intellectual property rights in <strong>Australian</strong> Breeding Values (ABV TM ) detailed in this publication are owned by ADHIS Pty Ltd.<br />
Neither the ABVs nor any part of this publication, may be reproduced without the prior written permission of ADHIS Pty Ltd.<br />
Permission to reproduce or copy will not be given by ADHIS Pty Ltd, where the proposed reproduction or copy may, in the sole<br />
opinion of ADHIS Pty Ltd, result in a use of the ABV, which is likely to mislead or confuse stakeholders in the <strong>Australian</strong> dairy<br />
industry.<br />
SUBS/BP/09-01
Contents<br />
2010 in Review .......................................................................................................................... 2<br />
NHIA Chairman’s report ........................................................................................................................................... 2<br />
ADHIS Chairman’s report ..........................................................................................................................................3<br />
NHIA activities ...............................................................................................................................................................4<br />
ADHIS activity report .................................................................................................................................................6<br />
ADHIS Board and Committees ...............................................................................................................................9<br />
Partner Projects .......................................................................................................................11<br />
InCalf ..............................................................................................................................................................................11<br />
Countdown Downunder ..................................................................................................................................... 13<br />
National <strong>Herd</strong> Recording Statistics 2009-2010 ...........................................................15<br />
2010 <strong>Australian</strong> Breeding Values ......................................................................................22<br />
<strong>Australian</strong> <strong>Dairy</strong> <strong>Herd</strong> <strong>Improvement</strong> <strong>Report</strong> 2010 1
2010 In Review<br />
NHIA Chairman’s report<br />
By Gordon Stewart<br />
NHIA Chairman<br />
History is made by asking the right question at the<br />
right time.<br />
Almost two years ago, at a National <strong>Herd</strong><br />
<strong>Improvement</strong> Association (NHIA) Member’s Forum<br />
in Shepparton, Victoria, the question was asked,<br />
“Are we doing a good enough job with dairy data in<br />
Australia and can we improve?”<br />
There was consensus that there was room for<br />
improvement in the way we organised dairy data<br />
and at that meeting the NHIA Working Group on<br />
<strong>Dairy</strong> Data was formed with a brief to investigate the<br />
matter further.<br />
Since that time, the Working Group has expended<br />
considerable time and effort in pursuit of the goal<br />
of building industry consensus on a way forward.<br />
On behalf of NHIA members, I would like to express<br />
my gratitude to the Group for its dedication and<br />
hard work. Ably led by Dr Matthew Shaffer (Holstein<br />
Australia) as Chairman, the Group also included<br />
Daniel Abernethy (ADHIS), Leon Giglia (Farmwest),<br />
Peter Van Elzakker (BOS Trading) and NHIA General<br />
Manager, Carol Millar.<br />
Significant financial investment<br />
Some may ask why NHIA would get involved in this<br />
project but, in my view, the answer is obvious.<br />
One of NHIA’s five Statements of Purpose is to “lead<br />
the continual development of the herd improvement<br />
industry” and there is no better place for us to display<br />
leadership than in the area of dairy data, which has<br />
an enormous role to play in the businesses of our<br />
members and their farmer customers.<br />
To this end, the Working Group identified the need<br />
to engage an independent consultant to carry out<br />
a stocktake of the current arrangements for dairy<br />
data in Australia, and establish the case for strategic<br />
improvement and identify options for the future.<br />
The NHIA Board stepped up to the plate and dug<br />
deep into Association resources in order to fund the<br />
consultant’s report.<br />
At this point, we must also acknowledge Holstein<br />
Australia financial support for this report, for which<br />
we are most grateful.<br />
Both organisations have had the courage to “put<br />
their money where their mouth is” and the result is<br />
<strong>Report</strong> for NHIA <strong>Dairy</strong> Industry Data Project which was<br />
released in July 2010.<br />
This report represents the most comprehensive<br />
study of the dairy data situation ever undertaken<br />
in Australia. In addition, it was made available to<br />
any person or organisation with an interest in dairy<br />
data. This openness and transparency has been a<br />
characteristic of all the endeavors of the NHIA and its<br />
Working Group. The report remains available for use<br />
by the entire dairy industry.<br />
<strong>Dairy</strong> data has many uses<br />
Genetic evaluation and the production of <strong>Australian</strong><br />
Breeding Values (ABVs) is an obvious benefit of the<br />
data collected from tested herds, but there are others.<br />
There is an important farm benefit in being able<br />
to individually identify cows and monitor their<br />
performance, whether farmers are feeding for<br />
production, using cell count information to earn<br />
a premium milk price or deciding which cows to<br />
cull or sell. Farmers who herd test understand the<br />
enormous value of this data and how they can use<br />
this knowledge to generate greater profit.<br />
There is also a collective benefit in gathering<br />
data from as many farms as possible so we can<br />
understand trends in the dairy industry. It is vital to<br />
industry leaders making strategic decisions about<br />
future priorities. The more data available, the more<br />
informed decisions can be made about industry<br />
priorities. This applies to setting dairy research<br />
priorities, monitoring food safety and milk quality,<br />
and for animal welfare and bio-security.<br />
The whole way through the supply chain from farm<br />
to factory to boardrooms, more data means greater<br />
knowledge and better decisions. In turn, this means<br />
greater value and profit to all in the dairy industry.<br />
2 <strong>Australian</strong> <strong>Dairy</strong> <strong>Herd</strong> <strong>Improvement</strong> <strong>Report</strong> 2010
2010 In Review<br />
ADHIS Chairman’s report<br />
We have all heard it said that ‘the only constant<br />
is change’. Unpredictable weather, new policy<br />
environments, novel robotic technology, and<br />
access to a world of information from any location<br />
can change how we do business. In the world of<br />
genetics, change is quick but the focus of ADHIS is<br />
to ensure that change maximises the opportunities<br />
for farmers to benefit. It’s about building the tools<br />
that will lead to better breeding outcomes and lift<br />
the capacity of the herd to perform.<br />
One of the most important changes at ADHIS was<br />
the implementation of a new <strong>Australian</strong> Profit<br />
Ranking (APR) in April. The APR which is used to<br />
rank bulls was put under the spotlight and reviewed<br />
by both scientists and industry. The updated APR<br />
emphasises important traits such as longer lasting<br />
cows, more mastitis resistance and improved<br />
fertility.<br />
Building good herds starts with easy access to<br />
independent, objective information presented in<br />
the way that suits the needs of individual farmers.<br />
This is why ADHIS developed the Good Bulls Guide.<br />
It’s a super quick way to use the best bulls available<br />
to give genetics a boost in your herd. ADHIS will<br />
send it to your mailbox twice a year so it’s within<br />
reach when it’s time for you to pick the next team of<br />
bulls.<br />
The world of genomics is opening before us. After<br />
significant industry investment, ADHIS is now<br />
capable of producing genomic based breeding<br />
values using data collected from a tiny hair sample.<br />
The technology is incredibly exciting but we’re<br />
still not finished. Launched this year, the <strong>Dairy</strong><br />
Futures CRC brings together government, industry<br />
and the research community to explore genomic<br />
developments that ADHIS will be able to deliver to<br />
dairy farmers in years to come.<br />
I would like to take this opportunity, on behalf<br />
of the Board of ADHIS, to thank bull breeding<br />
companies, herd recording centres, breed societies,<br />
the <strong>Dairy</strong> Extension Centre, the National Centre for<br />
<strong>Dairy</strong> Education – Australia and the Department of<br />
Primary Industries – Victoria for their support and<br />
input over this past year as well as <strong>Dairy</strong> Australia<br />
for their significant financial support of the new<br />
initiatives ADHIS has delivered.<br />
The coming year holds exciting opportunities. The<br />
Board of ADHIS continues to work on behalf of<br />
farmers to make sure you get access to the world of<br />
genetic opportunities in a way that is relevant<br />
to you.<br />
By Wes Judd<br />
ADHIS Chairman<br />
<strong>Australian</strong> <strong>Dairy</strong> <strong>Herd</strong> <strong>Improvement</strong> <strong>Report</strong> 2010 3
2010 In Review<br />
NHIA activities<br />
By Carol Millar<br />
NHIA General<br />
Manager<br />
The <strong>Dairy</strong> Industry Data Project <strong>Report</strong> 2010 is a<br />
landmark publication for the herd improvement<br />
industry and represents the most comprehensive<br />
examination of the state of dairy data ever done in<br />
Australia. For that reason, it is worthwhile to review<br />
the contents of this report which was prepared by<br />
independent consultancy firm, GHD.<br />
Context<br />
“We believe that the time is right for the <strong>Australian</strong><br />
dairy industry to make a significant effort to adopt a<br />
dairy data system that is world’s best practice, which<br />
enables dairy farmers to make informed and timely<br />
management decisions on their farms,”<br />
Dr Shaffer, NHIA Working Group Chairman<br />
There is an overwhelming consensus between<br />
dairy industry stakeholders that the way dairy<br />
data is currently exchanged limits potential<br />
productivity gains from herd improvement for the<br />
<strong>Australian</strong> dairy industry.<br />
The profitability and international<br />
competitiveness of the <strong>Australian</strong> dairy industry<br />
depends on a continual improvement in dairy<br />
herd data. The industry has made a substantial<br />
investment to build a body of high-quality<br />
scientific knowledge with the expectation<br />
that this will underpin decisions regarding the<br />
selection of desirable traits.<br />
Repositioning dairy data exchange into a<br />
pre-competitive setting is essential to support<br />
research, improve genetic evaluation and<br />
underpin information product innovation across<br />
the industry to realise productivity gains through<br />
better on-farm decision making. This report has<br />
found that Australia could achieve gains of<br />
$10-$50 million during the next 10 years if<br />
farm-level data management was improved.<br />
Key Issues<br />
Five main drivers that are both supporting and,<br />
in some cases, inhibiting improvements in dairy<br />
data collection, transfer and access are identified<br />
in the report. These are: better decision-making<br />
information; sustaining genetic evaluation data<br />
flows; rationalisation; innovation and technology;<br />
and regulatory and market compliance.<br />
The report identifies three value chains for dairy<br />
data: herd recording; breeding, fertility and<br />
herd management; and food and safety/quality<br />
and environment, for which challenges and<br />
opportunities are identified. Many of the existing<br />
gaps and issues identified are concerned mainly<br />
with the quality and quantity of data, particularly<br />
relating to collection and integration.<br />
The main challenges identified include:<br />
• lack of industry leadership to address data issues<br />
and realise productivity gains;<br />
• multiple animal ID processes and numbers with<br />
calls for implementing a unique recognised<br />
animal ID system;<br />
• gaps in data, value-adding constrained;<br />
• fragmented systems, difficulties in data transfer<br />
and sharing;<br />
• less than optimal data collection processes and<br />
adoption of new technologies;<br />
• reduced data flow through the data value chains;<br />
• improvements in reliability of genetic evaluation;<br />
• data not valued by all stakeholders; and<br />
• incentives for data collection not aligned with<br />
benefits of data use.<br />
These challenges present opportunities to the<br />
industry for improvement in dairy data collection,<br />
transfer and access. These opportunities can be<br />
pursued and challenges addressed by a mixture<br />
of education; regulation push and market pull to<br />
establish the elements of a desirable system as<br />
outlined by stakeholders.<br />
4 <strong>Australian</strong> <strong>Dairy</strong> <strong>Herd</strong> <strong>Improvement</strong> <strong>Report</strong> 2010
2010 In Review<br />
Options<br />
Four scenarios were modelled in this report. These<br />
scenarios are based on the level of which two key<br />
variables impact on the dairy data: market forces<br />
and the level of intervention. The purpose of the<br />
scenarios is to provide strategic insight and test their<br />
ability to realistically improve data management in<br />
the dairy industry to identify a preferred pathway.<br />
The four scenarios tested are:<br />
1. Laissez faire – market drives rationalisation<br />
and increasing demand for better information<br />
products from herd data.<br />
2. Standards-drive approach – focus on<br />
standardisation and data flow<br />
3. Centralised data repository – builds on Scenario<br />
2 by establishing a pre-competitive herd testing/<br />
data approach through the development of a<br />
national data repository.<br />
4. Full integration – builds on Scenario 3 by<br />
establishing a single unified data architecture<br />
and software system.<br />
Recommendations<br />
Scenario 3 (centralised data repository) will provide<br />
the best outcome through combining an industryowned<br />
data repository with extension services<br />
and the standards-based approach of Scenario<br />
2, to address both the leadership and technical<br />
issues associated with dairy data. This scenario is<br />
considerably more than enhancement of the current<br />
system because it requires equity, participation and<br />
commitment from all stakeholders to be effective.<br />
A staged approach progressively designing, testing<br />
and implementing the components is proposed.<br />
It is recommended that the Data Working Group<br />
continue to drive this initiative to oversee the key<br />
tasks required.<br />
The implementation of Scenario 3 requires the<br />
establishment of three components; national data<br />
network, data repository and extension services;<br />
integrated through a strategic plan and underlying<br />
business model. This report has included a detailed<br />
description of the key tasks, risk analysis and<br />
timelines that need to be undertaken to implement<br />
Scenario 3 and create a centralised data repository.<br />
<strong>Australian</strong> <strong>Dairy</strong> <strong>Herd</strong> <strong>Improvement</strong> <strong>Report</strong> 2010 5
▲<br />
2010 In Review<br />
ADHIS activity report<br />
By Daniel Abernethy,<br />
ADHIS General<br />
Manager<br />
The <strong>Australian</strong> <strong>Dairy</strong> <strong>Herd</strong> <strong>Improvement</strong> Scheme<br />
(ADHIS) aims to maximise the opportunity<br />
for <strong>Australian</strong> dairy farmers to profit through<br />
independent, world-leading dairy genetic<br />
improvement services.<br />
For more than 25 years, ADHIS has continually<br />
improved its processes to enable farmers to<br />
confidently select animals knowing that <strong>Australian</strong><br />
Breeding Values (ABVs) are the best estimate of an<br />
animal’s genetic merit under local conditions. This<br />
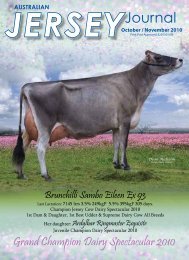
year, key developments were implemented across<br />
each of its core work areas (see Figure 1). This report<br />
describes the year’s key initiatives. Table 1 gives a full<br />
list of developments.<br />
APR Review<br />
ADHIS produces ABVs to provide farmers with<br />
objective data to improve their herds. Table 2 gives<br />
the calendar of 2010 ABV release activities. The most<br />
significant change was the update of the <strong>Australian</strong><br />
Profit Ranking (APR).<br />
)<br />
▲<br />
▲<br />
National<br />
Database<br />
and Data<br />
Services<br />
Genetic<br />
Evaluation<br />
▲<br />
Figure 1 ADHIS focuses on three core areas<br />
The APR is a single index that reflects nine traits that<br />
influence net farm profitability, including production<br />
(milk, fat and protein yields) and non-production<br />
traits. Non-production traits include survival<br />
(longevity), fertility, somatic cell count, liveweight (as<br />
an indicator of efficiency), temperament and milking<br />
speed. Type traits and likeability are used to estimate<br />
some of the non-production traits.<br />
The contribution of each trait towards the final<br />
APR value is ‘weighted’ according to its relative<br />
▲<br />
)<br />
)<br />
▲<br />
Industry<br />
Extension and<br />
Education<br />
Services<br />
Table 1: Summary of 2010 Developments<br />
Development Activity Impact<br />
New <strong>Australian</strong> Profit<br />
Ranking<br />
Genomic evaluation<br />
system and associated<br />
services<br />
Good Bulls Guide<br />
Electronic NASIS<br />
system<br />
NASIS updates<br />
Active bull tool<br />
DIF Converter<br />
ADHIS website<br />
re-fresh<br />
After two years of research and consultation, the new APR<br />
formula was implemented.<br />
New science together with required IT systems implemented to<br />
enable the production of genomic based breeding values.<br />
New publication providing breeding values of bulls organised by<br />
commonly selected traits (breeding objectives).<br />
A new web-based registration for AI bulls was implemented in<br />
July 2010 to improve accuracy of the bull file.<br />
The NASIS file is updated weekly and web searches use the latest<br />
NASIS data<br />
A new web-based tool enables bull companies to better manage<br />
the active status of their bulls.<br />
A new tool to convert data interchange format (DIF) files to<br />
Microsoft Excel.<br />
The layout and menu structure of the website have been<br />
improved.<br />
The new APR increases emphasis on longevity,<br />
fertility and mastitis resistance.<br />
Improved rate of genetic gain through greater<br />
selection pressure of young sires and, in time, bull<br />
dams.<br />
Farmers are able to breed better herds using<br />
better bulls in the least confusing way.<br />
Faster and more efficient registration of NASIS<br />
bulls.<br />
Direct access to the latest NASIS information<br />
Farmers can more easily identify bulls for which<br />
semen is available.<br />
Data users can more quickly access industry data<br />
for analysis.<br />
Web users can access a greater variety of information<br />
in a more user-friendly environment.<br />
6 <strong>Australian</strong> <strong>Dairy</strong> <strong>Herd</strong> <strong>Improvement</strong> <strong>Report</strong> 2010
2010 In Review<br />
Table 2: 2010 calendar of ABV releases<br />
activities<br />
January<br />
ABV(i) release<br />
April<br />
ABV and ABV(i) release<br />
August<br />
ABV and ABV(i) release<br />
September ABV(g) unofficial release to<br />
participating bull companies<br />
December ABV(i) release<br />
ABV(g) unofficial release to<br />
participating bull companies<br />
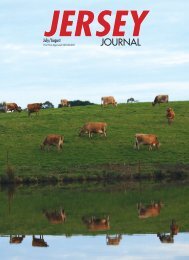
Predicted response to selecon over<br />
10 years (unit of measure)<br />
35<br />
30<br />
25<br />
20<br />
15<br />
10<br />
5<br />
0<br />
Protein yield (kg)<br />
Fat yield (kg)<br />
Survival (Longevity) (%)<br />
Daughter Ferlity (%)<br />
Mass Resistance (%)<br />
Live Weight (kg)<br />
Milking Speed (%)<br />
Temperament (%)<br />
Figure 2: Predicted<br />
response to selection<br />
based on updated<br />
APR over 10 years.<br />
contribution to profitability and the relationship that<br />
exists between traits.<br />
Since its introduction in 2001, the APR has proven<br />
to be both an accurate and reliable index of a<br />
sire’s potential genetic contribution to dairy farm<br />
profitability. However, periodic updates are required<br />
to account for the changing farming environment<br />
including milk prices and input/output costs.<br />
Over the past two years, ADHIS facilitated a scientific<br />
review and industry consultation process that<br />
concluded with a decision to change the APR. From<br />
April 2010, the APR is calculated with an updated<br />
formula which places more emphasis on daughter<br />
fertility, survival and mastitis resistance with a<br />
slight reduction in emphasis on production traits<br />
compared to the previous formula. Figure 2 shows<br />
the expected genetic trends in eight traits resulting<br />
from bull selection based on APR.<br />
A change in selection pressure for different traits<br />
ultimately results in the re-ranking of bulls. This<br />
minor re-ranking which favours bulls superior in<br />
fertility and survival will be seen by farmers when<br />
making bull selection decisions.<br />
Genomic Based Breeding Values<br />
For the first time in Australia, ADHIS produced<br />
genomic based breeding values for bulls in<br />
September and December 2010. Following standard<br />
protocols in releasing new breeding values, ADHIS<br />
released unofficial ABV(g)s initially to bull owners<br />
who submitted samples for genotyping followed<br />
by wider distribution. The first official public release<br />
remains scheduled for April 2011.<br />
Genomics improves the reliability of ABVs for young<br />
bulls. Some 2,381 Holstein bulls were included in<br />
the September 2010 analysis (2,193 reference bulls<br />
and 188 young bulls). In this group of 188 young<br />
bulls with almost no daughter performance data, an<br />
improvement in reliability across all key trait areas is<br />
evident. Table 3 shows the improvement in reliability<br />
from their traditional ABV (based mostly on parent<br />
average) with their ABV(g) which includes genomic<br />
data.<br />
Now that a new type of breeding value is being<br />
published, farmers and industry will begin to<br />
notice a new term in use. ABV(g)s are published for<br />
unproven bulls based on genomic and pedigree<br />
data as shown in Table 4. ABV(g)s are expressed in<br />
Table 3: <strong>Improvement</strong> in reliability using<br />
genomics<br />
<strong>Improvement</strong> in reliability<br />
between ABV (parent average)<br />
and ABV(g) for 188 bulls<br />
Production traits From 21% to 53%<br />
Overall type From 14% to 42%<br />
Fertility From 8% to 36%<br />
Survival From 12% to 46%<br />
<strong>Australian</strong> <strong>Dairy</strong> <strong>Herd</strong> <strong>Improvement</strong> <strong>Report</strong> 2010 7
2010 In Review<br />
Table 4 A summary of ABVs, ABV(i)s and ABV(g)s<br />
ABV(g) ABV(i) ABV<br />
Unproven bulls Interbull breeding values Proven bulls<br />
Breeding values<br />
based on genomic<br />
and pedigree data.<br />
AUGUST 2010<br />
THE<br />
Good Bulls<br />
G UIDE<br />
THE<br />
Good Bulls<br />
G UIDE<br />
THE<br />
Good Bulls<br />
G UIDE<br />
THE<br />
GOOD<br />
BULLS<br />
G UIDE<br />
THE<br />
GOOD<br />
BULLS<br />
G UIDE<br />
THE<br />
GOOD<br />
BULLS<br />
G UIDE<br />
Breeding values for bulls<br />
proven overseas with<br />
insufficient <strong>Australian</strong><br />
daughter performance<br />
information.<br />
the same way as ABVs and ABV(i)s to make it easy to<br />
compare animals.<br />
ADHIS, <strong>Dairy</strong> Australia, the <strong>Dairy</strong> Futures CRC,<br />
DPI-V and Genetics Australia continue to invest in<br />
genomic technology. Further research to improve<br />
the reliability and accessibility of this technology<br />
continues to provide farmers with the opportunity<br />
to gain further benefits from improved genetic gain.<br />
Good Bulls Guide<br />
Breeding values utilising<br />
<strong>Australian</strong> milking daughter<br />
information.<br />
Meet publishable<br />
requirements for<br />
production, type and<br />
workability.<br />
Selecting bulls to breed better dairy herds is now<br />
easier than ever, with the release of the Good Bulls<br />
Guide by the <strong>Australian</strong> <strong>Dairy</strong> <strong>Herd</strong> <strong>Improvement</strong><br />
Scheme (ADHIS) in August.<br />
Produced twice a year, the Good Bulls Guide lists<br />
available bulls that are above average for profit.<br />
Within the Guide are lists of trait leaders for<br />
traits such as type, longevity, mastitis resistance,<br />
production and profit. These traits have been<br />
selected as they are common breeding objectives<br />
reported by farmers. Bulls of higher reliability are<br />
identified separately.<br />
As the Good Food Guide directs consumers<br />
interested in a good night out to tried and tested<br />
eateries, the Good Bulls Guide directs farmers to<br />
‘highly recommended’ bulls.<br />
Farmers are encouraged to simply pick the table that<br />
reflects the needs of their herd with confidence that<br />
the genetic potential of the herd will be improved.<br />
The Good Bulls Guide includes bulls from every<br />
company and from both Australia and overseas.<br />
Each bull is listed with its relevant breeding values<br />
and reliability.<br />
Those farmers who wish to make more detailed<br />
comparisons of bulls can continue to use Selectabull<br />
and detailed bull pages available on the ADHIS<br />
website.<br />
The Good Bulls Guide will be published twice a<br />
year in line with the April and August releases of<br />
<strong>Australian</strong> Breeding Values (ABVs). The Good Bulls<br />
Guide is delivered to all dairy farmers.<br />
Selectabull Workshops<br />
In partnership with the <strong>Dairy</strong> Extension Centre,<br />
ADHIS has delivered a total of nineteen Selectabull<br />
workshops throughout Victoria and South Australia<br />
in 2010. During the workshops, participants develop<br />
or refine breeding objectives for their herd and learn<br />
to use the simple web-based Selectabull tool in a<br />
supervised and supported environment.<br />
An evaluation of the Selectabull workshops has<br />
revealed a high degree of satisfaction with the<br />
program. Participants reported that the most useful<br />
components of the Selectabull program were<br />
the ability to find bulls that suited the particular<br />
requirements of their herd, and the speed at which<br />
this could be done. The variety of bulls identified,<br />
the flexibility to investigate alternatives and the<br />
independence of the information were all valued.<br />
Almost without exception, participants recorded<br />
that at the conclusion of the workshop they were<br />
confident in using Selectabull, and felt comfortable<br />
navigating through the program. They were<br />
satisfied with the breeding objective they had<br />
developed and understood the role of genetics<br />
in their herd better, and they understood the<br />
information services provided by the ADHIS and had<br />
a better understanding of ABVs at the conclusion<br />
of the workshop. A pleasing eighty-six per cent of<br />
participants reported that they planned to use the<br />
program when next making semen purchasing<br />
decisions.<br />
As the partnership with the <strong>Dairy</strong> Extension Centre<br />
continues into 2011, further workshops will be<br />
scheduled across numerous locations.<br />
8 <strong>Australian</strong> <strong>Dairy</strong> <strong>Herd</strong> <strong>Improvement</strong> <strong>Report</strong> 2010
2010 In Review<br />
ADHIS Board and Committees<br />
ADHIS Pty Ltd Board of<br />
Management<br />
The Board met six times during the year to progress<br />
ADHIS’s Strategic Plan, including implementation<br />
of the new Australia Profit Ranking, genomics and<br />
extension activities.<br />
Members: Wes Judd (Chairman), Peter Aldridge,<br />
John Harlock, Stewart McRae, Stuart Tweddle,<br />
Ian Carkeek (retired December 2010),<br />
Lyndon Cleggett (appointed December 2010),<br />
Ivan Jones, Daniel Abernethy (General Manager<br />
and Secretary).<br />
ADHIS Staff<br />
Kon Konstantinov,<br />
Statistician<br />
Judith Schweitzer,<br />
Information Scientist<br />
Daniel Abernethy, ADHIS General Manager<br />
Sally Bernardo, Executive Assistant<br />
Genetic Evaluation<br />
National Data and Database Service<br />
Gert Nieuwhof, Geneticist and Team Leader<br />
Paul Koh,<br />
Data and Services Manager<br />
Erica Jewell,<br />
Data and Services Manager<br />
Education and<br />
Extension<br />
Michelle Axford,<br />
Project Leader<br />
Adam Daniel,<br />
Project Officer<br />
<strong>Australian</strong> <strong>Dairy</strong> <strong>Herd</strong> <strong>Improvement</strong> <strong>Report</strong> 2010 9
2010 In Review<br />
Industry Consultation<br />
Annual Stakeholder Meeting<br />
Effective industry consultation is an underpinning<br />
element of the ADHIS Strategic Plan. ADHIS achieves<br />
industry consultation across its activity areas<br />
through its committees, specific meetings with<br />
individuals and organisations and the annual ADHIS<br />
stakeholder meeting.<br />
The annual stakeholder meeting gathers a larger<br />
stakeholder group to provide strategic advice and<br />
input to the Board of ADHIS. This year’s stakeholder<br />
meeting was held in July 2010 where representatives<br />
of AB Companies, data processing centres, semen<br />
resellers, state dairy organisations, farmers and the<br />
ADHIS Board were invited to discuss genomics,<br />
extension activities and were introduced to the<br />
<strong>Dairy</strong> Futures Co-operative Research Centre.<br />
In addition to this, ADHIS hosted a number of<br />
technical industry meetings specifically for AB<br />
company and breed society managers to report<br />
on recent research and discuss future initiatives.<br />
These meetings provide ADHIS with a forum to<br />
discuss genetics in detail and provide a forum<br />
for open discussion. The technical meetings were<br />
implemented after a review of communication<br />
activities aimed at improving stakeholder<br />
engagement.<br />
Genetics Committee<br />
Members<br />
Prof Mike Goddard (Chairman, University of<br />
Melbourne), Assoc Prof Julius Van der Werf<br />
(University of New England), Dr. Bruce Tier<br />
(University of New England), Dr. Rob Woolaston, Dr<br />
Mekonnen Haile-Mariam (University of Melbourne),<br />
Dr Kevin Beard (ADHIS Consultant), Dr Gert<br />
Nieuwhof (ADHIS), Dr Kon Konstantinov (ADHIS),<br />
Daniel Abernethy (ADHIS)<br />
The Genetics Committee brings together scientists<br />
from a number of organisations to review genetic<br />
developments within ADHIS. Further support to this<br />
committee is gratefully received from Dr Gerhard<br />
Moser, Prof. Herman Raadsma, Dr Jennie Pryce, Dr<br />
Phil Bowman and Assoc Prof. Ben Hayes.<br />
Records Standards Committee<br />
Members<br />
Mr Ivan Jones (ADHIS, Chairman), Mr John Stevenson<br />
(<strong>Dairy</strong> Express), Mr Peter Nish (Tasherd), Mr Frank<br />
Treasure (HISWA and CHISWA), Dr Mike Larcombe<br />
(Mistro Group), Mr David Parkinson (AUSherd) and<br />
Dr Gert Nieuwhof (ADHIS), Mr Paul Koh (ADHIS), Mr<br />
Daniel Abernethy (ADHIS)<br />
This Records Standards Committee provides<br />
representatives from data processing centres<br />
a forum to discuss data issues relating to herd<br />
improvement records and genetic evaluation.<br />
Type Assessment Committee<br />
On an annual basis, meetings are held with Holstein<br />
Australia and Jersey Australia that are the two<br />
breed societies that provide linear type data to<br />
ADHIS. Linear Type Evaluations for the coming<br />
year are reviewed with improvements made to the<br />
organisational aspects of data collection which<br />
should improve the amount of data collected.<br />
Education and Extension Reference<br />
Group<br />
Members<br />
Mr Stuart Tweddle (Chairman), Mr Ian Carkeek<br />
(ADHIS), Mr Stewart McRae (ADHIS), Mr Mick Blake<br />
(<strong>Dairy</strong> Australia), Mr Peter Thurn (Genetics Australia),<br />
Mr Bruce Ronalds (ABS Australia), Ms Carol Millar<br />
(NHIA), Mr Daryl Hoey (ADF), Dr John Penry (Rural<br />
Innovation Research Group), Ms Joanne Campbell<br />
(ADHIS consultant), Rebecca Dickson (NCDEA),<br />
Ms Ann McDowell (DEC), Mr Darold Klindworth<br />
(DEC), Dr Matt Shaffer (Holstein Australia), Adam<br />
Daniel, (ADHIS), Michelle Axford (ADHIS) and Daniel<br />
Abernethy (ADHIS).<br />
This committee did not formally meet during 2010<br />
however significant consultation occurred with<br />
key stakeholders including AB companies, breed<br />
societies, <strong>Dairy</strong> Extension Centre and National<br />
Centre for <strong>Dairy</strong> Education throughout the year with<br />
the APR update, Selectabull and Good Bulls Guide<br />
dominating discussion.<br />
10 <strong>Australian</strong> <strong>Dairy</strong> <strong>Herd</strong> <strong>Improvement</strong> <strong>Report</strong> 2010
Partner Project<br />
AI use on dairy farms<br />
Genetic selection enables dairy farmers to breed<br />
herds that perform profitably in <strong>Australian</strong><br />
conditions.<br />
Farmers usually improve the genetic merit of their<br />
milking herds using artificial insemination (AI). This<br />
year’s ADHIS data again demonstrates that cows<br />
born to AI out-perform naturally bred cows (Table 1).<br />
Reaping the benefits of this increased production<br />
and cow longevity does, however, rely on getting<br />
the cows in calf to AI (Figure 1).<br />
The dairy industry is investing heavily in technology<br />
that enables farmers to accelerate genetic gain<br />
in their herds. To capitalise on this investment,<br />
industry must ensure the appropriate support is<br />
available to help farmers increase the proportion of<br />
AI-born calves in their herds. This requires a good<br />
understanding of the use of AI on <strong>Australian</strong> dairy<br />
farms. Here is an overview of what is known now:<br />
Extent of AI use<br />
• About 84% of dairy herds use AI (Figure 2),<br />
although the figure is lower for year-round calving<br />
herds (Figure 3) and small herds (Figure 4). 1<br />
• InCalf estimates that about one million cows are<br />
inseminated in Australia each year.<br />
• However, the extent of the use of AI within herds<br />
is not known. ADHIS data suggests about 70% of<br />
cows in milk recording herds are AI progeny. 2<br />
A significant jump in production is seen when<br />
more than 40% of cows in the herd are AI<br />
progeny. 2<br />
Table 1: Cows that are AI progeny on average<br />
have a higher production (566,029 cows). 2<br />
Production averages AI progeny Not AI progeny<br />
Milk 6143 L 5508 L<br />
Fat 279 kg 255 kg<br />
Protein 230 kg 210 kg<br />
Who does the AI<br />
• Of the herds that use AI, almost a third (31%)<br />
exclusively use professional AI services. 1 The<br />
other two-thirds of herds do some or all of their<br />
own inseminations (DIY).<br />
• DIY is even more prevalent in year-round calving<br />
herds (Figure 3 ). 1<br />
Don't AI<br />
16%<br />
Mix of<br />
both 7%<br />
Use professional<br />
AI service 26%<br />
Do-it-yourself<br />
operators 51%<br />
Dr Barry Zimmermann<br />
InCalf Project Leader<br />
Level 2, Swann House<br />
22 William Street,<br />
Melbourne Vic 3000<br />
03 9620 7283<br />
bzimm@incalf.com.au<br />
Figure 2: Most herds use AI .<br />
Every choice<br />
of sire is a<br />
good one<br />
Calves born have chosen genetics<br />
These sires used<br />
every cow, every<br />
joining<br />
Cows and<br />
heifers get<br />
in calf<br />
Heifers with desired genetics<br />
are in the milking herd<br />
Heifers enter<br />
the herd<br />
Heifers stay at<br />
least 2 lactations<br />
Figure 1: A pathway for breeding dairy herds that perform in <strong>Australian</strong> conditions.<br />
Footnotes:<br />
1. 2010 National <strong>Dairy</strong><br />
Farmer Survey<br />
2. <strong>Australian</strong> <strong>Dairy</strong> <strong>Herd</strong><br />
Recording Statistics<br />
2009/2010<br />
<strong>Australian</strong> <strong>Dairy</strong> <strong>Herd</strong> <strong>Improvement</strong> <strong>Report</strong> 2010 11
Partner Project<br />
• Up to six different operators do the inseminations<br />
in some herds, although it is commonly one or<br />
two people in herds with fewer than 600 cows<br />
and two or three people in the larger herds.<br />
• Thousands of DIY operators inseminated cows on<br />
<strong>Australian</strong> dairy farms last year. The conception<br />
rate varies significantly by technician. Many DIY<br />
inseminators achieve conception rates 5-15%<br />
lower than professional technicians. 3<br />
AI training and refreshers<br />
• Across Australia about 26% of DIY inseminators<br />
have done an AI or refresher course in the past two<br />
years. 1 More herds in NSW and western Victoria<br />
have had some people from the farm participate<br />
than other regions.<br />
Just small changes in methods of semen storage and<br />
handling, operator technique or farm insemination<br />
protocols can often improve performance on farm.<br />
Benefits of doing AI right on farms<br />
Immediate<br />
• Genetic gain from AI calves<br />
• Fewer cows to mop up at<br />
the end of AI, so fewer bulls<br />
needed<br />
• Fewer late calving or carryover<br />
cows<br />
• Fewer cows culled because<br />
they are not in calf<br />
Over several seasons<br />
• Higher producing, more<br />
profitable herds<br />
• Cows stay in herd for longer:<br />
more heifers to sell and<br />
more culling options<br />
Given that 73% of dairy farmers are currently<br />
keeping all the heifers they breed, 1 the potential<br />
to make significant gains from using AI over a few<br />
seasons is very high.<br />
InCalf’s AI: Do-It-Right on-farm refresher and<br />
practical guide on heat detection, Cows in Colour,<br />
can help farmers increase the numbers of AI calves<br />
born in their herd. These can be obtained from<br />
www.incalf.com.au.<br />
Number of herds<br />
Number of herds<br />
400<br />
300<br />
200<br />
53<br />
140<br />
Don't AI Professional DIY<br />
39<br />
65<br />
98<br />
23<br />
400<br />
300<br />
200<br />
106 36<br />
87<br />
118<br />
Don't AI Professional DIY<br />
100<br />
0<br />
169<br />
200<br />
216<br />
Seasonal Split Year-round<br />
Calving system<br />
100<br />
0<br />
233 232<br />
Less than<br />
200 cows<br />
11<br />
35<br />
65<br />
2<br />
2<br />
16 5<br />
27 28<br />
200-399 400-599 600-799 800 cows<br />
or more<br />
<strong>Herd</strong> size<br />
Figure 3: AI is used extensively in all<br />
calving systems (1003 survey herds). 1<br />
Figure 4: AI use tends to increase<br />
with herd size (1003 survey herds). 1<br />
Footnote:<br />
3. The original InCalf<br />
research 1996-1998<br />
12 <strong>Australian</strong> <strong>Dairy</strong> <strong>Herd</strong> <strong>Improvement</strong> <strong>Report</strong> 2010
Partner Project<br />
Mastitis Focus on clinical cases<br />
The <strong>Australian</strong> dairy industry’s ongoing success in<br />
domestic and international markets depends on the<br />
supply of top quality milk.<br />
Milk cell counts, which are an important component<br />
of milk quality, increase when cows have clinical or<br />
subclinical mastitis. Maintaining milk quality relies<br />
on good mastitis control on dairy farms – there is no<br />
‘fix’ in the manufacturing process.<br />
Although there is no way of knowing what the rate<br />
of clinical cases is in Australia or whether it has<br />
changed significantly over time, 43% of farmers<br />
responding to a poll of issues around milk quality<br />
in 2010 expressed concerns about the number or<br />
management of clinical cases in their herds<br />
(Figure 1). Having to find and treat clinical mastitis is<br />
a major source of frustration and expense for dairy<br />
farmers, especially in early lactation. Any disruption<br />
to the milking routine and increase in workload at<br />
such a busy time is very unwelcome.<br />
A key to avoiding mastitis outbreaks is to find and<br />
treat clinical cases early. So how do farmers know<br />
when they need to be taking extra measures to find<br />
cases as early as possible?<br />
The average Bulk Milk Cell Count of <strong>Australian</strong> dairy herds<br />
was 214,000 cells/mL for the 2009 calendar year. This<br />
measure was calculated using the International <strong>Dairy</strong><br />
Federation recommended method.<br />
Mastitis becomes a problem for herds when the<br />
level or rate of spread of infection is too high. The<br />
recommended triggers for taking action are when<br />
there are:<br />
• Bulk Milk Cell Counts above 250,000 cells/mL; or<br />
• 5 clinical cases per 100 cows in the 30 days after<br />
calving; or<br />
• 2 clinical cases per 100 cows per month during<br />
lactation; or<br />
• 5 new infections per 100 cows in milk.<br />
On most farms Bulk Milk Cell Counts and clinical<br />
case numbers provide a general guide to the<br />
mastitis status of the herd. Following the release<br />
of the Mastitis Focus <strong>Report</strong> 18 months ago, a more<br />
sophisticated understanding of what is happening<br />
in the key mastitis management areas is now readily<br />
available to dairy farmers and their advisers.<br />
Dr John Penry<br />
Project Leader<br />
Countdown<br />
Downunder<br />
Level 2, Swann House,<br />
22 William Street,<br />
Melbourne Vic 3000<br />
03 9620 7283<br />
john@camperdownvet.<br />
com.au<br />
Cell count<br />
control 39%<br />
Treatment<br />
effectiveness 12%<br />
Cell count<br />
control 39%<br />
t of<br />
tment 11%<br />
Other<br />
37%<br />
Cost of<br />
treatment 11%<br />
Diagnosis of<br />
clinicals 11%<br />
Milk<br />
quality 10%<br />
Diagnosis of<br />
clinicals 11%<br />
Recurring<br />
cases 10%<br />
Other 8%<br />
Recurring<br />
cases 10%<br />
astitis<br />
10%<br />
Clinical case<br />
management<br />
43%<br />
Figure 1: Clinical case issues ranked high for<br />
many dairy farmers at a poll in May-June 2010<br />
(of 260 farmers from across Australia).<br />
Environmental<br />
bacteria / Strep uberis<br />
9%<br />
Clinical mastitis<br />
at calving 10%<br />
Figure 2: The top seven clinical<br />
case issues for farmers.<br />
<strong>Australian</strong> <strong>Dairy</strong> <strong>Herd</strong> <strong>Improvement</strong> <strong>Report</strong> 2010 13
Partner Project<br />
Mastitis Focus <strong>Report</strong><br />
MACALISTER RESEARCH FARM<br />
PO BOX 87<br />
MAFFRA, 3860<br />
Your <strong>Herd</strong><br />
Trigger<br />
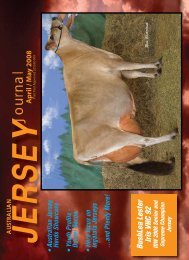
Mastitis Focus reports can be generated for herds<br />
using the common herd management software<br />
(such as Mistro Farm and Easy <strong>Dairy</strong>) or herd<br />
recording data systems in Australia.<br />
The Mastitis Focus report is a great value-add to<br />
those investing in herd recording. It uses individual<br />
cow cell counts to describe how quickly infection<br />
is spreading to clean cows in the herd. A high ‘New<br />
Infection Rate’ often precedes an increase in clinical<br />
cases – and taking early action can help avert a<br />
clinical case outbreak.<br />
V 1.1015<br />
<strong>Report</strong> period: 01.11.09 - 31.10.10<br />
Total calvings: 306<br />
<strong>Herd</strong> test cell count: 161<br />
YOUR HERD ANNUAL PERFORMANCE SUMMARY<br />
Clinical Case Rates<br />
Calving Lactation<br />
0<br />
cases per 100<br />
cows calved<br />
1<br />
cases per 100 cows<br />
in milk per month<br />
>5 >2<br />
New Infection Rate<br />
Subclinical & Clinical<br />
Your <strong>Herd</strong><br />
Trigger<br />
3<br />
cases per 100 cows<br />
in milk per month<br />
>5<br />
<strong>Herd</strong> ID: 703293<br />
Printed: 08.12.2010<br />
<strong>Herd</strong> Milk Cell Counts<br />
Average cell count at the<br />
4 most recent tests<br />
18.10.10 161<br />
10.05.10 166<br />
04.03.10 91<br />
06.01.10 73<br />
Queries around clinical case treatment<br />
effectiveness, the numbers of recurring cases and<br />
the levels of mastitis at calving were high on the list<br />
of concerns for farmers participating in the industry<br />
consultation (see Figure 2). Mastitis Focus reports<br />
these parameters for farms that enter Lactating Cow<br />
Treatments into the herd management software.<br />
However, this information is currently only able to<br />
be assessed for about 10% of herds because the<br />
data is not entered into the computerised herd<br />
records despite all farmers keeping these (usually<br />
paper-based) records as part of their quality<br />
assurance programs.<br />
<strong>Dairy</strong> veterinarians have a good grounding in the<br />
principles of clinical case management and are able<br />
to help farmers develop protocols and reduce the<br />
risk of ‘outbreaks’ in their herds.<br />
Currently, about 100 Mastitis Focus reports are being<br />
generated from the web per month. To increase its<br />
use, industry needs to promote the flow of clinical<br />
case data into the system and Countdown needs to<br />
help dairy advisers become more familiar with the<br />
report and confident in recommending its use.<br />
KEY MANAGEMENT AREAS IN FOCUS<br />
Your calving system<br />
Clinical mastitis<br />
10<br />
5<br />
0<br />
Monthly clinical case rate at calving (all cows)<br />
When cases occurred<br />
N D J F M A M J J A S O<br />
First calver<br />
clinical case rate<br />
Your <strong>Herd</strong><br />
0<br />
cases per 100<br />
first calvers<br />
Trigger<br />
>5<br />
Trigger<br />
5<br />
cases<br />
per<br />
100 cows<br />
calved<br />
Monthly clinical case rate in lactation (all cows)<br />
When cases occurred<br />
10<br />
Trigger<br />
2<br />
5<br />
cases<br />
per<br />
100 cows<br />
in milk<br />
0<br />
N D J F M A M J J A S O<br />
Total<br />
clinical cases<br />
Treatment failure<br />
Cases with an extended treatment<br />
Your <strong>Herd</strong><br />
24 cases<br />
Your <strong>Herd</strong><br />
4%<br />
Trigger<br />
>20%<br />
Spread of infection<br />
10<br />
5<br />
0<br />
First calver<br />
new infection<br />
Indicates the extent<br />
of spread<br />
Your <strong>Herd</strong><br />
11%<br />
Trigger<br />
>15%<br />
Average new infection rate (all cows)<br />
When clean cows became infected<br />
N D J F M A M J J A S O<br />
Culling to control mastitis<br />
Cows prone to<br />
clinical mastitis<br />
Cows in herd with 3 or more<br />
clinical cases in a lactation<br />
Cows infected in<br />
multiple lactations<br />
Cows still infected after<br />
2 consecutive prior lactations<br />
despite intervening DCT<br />
Star rating<br />
Your <strong>Herd</strong><br />
2 cows<br />
?<br />
Trigger<br />
5<br />
cases<br />
per<br />
100 cows<br />
in milk<br />
?<br />
Trigger<br />
Any Cows<br />
Any Cows<br />
Previous dry-off strategies<br />
Failure to cure over the dry<br />
Existing infections not cured by<br />
antibiotic Dry Cow Treatment<br />
Missed treatments<br />
Infected cows that didn't receive<br />
antibiotic Dry Cow Treatment<br />
Infections over the dry<br />
Cows that became infected<br />
in the dry-off or at calving<br />
Dry period clinical case rate<br />
Indicates the success of the<br />
dry-off procedure<br />
Your <strong>Herd</strong><br />
?<br />
?<br />
14%<br />
Plan your next drying-off<br />
Only consider a<br />
selective DCT strategy when:<br />
You have 4 or more cell counts for each cow<br />
Strep ag is not present in your herd<br />
(based on milk culture results)<br />
Less than 30% of cows had high cell counts<br />
Your clinical case rate at calving was less than 5<br />
?<br />
Trigger<br />
>20%<br />
>5%<br />
>10%<br />
?<br />
>1<br />
case per 100 cows<br />
Your <strong>Herd</strong><br />
Yes<br />
See your vet<br />
No<br />
Yes<br />
Consistently below trigger points Opportunity to reduce risk Seek professional advice Insufficient records<br />
?<br />
Figure 3: You can practise generating this Mastitis<br />
Focus test report or try with a file from a client’s<br />
farm.<br />
• Download the Macalister Research Farm file onto<br />
your computer from http://www.dairyaustralia.<br />
com.au/Farm/Mastitis-and-milk-quality/<br />
Mastitis-Focus.aspx<br />
• Go to www.mastitisfocus.com.au then follow the<br />
prompts and load the Macalister zip file. If you<br />
want your report to exactly match the report on<br />
the left, enter the report date as 31/10/2010.<br />
• PDFs of the generated reports will then appear as<br />
links that you can click on and will also be sent to<br />
your nominated e-mail address.<br />
14 <strong>Australian</strong> <strong>Dairy</strong> <strong>Herd</strong> <strong>Improvement</strong> <strong>Report</strong> 2010
National <strong>Herd</strong> Recording Statistics 2009-2010<br />
Table 1: National and state totals and production averages.<br />
State<br />
Number<br />
of herds<br />
Included<br />
in<br />
averages<br />
<strong>Herd</strong>s and cows recorded<br />
Excluded<br />
from<br />
averages<br />
Total<br />
cows<br />
<strong>Herd</strong><br />
size<br />
Milk<br />
litres<br />
Fat<br />
%<br />
Production averages<br />
Fat<br />
kg<br />
Protein<br />
%<br />
Protein<br />
kg<br />
Lactation<br />
length<br />
days<br />
Victoria 2,127 305,509 132,302 437,811 205.8 6,443 4.1 265 3.4 217 318<br />
New South Wales 508 77,965 25,949 103,914 204.6 7,499 3.9 293 3.3 245 343<br />
Queensland 309 29,119 19,443 48,562 157.2 6,401 4.1 262 3.4 218 336<br />
South Australia 247 43,797 10,424 54,221 219.5 7,274 3.9 285 3.3 238 335<br />
Tasmania 183 38,123 9,155 47,278 258.3 5,970 4.1 247 3.4 204 295<br />
Western Australia 129 28,356 4,127 32,483 251.8 7,311 3.8 277 3.1 230 334<br />
Australia 3,503 522,869 201,400 724,269 206.8 6,680 4.0 270 3.3 223 323<br />
Victorian regions<br />
Northern 804 98,751 45,641 144,392 179.6 6,726 4.2 279 3.3 225 325<br />
Eastern 756 116,432 43,092 159,524 211.0 6,179 4.1 254 3.4 208 315<br />
Western 567 90,326 43,569 133,895 236.1 6,473 4.1 265 3.4 219 314<br />
On average, herdrecorded<br />
cows<br />
produced 30%<br />
more than non-herd<br />
recorded cows.<br />
(<strong>Dairy</strong> Australia In Focus<br />
2010 and ADHIS 2010)<br />
Table 1a: National totals and production averages 1999 to 2010<br />
Year <strong>Herd</strong>s and cows recorded Production averages<br />
Number<br />
of herds<br />
Included in<br />
averages<br />
Excluded from<br />
averages<br />
Total<br />
cows<br />
<strong>Herd</strong> size Milk<br />
litres<br />
Fat % Fat kg Protein<br />
%<br />
Protein<br />
kg<br />
Lactation<br />
length days<br />
1999/2000 6,976 947,104 81,129 1,028,233 147.4 5,691 4 230 3.3 187 302<br />
2000/2001 7,405 940,712 286,248 1,226,960 165.7 5,682 4 229 3.3 186 302<br />
2001/2002 6,930 888,497 303,269 1,191,766 172 6, 027 4 243 3.3 200 307<br />
2002/2003 6,358 842,113 335,786 1,177,899 185.3 5,877 4 235 3.3 193 303<br />
2003/2004 5,704 722,074 298,727 1,020,801 179 6,048 4.0 242 3.3 201 310<br />
2004/2005 5,080 725,374 224,352 949,726 187 6,257 4.0 251 3.3 207 314<br />
2005/2006 4,746 701,852 208,536 910,388 191.8 6,402 4.0 255 3.3 212 316<br />
2006/2007 4,462 655,212 222,592 877,804 196.7 6,452 4.0 257 3.3 216 312<br />
2007/2008 3,966 578,263 207,199 785,462 198 6,596 4.0 264 3.3 220 321<br />
2008/2009 3,779 566,029 206,694 772,723 204.5 6,645 4.1 270 3.4 223 318<br />
2009/2010 3,503 522,869 201,400 724,269 206.8 6,680 4.0 270 3.3 223 323<br />
Table 2: Number of herds in fat production categories by region.<br />
State Total herds Average fat production (kg per cow)<br />
< 125 125-149 150-174 175-199 200-224 225-249 250-274 275-299 300-324 > 324<br />
Victoria 2,127 42 50 79 127 201 333 321 256 172 152<br />
New South Wales 508 5 7 17 25 34 64 69 85 75 63<br />
Queensland 309 6 3 13 18 33 34 23 23 19 14<br />
South Australia 247 4 1 5 11 22 30 40 43 41 36<br />
Tasmania 183 0 4 10 24 24 30 17 12 15 16<br />
Western Australia 129 1 0 4 8 8 11 23 30 25 13<br />
Australia 3,503 58 65 128 213 322 502 493 449 347 294<br />
Victorian regions<br />
Northern 804 7 8 23 33 52 90 114 108 71 77<br />
Eastern 756 17 22 29 56 88 152 140 80 56 30<br />
Western 567 18 20 27 38 61 91 67 68 45 45<br />
<strong>Australian</strong> <strong>Dairy</strong> <strong>Herd</strong> <strong>Improvement</strong> <strong>Report</strong> 2010 15
National <strong>Herd</strong> Recording Statistics 2009-2010<br />
Table 3: Number of herds in protein production categories by region.<br />
State<br />
Total<br />
Average protein production (kg per cow)<br />
herds < 100 100-124 125-149 150-174 175-199 200-224 225-249 250-274 275-299 > 299<br />
Victoria 2,127 43 63 132 199 384 347 279 167 87 32<br />
New South Wales 508 5 11 22 32 64 77 80 78 47 28<br />
Queensland 309 7 2 18 20 50 33 23 18 8 7<br />
South Australia 247 4 4 4 21 38 36 54 44 19 9<br />
Tasmania 183 1 8 19 31 25 20 17 13 11 7<br />
Western Australia 129 1 1 6 11 9 24 39 22 7 3<br />
Australia 3,503 61 89 201 314 570 537 492 342 179 86<br />
Victorian regions<br />
Northern 804 7 14 36 54 127 123 95 78 32 17<br />
Eastern 756 15 30 57 85 159 141 113 43 20 7<br />
Western 567 21 19 39 60 98 83 71 46 35 8<br />
Table 4: Production averages by age group..<br />
Age group Number of<br />
Production averages<br />
Lactation<br />
cows Milk litres Fat % Fat kg Protein % Protein kg length days<br />
2-year-old 87,528 5,887 4.00 235 3.33 196 329<br />
3-year-old 93,349 6,522 4.03 263 3.37 220 326<br />
Mature cow 341,992 6,926 4.06 281 3.33 231 321<br />
Total 522,869 6,680 4.04 270 3.34 223 323<br />
45% of Australia's 1.6<br />
million milking cows were<br />
herd recorded in 2009/10.<br />
<strong>Dairy</strong> Australia In Focus 2010,<br />
ADHIS 2010<br />
Table 5: Production averages by age group and mating type.<br />
Age group Number<br />
Average fat (kg)<br />
Average protein (kg)<br />
of cows Artificially bred stock Naturally bred stock Artificially bred stock Naturally bred stock<br />
2-year-old 87,528 241 220 201 182<br />
3-year-old 93,349 270 245 226 204<br />
Mature cow 341,992 293 263 241 215<br />
Total 522,869 279 255 230 210<br />
Table 6 : Production averages by percentage of artificially bred cows in herds.<br />
Percentage of artificially Number of herds<br />
Production averages<br />
bred cows in herd<br />
Milk litres Fat kg Protein kg<br />
< 10 471 5,823 239 196<br />
10-19 196 6,244 250 207<br />
20-29 164 6,058 246 202<br />
30-39 202 6,575 263 219<br />
40-49 237 6,304 256 209<br />
50-59 314 6,960 275 230<br />
60-69 362 6,808 277 226<br />
70-79 435 6,982 279 232<br />
80-89 488 6,854 277 229<br />
> 89 634 6,942 283 233<br />
Total 3,503 6,680 270 223<br />
On average, an AI cow is<br />
$53 more profitable each<br />
year than a naturally bred<br />
counterpart.<br />
HaileMariam & Goddard 2008<br />
16 <strong>Australian</strong> <strong>Dairy</strong> <strong>Herd</strong> <strong>Improvement</strong> <strong>Report</strong> 2010
National <strong>Herd</strong> Recording Statistics 2009-2010<br />
Table 7: Production averages by breed.<br />
Breed<br />
Number of<br />
Production averages<br />
cows Milk litres Fat % Fat kg Protein % Protein kg Lactation<br />
length days<br />
Holstein 353,966 7,087 3.93 278 3.27 232 327<br />
Jersey 56,385 5,168 4.84 250 3.72 192 312<br />
Holstein/Jersey Cross 20,862 6,057 4.42 268 3.52 213 310<br />
Guernsey 1,387 5,481 4.27 234 3.38 185 329<br />
Ayrshire 2,769 5,505 4.10 225 3.38 186 313<br />
<strong>Dairy</strong> Shorthorn 294 4,772 3.85 184 3.26 156 303<br />
Illawarra 5,329 6,379 3.99 254 3.33 212 323<br />
Unknown Breed 70,723 6,253 4.04 252 3.33 208 319<br />
Aust Red Breed 7,465 5,807 4.14 240 3.46 201 310<br />
Brown Swiss 3,501 6,245 4.10 256 3.43 214 329<br />
Other 188 5,099 4.97 234 3.71 181 307<br />
Total 522,869 6,680 4.04 270 3.34 223 323<br />
Table 8: Production averages by month of calving.<br />
Month of<br />
calving<br />
Number of<br />
cows<br />
% of total Production averages Lactation<br />
length days<br />
Milk litres Fat % Fat kg Protein % Protein kg<br />
January 16,060 3.1 7,015 3.97 279 3.31 232 342<br />
February 23,633 4.5 7,064 4.02 284 3.35 236 339<br />
March 47,290 9.0 7,113 4.01 285 3.33 237 336<br />
April 51,717 9.9 7,038 4.02 283 3.34 235 334<br />
May 45,917 8.8 6,888 4.01 277 3.35 231 328<br />
June 41,775 8.0 6,633 4.03 268 3.36 223 320<br />
July 57,038 10.9 6,405 4.07 261 3.36 215 317<br />
August 96,271 18.4 6,334 4.11 261 3.37 213 310<br />
September 74,411 14.2 6,537 4.08 266 3.32 217 314<br />
October 36,312 6.9 6,540 4.03 264 3.28 214 319<br />
November 18,841 3.6 6,702 3.99 268 3.26 219 337<br />
December 13,604 2.6 6,929 3.96 274 3.27 226 344<br />
Australia 522,869 100 6,680 4.04 270 3.34 223 323<br />
43% of herd-recorded<br />
cows calved in the months<br />
of July/August/September<br />
in 2009/10.<br />
Jersey 12%<br />
Holstein/Jersey<br />
Cross 5%<br />
Red Breed Group 4%<br />
Other 1%<br />
Holstein 78%<br />
Distribution of breeds<br />
<strong>Australian</strong> <strong>Dairy</strong> <strong>Herd</strong> <strong>Improvement</strong> <strong>Report</strong> 2010 17
National <strong>Herd</strong> Recording Statistics 2009-2010<br />
Table 9: Production averages by breed, age group, mating type and registration.<br />
Breed Type Number of<br />
cows<br />
Milk<br />
litres<br />
Production averages<br />
Fat % Fat kg Protein<br />
%<br />
Protein<br />
kg<br />
Lactation<br />
length days<br />
Holstein 2-year-old 64,588 6,206 3.87 240 3.28 204 332<br />
3-year-old 67,278 6,893 3.91 269 3.31 228 329<br />
Mature cow 222,100 7,402 3.95 292 3.27 242 325<br />
Total 353,966 7,087 3.93 278 3.27 232 327<br />
Artifically bred 256,221 7,255 3.92 284 3.27 237 329<br />
Naturally bred 97,745 6,648 3.95 263 3.28 218 320<br />
Pure bred 61,226 8,039 3.82 307 3.22 259 349<br />
Grade 292,740 6,888 3.95 272 3.29 226 322<br />
Jersey 2-year-old 10,786 4,585 4.80 220 3.67 168 318<br />
3-year-old 10,768 5,050 4.87 246 3.74 189 312<br />
Mature cow 34,831 5,385 4.84 261 3.73 201 310<br />
Total 56,385 5,168 4.84 250 3.72 192 312<br />
Artifically bred 38,949 5,266 4.87 256 3.74 197 313<br />
Naturally bred 17,436 4,949 4.76 236 3.68 182 311<br />
Pure bred 14,437 5,613 4.89 274 3.74 210 327<br />
Grade 41,948 5,015 4.82 242 3.71 186 307<br />
Holstein/Jersey 2-year-old 3,452 5,155 4.42 228 3.50 181 317<br />
Cross<br />
3-year-old 3,737 5,847 4.41 258 3.55 208 309<br />
Mature cow 13,673 6,342 4.43 281 3.51 223 309<br />
Total 20,862 6,057 4.42 268 3.52 213 310<br />
Artifically bred 10,856 6,162 4.44 274 3.54 218 309<br />
Naturally bred 10,006 5,943 4.39 261 3.49 207 311<br />
Pure bred 0 0 0 0 0 0 0<br />
Grade 20,862 6,057 4.42 268 3.52 213 310<br />
Guernsey 2-year-old 195 4,990 4.31 215 3.38 169 332<br />
3-year-old 276 5,259 4.31 227 3.40 179 326<br />
Mature cow 916 5,652 4.26 241 3.38 191 330<br />
Total 1,387 5,481 4.27 234 3.38 185 329<br />
Artifically bred 701 5,754 4.32 249 3.39 195 336<br />
Naturally bred 686 5,201 4.20 219 3.35 174 322<br />
Pure bred 294 5,741 4.25 244 3.31 190 351<br />
Grade 1,093 5,411 4.28 231 3.39 184 323<br />
Ayrshire 2-year-old 549 4,793 4.15 199 3.43 164 319<br />
3-year-old 509 5,227 4.19 219 3.42 179 314<br />
Mature cow 1,711 5,816 4.05 236 3.36 195 310<br />
Total 2,769 5,505 4.10 225 3.38 186 313<br />
Artifically bred 1,537 5,743 4.10 236 3.40 195 318<br />
Naturally bred 1,232 5,209 4.09 213 3.35 175 306<br />
Pure bred 910 6,052 4.09 248 3.34 202 329<br />
Grade 1,859 5,237 4.10 215 3.41 178 305<br />
18 <strong>Australian</strong> <strong>Dairy</strong> <strong>Herd</strong> <strong>Improvement</strong> <strong>Report</strong> 2010
National <strong>Herd</strong> Recording Statistics 2009-2010<br />
Table 9: Production averages by breed, age group, mating type and registration (continued).<br />
Breed Type Number of<br />
cows<br />
Production averages<br />
Milk<br />
litres<br />
Fat % Fat kg Protein<br />
%<br />
Protein<br />
kg<br />
Illawarra 2-year-old 734 5,641 4.06 229 3.36 189 330<br />
3-year-old 1,119 5,871 3.99 234 3.33 195 325<br />
Mature cow 3,476 6,698 3.98 267 3.33 223 320<br />
Total 5,329 6,379 3.99 254 3.33 212 323<br />
Artifically bred 2,819 6,626 3.96 262 3.30 219 325<br />
Naturally bred 2,510 6,101 4.01 245 3.35 204 320<br />
Pure bred 2,338 6,733 3.95 266 3.29 222 323<br />
Grade 2,991 6,102 4.02 245 3.36 205 322<br />
Unknown Breed 2-year-old 4,519 5,574 3.95 220 3.32 185 328<br />
3-year-old 6,959 6,153 3.98 245 3.36 206 329<br />
Mature cow 59,245 6,317 4.05 256 3.33 210 317<br />
Total 70,723 6,253 4.04 252 3.33 208 319<br />
Artifically bred 1,376 7,033 3.97 279 3.34 235 331<br />
Naturally bred 69,347 6,238 4.04 252 3.33 208 319<br />
Pure bred 0 0 0 0 0 0 0<br />
Grade 70,723 6,253 4.04 252 3.33 208 319<br />
Aust. Red Breed 2-year-old 2,102 5,302 4.14 219 3.42 181 314<br />
3-year-old 1,877 5,687 4.17 237 3.49 198 309<br />
Mature cow 3,486 6,175 4.15 256 3.47 214 309<br />
Total 7,465 5,807 4.14 240 3.46 201 310<br />
Artifically bred 6,771 5,835 4.14 241 3.45 202 312<br />
Naturally bred 694 5,532 4.19 232 3.47 192 300<br />
Pure bred 833 7,164 3.82 274 3.46 248 331<br />
Grade 6,632 5,636 4.19 236 3.45 195 308<br />
Brown Swiss 2-year-old 526 5,206 4.13 215 3.44 179 329<br />
3-year-old 722 5,819 4.08 237 3.44 200 329<br />
Mature cow 2,253 6,624 4.10 272 3.42 226 329<br />
Total 3,501 6,245 4.10 256 3.43 214 329<br />
Artifically bred 2,257 6,239 4.15 259 3.44 215 329<br />
Naturally bred 1,244 6,256 4.01 251 3.41 213 330<br />
Pure bred 1,073 6,720 4.15 279 3.45 232 339<br />
Grade 2,428 6,035 4.06 245 3.40 205 325<br />
Other Breeds 2-year-old 77 4,885 3.90 191 3.30 161 324<br />
3-year-old 104 4,501 4.12 186 3.42 154 308<br />
Mature cow 301 4,802 4.31 207 3.48 167 297<br />
Total 482 4,750 4.41 201 3.49 162 303<br />
Artifically bred 198 5,525 3.93 217 3.29 182 305<br />
Naturally bred 284 4,210 4.40 185 3.56 150 302<br />
Pure bred 72 3,954 3.83 151 3.25 129 299<br />
Grade 410 4,890 4.25 208 3.46 169 304<br />
Lactation<br />
length days<br />
72% of herd-recorded<br />
Holsteins, 69% of herdrecorded<br />
Jerseys and<br />
90% of herd-recorded<br />
<strong>Australian</strong> Red Breeds<br />
were bred via artificial<br />
insemination.<br />
<strong>Australian</strong> <strong>Dairy</strong> <strong>Herd</strong> <strong>Improvement</strong> <strong>Report</strong> 2010 19
National <strong>Herd</strong> Recording Statistics 2009-2010<br />
Table 10: Distribution of calvings by month and region.<br />
State<br />
Percentage of cows that calved each month<br />
Jan Feb Mar Apr May Jun Jul Aug Sep Oct Nov Dec<br />
Victoria 1 2 8 11 10 9 13 21 15 6 2 1<br />
New South Wales 7 8 11 9 8 7 9 10 9 7 7 7<br />
Queensland 8 9 10 10 10 9 9 7 8 8 7 7<br />
South Australia 6 8 10 10 8 7 7 11 14 9 6 4<br />
Tasmania 1 3 5 6 3 1 5 37 27 10 2 1<br />
Western Australia 7 10 13 10 9 6 6 9 10 8 7 6<br />
Australia 3 5 9 10 9 8 11 18 14 7 4 3<br />
Victorian regions<br />
Northern 1 2 11 13 7 3 7 23 20 9 3 1<br />
Eastern 1 2 7 8 7 8 18 27 16 5 1 1<br />
Western 2 4 8 11 16 18 15 12 9 4 2 1<br />
Table 11: Production averages of stud cows.<br />
Breed<br />
Number of<br />
cows<br />
Production averages<br />
Milk litres Fat % Fat kg Protein % Protein kg Lactation length days<br />
Holstein 61,226 8,039 3.82 307 3.22 259 349<br />
Jersey 14,437 5,613 4.89 274 3.74 210 327<br />
Guernsey 294 5,741 4.25 244 3.31 190 351<br />
Ayrshire 910 6,052 4.09 248 3.34 202 329<br />
Illawarra 2,338 6,733 3.95 266 3.29 222 323<br />
Aust Red Breed 833 7,164 3.82 274 3.46 248 331<br />
Brown Swiss 1,073 6,720 4.15 279 3.45 232 339<br />
Total 81,111 7,512 4.02 298 3.32 247 344<br />
Table 12: Production averages of artificially bred stud cows.<br />
Breed<br />
Number<br />
of cows<br />
Production averages<br />
Milk litres Fat % Fat kg Protein % Protein kg Lactation length days<br />
Holstein 48,941 8,102 3.81 309 3.22 261 350<br />
Jersey 11,485 5,715 4.87 279 3.74 214 327<br />
Guernsey 177 5,934 4.25 252 3.31 197 353<br />
Ayrshire 510 6,356 4.00 254 3.32 211 335<br />
Illawarra 1,197 7,000 3.90 273 3.25 227 326<br />
Aust Red Breed 803 7,162 3.83 274 3.46 248 330<br />
Brown Swiss 726 6,748 4.17 281 3.46 233 340<br />
Total 63,839 7,605 4.01 302 3.32 251 345<br />
20 <strong>Australian</strong> <strong>Dairy</strong> <strong>Herd</strong> <strong>Improvement</strong> <strong>Report</strong> 2010
National <strong>Herd</strong> Recording Statistics 2009-2010<br />
Table 13: Victorian production averages 1930/1931 – 2009/2010.<br />
Year Total herds Total cows <strong>Herd</strong> size Production averages<br />
Milk litres Fat % Fat kg Protein % Protein kg<br />
1930/1935 2,984 91,328 31 2,295 4.7 107<br />
1935/1940 2,324 80,883 35 2,210 4.9 108<br />
1940/1945 1,082 39,368 36 2,154 4.9 105<br />
1945/1950 2,329 90,015 39 2,301 5.0 114<br />
1950/1955 3,192 141,387 44 2,284 5.0 114<br />
1955/1960 3,461 187,306 54 2,485 5.1 126<br />
1960/1965 4,003 248,791 62 2,643 5.0 132<br />
1965/1970 5,041 368,300 73 2,793 4.9 137<br />
1970/1975 4,314 382,925 89 2,942 4.7 139<br />
1975/1980 2,456 256,744 105 3,159 4.5 143<br />
1980/1985 3,913 423,120 108 3,471 4.5 155<br />
1985/1990 4,399 527,240 120 4,047 4.4 180 3.3 134<br />
1990/1991 4,402 568,885 129 4,245 4.4 186 3.4 142<br />
1991/1992 4,061 517,760 128 4,477 4.4 196 3.4 150<br />
1992/1993 4,293 552,445 129 4,708 4.4 205 3.4 158<br />
1993/1994 4,606 604,160 131 4,962 4.3 212 3.3 166<br />
1994/1995 4,591 574,674 125 4,976 4.2 210 3.3 164<br />
1995/1996 4,685 606,198 129 5,142 4.2 215 3.3 169<br />
1996/1997 4,928 619,470 126 4,984 4.2 208 3.3 163<br />
1997/1998 4,328 624,428 144 5,084 4.1 208 3.3 167<br />
1998/1999 4,156 641,106 154 5,350 4.1 220 3.3 177<br />
1999/2000 3,904 622,281 159 5,570 4.1 227 3.3 184<br />
2000/2001 4,267 761,219 178 5,527 4.0 223 3.3 182<br />
2001/2002 4,198 757,029 180 5,969 4.0 240 3.3 198<br />
2002/2003 3,831 738,329 193 5,705 4.0 230 3.3 187<br />
2003/2004 3,414 624,002 183 5,841 4.0 236 3.3 194<br />
2004/2005 3,079 586,566 191 6,083 4.0 245 3.3 202<br />
2005/2006 2,933 572,906 195 6,205 4.0 248 3.3 206<br />
2006/2007 2,775 554,136 200 6,245 4.0 250 3.4 209<br />
2007/2008 2,431 484,030 199 6,423 4.0 259 3.3 215<br />
2008/2009 2,313 478,612 207 6,458 4.1 266 3.4 218<br />
2009/2010 2,127 437,811 206 6,443 4.1 265 3.4 217<br />
The production of protein<br />
by Victorian herd-recorded<br />
cows has lifted by almost<br />
20% since 1990.<br />
Over the past decade,<br />
32% of productivity gains<br />
achieved have been<br />
the result of genetic<br />
improvement.<br />
<strong>Australian</strong> <strong>Dairy</strong> <strong>Herd</strong> <strong>Improvement</strong> <strong>Report</strong> 2010 21
2010 <strong>Australian</strong> Breeding Values – Genetic Trends<br />
Genetic Trend for<br />
AI and Natural Bred<br />
Holstein Cows (ASI)<br />
July 2010.<br />
20<br />
0<br />
-20<br />
-40<br />
-60<br />
-80<br />
ASI ($ profit from production)<br />
-100<br />
-120<br />
ASI – Cows sired by AI bulls<br />
ASI – Cows sired by natural bulls<br />
-140<br />
-160<br />
-180<br />
Year of birth<br />
1983 1985 1987 1989 1991 1993 1995 1997 1999 2001 2003 2005 2007<br />
Genetic Trend for<br />
AI and Natural Bred<br />
Jersey Cows (ASI)<br />
July 2010.<br />
10<br />
-40<br />
ASI ($ profit from production)<br />
-90<br />
-140<br />
-190<br />
ASI – Cows sired by AI bulls<br />
ASI – Cows sired by natural bulls<br />
-240<br />
Year of birth<br />
1983 1985 1987 1989 1991 1993 1995 1997 1999 2001 2003 2005 2007<br />
Genetic Trend for<br />
AI and Natural Bred<br />
Red Breed Cows (ASI)<br />
July 2010.<br />
Data for other breeds<br />
available from ADHIS<br />
60<br />
40<br />
20<br />
0<br />
-20<br />
-40<br />
-60<br />
-80<br />
-100<br />
-120<br />
-140<br />
ASI ($ profit from production)<br />
ASI – Cows sired by AI bulls<br />
ASI – Cows sired by natural bulls<br />
Year of birth<br />
1983 1985 1987 1989 1991 1993 1995 1997 1999 2001 2003 2005 2007<br />
22 <strong>Australian</strong> <strong>Dairy</strong> <strong>Herd</strong> <strong>Improvement</strong> <strong>Report</strong> 2010
2010 <strong>Australian</strong> Breeding Values – Good Bulls Guide<br />
Holstein Profit (Aug 2010)<br />
PROFIT PRODUCTION LONGEVITY<br />
PROFIT RANK<br />
BULL ID<br />
BULL NAmE<br />
GENETIC CODES<br />
AUSTRALIAN PROVEN<br />
OR INTERNATIONAL<br />
PROFIT $<br />
RELIABILITY<br />
PRODUCTION $<br />
RELIABILITY<br />
AUSTRALIAN<br />
DAUGHTERS<br />
AUSTRALIAN<br />
HERDS<br />
FOREIGN<br />
DAUGHTERS FIRST<br />
SURVIVAL<br />
RELIABILITY<br />
SOURCE<br />
1 7H6417 O-BEE MANFRED JUSTICE INT 301 87<br />
185 91<br />
44383 109* 83 WWS<br />
2 29HO12470 INDIJKS BABYLON AUS 276 75<br />
194 80<br />
62 30 104 72<br />
ABS<br />
3 NZGmINTED FAIRMOUNT MINT-EDITION INT 260 60<br />
201 68<br />
81 104 41<br />
LIC<br />
4 VIVIO INT 258 55<br />
227 69<br />
85 103 43<br />
AGR<br />
5 ALTACROCKETT CROCKETT-ACRES OTTO TVTL INT 252 53<br />
163 63<br />
104 106 48<br />
ALT<br />
6 VOUSTERmAN VOUSTER INT 248 58<br />
190 71<br />
104 103 46<br />
AGR<br />
7 NZGSONFLAmE THOMPSONS GR FLAME S2F INT 247 53<br />
185 66<br />
86 104 35<br />
LIV<br />
8 ROSEO ROSEO JOC INT 246 73<br />
137 77<br />
9265 105* 65<br />
AGR<br />
9 CARLOS COUNTRY ROAD JOCKO CARLOS TV AUS 243 76<br />
215 81<br />
69 31 101 68<br />
GAC<br />
10 29HO11932 MORNINGVIEW LEGEND INT 243 53<br />
186 63<br />
127 106 48<br />
ABS<br />
11 SHOTTLE PICSTON SHOTTLE AUS 243 90<br />
110 95<br />
217 86 111 82<br />
ABS<br />
12 CARDINAL KAARMONA CARDINAL TV AUS 241 73<br />
170 79<br />
55 30 108 65<br />
GAC<br />
13 HOACRESEIGHT CROCKETT-ACRES EIGHT INT 241 56<br />
146 68<br />
94 106 46<br />
SEM<br />
14 PORT PERFECT PARTNERS LANCELOT PORT AUS 239 73<br />
196 80<br />
63 25 104 62<br />
ABS<br />
15 ALTACOLIN BARKLY DONOR COLIN CV AUS 238 96<br />
202 99<br />
1749 339 104 89<br />
ALT<br />
16 GGJARDIN JARDIN INT 234 70<br />
219 74<br />
3780 103 64<br />
ABS<br />
17 RANNESLOV RANNESLOV INT 231 65<br />
185 70<br />
7296 105 64<br />
RED<br />
18 29HO13053 GRAN-J OMAN MCCORMIC INT 230 53<br />
125 63<br />
135 107 48<br />
ABS<br />
19 NASTGARDEN ET INT 230 54<br />
200 66<br />
108 102 49<br />
VIK<br />
20 DELSANTO MANNA FARM DEL SANTO AUS 229 71<br />
185 79<br />
63 30 103 54<br />
GAC<br />
21 NZGPASTURE LAKESIDE S D MEADOWS INT 226 67<br />
168 75<br />
30608 103 51 LIC<br />
22 GILLETTE JORDAN INT 226 56<br />
142 70<br />
183 107 44 SEM<br />
23 BOSmEGASTUD AMBZED P MEGASTUD INT 224 56<br />
180 67<br />
68 105 38 BOS<br />
24 STOLJOC STOL JOC INT 224 60<br />
153 71<br />
95 106 50 AGR<br />
25 GOLDSmITH TOPSPEED H POTTER TVTL AUS 223 93<br />
224 98 1112 237 100 79 GAC<br />
26 YONDER KAARMONA CHAPLIN AUS 222 72<br />
152 77 50 27 104 68 GAC<br />
27 JOCKO JOCKO BESN TVTL AUS 221 98<br />
168 99 1453 326 106 96 AGR<br />
28 ORANA BUSHLEA WAVES FABULON AUS 220 74<br />
167 81 54 25 103 59 GAC<br />
29 FARmDEALER MANNA FARM DEALER CV AUS 220 73<br />
158 79 64 28 108 64 ALT<br />
30 PIERRE TOP DECK KO PIERRE AUS 218 93<br />
163 97 485 113 104 85 BOS<br />
31 WILLCOY MANNA FARM DECOY AUS 217 77<br />
172 84 63 35 103 63 GAC<br />
32 GGGIBOR GIBOR TV INT 217 71<br />
103 72<br />
13494 106 68 ABS<br />
33 VOSAC VOSAC MAN INT 216 57<br />
129 70<br />
88 106 46 AGR<br />
34 NZGROCKSOLID SRC GLENMEAD ROCKSOLID INT 212 65<br />
146 75<br />
10860 103 50 LIC<br />
35 GGmASCOL MASCOL TV INT 212 73<br />
107 81<br />
9912 108 68 ABS<br />
36 SOLVIT KIRK ANDREWS FORCEFUL AUS 211 76<br />
173 84 67 37 102 60 GAC<br />
37 JEEBIN COUNTRY ROAD LADINO JADIN AUS 210 77<br />
152 83 74 37 106 68 GAC<br />
38 R-E-W SEAVER-ET INT 210 54<br />
135 67<br />
100 108 50 SEM<br />
39 VIA THELO INT 209 55<br />
177 70<br />
96 102 43 AGR<br />
40 GILLETTE JERRICK INT 209 54<br />
132 67<br />
112 106 50 SEM<br />
41 NLDCANVAS DELTA CANVAS RC INT 208 83<br />
195 86<br />
11671 103 77 BOS<br />
42 HOAUTHOR COMESTAR LAUTHORITY INT 208 55<br />
120 65<br />
72 110* 49 SEM<br />
43 NZGHOSANNA VALDEN HI APPLAUSE S2F INT 207 61<br />
170 75<br />
17630 103 45 LIC<br />
44 NZGLANDSPER WESTLAND CL JASPER INT 207 56<br />
150 67<br />
92 104 39 LIV<br />
45 NEWLOOK NEWLOOK TV INT 207 73<br />
138 76<br />
7064 102* 68 AGR<br />
46 NZGFROSTmAN PUKETIRO FROSTMAN S1F INT 207 54<br />
108 68<br />
72 104 36 LIC<br />
47 NImBLE CLARINDA JOCKOSTRAP TWIN TV AUS 205 76<br />
188 81 62 24 103 67 GAC<br />
48 DICAST DAMAR LEON TV AUS 205 79<br />
142 86 84 40 104 63 GAC<br />
49 FARAWAY CARENDA FARAWAY AUS 204 76<br />
152 83 63 27 104 61 GAC<br />
50 LATAR ELMAR LATAR AUS 204 77<br />
146 83 75 34 105 69 ABS<br />
*Denotes an ABV that incorporates <strong>Australian</strong> data, all other traits for this bull are ABV(i)s using data from foreign daughters.<br />
The bull must meet minimum requirements for reliability, is active and more than 1 standard deviation above average for Profit $.<br />
For the full list go to www.adhis.com.au<br />
<strong>Australian</strong> <strong>Dairy</strong> <strong>Herd</strong> <strong>Improvement</strong> <strong>Report</strong> 2010 23
2010 <strong>Australian</strong> Breeding Values – Good Bulls Guide<br />
Holstein Profit (Aug 2010)<br />
PROFIT PRODUCTION LONGEVITY<br />
PROFIT RANK<br />
BULL ID<br />
BULL NAmE<br />
GENETIC CODES<br />
AUSTRALIAN PROVEN<br />
OR INTERNATIONAL<br />
PROFIT $<br />
RELIABILITY<br />
PRODUCTION $<br />
RELIABILITY<br />
AUSTRALIAN<br />
DAUGHTERS<br />
AUSTRALIAN<br />
HERDS<br />
FOREIGN<br />
DAUGHTERS FIRST<br />
SURVIVAL<br />
RELIABILITY<br />
SOURCE<br />
51 SZRAY ZIAL ADDISON RAY TVTL INT 204 61<br />
112 73<br />
5288 105 50<br />
GAC<br />
52 7H6758 REGANCREST-MR DRHAM SAM AUS 202 88<br />
113 93 124 43 107 80<br />
WWS<br />
53 29HO13387 LADYS-MANOR RUBY D SHOUT INT 200 56<br />
95 63<br />
186 108* 57<br />
ABS<br />
54 VACUm AULDREEKIE ADDISON VACUM AUS 199 91<br />
142 97 566 122 104 76<br />
ABS<br />
55 HOmANIFOLD MAINSTREAM MANIFOLD INT 199 53<br />
140 63<br />
145 105 48<br />
SEM<br />
56 BOSCRICKET RALMA O-MAN CF CRICKET INT 199 58<br />
89 69<br />
140 108 45<br />
BOS<br />
57 FEVOLA CARENDA FEVOLA AUS 198 81<br />
196 87 105 43 102 72<br />
ALT<br />
58 CRITOYSTORY JENNY-LOU MRSHL TOYSTORY AUS 198 88<br />
123 94 224 73 106 78<br />
BOS<br />
59 29HO13366 END-ROAD BEACON INT 198 56<br />
98 63<br />
153 107* 57<br />
ABS<br />
60 93FFW21 WIZZARD INT 197 61<br />
160 70<br />
1477 103 54 ALT<br />
61 JOBERT JOBERT TVTL INT 196 64<br />
172 73<br />
2081 105 56<br />
GAC<br />
62 LADYS-MANOR DODGE-ET INT 196 53<br />
151 66<br />
93 106 48<br />
ABS<br />
63 29HO13162 SCHILLVIEW OMAN GERARD INT 195 53<br />
147 63<br />
144 107 47<br />
ABS<br />
64 INTRUDER ELMAR INTRUDER AUS 195 69<br />
143 77<br />
52 25 106 58<br />
ABS<br />
65 7H8625 MR SCHULTZ OMAN BUTCH INT 195 54<br />
115 64<br />
219 105 48<br />
WWS<br />
66 REXONDI REXONDI INT 194 83<br />
187* 91 130 40 99 67<br />
AGR<br />
67 NZGSURETHING MAIRE PIERRE GUARANTEE INT 192 62<br />
117 70<br />
103 104 43<br />
LIC<br />
68 AmBFAVOUR AURORA-DONOR FAVOUR AUS 191 90<br />
185 96 383 75 103 74<br />
BOS<br />
69 NLDADEPT DE CROB ADEPT TLTV INT 191 85 165* 93 157 42 101* 72<br />
BOS<br />
70 WISEPOINT KIRK ANDREWS JACKADINO RC AUS 189 81<br />
107 87 91 37 107 68<br />
GAC<br />
71 GRAZER CARENDA GRAZER TC AUS 188 77<br />
185 85 70 43 103 59<br />
GAC<br />
72 LANCELOT LANCELOT AUS 188 97<br />
174 99 725 152 105 93<br />
AGR<br />
73 NINESCAPE GLEN JURISTAN NINEFOLD ESCAPE TXTV AUS 188 83<br />
104 89 94 45 103 67<br />
GAC<br />
74 GGSTYLIST STYLIST INT 186 53<br />
161 64<br />
503 104 45<br />
ABS<br />
75 WHITLAm FAIRSTAR GOLD LEMON-TWIN TCTV AUS 186 76<br />
151 83 60 33 102 58 GAC<br />
76 NZGmILLER GLENMEAD MILLER AUS 186 77<br />
121 85 49 19 102 63 LIC<br />
77 29HO11993 RALMA FOCUS INT 186 54<br />
77 64<br />
145 108 49<br />
ABS<br />
78 DOLITTLE NEW MILLENIUM MONDO AUS 185 75<br />
161 82 72 36 106 63 GAC<br />
79 FULLHOUSE JOYLEY 9 10 JACK AUS 185 74<br />
140 83 62 36 103 54 GAC<br />
80 29HO11942 WA-DEL JUNCTION INT 185 53<br />
131 63<br />
130 105 48<br />
ABS<br />
81 ALTABREAKOUT IJSSELVLIEDT 135 BREAKOUT AUS 185 95<br />
131 98<br />
690 127 103 89<br />
ALT<br />
82 DONLOTTO KAARMONA DON LOTTO AUS 184 79<br />
173 86<br />
70 29 101 69<br />
ABS<br />
83 JACKAROO KIRK ANDREWS TALENTED JACKSON RC AUS 184 73<br />
118 80 51 23 105 59<br />
ABS<br />
84 PLAYFAIR KIRK ANDREWS FAIRPLAY AUS 183 78<br />
166 86 80 39 99 62<br />
GAC<br />
85 NZGCLOUT REILLYS MIGHT S1F INT 183 63<br />
118 75<br />
8038 104 48<br />
LIC<br />
86 NINEFOLD KEYMER NINA WINLUKE TL AUS 182 99<br />
131 99 10852 1272 104 99 GAC<br />
87 BOSDRIVE OAKURA OMAN OVERDRIVE INT 182 52<br />
125 64<br />
67 107 34 BOS<br />
88 NZGGLENmEAD GLENMEAD KR WINDMILL INT 181 68<br />
153 74<br />
489 102 51 LIC<br />
89 ABSTENNYSON BURLANE TENNYSON AUS 180 83<br />
122 89 70 26 104 71 ABS<br />
90 DNKEATON V EATON INT 180 90<br />
107* 95 203 50 106* 82 BOS<br />
91 29HO11111 SANDY-VALLEY BOLTON AUS 180 89<br />
68 96 390 78 108 78 ABS<br />
92 DONANTE HILL VALLEY DON ANDANTE ET TV AUS 179 95<br />
136 99 1998 358 105 82 GAC<br />
93 NZGEARLYTImE BUCHANANS EARLYTIME S2F INT 178 59<br />
148 70<br />
106 102 43 LIC<br />
94 NZGDAUNTLESS MACFARLANES DAUNTLESS TV INT 178 87<br />
128* 96 350 43 100* 62 LIC<br />
95 PATUR PATUR AD INT 178 75<br />
108 81<br />
14212 104 66 AGR<br />
96 AmBFLUKE SRB NGAIO HUGO FLUKE INT 177 65<br />
137 75<br />
4821 104 51 BOS<br />
97 LORETO AVALON BULLION LABYRINTH AUS 177 82<br />
136 89 94 41 104 68 ABS<br />
98 USONETFIN USONET FIN INT 175 58<br />
158 71<br />
102 104 46 AGR<br />
99 NZGROCKFEST SRC GLENMEAD ROCKFEST INT 175 70<br />
126 75<br />
12648 103 51 LIC<br />
100 GALASTAR BLUESKY INT 175 54<br />
116 70<br />
70 107 44 ABS<br />
101 BULLBAR GLOMAR BULLBAR RB TVRB AUS 175 95 88 99 2733 440 103 81 GAC<br />
102 29HO13224 EASTVIEW SENTRY INT 175 56 85 63<br />
145 108* 57 ABS<br />
*Denotes an ABV that incorporates <strong>Australian</strong> data, all other traits for this bull are ABV(i)s using data from foreign daughters.<br />
The bull must meet minimum requirements for reliability, is active and more than 1 standard deviation above average for Profit $.<br />
For the full list go to www.adhis.com.au<br />
24 <strong>Australian</strong> <strong>Dairy</strong> <strong>Herd</strong> <strong>Improvement</strong> <strong>Report</strong> 2010
2010 <strong>Australian</strong> Breeding Values – Good Bulls Guide<br />
Jersey Profit (Aug 2010)<br />
PROFIT PRODUCTION LONGEVITY<br />
PROFIT RANK<br />
BULL ID<br />
BULL NAmE<br />
GENETIC CODES<br />
AUSTRALIAN PROVEN<br />
OR INTERNATIONAL<br />
PROFIT $<br />
1 VALERIAN KAARMONA VALERIAN AUS 274 84<br />
208 92 168 76 106 65<br />
GAC<br />
2 BOSmURmUR OKURA LIKA MURMUR S3J INT 271 55<br />
202 67<br />
82 105 34<br />
BOS<br />
3 LARFALOT LIGHTWOOD LUCRATIVE AUS 236 80<br />
176 87 91 45 106 63<br />
GAC<br />
4 ELTON CAIRNBRAE JACES ELTON AUS 235 81<br />
162 88 112 35 105 66<br />
ABS<br />
5 AmBmANHATTEN OKURA MANHATTEN-ET SJ3 AUS 223 96<br />
219 99 1014 173 101 88<br />
BOS<br />
6 JURACE KAARMONA JURACE AUS 218 73<br />
145 82 61 22 106 55<br />
WWS<br />
7 TAILBOARD NOWELL TARSAN AUS 207 93<br />
186 98 675 171 101 79<br />
GAC<br />
8 NZGLYNTRADE LYNBROOK TRADEMARK S3J INT 206 57<br />
228 68<br />
76 99 37<br />
LIC<br />
9 NZGCAPSTAN SOUTH LAND CAPSTAN SJ3 INT 197 59<br />
182 71<br />
123 101 37<br />
LIC<br />
10 DJ HULK INT 197 52<br />
173 65<br />
97 101 42<br />
VIK<br />
11 29JE3487 CAL-MART JACE SIMBA INT 196 53<br />
155 64<br />
101 103 40<br />
ABS<br />
12 NZGJOSKIN TIRONUI OM JOSKIN INT 191 53<br />
177 64<br />
58 102 33<br />
LIC<br />
13 35JJV24 TAWA GROVE MAUNGA ET S3J INT 190 68<br />
174 76<br />
7111 102 47<br />
BOS<br />
14 NZGGREENY GREENPARK OM TARGET INT 181 55<br />
195 66<br />
67 101 34<br />
LIC<br />
15 NZGEDIFY DONALDS EDIFY INT 180 57<br />
134 69<br />
78 102 37<br />
LIC<br />
16 RUSTIC SPRING GULLY SARA MANHATTEN AUS 179 67<br />
139 74 40 23 103 54<br />
GAC<br />
17 BOSDJZUmA DJ ZUMA INT 178 53 98 65<br />
105 104* 45<br />
BOS<br />
18 PROmVIEW PROM VIEW ASTOUND POWER AUS 176 78<br />
164 83 75 28 102 67<br />
ALT<br />
19 BADGER BEULAH TARANAK BADGER AUS 176 96<br />
100 99 1644 300 108 88<br />
GAC<br />
20 FLATTERY YOORAMI GOLDIES FLATTERY AUS 173 75<br />
194 80 64 33 99 68<br />
GAC<br />
21 NZGPANLINK WILLIAMS PAN LINK INT 173 65<br />
162 76<br />
6777 101 47<br />
LIC<br />
22 BETAHEAD KINGS VILLE OUTDO AUS 172 78<br />
131 85 76 33 104 61<br />
GAC<br />
23 TBONE RICHIES JACE TBONE A364 INT 171 59<br />
123 69<br />
2008 106 54<br />
AGR<br />
24 BOSCANYON SUNSET CANYON ANTHEMS ALLSTAR INT 170 52<br />
141 64<br />
97 105* 49<br />
BOS<br />
25 BOSZEALOT WHITMORE MAN ZEALOT INT 168 57<br />
176 69<br />
84 101 37<br />
BOS<br />
26 AmBKONUI KONUI GLEN ELMOS BOWIE INT 165 71<br />
148 76<br />
6269 102 50<br />
BOS<br />
27 7J865 SUNSET CANYON KYROS INT 163 47<br />
107 64<br />
21 WWS<br />
28 14J365 O.F. MANNIX REBEL AUS 161 91<br />
160 96 270 59 106 81<br />
WWS<br />
29 NZGBANGA LOXLEA ACL OSWALD AUS 160 81<br />
152 88 63 20 100 65<br />
LIC<br />
30 NZLLIKABULL MITCHELLS LIKABULL SJ3 INT 157 90 151* 97 413 43 101* 72 LIC<br />
31 NZGDODDY MAGHERACANON DODDY GR INT 157 86 139* 95 254 41 101* 66 LIC<br />
32 VISIONARY DENSON DALE MJ VISIONARY INT 157 53<br />
108 65<br />
69 104 33<br />
ABS<br />
33 NZGIVINS OKURA LFB IVINS INT 155 54<br />
128 70<br />
115 104 31<br />
LIC<br />
34 JEPERImETER ROCK ELLA PERIMITER AUS 155 98<br />
127 99 2849 461 104 97<br />
SEM<br />
35 JEJEEP KAARMONA JEEP AUS 154 81 87 87 111 40 106 71<br />
SEM<br />
36 BARTPOWER DARAWAY FLOWERPOWER SATIRA AUS 152 84 83 91 130 55 104 69<br />
GAC<br />
37 NZGOKURAICE OKURA DE ICE INT 151 55<br />
125 69<br />
89 103 33<br />
LIC<br />
38 ALTAmERCH SUNSET CANYON MARCHANT INT 151 55 90 65<br />
95 108* 48<br />
ALT<br />
39 SARATOGA BERCAR SARATOGA AUS 151 93 87 97 407 136 105 82<br />
GAC<br />
40 SPIRITUAL RIVERSIDE SPIRIT AUS 150 73 76 82 55 22 107 55<br />
AGR<br />
The bull must meet minimum requirements for reliability, is active and more than 1 standard deviation above average for Profit $.<br />
For the full list go to www.adhis.com.au<br />
RELIABILITY<br />
PRODUCTION $<br />
RELIABILITY<br />
AUSTRALIAN<br />
DAUGHTERS<br />
AUSTRALIAN<br />
HERDS<br />
FOREIGN<br />
DAUGHTERS FIRST<br />
SURVIVAL<br />
RELIABILITY<br />
SOURCE<br />
<strong>Australian</strong> <strong>Dairy</strong> <strong>Herd</strong> <strong>Improvement</strong> <strong>Report</strong> 2010 25
2010 <strong>Australian</strong> Breeding Values – Good Bulls Guide<br />
Red Breeds Profit (Aug 2010)<br />
PROFIT PRODUCTION LONGEVITY<br />
PROFIT RANK<br />
BULL ID<br />
BULL NAmE<br />
GENETIC CODES<br />
AUSTRALIAN PROVEN<br />
OR INTERNATIONAL<br />
PROFIT $<br />
RELIABILITY<br />
PRODUCTION $<br />
RELIABILITY<br />
AUSTRALIAN<br />
DAUGHTERS<br />
AUSTRALIAN<br />
HERDS<br />
FOREIGN<br />
DAUGHTERS FIRST<br />
SURVIVAL<br />
RELIABILITY<br />
SOURCE<br />
1 RANDERSDAVID R DAVID TVTL INT 242 62<br />
156 73<br />
1274 110 49 RED<br />
2 ARBBOBDOWN LODEN BOB AUS 238 79<br />
203 87 88 43 104 61 GAC<br />
3 ARBmAWSON BOSGOWAN MAWSON AUS 227 72<br />
142 78 54 34 105 62 GAC<br />
4 ARBBONJOVI BOSGOWAN BON JOVI AUS 223 75<br />
162 82 82 43 104 65 GAC<br />
5 PETERSLUND PETERSLUND 1213 AUS 223 93<br />
118 98 539 78 109 82 RED<br />
6 OBROLIN1804 O BROLIN 1804 INT 220 61<br />
153 73<br />
7555 108 55 RED<br />
7 NZGBRODY CARMELGLEN BRODY INT 218 50<br />
147 68<br />
73 LIC<br />
8 ATOSIKKO ASMO TOSIKKO INT 213 55<br />
156 68<br />
156 RED<br />
9 GEDBO2263 G EDBO INT 200 59<br />
206 70<br />
155 RED<br />
10 FASTRUP R FASTRUP INT 200 58<br />
136 68<br />
103 RED<br />
11 RBANGKOK R BANGKOK INT 200 59 122 72<br />
2019 106 48 RED<br />
12 NZGROYALPHIL SANROSA ROYAL PHILLIP INT 193 60 156 75<br />
1559 106 40 LIC<br />
13 ARBRIDLEY BOSGOWAN RIDLEY AUS 193 77<br />
143 83 83 42 103 67 GAC<br />
14 BOTANS3829 BOTANS 3829 AUS 185 92<br />
128 97 483 74 105 81 RED<br />
15 ARBEROS ARAJARRA EROS AUS 184 38<br />
97 47 12 5 GAC<br />
16 NZLCHALLENGE KILFENNAN CHALLENGE AUS 182 89<br />
121 97 464 45 105 67 LIC<br />
17 ARBmOLONE BOSGOWAN MOLONEY AUS 180 65<br />
107 77 56 26 103 36 GAC<br />
18 ORRARYD1433 ORRARYD 1433 AUS 175 91<br />
113 97 363 63 104 79 RED<br />
19 JUBY1617 JUBY VALOR 1617 ET AUS 168 79<br />
101 88 56 14 RED<br />
20 ALINNE2385 A LINNE INT 168 59 92 70<br />
207 RED<br />
Guernsey Profit (Aug 2010)<br />
PROFIT PRODUCTION LONGEVITY<br />
PROFIT RANK<br />
BULL ID<br />
BULL NAmE<br />
GENETIC CODES<br />
AUSTRALIAN PROVEN<br />
OR INTERNATIONAL<br />
PROFIT $<br />
RELIABILITY<br />
PRODUCTION $<br />
RELIABILITY<br />
AUSTRALIAN<br />
DAUGHTERS<br />
AUSTRALIAN HERDS<br />
FOREIGN<br />
DAUGHTERS FIRST<br />
SURVIVAL<br />
RELIABILITY<br />
SOURCE<br />
1 WYSNIDER SNIDERS OPTION AARON INT 158 57<br />
167 67 0 0 100 101 43<br />
WYA<br />
2 TIRESFORD TIRESFORD PEDRO INT 157 53<br />
125 65 0 0 127 101 41<br />
AGR<br />
3 GUJULIUS ACCELERATED GOLDEN GENETICS JULIUS ET AUS 155 72<br />
165 85 83 29 0 99 50<br />
SEM<br />
4 WYLEWIS TROTACRE ENHANCER LEWIS INT 143 56<br />
114 67 0 0 580 102 45<br />
WYA<br />
5 7G394 PENNY LANE ROYAL OAK TURLEY INT 126 45<br />
120 56 0 0 65 102 32<br />
WWS<br />
Brown Swiss Profit (Aug 2010)<br />
PROFIT PRODUCTION LONGEVITY<br />
PROFIT RANK<br />
BULL ID<br />
BULL NAmE<br />
GENETIC CODES<br />
AUSTRALIAN PROVEN<br />
OR INTERNATIONAL<br />
PROFIT $<br />
RELIABILITY<br />
PRODUCTION $<br />
RELIABILITY<br />
AUSTRALIAN<br />
DAUGHTERS<br />
AUSTRALIAN HERDS<br />
FOREIGN<br />
DAUGHTERS FIRST<br />
SURVIVAL<br />
RELIABILITY<br />
SOURCE<br />
1 GGEVENT EVENT AUS 143 65<br />
89 80<br />
45 18 103 39 ABS<br />
2 SWISSEDGE ELM PARK JUPITERS EDGE AUS 86 82<br />
45 95 266 72 99 60 GAC<br />
3 GGVID VIDEO AUS 48 55<br />
25 74 52 10 ABS<br />
4 TURmOIL OLD MILL B TURMOIL AUS 45 69<br />
26 89 130 46 100 27 ALT<br />
The bull must meet minimum requirements for reliability, is active and more than 1 standard deviation above average for Profit $.<br />
For the full list go to www.adhis.com.au<br />
26 <strong>Australian</strong> <strong>Dairy</strong> <strong>Herd</strong> <strong>Improvement</strong> <strong>Report</strong> 2010
2010 <strong>Australian</strong> Breeding Values – Top <strong>Herd</strong> Summary<br />
Top 2% of Holstein herds based on herd average ASI, August 2010 ABVs<br />
ASI<br />
rank<br />
Owner name Address Post<br />
code<br />
National<br />
<strong>Herd</strong> ID<br />
No. of<br />
cows<br />
on file<br />
No. of<br />
current<br />
cows<br />
1 MCRAE SA & NM NAMBROK 3847 2B0043B 598 243 88 14 0.05 407 17 -0.01<br />
2 ANDERSON WR & BL KONGWAK 3951 540597R 1128 264 87 15 0.04 475 16 -0.06<br />
3 KITCHEN J M SONS BOYANUP 6237 W00248F 1617 440 84 12 0.06 333 16 0.03<br />
4 HOGG A & J BIGGARA 3707 C00155U 801 166 81 11 0.10 197 15 0.10<br />
5 HENRY TW & TC TINAMBA 3859 240108T 2018 558 79 13 0.06 361 13 -0.03<br />
5 PERRETT RJ & HE KONGWAK 3951 540624E 517 215 79 17 -0.01 637 11 -0.24<br />
7 COCHRANE W & K ROCHESTER 3561 CF0597Q 99 65 77 13 0.00 482 18 -0.04<br />
8 PARRISH TJ & LR BARRENGARRY 2577 N00544Q 1113 137 75 10 0.07 244 15 0.07<br />
9 WAGNER G WINNALEAH 7265 T63SWAA 3111 223 73 12 0.02 397 16 -0.01<br />
10 WALDER RG & CA HEATHMERE 3305 840404W 771 152 72 11 0.05 308 14 0.01<br />
11 GLASGOW PW BENA 3946 540565I 807 120 70 12 0.02 404 13 -0.07<br />
11 COOK RJ & JP WANGARATTA 3678 C00276F 1604 519 70 11 0.04 337 13 -0.02<br />
13 COATES JD ALLESTREE 3305 840377M 1025 221 66 12 0.02 394 12 -0.07<br />
14 JOHNSTON RSN & LJ BUNDALAGUAH 3851 240024G 1703 675 65 11 0.02 366 13 -0.04<br />
14 FLEMMING GM & PE TOCUMWAL 2714 4A1373N 1129 305 65 11 0.02 350 13 -0.03<br />
14 GLASGOW DC & EJ BENA 3946 540564F 502 126 65 11 0.02 355 13 -0.03<br />
14 LAMBALK JW & JC TIMBOON 3268 650274B 1080 394 65 10 0.06 252 10 -0.02<br />
18 DICKSON BJ & JL TERANG 3264 850441U 2398 620 62 11 0.02 381 9 -0.10<br />
19 HEYWOOD BO & LD YARRAGON 3823 240851B 908 197 60 10 0.06 245 9 -0.02<br />
19 COSTER B & M RIPPLEBROOK 3818 981306Q 1596 775 60 9 0.06 216 11 0.03<br />
19 WOODBINE HOLDINGS PTY LTD LANCASTER 3620 B20571E 2112 684 60 11 0.03 340 9 -0.08<br />
22 KENNEDY R & M SALE 3850 240025J 1338 192 59 11 0.01 376 10 -0.08<br />
22 MACQUEEN AD & GL YANAKIE 3960 540139F 1152 229 59 9 0.05 254 9 -0.02<br />
24 LIA TO & PM PTY LTD NILMA NORTH 3821 540184S 569 212 58 10 -0.03 413 16 -0.03<br />
24 NICHOLLS RJ & HJ STANHOPE 3623 C00691E 715 141 58 9 0.03 275 11 -0.01<br />
24 AULT GK & JM ROCHESTER 3561 C00857B 596 144 58 9 0.01 312 14 0.01<br />
27 KERRINS FAMILY TRUST KATUNGA 3640 C00455G 643 106 57 8 0.01 282 15 0.05<br />
28 YATES PD & SMITH AJ NAMBROK 3847 2J0073F 175 170 56 7 0.05 173 13 0.08<br />
29 GALE DP & J TIMBOON 3268 650188L 2595 524 55 10 0.03 302 8 -0.06<br />
29 TWEDDLE SA DARNUM 3822 981058S 1647 571 55 9 0.04 251 9 -0.02<br />
29 HUTTON TF AND SONS CAPEL 6271 W00088D 1700 501 55 6 0.09 55 10 0.10<br />
32 FEHRING BN NO 2. COHUNA 3568 4A2159B 906 175 53 8 0.04 219 11 0.03<br />
32 OANWAYJE FARMS LONGWARRY 3816 5C0049C 1331 775 53 7 0.05 184 11 0.05<br />
34 PRICE IH & SW SANDY CREEK 3695 4A1330A 874 276 52 8 0.04 196 11 0.03<br />
34 BATTY CG, CJ & MC SMITHTON 7330 T14CBBM 1004 274 52 7 0.05 164 12 0.07<br />
36 WILD RA MITTA MITTA 3701 4A1321C 944 118 51 7 0.04 189 12 0.05<br />
36 DOUGLAS JW & VL LEITCHVILLE 3567 4A2101S 1827 571 51 8 0.03 259 9 -0.03<br />
36 WHITE RP & LJ TIMBOON 3268 650421Q 246 60 51 7 0.03 204 12 0.05<br />
36 RYAN BJ & PM GRASMERE 3281 842120F 1210 315 51 9 0.01 306 10 -0.05<br />
36 JERANG PTY LTD BEGA 2550 N00606V 1460 356 51 7 0.06 133 10 0.06<br />
41 WHITE KL & DM & RL LEONGATHA SOUTH 3953 540605F 1070 344 50 8 0.03 229 11 0.02<br />
ASI<br />
ABV<br />
Prot.<br />
ABV<br />
Prot<br />
%<br />
ABV<br />
Milk<br />
ABV<br />
Fat<br />
ABV<br />
Fat %<br />
ABV<br />
<strong>Australian</strong> <strong>Dairy</strong> <strong>Herd</strong> <strong>Improvement</strong> <strong>Report</strong> 2010 27
2010 <strong>Australian</strong> Breeding Values – Top <strong>Herd</strong> Summary<br />
ASI<br />
rank<br />
Owner name Address Post<br />
code<br />
National<br />
<strong>Herd</strong> ID<br />
No. of<br />
cows<br />
on file<br />
No. of<br />
current<br />
cows<br />
42 RURAL OPERATIONS GROUP NEWBOROUGH 3825 240214L 1552 258 49 8 0.03 246 8 -0.03<br />
42 COMBEN NR & EF YANAKIE 3960 540284V 271 68 49 6 0.06 104 10 0.09<br />
42 MOSCRIPT JB ME CJ & JM LEONGATHA SOUTH 3953 540300E 739 191 49 11 -0.03 443 8 -0.15<br />
45 UEBERGANG IS & JA GORAE WEST 3305 840391T 262 58 48 10 0.01 333 6 -0.11<br />
45 ZURRER JO & AB LONGWARRY 3816 980944I 2214 447 48 6 0.05 138 10 0.05<br />
45 HALL DJ & KJ INVERGORDON 3636 C00315W 880 135 48 6 0.06 86 10 0.09<br />
45 SPRUNT RG KAARIMBA 3635 C01125S 350 164 48 9 -0.01 353 9 -0.08<br />
45 TIMPERON DT & RN BLUMONT 7260 T61STEH 1183 412 48 6 0.04 142 12 0.08<br />
50 PEKIN JF, A & JG TERANG 3264 850550V 998 237 47 7 0.04 189 9 0.01<br />
50 ROWANVALE PTY LTD CAMPERDOWN 3260 850989R 1170 299 47 8 0.02 260 8 -0.04<br />
50 WILLCOCKS P & I YANKALILLA 5203 S00047P 809 206 47 10 -0.03 415 10 -0.11<br />
53 MEADE JF & MB CUDGEE 3265 841874T 736 140 46 8 -0.02 335 12 -0.03<br />
53 MEADE PW & JJ PANMURE 3265 842142N 942 282 46 7 0.03 204 8 -0.02<br />
53 CA & KL SPOKES FAMILY TRUST WEERITE 3260 850530T 401 68 46 9 -0.01 339 8 -0.09<br />
53 MYRLONG/CARROLL PTN MUDGEGONGA 3737 C00273T 890 289 46 8 0.02 255 8 -0.05<br />
53 HALL RO KATUNGA 3640 C00412Q 521 73 46 5 0.08 2 10 0.14<br />
53 STONE P & S PTY LTD LANCASTER 3620 C00614F 1038 305 46 9 0.01 312 6 -0.11<br />
53 GOVETT WF & J DINGEE 3571 C01047A 163 70 46 9 -0.01 338 9 -0.08<br />
53 BRETTSCHNEIDER WL & RFW RAVENSHOE 4872 Q00274N 449 104 46 9 0.02 286 5 -0.10<br />
53 FIELDING R & D SOUTH RIANA 7316 T34GFJM 1329 360 46 6 0.05 117 10 0.07<br />
Top 2% of Jersey herds based on herd average ASI, August 2010 ABVs<br />
1 HOEY DM & L KATUNGA 3640 240699A 901 239 84 9 0.18 11 17 0.31<br />
2 GLENNEN & CO C TERANG 3264 850588C 2285 459 74 5 0.24 -178 17 0.50<br />
3 MILLBROOK ELLIS & CO TALLANDOON 3701 4A1307S 651 31 57 9 0.04 204 8 -0.06<br />
4 MC MANUS BT & CA BAMAWM 3561 C00935T 631 119 51 4 0.17 -130 10 0.32<br />
5 WORBOYS R & A EASY DAIRY ECHUCA 3564 C00993T 1013 260 50 4 0.16 -114 10 0.31<br />
6 PINEGROVE PARK TRUST KATAMATITE 3649 4A1466B 478 32 39 5 0.06 55 7 0.07<br />
7 MOSCRIPT JB ME CJ & JM LEONGATHA SOUTH 3953 540300E 890 72 37 0 0.16 -206 13 0.45<br />
7 HESTER RJ WOOL WOOL 3249 740064P 723 159 37 -1 0.25 -366 9 0.54<br />
9 VAN DEN BOSCH JH & CA CPD LOCKINGTON 3563 C00927B 350 45 35 1 0.18 -216 8 0.36<br />
10 LORD P & S ESKDALE 3701 460052L 284 40 34 3 0.07 -23 9 0.20<br />
Top 2% of Red Breeds herds based on herd average ASI, August 2010 ABVs<br />
Ayrshire<br />
1 NGW FARMS PTY LTD COBRAM 3643 C00402P 109 84 -61 -9 -0.04 -270 -12 -0.01<br />
Illawarra<br />
1 CARSON JH & GL IRREWILLIPE 3249 740170H 38 31 9 6 -0.10 436 1 -0.25<br />
2 SALISBURY MR ANTHONY J RATHDOWNEY 4287 C00042H 376 31 -7 -1 0.00 -40 -2 -0.01<br />
AussieRed<br />
1 GRAHAM RW & BC NUMBAA 2540 N00555U 959 471 54 7 0.06 132 11 0.08<br />
Top 2% of Gernsey herds based on herd average ASI, August 2010 ABVs<br />
1 CLARK PARTNERSHIP CANIABA VIA<br />
LISMORE<br />
2480 N00021N 863 126 9 1 0.01 29 3 0.03<br />
ASI<br />
ABV<br />
Prot.<br />
ABV<br />
Prot<br />
%<br />
ABV<br />
Milk<br />
ABV<br />
Fat<br />
ABV<br />
Fat %<br />
ABV<br />
28 <strong>Australian</strong> <strong>Dairy</strong> <strong>Herd</strong> <strong>Improvement</strong> <strong>Report</strong> 2010
4 <strong>Australian</strong> <strong>Dairy</strong> <strong>Herd</strong> <strong>Improvement</strong> <strong>Report</strong> 2008