Business Update - Sercomm Corporation
Business Update - Sercomm Corporation
Business Update - Sercomm Corporation

Create successful ePaper yourself
Turn your PDF publications into a flip-book with our unique Google optimized e-Paper software.
SerComm <strong>Corporation</strong><br />
2Q’07 Investor Conference<br />
August 16th, 2007
Agenda<br />
- Welcome and Introduction<br />
- 2Q’07 & 1H’07 Financial Results<br />
- <strong>Business</strong> <strong>Update</strong><br />
- Q & A
Safe Harbor Notice<br />
The following presentation may contain forward-looking<br />
statements regarding, among other things, our financial<br />
condition, future expansion plans and business strategies<br />
based on our current expectations and projections about<br />
future events. Although we believe that these expectations<br />
and projections are reasonable, such forward-looking<br />
statements are inherently subject to risks, uncertainties and<br />
assumptions.<br />
The company undertakes no obligation to publicly update or<br />
revise any forward-looking statements whether as a result of<br />
new information, future events or otherwise. The actual<br />
results could differ materially from those contained in these<br />
forward-looking statements.
2Q07 Income Statement<br />
Consolidated<br />
2007<br />
2006<br />
NT$ Million Q2 % Q2 % Change<br />
Net Sales 2,742 100.0% 2,295 100.0% 19.5%<br />
Gross Profit 424 15.5% 307 13.4% 38.1%<br />
Operating Expenses 216 7.9% 183 8.0% 18.0%<br />
Operating Profit 208 7.6% 124 5.4% 67.7%<br />
Non-operating Income 19 0.7% 9 0.4% 111.1%<br />
Non-operating Expenses 49 1.8% 21 0.9% 133.3%<br />
Income Before Tax 178 6.5% 112 4.9% 58.9%<br />
Net Income 153 5.6% 100 4.4% 53.0%<br />
EPS (NT$1) 1.19 0.77<br />
Weighted Average Shares<br />
Outstanding (MN)<br />
130 130
2Q07 Income Statement<br />
Consolidated<br />
2007<br />
2007<br />
NT$ Million Q2 % Q1 % Change<br />
Net Sales 2,742 100.0% 2,438 100.0% 12.5%<br />
Gross Profit 424 15.5% 342 14.0% 24.0%<br />
Operating Expenses 216 7.9% 193 7.9% 11.9%<br />
Operating Profit 208 7.6% 149 6.1% 39.6%<br />
Non-operating Income 19 0.7% 7 0.3% 171.4%<br />
Non-operating Expenses 49 1.8% 26 1.1% 88.5%<br />
Income Before Tax 178 6.5% 130 5.3% 36.9%<br />
Net Income 153 5.6% 111 4.6% 37.8%<br />
EPS (NT$1) 1.19 0.85<br />
Weighted Average Shares<br />
Outstanding (MN)<br />
130 130
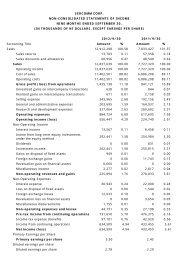
1H07 Income Statement<br />
Consolidated<br />
2007 2006<br />
(In NT$MN) 1H % 1H % Change<br />
Net Revenue 5,180 100.0% 3,647 100.0% 42.0%<br />
Cost of Goods Sold 4,414 85.2% 3,182 87.2% 38.7%<br />
Gross Profit 766 14.8% 465 12.8% 64.7%<br />
Operating expenses 409 7.9% 325 8.9% 25.8%<br />
Operating Profit 357 6.9% 140 3.8% 155.0%<br />
Non-operating Income 26 0.5% 12 0.3% 116.7%<br />
Non-operating Expenses 75 1.4% 24 0.7% 212.5%<br />
Income before Tax 308 5.9% 129 3.5% 138.8%<br />
Net Income 264 5.1% 117 3.2% 125.6%<br />
EPS(NTD$1) 2.04 0.88<br />
Weighted Average Shares<br />
Outstanding (MN) 130 130
Historic Quarterly Sales<br />
Unit:NT$ Billion<br />
2.44<br />
2.29<br />
2.74<br />
2.69 2.8<br />
1.51 1.55<br />
1.35<br />
1.32<br />
1.26<br />
1.27<br />
1.23 1.31<br />
1.19<br />
1.24<br />
1.05<br />
0.81<br />
0.71<br />
‘03 ’04 ’05 ’06 ’07<br />
‘03 ’04 ’05 ’06 ’07<br />
‘03 ’04 ’05 ’06<br />
‘03 ’04 ’05 ’06<br />
Q1 Q2 Q3 Q4
Revenue Breakdown<br />
by Product<br />
Other<br />
4%<br />
<strong>Business</strong><br />
Router<br />
10%<br />
Triple-Play<br />
18%<br />
1H 2007<br />
Adapter<br />
8%<br />
Print<br />
Server<br />
6% Home<br />
Gateway<br />
38%<br />
BR<br />
7%<br />
PS<br />
7%<br />
Other<br />
5%<br />
Home<br />
Router<br />
16%<br />
Year 2006<br />
Adapter<br />
10%<br />
HR<br />
28%<br />
HG<br />
43%
Revenue Breakdown by<br />
Geography<br />
1H 2007<br />
North<br />
America<br />
46%<br />
Year 2006<br />
Asia ex-<br />
Taiwan<br />
4%<br />
Taiwan<br />
2%<br />
North<br />
America<br />
37%<br />
Asia ex-<br />
Taiwan<br />
3%<br />
Taiwan<br />
4%<br />
Europe<br />
48%<br />
Europe<br />
56%
Balance Sheet<br />
Consolidated<br />
June 30, 2007 December 31, 2006<br />
NT$ Million Amount % Amount %<br />
Cash Equivalents 949 20% 887 18%<br />
A/R 1,283 27% 1,379 28%<br />
Inventory 959 20% 1,204 24%<br />
Fixed Assets 1,480 31% 1,137 23%<br />
Longterm Investment 48 1% 55 1%<br />
Total Assets 4,719 100% 5,008 100%<br />
Loan 0 0% 277 6%<br />
A/P 2,029 43% 2,292 46%<br />
Leasehold Payable 257 5% 259 5%<br />
Other Payable 444 9% 328 7%<br />
Stockholders' Equity 1,989 42% 1,852 37%<br />
A/R Turnover Days 47 46<br />
Inventory Turnover Days 41 44<br />
A/P Turnover Days 88 83
Consolidated Cash Flow<br />
NT$Million June 30, 2007 June 30, 2006<br />
-Net profit 265 177<br />
-Depreciation & Amortization 84 72<br />
-Other Op Sources/(Uses) 55 (81)<br />
From Operation 404 108<br />
-L-T Investment 0 0<br />
-Fixed Assets (37) (104)<br />
-Other Investing Sources/(Uses) (24) (20)<br />
From Investment (61) (124)<br />
-Cash Dividends- Common Stock 0 0<br />
-L-T Liabilities (5) (4)<br />
-Treasury Stock 0 (75)<br />
-Other Financing Sources/(Uses) (276) 118<br />
From Financing (281) 39<br />
Net Cash Position Change 62 23<br />
Cash Equivalents at end the year 949 519
<strong>Business</strong> <strong>Update</strong><br />
• Better product mix has contributed to gross margin<br />
improvement in 1H’07<br />
• Increasing sales of business router with market<br />
share gain in SMB market<br />
• Growing demand of integrated products from<br />
European service provider market<br />
- Triple-play products (data, voice and video) with rich application<br />
software start to ramp up<br />
- Increasing new broadband services (VoIP, MOD,…etc) offered by<br />
service providers<br />
• Market share leader in WiFi ADSL gateway market<br />
- Over 2.2MN units shipment in 1H’07<br />
- More migration to 11n in 2 nd half of the year
<strong>Business</strong> <strong>Update</strong><br />
• Print Server<br />
- Solid market leading position with design wins from all major printer<br />
makers<br />
- Over 400k units shipped in 1H’07<br />
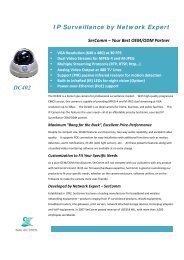
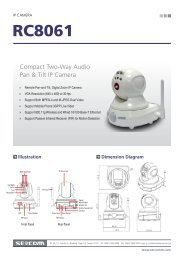
• IP Surveillance<br />
- Design wins from global leading networking companies<br />
- H.264 IP Camera to be launched in 2H’07<br />
• Manufacturing capacity remains tight and will seek to<br />
expand capacity in 2H’07<br />
• Transferred to be listed in TSEC with tentative filing<br />
schedule by end of August
Q & A<br />
www.sercomm.com