Transform coding techniques for lossy hyperspectral data compression
Transform coding techniques for lossy hyperspectral data compression
Transform coding techniques for lossy hyperspectral data compression

You also want an ePaper? Increase the reach of your titles
YUMPU automatically turns print PDFs into web optimized ePapers that Google loves.
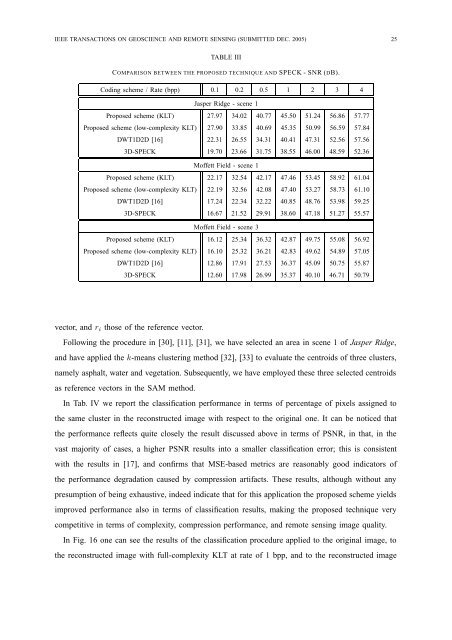
IEEE TRANSACTIONS ON GEOSCIENCE AND REMOTE SENSING (SUBMITTED DEC. 2005) 25<br />
TABLE III<br />
COMPARISON BETWEEN THE PROPOSED TECHNIQUE AND SPECK - SNR (DB).<br />
Coding scheme / Rate (bpp) 0.1 0.2 0.5 1 2 3 4<br />
Jasper Ridge - scene 1<br />
Proposed scheme (KLT) 27.97 34.02 40.77 45.50 51.24 56.86 57.77<br />
Proposed scheme (low-complexity KLT) 27.90 33.85 40.69 45.35 50.99 56.59 57.84<br />
DWT1D2D [16] 22.31 26.55 34.31 40.41 47.31 52.56 57.56<br />
3D-SPECK 19.70 23.66 31.75 38.55 46.00 48.59 52.36<br />
Moffett Field - scene 1<br />
Proposed scheme (KLT) 22.17 32.54 42.17 47.46 53.45 58.92 61.04<br />
Proposed scheme (low-complexity KLT) 22.19 32.56 42.08 47.40 53.27 58.73 61.10<br />
DWT1D2D [16] 17.24 22.34 32.22 40.85 48.76 53.98 59.25<br />
3D-SPECK 16.67 21.52 29.91 38.60 47.18 51.27 55.57<br />
Moffett Field - scene 3<br />
Proposed scheme (KLT) 16.12 25.34 36.32 42.87 49.75 55.08 56.92<br />
Proposed scheme (low-complexity KLT) 16.10 25.32 36.21 42.83 49.62 54.89 57.05<br />
DWT1D2D [16] 12.86 17.91 27.53 36.37 45.09 50.75 55.87<br />
3D-SPECK 12.60 17.98 26.99 35.37 40.10 46.71 50.79<br />
vector, and r i those of the reference vector.<br />
Following the procedure in [30], [11], [31], we have selected an area in scene 1 of Jasper Ridge,<br />
and have applied the k-means clustering method [32], [33] to evaluate the centroids of three clusters,<br />
namely asphalt, water and vegetation. Subsequently, we have employed these three selected centroids<br />
as reference vectors in the SAM method.<br />
In Tab. IV we report the classification per<strong>for</strong>mance in terms of percentage of pixels assigned to<br />
the same cluster in the reconstructed image with respect to the original one. It can be noticed that<br />
the per<strong>for</strong>mance reflects quite closely the result discussed above in terms of PSNR, in that, in the<br />
vast majority of cases, a higher PSNR results into a smaller classification error; this is consistent<br />
with the results in [17], and confirms that MSE-based metrics are reasonably good indicators of<br />
the per<strong>for</strong>mance degradation caused by <strong>compression</strong> artifacts. These results, although without any<br />
presumption of being exhaustive, indeed indicate that <strong>for</strong> this application the proposed scheme yields<br />
improved per<strong>for</strong>mance also in terms of classification results, making the proposed technique very<br />
competitive in terms of complexity, <strong>compression</strong> per<strong>for</strong>mance, and remote sensing image quality.<br />
In Fig. 16 one can see the results of the classification procedure applied to the original image, to<br />
the reconstructed image with full-complexity KLT at rate of 1 bpp, and to the reconstructed image