Variation in Populations.pdf
Variation in Populations.pdf
Variation in Populations.pdf

You also want an ePaper? Increase the reach of your titles
YUMPU automatically turns print PDFs into web optimized ePapers that Google loves.
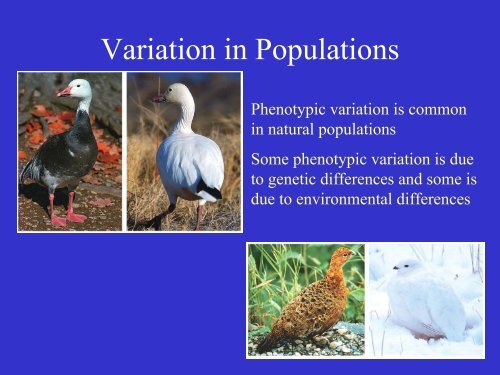
<strong>Variation</strong> <strong>in</strong> <strong>Populations</strong><br />
Phenotypic variation is common<br />
<strong>in</strong> natural populations<br />
Some phenotypic variation is due<br />
to genetic differences and some is<br />
due to environmental differences
Commonly, phenotypic<br />
variation has an<br />
underly<strong>in</strong>g genetic basis<br />
but is polygenic with<br />
many genes <strong>in</strong>fluenc<strong>in</strong>g<br />
the phenotype.<br />
<strong>Variation</strong> that has an<br />
underly<strong>in</strong>g genetic basis<br />
is important<br />
evolutionarily. The<br />
frequency of different<br />
forms of a gene can<br />
change.
Dist<strong>in</strong>guish<strong>in</strong>g between genetic and environmental sources of<br />
variation can be accomplished <strong>in</strong> several ways:<br />
1. Controlled crosses - cross<strong>in</strong>g <strong>in</strong>dividuals of different<br />
phenotypes to produce an F1 and F2 generation can show that<br />
variation segregates <strong>in</strong> an Mendelian fashion (3:1, 1:2:1, 9:3:3:1,<br />
etc.)<br />
2. Correlation between relatives. On average parents and<br />
children share half their genes. Genetically identical tw<strong>in</strong>s<br />
should be identical for genetically determ<strong>in</strong>ed traits.<br />
12<br />
Ideally, relatives should<br />
10<br />
be reared <strong>in</strong> different<br />
8<br />
6<br />
environments to<br />
4<br />
r = 1<br />
dist<strong>in</strong>guish genetic and<br />
2<br />
0<br />
environmental sources<br />
0 5 10 15<br />
Tw<strong>in</strong> 1<br />
of variation..<br />
Tw<strong>in</strong> 2
3. Common garden study - variation seen between two different<br />
natural populations could be due to genetic differences or due to<br />
the differences <strong>in</strong> the environments that <strong>in</strong>fluence the phenotype.<br />
To dist<strong>in</strong>guish between them, <strong>in</strong>dividuals from both populations<br />
can be reared <strong>in</strong> a common environment.<br />
Lake Verret<br />
Reelfoot Lake<br />
Wild Offspr<strong>in</strong>g Mass 0.81 mg 0.93 mg<br />
Common Garden Mass 0.66 mg 0.79 mg<br />
The difference <strong>in</strong> offspr<strong>in</strong>g size<br />
rema<strong>in</strong>s (there is a genetic basis<br />
for the difference) but the<br />
offspr<strong>in</strong>g were not as large as<br />
found <strong>in</strong> natural populations (there<br />
is also a environmental effect on<br />
offspr<strong>in</strong>g size).
How Genetic <strong>Variation</strong> Behaves <strong>in</strong> Natural <strong>Populations</strong> - the<br />
Hardy We<strong>in</strong>berg Pr<strong>in</strong>ciple.<br />
Regardless of the <strong>in</strong>itial distribution of genotypes, one generation<br />
of random mat<strong>in</strong>g will produce a b<strong>in</strong>omial distribution of alleles<br />
among genotypes - and this distribution will persist <strong>in</strong>def<strong>in</strong>itely ...
… so long as mat<strong>in</strong>g is random, the population is very large, there<br />
is no <strong>in</strong>put of alleles from other populations, there is no<br />
mutational change <strong>in</strong> alleles, and there is no differential survival<br />
or reproduction of different genotypes.<br />
Violation of any of these requirements can result <strong>in</strong> a distribution of<br />
genotypes other than b<strong>in</strong>omial or can result <strong>in</strong> a change <strong>in</strong> the<br />
frequencies of alleles from one generation to the next, i.e. evolution.<br />
Non-random mat<strong>in</strong>g can take several forms - like mat<strong>in</strong>g with like,<br />
like mat<strong>in</strong>g with non-like, or any active preference of certa<strong>in</strong><br />
phenotypes for mates.<br />
Inbreed<strong>in</strong>g - the mat<strong>in</strong>g of close relatives - is a type of nonrandom<br />
mat<strong>in</strong>g that can be detected by exam<strong>in</strong><strong>in</strong>g genotypic frequencies - the<br />
frequency of heterozygotes is less than expected for a randomly<br />
mat<strong>in</strong>g population.
The difference between the observed frequency of heterozygotes<br />
(H) and the expected frequency of heterozygotes (H 0 - if mat<strong>in</strong>g<br />
was random) relative to the expected frequency (H 0 ) is a measure<br />
of <strong>in</strong>breed<strong>in</strong>g - the <strong>in</strong>breed<strong>in</strong>g coefficient (F).<br />
F<br />
=<br />
H<br />
−<br />
H<br />
0<br />
0<br />
H<br />
If <strong>in</strong>breed<strong>in</strong>g is<br />
the cause of the<br />
heterozygote<br />
deficiency, then<br />
F should be<br />
nearly the same<br />
for all genes.
Studies of <strong>in</strong>bred l<strong>in</strong>es of Drosophila revealed that heterozygotes<br />
often have higher viability than homozygotes. There is a large of<br />
amount of deleterious genetic variation <strong>in</strong> natural populations that<br />
is not expressed <strong>in</strong> heterozygotes.<br />
Other studies have<br />
confirmed the high<br />
degree of deleterious<br />
recessive genetic<br />
variation <strong>in</strong> wild<br />
populations of other<br />
organisms.
Inbreed<strong>in</strong>g results <strong>in</strong> greater expression of deleterious recessive<br />
alleles than would be seen <strong>in</strong> randomly mat<strong>in</strong>g populations. The<br />
overall reduction of the average fitness of <strong>in</strong>dividuals <strong>in</strong> the<br />
population is called “<strong>in</strong>breed<strong>in</strong>g depression.”<br />
From a study of humans <strong>in</strong><br />
Italy 1903-1907.<br />
Viability was <strong>in</strong>creased <strong>in</strong> a small<br />
population of adders <strong>in</strong> Sweden<br />
when <strong>in</strong>dividuals from outside were<br />
<strong>in</strong>troduced <strong>in</strong> 1992.
Although genetically based phenotypic variation is common, it<br />
only accounts for a small fraction of the total genome. Prote<strong>in</strong><br />
variation - the product of genes - can be assessed us<strong>in</strong>g gel<br />
electrophoresis.<br />
Lewont<strong>in</strong> & Hubby (1966) first assessed prote<strong>in</strong> variation <strong>in</strong><br />
Drosophila us<strong>in</strong>g gel electrophoresis. They assayed enzymatic<br />
variation. Different forms of an enzyme are called allozymes.<br />
Allozymes differ by one or more am<strong>in</strong>o acids and thus migrate at<br />
different rates when placed <strong>in</strong> an electric field.<br />
Their study and similar studies<br />
<strong>in</strong> other organisms have shown<br />
that on average <strong>in</strong>dividuals are<br />
heterozygous for 10% or more<br />
of their genes. There is a lot of<br />
genetic variation <strong>in</strong> populations.
Although random mat<strong>in</strong>g among any distribution of genotypes<br />
produces a b<strong>in</strong>omial distribution of genotypes <strong>in</strong> just one generation,<br />
the variation at two different genes does not mix as quickly.<br />
For two genes, A and B, each with two alleles (A 1 , A 2 , B 1 , B 2 ) and<br />
with each allele <strong>in</strong> equal frequency [f(A 1 )=p, f(A 2 )=q, f(B 1 )=r,<br />
f(B 2 )=s] we should expect each to have a b<strong>in</strong>omial distribution and<br />
be present <strong>in</strong> all possible comb<strong>in</strong>ations <strong>in</strong> proportion to their<br />
frequencies.<br />
Substitut<strong>in</strong>g a for A 2 and b for B 2 :<br />
For the A gene:<br />
f(AA) = p 2 , f(Aa) = 2pq, f(aa) = q 2<br />
For the B gene:<br />
f(BB) = r 2 , f(Bb) = 2rs, f(bb) = s 2<br />
For both genes together<br />
f(AABB) = p 2 * r 2<br />
f(AABb) = p 2 * 2rs<br />
f(AAbb) = p 2 * s 2<br />
f(AaBB) = 2pq * r 2<br />
f(AaBb) = 2pq * 2rs<br />
f(Aabb) = 2pq * s 2<br />
f(aaBB) = q 2 * s 2<br />
f(aaBb) = q 2 * 2rs<br />
f(aabb) = q 2 * s 2
Equilibrium at 2 genes can take<br />
several generations to achieve.<br />
When a population is not at<br />
equilibrium for multiple genes it is <strong>in</strong><br />
“l<strong>in</strong>kage disequilibrium.”<br />
Disequilibrium can be measured as<br />
d = f(AB)*f(ab) – f(Ab)*f(aB)<br />
d 0 = 0.5*0.5 - 0*0= 0.25<br />
d 1 = 0.375*0.375 - 0.125*0.125 = 0.125<br />
d 2 =0.3075*0.3075 - 0.1875*0.1875 =0.0594<br />
with cont<strong>in</strong>ued random mat<strong>in</strong>g<br />
disequilibrium decreases to 0.
Even though it is called l<strong>in</strong>kage disequilibrium it occurs with l<strong>in</strong>ked<br />
or nonl<strong>in</strong>ked genes. The example above assumed the genes were on<br />
different chromosomes, assort<strong>in</strong>g <strong>in</strong>dependently. If the genes are on<br />
the same chromosome, cross<strong>in</strong>g-over is required to produce the<br />
recomb<strong>in</strong>ant gametes (Ab, and aB <strong>in</strong> this case). The more closely<br />
l<strong>in</strong>ked the genes are the less will be the frequency of cross<strong>in</strong>g-over<br />
and it will take longer to achieve l<strong>in</strong>kage equilibrium.<br />
Most populations exhibit<br />
equilibrium for multiple genes,<br />
but there are some exceptions.<br />
Inversion heterozygotes don’t<br />
produce recomb<strong>in</strong>ant gametes -<br />
preserv<strong>in</strong>g the orig<strong>in</strong>al gene<br />
comb<strong>in</strong>ations and l<strong>in</strong>kage<br />
disequilibrium.<br />
Primrose<br />
Primula vulgaris<br />
G and A are closely l<strong>in</strong>ked
Polygenic <strong>in</strong>heritance - for many traits,<br />
phenotypic variation is due to multiple<br />
genes that each have small effects on<br />
the phenotype - quantitative variation.
The environment can also <strong>in</strong>fluence the phenotype. Phenotypic<br />
variation that is due to different environmental conditions is<br />
called environmental variation (V e )
<strong>Variation</strong> <strong>in</strong> phenotypes is due<br />
to the environment (Ve) and due<br />
to genetic differences (Vg). The<br />
contributions of each can be<br />
quantified.<br />
With<strong>in</strong> genetically identical<br />
l<strong>in</strong>es the only phenotypic<br />
variation is environmental<br />
variation.
Heritability (H 2 )- the proportion of phenotypic variation (Vp) <strong>in</strong><br />
the population that is due to underly<strong>in</strong>g genetic variation (Vg)<br />
Vp = Ve + Vg H 2 = Vg/Vp<br />
H 2 = 1 all phenotypic variation is due to genetic differences<br />
H 2 = 0 all phenotypic variation is due to environmental<br />
differences<br />
H 2 = 0.6 60% of the phenotypic variation <strong>in</strong> the population is<br />
due to genetic variation, 40% is due to environmental variation
Measurement of Heritability<br />
tw<strong>in</strong> studies - a large set of identical tw<strong>in</strong>s reared apart can<br />
<strong>in</strong>dicate the how much variation is due to environmental<br />
differences s<strong>in</strong>ce there are no genetic differences between<br />
identical tw<strong>in</strong>s.<br />
12<br />
12<br />
10<br />
10<br />
8<br />
8<br />
Tw<strong>in</strong> 2<br />
6<br />
Tw<strong>in</strong> 2<br />
6<br />
4<br />
r = 1<br />
4<br />
r = 0.5<br />
2<br />
2<br />
0<br />
0 5 10 15<br />
Tw<strong>in</strong> 1<br />
0<br />
0 5 10 15<br />
Tw<strong>in</strong> 1<br />
For identical tw<strong>in</strong>s reared apart, the<br />
correlation coefficient (r) is equal to the<br />
heritability of the phenotypic trait.<br />
Tw<strong>in</strong> 2<br />
12<br />
10<br />
8<br />
6<br />
4<br />
2<br />
r = 0<br />
0<br />
0 5 10 15<br />
Tw<strong>in</strong> 1
Correlation between close relatives - the correlation statistic (r)<br />
between the phenotypes of close relatives should reflect their degree<br />
of genetic relatedness if the trait has heritability near 1. A<br />
correlation less than expected based on genetic relatedness <strong>in</strong>dicates<br />
that some of the phenotypic difference between relatives is due to<br />
environmental differences. Most often parents and offspr<strong>in</strong>g are<br />
compared us<strong>in</strong>g the parental mean phenotype of the offspr<strong>in</strong>g mean<br />
phenotype.
Selection experiments - selection based on phenotypic differences<br />
should result <strong>in</strong> change <strong>in</strong> the average phenotype of the next<br />
generation if the phenotypic difference is heritable. The amount of<br />
change relative to the amount of selection reflects heritability.<br />
Selection experiment:<br />
Parental generation has an average phenotype<br />
of P<br />
Some of those parents are selected to produce<br />
the next generation. They have an average<br />
phenotype of S<br />
They produce offspr<strong>in</strong>g with an average<br />
phenotype of O.<br />
The selection <strong>in</strong>tensity: I = S-P<br />
The response to selection: R = O-P<br />
Heritability: H 2 = R/I
Flies with no overall preference for fly<strong>in</strong>g<br />
toward or away from the light can be selected<br />
for positive phototaxis or negative phototaxis.<br />
H 2 = 0.09<br />
After many generations of selection the<br />
response to selection decreases.<br />
Pure-bred l<strong>in</strong>es have little genetic<br />
variation for respond<strong>in</strong>g to selection.<br />
<strong>Variation</strong> with<strong>in</strong> pure-bred l<strong>in</strong>es is<br />
mostly or entirely environmental -<br />
heritability is very low.
All estimates of heritability apply only to the environment <strong>in</strong><br />
which they were measured.<br />
Vp = Ve + Vg H 2 = Vg/Vp<br />
If the study is done <strong>in</strong> an environment that varies little, then little<br />
phenotypic variation will result from environmental variation and<br />
the estimate of heritability will be high.<br />
If the study is done <strong>in</strong> an environment that varies greatly, then<br />
there may be a large amount of phenotypic variation that is due to<br />
environmental variation and the estimate of heritability will be<br />
low.
The expression of a s<strong>in</strong>gle genotype may be different <strong>in</strong> different<br />
environments. The pattern of change <strong>in</strong> expression with change <strong>in</strong><br />
environment is called the “norm of reaction.”
When the norm of reaction differs between<br />
different genotypes there is a<br />
genotype x environment <strong>in</strong>teraction<br />
The measurement of heritability often<br />
depends on the environment <strong>in</strong> which the<br />
measurement is made.<br />
V p large and V e small -> H 2 high<br />
V p small and V e larger -> H2 low
Migration (gene flow) and genetic variation.<br />
Gene flow has a homogeniz<strong>in</strong>g effect on populations<br />
The amount of gene flow depends on species mobility and barriers<br />
to dispersal.
Read: <strong>Variation</strong> among <strong>Populations</strong> (p 212-216)