

A Guide for Monitoring and Evaluating Population-Health - Carolina ...
A Guide for Monitoring and Evaluating Population-Health - Carolina ...
A Guide for Monitoring and Evaluating Population-Health - Carolina ...

You also want an ePaper? Increase the reach of your titles
YUMPU automatically turns print PDFs into web optimized ePapers that Google loves.
A <strong>Guide</strong> <strong>for</strong> <strong>Monitoring</strong> <strong>and</strong> <strong>Evaluating</strong><br />
<strong>Population</strong>-<strong>Health</strong>-Environment Programs<br />
MEASURE Evaluation, USAID
A <strong>Guide</strong> <strong>for</strong> <strong>Monitoring</strong> <strong>and</strong> <strong>Evaluating</strong><br />
<strong>Population</strong>-<strong>Health</strong>-Environment Programs<br />
Theresa Finn<br />
This manual was made possible by support from the U.S. Agency <strong>for</strong> International Development (USAID) under the<br />
terms of Cooperative Agreement GPO-A-00-03-00003-00. The opinions expressed are those of the authors <strong>and</strong> do not<br />
necessarily reflect the views of USAID or the United States government.<br />
October 2007<br />
MS-07-25
Acknowledgements<br />
The ef<strong>for</strong>t to compile <strong>and</strong> write this guide was coordinated by MEA-<br />
SURE Evaluation with support provided by the U.S. Agency <strong>for</strong> International<br />
Development (USAID). The author would like to thank Heather<br />
D’Agnes, the population-environment technical advisor at USAID who<br />
has sustained this project with enthusiastic support, sound technical advice,<br />
<strong>and</strong> in-depth feedback throughout the research <strong>and</strong> writing of the<br />
guide, as well as Tom Outlaw, the <strong>for</strong>mer USAID population-environment<br />
technical advisor under whom this guide was conceived. The support <strong>and</strong><br />
participation of others at USAID’s Global <strong>Health</strong> Bureau has been appreciated<br />
in the development of the guide, including Elizabeth Schoeneker,<br />
Rochelle Rainey, Charles Teller, <strong>and</strong> Bamikale Feyistan.<br />
This guide reflects a collective ef<strong>for</strong>t of many individuals <strong>and</strong> organizations<br />
working in the population-health-environment field. Their experience<br />
implementing multi-sectoral programs on four continents provides<br />
the richness <strong>and</strong> variety of content in this guide. Technical input has come<br />
from numerous colleagues from a number of institutions, including Conservation<br />
International, the World Wildlife Fund, the Jane Goodall Institute,<br />
the Woodrow Wilson Center’s Environmental Change <strong>and</strong> Security<br />
Project, <strong>and</strong> the <strong>Population</strong> Reference Bureau’s <strong>Population</strong>-Environment<br />
Project, as well as those at MEASURE Evaluation.<br />
The author is especially grateful to the following colleagues who contributed<br />
to this guide through attending meetings, selecting or preparing<br />
indicators, conceptualizing the content <strong>for</strong> the population-health-environment<br />
context, researching, or preparing text: Roger-Mark de Souza,<br />
Melissa Thaxton, Katie Mogelgaard, Bob Engelman, Janet Edmond, Mar<br />
Viernes, Wayne McCallum, Alice Macharia, Lilian Pintea, Gib Clarke,<br />
Geoff Dabelko, Judy Oglethorpe, Cara Honzak, Beth Sutherl<strong>and</strong>, Nina<br />
Frankel, Shannon Salentine, <strong>and</strong> Anupa Deshp<strong>and</strong>e.<br />
I would also like to recognize <strong>and</strong> express my gratitude <strong>for</strong> the thorough<br />
contributions of Brettania Walker Lopes in researching <strong>and</strong> writing text<br />
included in the environment indicators section. This guide could not have<br />
been completed without her ef<strong>for</strong>ts. And the ef<strong>for</strong>ts of Anton Zuiker, Will<br />
Alex<strong>and</strong>er, Nash Herndon, <strong>and</strong> Samhita Brown in the publications unit at<br />
MEASURE Evaluation, as well as the ef<strong>for</strong>ts of graduate students, Caryl<br />
Feldacker <strong>and</strong> Heather Marlow, were integral in compiling in<strong>for</strong>mation<br />
<strong>for</strong> the indicator sections, providing astute comments <strong>for</strong> editing, <strong>and</strong><br />
completing the layout <strong>and</strong> production work.
I would like to acknowledge the final reviewers of the guide who generously<br />
volunteered their time to read through the document <strong>and</strong> provide<br />
detailed comments <strong>and</strong> feedback. Their inputs <strong>and</strong> revisions were instrumental<br />
in creating the end product. These were Lynne Gaffikin, Leona<br />
D’Agnes, Eckhard Kleinau, <strong>and</strong> Scott Morel<strong>and</strong>.
Table of Contents<br />
List of Acronyms 6<br />
Preface 7<br />
Summary List of Indicators 10<br />
Part One – Overview of the guide 13<br />
Introduction 14<br />
Conceptual Framework <strong>for</strong> <strong>Population</strong>-<strong>Health</strong>-Environement 21<br />
Programs<br />
Part Two – Program <strong>Monitoring</strong> <strong>and</strong> Evaluation 23<br />
Using Indicators in Program M&E 24<br />
Participatory Approaches to M&E 30<br />
Methods <strong>and</strong> Data Sources Used in this <strong>Guide</strong> 39<br />
Part Three – Indicators 47<br />
<strong>Population</strong> Indicators 48<br />
<strong>Health</strong> Indicators 60<br />
Environment Indicators 78<br />
Integration Indicators 104<br />
Value-Added Indicators 116<br />
Glossary 151<br />
Bibliography 155<br />
The CD-ROM included with this guide contains MEASURE Evaluation’s M&E Fundamentals: A Self-<strong>Guide</strong>d<br />
Minicourse, which covers the basics of program monitoring <strong>and</strong> evaluation in the context of population,<br />
health, <strong>and</strong> nutrition programs. It also defines common terms <strong>and</strong> discusses why M&E is essential <strong>for</strong><br />
program management. The M&E manual can also be downloaded from MEASURE Evaluation’s Web site<br />
at: www.cpc.unc.edu/measure/publications/pdf/ms-07-20.pdf, <strong>and</strong> this manual is also available at:<br />
www.cpc.unc.edu/measure/publications/pdf/ms-07-25.pdf.<br />
Photographs by Theresa Finn.
List of Acronyms<br />
CBD<br />
CPR<br />
CYP<br />
DTP<br />
GBV<br />
GPS<br />
ITN<br />
LAM<br />
NGO<br />
NRM<br />
ORS<br />
ORT<br />
PHE<br />
RHF<br />
TBA<br />
Td<br />
TT<br />
USAID<br />
WHO<br />
community-based distributor<br />
contraceptive prevalence rate<br />
couple-years of protection<br />
diphtheria, tetanus, <strong>and</strong> pertussis<br />
gender-based violence<br />
global positioning system<br />
insecticide-treated bed nets<br />
lactational amenorrhea<br />
nongovernmental organization<br />
natural resource management<br />
oral rehydration salts<br />
oral rehydration therapy<br />
population-health-environment<br />
recommended home fluids<br />
traditional birth attendant<br />
tetanus-diphtheria toxoid<br />
tetanus-toxoid<br />
U.S. Agency <strong>for</strong> International Development<br />
World <strong>Health</strong> Organization<br />
6
Preface<br />
For well over three decades, dozens of community-based development <strong>and</strong><br />
conservation projects experimented with a seemingly unlikely innovation:<br />
combining ef<strong>for</strong>ts to help communities manage <strong>and</strong> conserve their natural<br />
resource base with ef<strong>for</strong>ts to improve their health <strong>and</strong> access to family<br />
planning in<strong>for</strong>mation <strong>and</strong> services. These projects came about as conservation<br />
or community development projects focusing on natural resource<br />
management found that women came <strong>for</strong>ward <strong>and</strong> asked <strong>for</strong> help to plan<br />
pregnancies <strong>and</strong> improve their communities’<br />
health. Conservation, community<br />
development, <strong>and</strong> health nongovernmental<br />
organizations (NGOs)<br />
then took the initiative to create programs<br />
linking health <strong>and</strong> conservation.<br />
These programs evolved into<br />
the current generation of population,<br />
health, <strong>and</strong> environment projects, or<br />
PHE projects as they are now more<br />
commonly known.<br />
At their most basic, PHE projects deliver family planning, basic healthcare,<br />
environmental management or conservation in<strong>for</strong>mation, <strong>and</strong> services interventions<br />
to rural communities in a coordinated or integrated fashion.<br />
However, on the ground, PHE projects can look very different depending<br />
on the local interactions among population dynamics, human health problems,<br />
<strong>and</strong> the threats to local environmental conditions. What all PHE<br />
projects have in common is the underst<strong>and</strong>ing that human populations<br />
can be one of the major threats to the environment they inhabit, that human<br />
health is inextricably linked to the environment, <strong>and</strong> that it is more<br />
effective to work across the human health <strong>and</strong> environment sectors than to<br />
pursue their interventions in isolation. Conservation <strong>and</strong> natural resource<br />
management organizations also believe that they can build more rapport<br />
with local communities by facilitating the delivery of needed health services.<br />
<strong>Health</strong> organizations find they are better able to reach underserved<br />
communities in remote areas by partnering with environmental organizations<br />
that are already established in those communities. Many projects<br />
have also experienced the added benefits to integrating across the PHE<br />
sectors — including more women in natural resources management activities,<br />
engaging men on reproductive health <strong>and</strong> family planning decisions,<br />
<strong>and</strong> reaching underserved communities in remote, but often biologically<br />
diverse, areas.<br />
A <strong>Guide</strong> <strong>for</strong> <strong>Monitoring</strong> <strong>and</strong> <strong>Evaluating</strong> <strong>Population</strong>-<strong>Health</strong>-Environment Programs 7
The complex connections between people <strong>and</strong> their environments are evident<br />
worldwide. Numerous books, research papers, Web sites <strong>and</strong> white<br />
papers have outlined the many connections between humans <strong>and</strong> the l<strong>and</strong>,<br />
water, air, <strong>and</strong> other natural resources that they depend upon <strong>for</strong> livelihood<br />
<strong>and</strong> well-being. Human populations, while slowing in pace, continue to<br />
grow; meaning that more <strong>and</strong> more people must share finite resources. In<br />
addition, as economies grow <strong>and</strong> their citizens’ spending power multiplies,<br />
rising consumption patterns place unsustainable pressure on increasingly<br />
scarce resources. These human pressures precipitate environmental change<br />
<strong>and</strong> degradation, which can then lead to adverse human health impacts.<br />
For example, unsustainable fisheries practices lead to fisheries collapse <strong>and</strong><br />
result in malnutrition in coastal communities accustomed to fish as their<br />
main protein source. These linkages clearly establish a rationale to work<br />
across the individual population, health <strong>and</strong> environment sectors. However,<br />
most projects struggle with operationally linking population, health<br />
<strong>and</strong> environment interventions <strong>and</strong> then measuring them to demonstrate<br />
the importance of those linkages.<br />
This is why developing a publication like MEASURE Evaluation’s <strong>Monitoring</strong><br />
<strong>and</strong> Evaluation <strong>Guide</strong> to <strong>Population</strong>-<strong>Health</strong>-Environment Programs<br />
is so important. For several years, implementers <strong>and</strong> donors working<br />
in the PHE field have eagerly discussed the need <strong>for</strong> a tool that can<br />
help them measure the results <strong>and</strong> rewards of integrated PHE projects<br />
<strong>and</strong> demonstrate the benefits of the PHE approach to achieving larger<br />
development goals. In addition, no single implementing organization can<br />
be a technical expert in all three fields. There<strong>for</strong>e, PHE field practitioners<br />
who are designing PHE monitoring <strong>and</strong> evaluation (M&E) systems need<br />
an easy-to-use guide to the most important <strong>and</strong> trusted indicators across<br />
the population, health, <strong>and</strong> environment fields. This guide will meet these<br />
needs within a realistic framework that was developed in consultation with<br />
current leading PHE practitioners. Their guidance helped select the most<br />
highly recommended indicators in each field, with emphasis on those that<br />
have been tested in past PHE projects.<br />
A word of warning, however, <strong>for</strong> those who are hoping that the guide will<br />
be the solution to all their challenges when developing <strong>and</strong> implementing<br />
cross-sectoral PHE projects: cross-sectoral integration is an art, rather<br />
than a science. Project designers <strong>and</strong> managers will have to be creative in<br />
how they decide to conceptualize the linkages in their project sites between<br />
humans, their health, <strong>and</strong> their environment; <strong>and</strong> how they decide to program<br />
to these conceptual linkages. This guide is no substitute <strong>for</strong> rigorous<br />
program analysis, in the project design phase, to better underst<strong>and</strong> the<br />
8
PHE links on the ground <strong>and</strong> to develop a conceptual framework based on<br />
those linkages that will guide the program throughout its lifecycle. Once<br />
your conceptual framework is in place, however, this guide should provide<br />
concrete advice on how to measure the implementation <strong>and</strong> results of the<br />
project’s conceptual framework though st<strong>and</strong>ardized indicators <strong>and</strong> a rigorous<br />
monitoring <strong>and</strong> evaluation system.<br />
As was stated be<strong>for</strong>e, there is significant diversity in how PHE projects are<br />
implemented on the ground. It is truly important to maintain that diversity<br />
because above all, PHE represents an integrated response to the concrete<br />
linkages in unique population, health <strong>and</strong> environment conditions<br />
in each project site. However within this diversity, there is an urgent need<br />
<strong>for</strong> our field to develop st<strong>and</strong>ard measures so that we, as decision makers,<br />
researchers, <strong>and</strong> advocates, can aggregate data across all PHE projects <strong>and</strong><br />
sites in order to demonstrate the value of PHE integration <strong>and</strong> make a<br />
better case <strong>for</strong> increased investment in this field. This guide represents the<br />
first step toward filling that need <strong>and</strong> achieving success in promoting PHE<br />
as a development strategy <strong>for</strong> the future.<br />
Heather D’Agnes<br />
<strong>Population</strong>-Environment Technical Advisor, USAID<br />
A <strong>Guide</strong> <strong>for</strong> <strong>Monitoring</strong> <strong>and</strong> <strong>Evaluating</strong> <strong>Population</strong>-<strong>Health</strong>-Environment Programs 9
Summary List of Indicators<br />
<strong>Population</strong> Indicators<br />
1 Percent of program staff trained to work with or provide reproductive health services<br />
to adolescents<br />
2 Percent of women of reproductive age (15-49) who were clients of a communitybased<br />
distributor in the last year<br />
Page<br />
49<br />
3 Couple-years of protection 51<br />
4 Average household distance/time to the nearest health center 53<br />
5 Percent of skilled health personnel knowledgeable in obstetric warning signs 54<br />
6 Number of acceptors new to modern contraception 55<br />
7 Contraceptive prevalence rate 56<br />
8 Percent of deliveries occurring in a health facility 57<br />
9 Percent of births attended by skilled health personnel 58<br />
10 Percent of women attended at least once during pregnancy <strong>for</strong> reasons related to<br />
pregnancy<br />
59<br />
50<br />
<strong>Health</strong> Indicators<br />
Page<br />
1 Number of doses of tetanus vaccine distributed 61<br />
2 Number of insecticide-treated bed nets distributed 62<br />
3 Number of packets of oral rehydration salts distributed 63<br />
4 Number of safe water storage vessels distributed 64<br />
5 Percent of pregnant women receiving at least two doses of tetanus toxoid vaccine 65<br />
6 Percent of children aged 12-23 months fully immunized be<strong>for</strong>e 12 months 67<br />
7 Percent of households with access to an improved water source 69<br />
8 Time spent by household members to collect water 71<br />
9 Percent of households using an improved toilet facility 72<br />
10 Percent of households using soap in last 24 hours 73<br />
11 Percent of households storing drinking water safely 74<br />
12 Percent of children under five years who slept under an insecticide-treated bed net the 75<br />
previous night<br />
13 Oral rehydration therapy use rate 76<br />
10
Environment Indicators<br />
1 Percent of communities in target area that have developed a community-based natural<br />
resource management plan<br />
2 Number of officers trained in laws <strong>and</strong> en<strong>for</strong>cement procedures <strong>and</strong> posted to a<br />
permanent en<strong>for</strong>cement position<br />
Page<br />
79<br />
3 Hours of en<strong>for</strong>cement patrols logged 83<br />
4 Area of legally protected habitat 85<br />
5 Number of trees planted 87<br />
6 Percent of trees planted that survive 88<br />
7 Number of educational sessions on improved agricultural/marine practices 90<br />
8 Percent of community-based natural resource management plans that are approved by 92<br />
a government authority<br />
9 Percent of farmers/fishers who adopt improved agricultural/marine practices 93<br />
10 Area of habitat under improved management 95<br />
11 <strong>Population</strong> structure of species 97<br />
12 Area of secondary <strong>for</strong>est regenerated 98<br />
13 Species richness 100<br />
14 Species abundance <strong>and</strong> distribution 102<br />
81<br />
Integration Indicators<br />
Page<br />
1 Number of linked messages/materials created 106<br />
2 Instances of population, health, or environment organizations addressing non-traditional<br />
107<br />
audiences<br />
3 Number <strong>and</strong> frequency of PHE educational sessions provided in the target community 108<br />
4 Number of new PHE partnerships created that make linkages among organizations or 109<br />
institutions from different sectors<br />
5 Instances of organizations facilitating access to services outside of their traditional<br />
110<br />
sectors<br />
6 Number of policy-makers, media, <strong>and</strong> scholars knowledgeable about or aware of a 111<br />
specific PHE issue<br />
7 Percent of households knowledgeable about or aware of a specific PHE issue 112<br />
8 Percent of communities in target/project area receiving all three PHE elements 113<br />
9 Number of enabling local ordinances/policies supporting PHE 114<br />
10 Number of placements of linked PHE messages in print <strong>and</strong> electronic media by<br />
independent sources<br />
115<br />
A <strong>Guide</strong> <strong>for</strong> <strong>Monitoring</strong> <strong>and</strong> <strong>Evaluating</strong> <strong>Population</strong>-<strong>Health</strong>-Environment Programs 11
Value-Added Indicators<br />
1 Percent of communities with functioning community-based natural resource management<br />
committees<br />
Page<br />
2 Number of educational sessions provided on new or alternative income-generating 121<br />
activities<br />
3 Net dollar value of socially-marketed products sold 123<br />
4 Percent of men <strong>and</strong> women who know where to access modern family planning<br />
124<br />
services<br />
5 Number of children who show improvement on a growth chart 125<br />
6 Yield per area per year or cropping or fishing cycle 126<br />
7 Percent of youth participating on community-based natural resource management 128<br />
committees<br />
8 Percent of leadership positions held by women on natural resource management<br />
129<br />
committees<br />
9 Number of validated infractions reported in deputy logs 131<br />
10 Number of fuel-efficient stoves distributed 133<br />
11 Percent of youth who used a condom at last high-risk sex in the previous year 135<br />
12 Percent of adults who used a condom at last high-risk sex in the previous year 136<br />
13 Percent of men who support the use of modern contraception <strong>for</strong> themselves or their 138<br />
partners<br />
14 Percent of households with ventilation in cooking area 140<br />
15 Percent of children under five years of age with low weight <strong>for</strong> age (underweight) 141<br />
16 Average household consumption of firewood in target area 144<br />
17 Household income 146<br />
18 Percent of households that earn income from new or alternative income-generating<br />
activities<br />
148<br />
120<br />
12
Part One | Overview of the <strong>Guide</strong><br />
A <strong>Guide</strong> <strong>for</strong> <strong>Monitoring</strong> <strong>and</strong> <strong>Evaluating</strong> <strong>Population</strong>-<strong>Health</strong>-Environment Programs 13
Introduction<br />
Organization of the <strong>Guide</strong><br />
This guide is organized into three parts. The first part provides an overview<br />
of the guide, including its organization, development <strong>and</strong> purpose. The<br />
second part consists of technical in<strong>for</strong>mation, including a brief process<br />
by which integrated PHE program managers can develop an M&E plan,<br />
types of evaluations, a list of generic monitoring <strong>and</strong> evaluation terminology,<br />
<strong>and</strong> the major data sources from which the indicators in this guide<br />
are drawn. This section also includes<br />
guidance on the importance of assessing<br />
data quality. The section on<br />
data sources should serve as a reference<br />
point <strong>for</strong> implementation of the<br />
indicators. The third part contains<br />
the indicators themselves, which are<br />
divided by technical area: population,<br />
health, environment, <strong>and</strong> indicators<br />
of integration, <strong>and</strong> value-added.<br />
Each indicator description contains<br />
the definition, disaggregates (if appropriate),<br />
a time frame, data sources <strong>and</strong> collection considerations, as well<br />
as strengths <strong>and</strong> weaknesses. Programs should define <strong>and</strong> measure indicators<br />
in the same way. This allows <strong>for</strong> comparison across countries <strong>and</strong><br />
programs. The use of comparable measures can also provide international<br />
programs with valuable measures of the same indicator in different populations<br />
<strong>and</strong> habitats, enabling triangulation of findings <strong>and</strong> regional or local<br />
differences to be addressed.<br />
This guide can serve as a reference document <strong>for</strong> the entire international<br />
PHE community. Although funded by USAID, A <strong>Guide</strong> <strong>for</strong> <strong>Monitoring</strong><br />
<strong>and</strong> <strong>Evaluating</strong> <strong>Population</strong>-<strong>Health</strong>-Environment Programs applies to PHE<br />
programs sponsored by other funding agencies, governments, or NGOs.<br />
Specifically, the guide provides a menu of indicators to be used selectively<br />
as part of the M&E of regional programs <strong>and</strong> country projects, reflecting<br />
the locally based nature of PHE programs. The indicator descriptions<br />
presented herein are designed to promote st<strong>and</strong>ardization of definitions<br />
<strong>and</strong> concepts among the international PHE community. However, even<br />
though st<strong>and</strong>ardization is useful, organizations should adapt indicators to<br />
their specific circumstances. This approach ensures that indicators are relevant<br />
to specific organizations <strong>and</strong> promotes ownership of the M&E pro-<br />
14 Part One: Overview of the <strong>Guide</strong>
cess. That said, organizations that choose to adapt indicators should clearly<br />
state the modified definitions <strong>and</strong> methods in their M&E plans.<br />
No program or project should ever use all of the indicators outlined in<br />
this publication. The choice of indicators should be driven by the objectives,<br />
goals, activities, <strong>and</strong> scale of the program <strong>and</strong> its projects. Additionally,<br />
programs should consider the time <strong>and</strong> money it costs to collect <strong>and</strong><br />
analyze data <strong>for</strong> each indicator. For routine monitoring purposes, program<br />
managers should select a h<strong>and</strong>ful of indicators that are economical to collect<br />
<strong>and</strong> relevant to program objectives. Some of these indicators may need<br />
to be adapted <strong>for</strong> specific program needs. For organizations that need more<br />
in<strong>for</strong>mation, one option is to conduct special studies to evaluate program<br />
per<strong>for</strong>mance in specific areas of interest. In this case, mangers should stagger<br />
these studies to minimize the research burden. It is the responsibility<br />
of program managers <strong>and</strong> implementers, in consultation with donors, to<br />
decide which indicators each PHE program should collect, based primarily<br />
on what the program is expected to achieve.<br />
Some program <strong>and</strong> project managers may be overwhelmed by the volume<br />
of indicators in this guide <strong>and</strong> by the process of selection. Some may<br />
want to know, <strong>for</strong> example, the key 10 to 15 indicators that are essential<br />
<strong>for</strong> monitoring <strong>and</strong> evaluating PHE programs worldwide. Having such a<br />
“short list” may be useful <strong>for</strong> international donors <strong>and</strong> governments, but<br />
program managers may find such a list impractical <strong>for</strong> monitoring <strong>and</strong><br />
evaluating their specific interventions. Mainly, such global indicators usually<br />
require population <strong>and</strong> habitat-based surveys, which may be beyond<br />
the scope of most PHE programs working in focused regions or with specific<br />
populations. Most program managers will also want M&E to cover<br />
program results as well as progress made in specific functional areas, such<br />
as training or behavior change. It is important to keep in mind that the<br />
specific indicators useful in a given M&E framework will depend directly<br />
on the purpose of the program.<br />
Purpose of the <strong>Guide</strong><br />
An in<strong>for</strong>mation system is the backbone of M&E <strong>and</strong> is founded on a cycle<br />
of in<strong>for</strong>mation sharing <strong>and</strong> feedback. M&E systems address the challenge<br />
of measuring program success in cost-effective, practical ways. Effectively<br />
measuring programs through M&E provides the evidence-base<br />
upon which to compare programs, share best practices, secure donor <strong>and</strong><br />
community support, <strong>and</strong> ultimately meet program goals <strong>and</strong> objectives.<br />
Without a fully functioning M&E system, programs lack the objectively<br />
verifiable evidence to support the credibility of their work. M&E systems<br />
A <strong>Guide</strong> <strong>for</strong> <strong>Monitoring</strong> <strong>and</strong> <strong>Evaluating</strong> <strong>Population</strong>-<strong>Health</strong>-Environment Programs 15
generate in<strong>for</strong>mation that can be used in empirical analysis <strong>and</strong> articulation<br />
of compelling arguments to advocate <strong>for</strong> policy reports <strong>and</strong> development.<br />
The need to develop <strong>and</strong> implement M&E plans based on uni<strong>for</strong>m measures<br />
that create an evidence base <strong>for</strong> worldwide population-health-environment<br />
projects <strong>and</strong> programs has long been recognized (Kleinau & Talbot,<br />
2003; Pielemeier, 2005; Margoluis & Salafsky, 1998; Oldham, 2006).<br />
Experts suggest M&E should be part of program design <strong>and</strong> the definition<br />
<strong>and</strong> selection of indicators should guide program implementation<br />
<strong>and</strong> progress. PHE programs also may have difficulty deciding whether<br />
to use single-sector indicators or indicators that measure the effects of<br />
multi-sector collaboration. Donors may expect the <strong>for</strong>mer choice to show<br />
results better, while the latter choice can better reflect coordination <strong>and</strong><br />
integration between programs. M&E researchers have emphasized that<br />
cross-sectoral collaboration on monitoring <strong>and</strong> evaluation is necessary to<br />
establish integrated-intervention impact (Kleinau & Talbot, 2003).<br />
A review of PHE programs in Madagascar <strong>and</strong> the Philippines noted the<br />
lack of outcome data across PHE programs. Echoing previous observations,<br />
the author stressed that donors have an expectation of reporting sector-specific<br />
indicators, but strong M&E systems that gather key programwide<br />
in<strong>for</strong>mation may generate more convincing evidence <strong>for</strong> the need to<br />
retain PHE programs (Pielemeier, 2003).<br />
Another recent report noted the dearth of PHE data <strong>and</strong> in<strong>for</strong>mation at<br />
the outcome <strong>and</strong> impact levels. This report proposed specific evaluation<br />
questions to answer questions about how local communities participate in<br />
PHE programs, the quality of health services PHE programs provide, <strong>and</strong><br />
the livelihood activities implemented by some PHE projects (Oldham,<br />
2006). In order to carry out these evaluations, programs must collect data<br />
on indicators that speak to these concerns. Part of the solution may lie in<br />
M&E systems based on uni<strong>for</strong>m measures <strong>and</strong> high-quality data.<br />
This guide is by no means a comprehensive list of all the possible indicators<br />
that could be applied to PHE programs. The process of developing international<br />
consensus on frameworks, indicators, <strong>and</strong> tools typically involves<br />
consultations among global partners <strong>and</strong> takes considerable time <strong>and</strong> ef<strong>for</strong>t.<br />
This guide represents the results of such consultations. While most of<br />
the indicators in this guide have been tested <strong>and</strong> used extensively in the<br />
field, there are proposed st<strong>and</strong>ard measures of integration that will be new<br />
to the field. In fact, these indicators represent an ef<strong>for</strong>t by the PHE community<br />
to initiate st<strong>and</strong>ard measurement across programs.<br />
16 Part One: Overview of the <strong>Guide</strong>
Given the diverse specialties involved in PHE work, few can claim to have<br />
expertise that spans the full range of PHE activities. While different PHE<br />
programs share the vision of integrating the health of humans <strong>and</strong> the<br />
environment, the actual measures of progress toward that goal differ from<br />
one type of program to the next. This guide has been written in light of<br />
the previous ef<strong>for</strong>ts <strong>and</strong> suggestions from PHE experts regarding the need<br />
<strong>for</strong> a variety of st<strong>and</strong>ardized indicators with which PHE programs can use<br />
common measures while retaining their diverse programming.<br />
Objectives of the <strong>Guide</strong><br />
The overall objective of this guide is to encourage program monitoring<br />
<strong>and</strong> evaluation <strong>and</strong> improve the quality of work in the population-healthenvironment<br />
area. To this end, the guide provides a comprehensive listing<br />
of the most widely used M&E indicators <strong>for</strong> population-health-environment<br />
programs in developing countries. The indicators are organized using<br />
a generic conceptual framework that maps the pathways through which<br />
programs achieve results, constituting a logical framework <strong>for</strong> developing<br />
an M&E plan with the most appropriate indicators.<br />
This guide focuses on indicators of all stages of program achievement <strong>and</strong><br />
across multiple sub-specialties within each technical area. This guide also<br />
presents a list of st<strong>and</strong>ard indicators to unify a national PHE project <strong>and</strong><br />
discusses data collection <strong>and</strong> sources, data quality, <strong>and</strong> in<strong>for</strong>mation-use<br />
protocols. This guide does not, however, present all the possible indicators<br />
that may be applicable to every PHE program. Local, program-specific<br />
indicators should be developed with careful consideration to resources <strong>and</strong><br />
utility.<br />
The specific objectives of this guide are to:<br />
• compile in a single publication a menu of population-health-environment<br />
indicators judged most useful in monitoring <strong>and</strong> evaluating<br />
PHE programs at both the program <strong>and</strong> the population/habitat<br />
levels;<br />
• define these indicators in an ef<strong>for</strong>t to encourage the use of st<strong>and</strong>ardized<br />
definitions of indicators <strong>and</strong> terminology across PHE programs,<br />
countries, <strong>and</strong> donor agencies; <strong>and</strong><br />
• promote the M&E of PHE programs by making indicators available<br />
<strong>and</strong> easier to use.<br />
This document does not elaborate in detail about the various evaluation<br />
approaches that have been or could be developed in the PHE M&E field.<br />
A <strong>Guide</strong> <strong>for</strong> <strong>Monitoring</strong> <strong>and</strong> <strong>Evaluating</strong> <strong>Population</strong>-<strong>Health</strong>-Environment Programs 17
Program decision-makers should explore evaluation <strong>and</strong> develop methodologies<br />
tailored to program needs, <strong>and</strong> if necessary, seek the assistance of<br />
evaluation experts.<br />
This document also is not meant to be used as a guide to developing a<br />
PHE program. As such, this guide does not discuss the varied conceptual<br />
approaches to PHE. This debate is best left to PHE practitioners. This<br />
document is focused on presenting common indicators <strong>for</strong> PHE programs<br />
that are useful, reliable, measurable, cost-effective, <strong>and</strong> comparable across<br />
programs.<br />
Several different PHE groups should find this guide useful in their work.<br />
The intended audience of the PHE indicator guide includes:<br />
• staff working <strong>for</strong> international PHE programs in resource-poor settings;<br />
• monitoring <strong>and</strong> evaluation specialists working in PHE;<br />
• public <strong>and</strong> private donors supporting PHE programs;<br />
• potential PHE practitioners interested in learning more about M&E<br />
of PHE programs; <strong>and</strong><br />
• directors <strong>and</strong> managers of PHE programs worldwide.<br />
How these Indicators Were Selected<br />
In 2006, PHE practitioners from six organizations were consulted in the<br />
development of this guide <strong>and</strong> in the selection of indicators. These organizations<br />
represent the local, national, <strong>and</strong> global commitment to PHE<br />
integration <strong>and</strong> effectiveness. In addition to these individual consultations,<br />
a technical advisory group comprised of PHE practitioners <strong>and</strong> managers<br />
met to set parameters <strong>and</strong> criteria <strong>for</strong> a set of st<strong>and</strong>ard indicators <strong>for</strong><br />
the PHE field of practice. To the extent possible, this guide uses indicators<br />
that have already been field-tested. However, some indicators from<br />
emerging measurement areas, such as integration <strong>and</strong> community-based<br />
activities have only been recently developed. These indicators represent<br />
recommendations of experts working in these areas to stimulate dialogue<br />
on evaluation <strong>and</strong> to provide possible indicators <strong>for</strong> testing as new types of<br />
PHE programs become more common.<br />
The following st<strong>and</strong>ard logic model <strong>for</strong> program development served as<br />
the basis <strong>for</strong> selecting indicators. This guide includes indicators that measure<br />
achievements <strong>for</strong> each element in the model.<br />
Inputs → Process → Outputs → Outcomes → Impacts<br />
18 Part One: Overview of the <strong>Guide</strong>
To be effective, indicators must meet a variety of requirements. The indicators<br />
in this document were chosen to be:<br />
• valid – accurately measuring a behavior, practice or task;<br />
• reliable – consistently measurable in the same way by different observers;<br />
• precise – operationally defined in clear terms;<br />
• measurable – quantifiable using available tools <strong>and</strong> methods;<br />
• timely – providing measurement at time intervals that are relevant<br />
<strong>and</strong> appropriate <strong>for</strong> program goals <strong>and</strong> activities; <strong>and</strong><br />
• programmatically important – linked to a public health impact or<br />
to achieving the objectives that are needed <strong>for</strong> impact.<br />
The specific criteria used <strong>for</strong> selecting these PHE indicators took into account<br />
three factors: the indicator relevance to PHE programs; the feasibility<br />
that PHE programs can collect the data; <strong>and</strong> the added value that<br />
collecting the indicator would give to the PHE program.<br />
Relevance to PHE projects <strong>and</strong> programs can be more specifically defined<br />
as the indicator’s usefulness in responding to donor requirements <strong>and</strong> in<br />
demonstrating project results, both <strong>for</strong> improved program management<br />
<strong>and</strong> <strong>for</strong> increasing the evidence base <strong>for</strong> advocacy purposes. Although the<br />
indicators in this guide are divided by technical sector, PHE programs aim<br />
to integrate the three sectors in the implementation. There<strong>for</strong>e, there are<br />
some sector-specific indicators that reflect the linked nature of the programs<br />
better than others <strong>and</strong> the use of indicators in past <strong>and</strong> current PHE<br />
programs.<br />
Most PHE programs work in resource-poor settings with a minimum of<br />
staff <strong>and</strong> infrastructure. The feasibility of data collection refers to the consideration<br />
of the inputs required from the PHE program to obtain the<br />
data <strong>for</strong> the indicator. Feasibility considerations <strong>for</strong> this guide are cost,<br />
timing or frequency of data collection, <strong>and</strong> whether or not special skills<br />
or expertise are required <strong>for</strong> indicator collection. This guide contains indicators<br />
that require varying degrees of knowledge <strong>and</strong> resources to allow<br />
program managers to choose the most appropriate <strong>and</strong> feasible indicators<br />
<strong>for</strong> their own programs.<br />
Value added is an important concept <strong>for</strong> PHE programs, as multi-sectoral<br />
cooperation <strong>and</strong> implementation allows <strong>for</strong> combined ef<strong>for</strong>ts across sectors.<br />
The definition used here <strong>for</strong> value-added is the identification of indicators<br />
that contribute to results across two or more sectors in such a way<br />
that outcomes go beyond those anticipated if the interventions had been<br />
A <strong>Guide</strong> <strong>for</strong> <strong>Monitoring</strong> <strong>and</strong> <strong>Evaluating</strong> <strong>Population</strong>-<strong>Health</strong>-Environment Programs 19
implemented separately. Indicators that provide in<strong>for</strong>mation about one or<br />
more groups of people who may not have been targeted in the intervention<br />
but are still reached through the intervention are considered valueadded<br />
as well. Indicators that reach non-traditional <strong>and</strong> diverse audiences<br />
may provide outcomes in several sectors. Value-added indicators are different<br />
from integrated indicators, which measure the project’s success in<br />
implementing cross-sectoral approaches. Value-added rests in the multidisciplinary<br />
nature of PHE approaches in addition to the cross-sectoral<br />
arrangements through which they operate. If the sectors working together<br />
in the PHE strategy are complimentary, their effects may rein<strong>for</strong>ce each<br />
other to yield surplus or extra outcomes. Measurements of indicators that<br />
could produce value-added in<strong>for</strong>mation are listed separately in this guide<br />
<strong>and</strong> are divided by sectors relevant to the outcomes.<br />
20 Part One: Overview of the <strong>Guide</strong>
•<br />
•<br />
•<br />
•<br />
•<br />
Conditions<br />
Social<br />
Cultural<br />
Economic<br />
Political<br />
Legal<br />
Conceptual Framework <strong>for</strong> <strong>Population</strong>-<strong>Health</strong>-Environment Programs<br />
Intermediate<br />
Inputs Process/outputs Outputs<br />
<br />
outcomes<br />
•<br />
•<br />
•<br />
Enabling PHE<br />
policy environment<br />
Human <strong>and</strong> financial<br />
resources<br />
PHE partnerships<br />
•<br />
•<br />
•<br />
Local <strong>and</strong><br />
national law<br />
en<strong>for</strong>cement:<br />
conservation<br />
Youth <strong>and</strong> gender<br />
enpowerment<br />
PHE in<strong>for</strong>mation,<br />
education, <strong>and</strong><br />
communication<br />
•<br />
•<br />
•<br />
Access to<br />
population,<br />
health, <strong>and</strong><br />
natural resource<br />
management<br />
services<br />
Community<br />
dem<strong>and</strong> <strong>for</strong> integrated<br />
projects<br />
Quality of the<br />
project services<br />
<br />
Community use of<br />
PHE project services:<br />
health <strong>and</strong><br />
natural resources<br />
management<br />
•<br />
•<br />
•<br />
•<br />
<strong>Health</strong>-seeking<br />
behavior<br />
Responsible<br />
behavior toward<br />
environment<br />
Increased protection<br />
of natural<br />
environment<br />
Improved economic<br />
status<br />
Environment <strong>and</strong><br />
human health<br />
outcomes:<br />
Fertility<br />
Morbidity<br />
Mortality<br />
Habitat cover<br />
Species fertility<br />
Sustainable<br />
resource management<br />
•<br />
•<br />
•<br />
•<br />
•<br />
•<br />
Long-term<br />
outcomes
Part Two | Program <strong>Monitoring</strong> <strong>and</strong> Evaluation
Using Indicators in Program M&E<br />
Program <strong>Monitoring</strong><br />
<strong>Monitoring</strong> is the routine tracking of program activities by regularly measuring<br />
whether planned activities are being carried out. <strong>Monitoring</strong> in<strong>for</strong>ms<br />
program <strong>and</strong> project managers whether activities are being implemented<br />
according to plan, at what cost, how well the program is functioning at<br />
different levels, the extent to which a program’s services are being used,<br />
whether interim targets are being met, <strong>and</strong> whether key per<strong>for</strong>mance measures<br />
are being achieved. Because program monitoring data are sometimes<br />
used in evaluation activities, both monitoring <strong>and</strong> evaluation are necessary<br />
to measure PHE programs effectively.<br />
Program Evaluation<br />
Drawing from a program’s list of indicators, mixed data sources <strong>and</strong> quality<br />
data, evaluators can derive in<strong>for</strong>mation to report program achievements.<br />
This in<strong>for</strong>mation can be used not only <strong>for</strong> donor reporting, but more importantly,<br />
to revise program practices to better achieve desired outcomes.<br />
Contents of a Typical Evaluation Plan<br />
1. Brief project description<br />
2. Objectives of the project<br />
3. Objectives of the evaluation<br />
4. Evaluation methodology – type of evaluation, indicators to measure each objective, data<br />
collection methods (surveys, interviews, focus groups, service statistics, etc.), sample size,<br />
methods of sampling (or selecting participants)<br />
5. Resources needed, timetable, <strong>and</strong> budget – material, human, financial, transportation<br />
<strong>and</strong> logistics<br />
6. Anticipated use of results – <strong>for</strong> example, improve the project mid-course, plan future<br />
projects, guide decision-making<br />
Evaluations require planning, funding, <strong>and</strong> time. They are possible only if<br />
an M&E system is functioning <strong>and</strong> delivering quality data on key indicators.<br />
Programs/projects should focus on developing <strong>and</strong> implementing<br />
M&E plans <strong>and</strong> systems in preparation <strong>for</strong> conducting evaluations.<br />
Evaluation is designed to determine the value of a specific program, intervention,<br />
or project. It can evaluate a program’s process, outcome, or its impact<br />
to help answer three basic questions, which are explored further here.<br />
24 Part Two: Program <strong>Monitoring</strong> <strong>and</strong> Evaluation
1. How well has the project been implemented?<br />
Process evaluation demonstrates progress in implementing the program<br />
as planned. Process evaluation focuses on the implementation of project<br />
activities <strong>and</strong> not on the desired results or outcomes. It often focuses on<br />
process- <strong>and</strong> output-level analysis <strong>and</strong> precedes evaluations of short-term<br />
outcomes.<br />
Process evaluation is the measure of products <strong>and</strong> services provided by<br />
a program <strong>and</strong> the quality of those services <strong>and</strong> products. Process evaluation<br />
should describe the number <strong>and</strong> quality of activities implemented<br />
as well as any obstacles encountered. If program managers implement a<br />
process evaluation in a timely manner, they can use the results to make<br />
mid-course corrections. Process evaluation is generally easier than measuring<br />
results, especially when it involves counting numbers of clients or<br />
completed activities. This type of evaluation also helps to assess the extent<br />
to which program level objectives are being achieved through comparing<br />
actual achievements with targets.<br />
2. Has the desired change been achieved?<br />
Outcome evaluation examines behavioral changes in addition to increases<br />
in knowledge, attitudes, <strong>and</strong>/or beliefs in a population. Successful projects<br />
have clear, realistic, <strong>and</strong> measurable objectives. <strong>Monitoring</strong> these objectives<br />
measures the extent to which the desired changes are achieved <strong>and</strong> the<br />
objectives are met. Generally, the change in question relates to knowledge,<br />
attitudes, or practices of the target population. <strong>Monitoring</strong> of results allows<br />
us to determine if the desired change has occurred among the intended<br />
audience. Another type of change measured in this category may deal<br />
with the manner in which the services/activities are provided to the target<br />
population, such as access to the services or quality of service provision.<br />
To measure change, the evaluator must have data from be<strong>for</strong>e <strong>and</strong> after the<br />
intervention. Alternatively, the evaluator can establish the expected level<br />
to be achieved by setting targets <strong>and</strong> then determine whether the project<br />
achieves this in a defined period of time (e.g., three hectares of <strong>for</strong>est regenerated<br />
or 60% of children fully immunized).<br />
However, as in the previous examples, the pre-intervention levels may not<br />
be known. As a result, some programs may want to conduct baseline assessments,<br />
such as small-scale population-based cluster surveys, or refer<br />
to pre-intervention satellite images. The findings from these assessments<br />
can be used to set targets <strong>for</strong> key project outcomes <strong>and</strong> to build consensus<br />
among key stakeholders in terms of local needs <strong>and</strong> priorities.<br />
A <strong>Guide</strong> <strong>for</strong> <strong>Monitoring</strong> <strong>and</strong> <strong>Evaluating</strong> <strong>Population</strong>-<strong>Health</strong>-Environment Programs 25
3. If the change has been achieved, to what extent can it be attributed to the<br />
project?<br />
Impact evaluation (demonstrates cause <strong>and</strong> effect) is the use of specific<br />
study designs <strong>and</strong> special studies to measure the extent to which changes<br />
in desired PHE outcomes are attributable to a program’s interventions.<br />
Impact evaluations measure the health, economic status <strong>and</strong> quality of life<br />
of the target population <strong>and</strong> the health, condition <strong>and</strong> growth of the environment.<br />
Impact evaluation is sometimes called impact assessment, program<br />
research, or operational research.<br />
Experimental study designs allow cause-<strong>and</strong>-effect to be evaluated with<br />
relative precision. The most widely known of these designs is the pretest/post-test<br />
control group design with r<strong>and</strong>omization. With this design,<br />
change attributable to the intervention can be measured, decreasing the<br />
possibility that unrelated factors influenced the results.<br />
In addition to experimental designs, other methodologies can measure<br />
program effects. Appropriate statistical techniques allow evaluators to<br />
measure the extent of change. Moreover, evaluators can identify the relative<br />
importance of different factors (i.e., exposure to the program intervention)<br />
to explain the observed change. However, this approach may not be<br />
practical <strong>for</strong> small programs because of the large samples <strong>and</strong> complex<br />
statistical analysis required. If a program desires to implement an impact<br />
evaluation, an expert should be consulted.<br />
Quantitative Versus Qualitative Data<br />
Mixing qualitative <strong>and</strong> quantitative data sources can strengthen your claim<br />
<strong>for</strong> achieving program objectives <strong>and</strong> goals. Indicators required by donor<br />
agencies often request quantitative in<strong>for</strong>mation (e.g., number, percents,<br />
rates or ratios); however, PHE programs benefit by supporting these numbers<br />
with qualitative evidence to tell the complete story of program integration.<br />
Due to the specific questions that arise in implementing integrated programs,<br />
special care should be taken to select methodologies that provide<br />
in<strong>for</strong>mation about processes <strong>and</strong> outcomes coming from qualitative as well<br />
as quantitative methods.<br />
26 Part Two: Program <strong>Monitoring</strong> <strong>and</strong> Evaluation
Table 1 – Differences between Quantitative <strong>and</strong> Qualitative Methods<br />
Quantitative<br />
Describes how many <strong>and</strong> how much<br />
Uses predominately closed-ended questions<br />
Provides numerical data <strong>and</strong> statistics<br />
Requires large samples, preferably selected at<br />
r<strong>and</strong>om<br />
Yields more superficial responses to sensitive<br />
topics<br />
Results can be generalized to the target population<br />
or ecosystem<br />
Qualitative<br />
Describes how <strong>and</strong> why<br />
Uses predominately observations <strong>and</strong> openended<br />
questions<br />
Provides data on perceptions <strong>and</strong> beliefs as well<br />
as descriptions of conditions <strong>and</strong> care<br />
Permits more limited samples, generally not<br />
selected at r<strong>and</strong>om<br />
Offers more in-depth responses on sensitive<br />
topics<br />
Results apply only to the segment of the population<br />
or specific sub-area of the ecosystem that is<br />
studied<br />
Program-Based Versus <strong>Population</strong>-Based <strong>and</strong> Habitat-Based Measures<br />
It is important to distinguish between program-based <strong>and</strong> populationbased<br />
or habitat-based measures. Program-based data consist of in<strong>for</strong>mation<br />
available from program sources (e.g. facility-based/community-based<br />
service statistics, project records of trainings <strong>and</strong> educational sessions, administrative<br />
records) or in<strong>for</strong>mation that can be obtained from on-site<br />
collection (observation, client-provider interaction, interviews with farmers,<br />
natural resources management committee functions). Where such systems<br />
are functional, routine in<strong>for</strong>mation systems are the primary source<br />
of this type of in<strong>for</strong>mation. Program-based in<strong>for</strong>mation is very important<br />
<strong>for</strong> underst<strong>and</strong>ing program per<strong>for</strong>mance <strong>and</strong> the type of output programs<br />
achieve. When data on the entire regional populations are available as a<br />
denominator, estimated program-based in<strong>for</strong>mation can reflect service<br />
coverage.<br />
In contrast, measures that aim to evaluate effects on the general population<br />
are referred to as population-based. This term can also refer to a<br />
smaller geographic region (e.g., the target area <strong>for</strong> the specific project),<br />
provided that the data are drawn from a representative sample. Similarly,<br />
habitat-based refers to evaluation of the larger target area of the environment.<br />
Rather than program-based measures (e.g., trees planted, improved<br />
practices sessions provided, or en<strong>for</strong>cement officers trained), habitat-based<br />
measures represent outcomes on the entire habitat (e.g., <strong>for</strong>est regenerated,<br />
area under improved management, species abundance).<br />
A <strong>Guide</strong> <strong>for</strong> <strong>Monitoring</strong> <strong>and</strong> <strong>Evaluating</strong> <strong>Population</strong>-<strong>Health</strong>-Environment Programs 27
Program-based indicators usually measure inputs, processes <strong>and</strong> outputs,<br />
while population- <strong>and</strong> habitat-based indicators usually measure outcomes<br />
<strong>and</strong> some outputs. These terms are used throughout this guide. Inputs refer<br />
to human, financial, <strong>and</strong> material resources a program uses, while processes<br />
refer to the activities programs carry out to achieve the objectives. It is important<br />
to measure these two levels separately, because it is possible to have<br />
a high level of input <strong>for</strong> a poorly delivered program. For instance, a PHE<br />
program could provide inputs <strong>for</strong> new income-generation activities in the<br />
community but fail to give the educational sessions the community needs<br />
to learn how to do the new activity. In this case, the inputs may have been<br />
available on-time <strong>and</strong> be of high quality, but an activity that was necessary<br />
to achieve the objectives of the project was not completed.<br />
Outputs refer to the results of the ef<strong>for</strong>ts at the program level. In PHE,<br />
outputs refer to trainings held, behavior change communication activities,<br />
delivery of selected health services, as well as completion of communitybased<br />
natural resource management plans. While outputs are related to<br />
services that projects provide to the community, outcomes refer to changes<br />
measured at the population <strong>and</strong> habitat levels. Examples of outcomes include<br />
changes in the target population’s knowledge <strong>and</strong> behaviors, or increased<br />
tree <strong>and</strong> wildlife species in the target habitat. Long-term outcomes<br />
also refer to coverage <strong>and</strong> disease prevalence.<br />
Impacts, a process associated with evaluation rather than monitoring, refer<br />
to the beneficial health <strong>and</strong> environmental outcomes in the population a<br />
program or project makes. Impacts are not a major focus of this guide.<br />
Data Quality<br />
Collecting high-quality data from multiple levels is an essential component<br />
of an effective M&E system. Data should be collected in accordance<br />
with clear st<strong>and</strong>ards to ensure accuracy <strong>and</strong> validity. These st<strong>and</strong>ards should<br />
be discussed in the process of writing the M&E plan <strong>and</strong> compared across<br />
sectors. Key issues in data quality include the following:<br />
Double-counting –<br />
• Counting services, species, or other units twice<br />
(or more than twice) <strong>for</strong> an indicator can inflate data <strong>and</strong> compromise<br />
in<strong>for</strong>mation. Double-counting can occur either within an organization<br />
or between partners. Double-counting within an organization<br />
occurs when one organization provides the same service (training,<br />
treatment, care, etc.) multiple times to the same individual within<br />
one reporting period but records multiple persons as having received<br />
these services. Double-counting between organizations occurs when<br />
28 Part Two: Program <strong>Monitoring</strong> <strong>and</strong> Evaluation
two or more organizations supply the same service to the same individual,<br />
either at the same site or at different sites, within one reporting<br />
period, <strong>and</strong> both partners add the individual to their count of<br />
the service delivery. Avoiding double-counting is one component of<br />
supplying valid data.<br />
• Coverage – Collected data should be representative of the area program<br />
interventions cover. Incomplete data <strong>for</strong>ms or low facility reporting<br />
coverage may affect reporting accuracy. Providing good coverage<br />
is one component of supplying valid data.<br />
• Timeliness – Data are recent <strong>and</strong> available on time. Data collected<br />
<strong>and</strong> reported at inconsistent time intervals can give an inaccurate<br />
picture of program per<strong>for</strong>mance across time. Incomplete data may<br />
mask seasonal effects on PHE programs or other temporal factors.<br />
• Reliability – The data are measured <strong>and</strong> collected consistently over<br />
time <strong>and</strong> at the same times <strong>for</strong> the predetermined intervals.<br />
• Integrity – The data are protected from deliberate bias or manipulation<br />
at all levels.<br />
A participatory approach to M&E can minimize data-quality problems.<br />
Talking with partners across the sectors that are involved in PHE programs<br />
can in<strong>for</strong>m the M&E working group on what data are collected,<br />
how they are collected, what are the best sources of data <strong>for</strong> the purposes<br />
at h<strong>and</strong>, <strong>and</strong> what gaps in data <strong>and</strong> knowledge remain to be filled.<br />
Data-Quality Audits<br />
An outside evaluator should audit data on a periodic basis. The following steps can serve as a<br />
guideline <strong>for</strong> auditing data elements.<br />
1. Observation – Observe or describe the connection between the delivery of services or commodities<br />
<strong>and</strong> the completion of the source document that records that service delivery.<br />
2. Documentation Review – Review availability <strong>and</strong> completeness of all indicator source<br />
documents <strong>for</strong> the selected reporting period.<br />
3. Trace <strong>and</strong> Verification – Trace <strong>and</strong> verify reported numbers:<br />
• recount the reported numbers from available source documents;<br />
• compare the verified numbers to the site-reported numbers; <strong>and</strong><br />
• identify reasons <strong>for</strong> any differences.<br />
4. Cross-checks – Per<strong>for</strong>m cross-checks of the verified report totals with other data-sources<br />
(e.g. inventory records, laboratory reports, etc.).<br />
5. Spot-checks – Per<strong>for</strong>m spot-checks to verify that services or commodities are actually<br />
delivered to the target populations.<br />
A <strong>Guide</strong> <strong>for</strong> <strong>Monitoring</strong> <strong>and</strong> <strong>Evaluating</strong> <strong>Population</strong>-<strong>Health</strong>-Environment Programs 29
Participatory Approaches to M&E<br />
Just as a chain is only as strong as its weakest link, an M&E system is only<br />
as strong as the individuals who collect, analyze, <strong>and</strong> interpret the data, <strong>and</strong><br />
the people who use the in<strong>for</strong>mation <strong>and</strong> help identify gaps in the data. By<br />
nature, a fully functional M&E system is only achieved through a participatory<br />
approach to system development <strong>and</strong> implementation. It requires<br />
consensus, capacity building, <strong>and</strong> human <strong>and</strong> financial investments. These<br />
aspects are especially important to integrated projects, where implementers<br />
have diverse backgrounds <strong>and</strong> experience in monitoring <strong>and</strong> evaluation<br />
methods. The participatory approach <strong>and</strong> consensus-building activities include<br />
gathering stakeholders <strong>for</strong> group discussions on measurement goals,<br />
setting data quality st<strong>and</strong>ards, <strong>and</strong> making in<strong>for</strong>mation transparent <strong>and</strong><br />
available to all stakeholders. The Conservation Measures Partnership has<br />
identified the involvement of stakeholders as a general principle in the<br />
project-management cycle.<br />
One of the first requirements is to define internal <strong>and</strong> external<br />
stakeholders. Internal stakeholders include your project team<br />
(which can be as few as two people) composed of NGO staff,<br />
local stakeholders, researchers, or whomever else you find important<br />
to include. External stakeholders include community<br />
members, <strong>and</strong> other individuals <strong>and</strong> institutions that have some<br />
interest in <strong>and</strong> connection to the project. In conducting your<br />
project, it is important at every step to make sure you involve<br />
the appropriate internal <strong>and</strong> external stakeholders in the proper<br />
manner. (Conservation Measures Partnership, 2004)<br />
To develop a functional, successful, PHE-focused M&E system, a field<br />
program should use a single M&E plan that has been developed <strong>and</strong> reviewed<br />
by its family planning, health, <strong>and</strong> conservation components. This<br />
collaborative ef<strong>for</strong>t maximizes the measurement of synergies <strong>and</strong> crosssectoral<br />
integration, leveraging of data sources, M&E capacity, <strong>and</strong> the<br />
utility of the in<strong>for</strong>mation.<br />
Coordination between sectors is crucial in the collection of program in<strong>for</strong>mation.<br />
Given limited resources <strong>and</strong> the shared goal of improving health<br />
<strong>and</strong> environmental outcomes, the importance that PHE data collection<br />
methods complement each other cannot be underestimated. PHE projects<br />
need to leverage the conservation-<strong>and</strong>-health-outcome data host organizations<br />
have already collected. Often, partners involved in implementing<br />
an integrated program do not sufficiently coordinate ef<strong>for</strong>ts to collect in-<br />
30 Part Two: Program <strong>Monitoring</strong> <strong>and</strong> Evaluation
<strong>for</strong>mation that can show the benefits of integrated programming.<br />
By the nature of PHE programs, M&E plans should include multiple<br />
data sources. That is, they should include indicators that call <strong>for</strong> data from<br />
each sector <strong>and</strong> include data from the program facilities, routine population<br />
surveillance, <strong>and</strong> special surveys. At the time of this publication, the<br />
PHE community had struggled to develop data sources that collect comprehensive<br />
data on PHE programs <strong>and</strong> measure the integration of those<br />
programs. In addition, few programs had the available resources to launch<br />
new data sources. To that end, programs should look outside their sector<br />
<strong>for</strong> data on selected indicators to show achievement.<br />
Discussion between field <strong>and</strong> headquarters program managers <strong>and</strong> staff<br />
complete this participatory approach to PHE M&E. Central programs<br />
generally rely on the field to provide the in<strong>for</strong>mation required to report<br />
to USAID <strong>and</strong> other donors. There<strong>for</strong>e, it is important that a program’s<br />
headquarters <strong>and</strong> field staff develop a clear underst<strong>and</strong>ing <strong>and</strong> consensus<br />
regarding the expectations of data collection <strong>and</strong> data quality. The successes<br />
<strong>and</strong> lessons learned from the communication <strong>and</strong> teamwork between<br />
central- <strong>and</strong> field-level operations, <strong>and</strong> between sectors, should be<br />
implemented regularly.<br />
The M&E plan should clearly state the roles, responsibilities, <strong>and</strong> time<br />
lines <strong>for</strong> collecting data, as well as each indicator’s data source. Partner<br />
roles in participatory M&E processes vary according to the level <strong>and</strong> type<br />
of data collection. The plan should also clearly state the roles <strong>and</strong> responsibilities<br />
<strong>for</strong> assuring high data quality. Partners <strong>and</strong> an external agency<br />
should routinely verify data <strong>for</strong> quality. A strong M&E plan <strong>and</strong> system<br />
require data from various sources <strong>and</strong> levels, as well as a high level of<br />
cooperation <strong>and</strong> coordination among projects to provide valid evidence<br />
regarding program per<strong>for</strong>mance <strong>and</strong> the effects of integration.<br />
Your M&E working group will select a set of indicators based on the goals<br />
<strong>and</strong> objectives of the program, donor requirements, <strong>and</strong> special inquiries<br />
identified by stakeholders. The M&E plan should clearly state the sources<br />
<strong>for</strong> collecting data <strong>for</strong> these indicators <strong>and</strong> how often the data should be<br />
collected. Sources should vary between sectors <strong>and</strong> levels. That is, PHE<br />
programs should refer to data across sectors <strong>and</strong> at the program, population,<br />
<strong>and</strong> ecosystem levels. Leveraging data sources from across sectors increases<br />
efficiency <strong>and</strong> supports the participatory approach <strong>for</strong> PHE M&E.<br />
PHE M&E is unique because it measures the ability of multiple sectors to<br />
A <strong>Guide</strong> <strong>for</strong> <strong>Monitoring</strong> <strong>and</strong> <strong>Evaluating</strong> <strong>Population</strong>-<strong>Health</strong>-Environment Programs 31
achieve common goals harmoniously. In addition to sharing in<strong>for</strong>mation<br />
from data sources across sectors, PHE programs should strongly consider<br />
investing in measuring outcomes using surveys that measure behavior<br />
change with regard to health <strong>and</strong> the environment. For example, social behavioral<br />
in<strong>for</strong>mation about environment-related practices as well as healthseeking<br />
behavior can be collected in one survey developed specifically <strong>for</strong><br />
your project/program. Environmental data based on a specific geographic<br />
area can be linked to health behavior by using innovative methodologies<br />
such as geographic in<strong>for</strong>mation systems. These interim investigations serve<br />
as valuable data sources <strong>for</strong> in<strong>for</strong>mation regarding the strength of your<br />
integrated PHE program. The costs <strong>for</strong> special surveys <strong>and</strong> their benefits<br />
should be considered in the 5% to 10% M&E allocation of the total program<br />
budget. The design of these surveys will depend on several factors<br />
including the budget available, scale of the program, capacity of the organization,<br />
<strong>and</strong> outcomes of interest. These surveys should be conducted at<br />
strategic intervals during the project implementation cycle, as described in<br />
the M&E plan.<br />
Steps <strong>for</strong> Developing <strong>and</strong> Implementing an M&E plan<br />
This section provides general guidance on developing <strong>and</strong> implementing<br />
an M&E plan <strong>for</strong> PHE programs. These steps can be used <strong>for</strong> revising<br />
existing M&E plans or systems, as well as developing <strong>for</strong>mal plans. M&E<br />
is an iterative process that should be integrated into a program’s workflow.<br />
Plans should call <strong>for</strong> regularly collected <strong>and</strong> reported data; the plan itself<br />
should be periodically revised <strong>and</strong> harmonized with the program (logic)<br />
model or approach. In this way, the steps below can also be viewed as a<br />
cyclical process, with unique starting points <strong>for</strong> each program.<br />
Step 1: Define the Purpose of the M&E <strong>and</strong> Per<strong>for</strong>mance Objectives<br />
Who? – Following a participatory approach, create an M&E working<br />
group of project staff, field personnel, implementing partners, <strong>and</strong> central<br />
program managers committed to developing <strong>and</strong> implementing an M&E<br />
plan.<br />
What? In the initial meetings <strong>for</strong> the M&E working group, discuss the<br />
program’s conceptual approaches to PHE around the table. Illustrate the<br />
program’s logical results chain, conceptual or results frameworks, answering<br />
such questions as, what are the explicit goals <strong>and</strong> objectives of the<br />
project?, what is the ultimate goal of our program <strong>and</strong> project <strong>and</strong> how<br />
does the integrated PHE approach help to achieve that goal?, <strong>and</strong> what<br />
are the project’s inputs, processes, outputs, outcomes, <strong>and</strong> impacts? Dis-<br />
32 Part Two: Program <strong>Monitoring</strong> <strong>and</strong> Evaluation
cuss the purposes, benefits <strong>and</strong> challenges of M&E from each member’s<br />
perspective. Finally, establish the goals <strong>for</strong> the project’s M&E system <strong>and</strong><br />
the results that the group seeks to measure (e.g., health, conservation, poverty<br />
alleviation, reproductive health service delivery, etc.). At this stage, the<br />
M&E working group should develop a conceptual framework that will<br />
guide the development of the M&E plan. Through this, the program managers<br />
can better illustrate what linkages are being made between sectors.<br />
Why? – This discussion will set the stage <strong>for</strong> the M&E plan, ensure that all<br />
stakeholders have a clear <strong>and</strong> shared vision of the purpose, challenges, <strong>and</strong><br />
project elements <strong>and</strong> goals <strong>for</strong> the M&E plan.<br />
Value of a Conceptual Framework<br />
The complexity <strong>and</strong> diversity of PHE programs make it difficult to capture all individual program<br />
components in one M&E framework. Programs often use different processes to arrive at the same<br />
outcome or use similar processes to arrive at different outcomes. A conceptual framework is useful<br />
<strong>for</strong> sorting out causal linkages — capturing the ways in which the process/activities of the<br />
program affect the knowledge, attitudes, skills, <strong>and</strong> behaviors of the target population. In this<br />
sense, a conceptual framework can help identify what evaluation in<strong>for</strong>mation might be useful to<br />
the intended users of the in<strong>for</strong>mation. A conceptual framework is particularly important <strong>for</strong> PHE<br />
programs as it serves as the basis <strong>for</strong> how the linked interventions of population, health, <strong>and</strong> environment<br />
sectors will lead to the long-term goal of the program.<br />
Step 2: Resource Availability Mapping<br />
Who? – Project manager, staff, <strong>and</strong> the M&E working group are involved.<br />
What? – Working from the first set of meetings, the group can now assess<br />
the available resources to implement the M&E plan. The group, in<br />
consultation with appropriate program authority, should develop a M&E<br />
budget to cover the costs of capacity-building activities, data collection<br />
<strong>and</strong> processing expenses, <strong>and</strong> human resources. The general guidance is to<br />
allocate 5% to 10% of project funds to M&E activities.<br />
Why? – A clear, explicit underst<strong>and</strong>ing of the resources available to implement<br />
an M&E system guides the processes of selecting indicators, developing<br />
instruments, collecting <strong>and</strong> analyzing data, <strong>and</strong> making data<br />
available <strong>for</strong> use. Institutional commitment to the M&E system ensures<br />
sustainability across time.<br />
A <strong>Guide</strong> <strong>for</strong> <strong>Monitoring</strong> <strong>and</strong> <strong>Evaluating</strong> <strong>Population</strong>-<strong>Health</strong>-Environment Programs 33
Table 2 – llustrative <strong>Monitoring</strong> <strong>and</strong> Evaluation Budget<br />
Activity<br />
Amount in Dollars<br />
Program manager time $x<br />
Routine collection <strong>for</strong>ms <strong>and</strong> duplication $x<br />
Training staff in use of <strong>for</strong>ms $x<br />
Implementation of survey or special study $x<br />
Special study consultant $x<br />
Total estimated spending $x<br />
Step 3: Identify Indicators, Methodological Approaches, <strong>and</strong> Data Sources<br />
Who? Project staff <strong>and</strong> field personnel (<strong>and</strong> implementing partners, if applicable)<br />
are involved.<br />
What? – Revisit the documents from the first set of meetings, <strong>and</strong> develop<br />
the list of program <strong>and</strong> project-appropriate indicators from those<br />
in this document. Compare that list with donor requirements, stakeholder<br />
requests, <strong>and</strong> in<strong>for</strong>mation gaps. Select a core list of indicators based on<br />
the needs of all stakeholders. Although donor indicators may not always<br />
be directly useful <strong>for</strong> local program improvements, they are essential <strong>for</strong><br />
reporting in order to maintain the program’s financial viability. Next, review<br />
the available data sources from which you can collect the necessary<br />
in<strong>for</strong>mation. Then, consider if the same data sources could provide additional<br />
indicators that would serve more direct program needs. No program<br />
should attempt to collect in<strong>for</strong>mation <strong>for</strong> all of the indicators in this guide.<br />
All programs should have a subset of these indicators in their M&E Plan.<br />
Next, develop a timeline of reporting requirements (donor, stakeholder,<br />
etc.), <strong>and</strong> map those dates with the data sources. This document can serve<br />
as a draft decision calendar. A decision calendar maps the programmatic<br />
decisions that need to be made over time (e.g., a year, a quarter, a five-year<br />
span) with the data <strong>and</strong> in<strong>for</strong>mation required to make those decisions.<br />
Finally, making a time frame or task schedule can be especially useful in<br />
keeping the participatory M&E plan development moving <strong>for</strong>ward. A<br />
schedule of tasks to be achieved provides transparency, accountability, <strong>and</strong><br />
adequate resource allocation over the life of the system cycle. Table 3 on<br />
pages 36-37 shows an illustrative task schedule.<br />
Why? – Key to data collection is detailed descriptions of indicators <strong>and</strong> ensuring<br />
that responsible parties have a stake in selection of appropriateness.<br />
34 Part Two: Program <strong>Monitoring</strong> <strong>and</strong> Evaluation
Step 4: Develop an Implementation <strong>and</strong> Data Dissemination <strong>and</strong> Use Plan<br />
Who? – Project staff <strong>and</strong> field personnel, implementing partners, program<br />
managers are involved.<br />
What? – Stakeholders meet regularly to discuss data collection, any issues<br />
with data quality, <strong>and</strong> how that in<strong>for</strong>mation has been or could be used. In<br />
the beginning stages, the M&E working group should develop a data use<br />
plan, identify barriers to data use, <strong>and</strong> an in<strong>for</strong>mation flow map to illustrate<br />
how data can be interpreted to make in<strong>for</strong>med decisions. This meeting requires<br />
a clear underst<strong>and</strong>ing of what questions the indicators were selected<br />
to answer <strong>and</strong> how those answers can be applied to program protocol.<br />
Why? – The ultimate purpose of M&E is to provide in<strong>for</strong>mation that is<br />
used. Preparing <strong>for</strong> data use on a continuous basis assures that in<strong>for</strong>mation<br />
is used to make in<strong>for</strong>med decisions. This process also helps the group think<br />
strategically about different users’ needs, what data to collect, <strong>and</strong> exactly<br />
how data can be used.<br />
Step 5: Compile <strong>and</strong> Write the M&E Plan<br />
Who? – Project M&E person, if applicable, or project leader (if responsible<br />
<strong>for</strong> M&E) is involved.<br />
What? – Drawing from the in<strong>for</strong>mation gathered from all the previous<br />
sessions, draft an M&E Plan that explicitly states all the material covered.<br />
Examples of sections to include are:<br />
a. introduction, including general project design, goals <strong>and</strong> objectives;<br />
b. purpose of the M&E plan;<br />
c. critical assumptions;<br />
d. frameworks – conceptual, logical, result chains, <strong>and</strong>/or strategic;<br />
e. indicators including definition, sources, etc.;<br />
f. data sources <strong>and</strong> data collection;<br />
g. evaluations/special studies – types <strong>and</strong> uses of evaluation bias, how<br />
in<strong>for</strong>mation from evaluations relates to the regular monitoring, sampling,<br />
reference sources of types of evaluations;<br />
h. data use plans/reporting cycles, M&E system review meetings; <strong>and</strong><br />
i. a plan to monitor the system itself <strong>and</strong> evaluate its effectiveness.<br />
Why? – The M&E plan guides everyone involved in project monitoring.<br />
All participants should be held to the same set of indicators, definitions,<br />
<strong>and</strong> timelines; <strong>and</strong> roles <strong>and</strong> responsibilities should be clearly defined. The<br />
uses of data are clearly outlined. The M&E plan serves as an agreement<br />
A <strong>Guide</strong> <strong>for</strong> <strong>Monitoring</strong> <strong>and</strong> <strong>Evaluating</strong> <strong>Population</strong>-<strong>Health</strong>-Environment Programs 35
Table 3 – Illustrative Task Schedule<br />
The timing <strong>and</strong> exact tasks <strong>for</strong> your project may differ from this task schedule <strong>and</strong> this should be altered to reflect the actuality of your PHE project.<br />
Tasks (YEAR 1) (YEAR 2)<br />
Jan-Mar Apr-Jun Jul-Sep Oct-Dec Jan-Mar Apr-Jun Jul-Sep Oct-Dec<br />
Develop M&E Working Group<br />
Identify staff M&E leader X<br />
Provide training <strong>for</strong> new M&E leader, working group X X<br />
Define working group goals, objectives <strong>and</strong> tasks X<br />
Other X<br />
M&E Plan Development & Tools<br />
Distribute or develop program logic model with M&E working group X X<br />
Review resources available <strong>for</strong> M&E implementation X<br />
Develop indicator list, methodological approaches, <strong>and</strong> data sources X<br />
Develop data quality assessment plan X<br />
Introduce operations manual <strong>and</strong> provide training on data collection,<br />
data quality, <strong>and</strong> data use to program implementers<br />
X X<br />
Other<br />
Data Collection & Analysis<br />
Program-based data<br />
Create indicator collection <strong>for</strong>ms X<br />
Finalize data collection <strong>for</strong>ms with M&E working group X
Other<br />
<strong>Population</strong>-based data<br />
List available <strong>and</strong> useful data sources <strong>and</strong> collection dates X<br />
Develop survey instrument X<br />
Implement survey in the field X<br />
Other<br />
In<strong>for</strong>mation Products<br />
Donor reports X X<br />
Other<br />
Data Dissemination<br />
When does each product get disseminated? X X<br />
Other<br />
Note: This schedule represents a partial list of tasks that need to be completed.
among stakeholders <strong>and</strong> a resource that provides clarity <strong>and</strong> transparency<br />
to the entire process.<br />
Step 6: Use Data <strong>for</strong> Decision-Making <strong>and</strong> Review M&E Plan<br />
Who? – Project managers are involved, with feedback from staff <strong>and</strong> program<br />
managers.<br />
What? – The M&E working group should periodically review the plan<br />
<strong>and</strong> update it based on the successes <strong>and</strong> shortfalls of system per<strong>for</strong>mance.<br />
<strong>Monitoring</strong> <strong>and</strong> evaluating a project should allow users to see operational<br />
problems <strong>and</strong> program designs that need correction. The group should solicit<br />
feedback from data gatherers, processors, <strong>and</strong> in<strong>for</strong>mation users. The<br />
group should also communicate how data can be used to in<strong>for</strong>m the direction<br />
of project implementation with project staff <strong>and</strong> stakeholders.<br />
Why? – M&E should promote a process of using in<strong>for</strong>mation. The M&E<br />
plan is a living document that is only useful as long as it reflects project<br />
implementation <strong>and</strong> reporting needs. Data should be used to adapt the<br />
project accordingly; regular monitoring can lead to the necessity to develop<br />
special studies <strong>and</strong> evaluations to answer implementation questions.<br />
38 Part Two: Program <strong>Monitoring</strong> <strong>and</strong> Evaluation
Methods <strong>and</strong> Data Sources Used in this <strong>Guide</strong><br />
The following table provides an overview of each measurement level used<br />
in this guide, as well as related data sources <strong>and</strong> time frames <strong>for</strong> collection.<br />
Some examples of data sources may serve both program- <strong>and</strong> populationlevel<br />
indicators. These data sources may provide various pieces of in<strong>for</strong>mation<br />
<strong>for</strong> several indicators. The indicators selected in these categories do<br />
not measure whether the program has had an impact. It is not the indicators<br />
but the evaluation design that would measure the impact of the program.<br />
The table has been generalized <strong>for</strong> a wide variety of programs with<br />
different objectives <strong>and</strong> goals.<br />
Level of<br />
Measurement<br />
Inputs<br />
Program-based<br />
measures<br />
Process<br />
Program-based<br />
measures<br />
Outputs<br />
Program-based<br />
measures<br />
Outcomes<br />
(short-term or<br />
long-term)<br />
<strong>Population</strong>-based<br />
or habitat-based<br />
measures<br />
Table 4 – Data Types by Level of Measurement<br />
Methods Data Sources Time Frame<br />
1. Trend analysis<br />
2. Rapid appraisal<br />
1. Trend analysis<br />
2. Rapid appraisal<br />
1. Trend analysis<br />
2. Transect survey<br />
1. <strong>Population</strong>based<br />
surveys<br />
2. Transect survey<br />
3. Mapping<br />
1. Service statistics<br />
2. Project records<br />
3. Key in<strong>for</strong>mant interviews<br />
4. Direct observation<br />
5. Facility surveys<br />
6. Focus groups<br />
1. Service statistics<br />
2. Project records<br />
3. Key in<strong>for</strong>mant interviews<br />
4. Direct observation<br />
5. Facility surveys<br />
6. Focus groups<br />
1. Service statistics<br />
2. Project records<br />
3. Direct observation<br />
1. Questionnaires<br />
2. Survey <strong>for</strong>ms<br />
3. Global positioning<br />
systems, fly-overs<br />
4. Legal records<br />
5. Log books<br />
Progress within six months<br />
of project start <strong>and</strong> routinely<br />
collected every one<br />
to three months throughout<br />
project cycle<br />
First six months to one year<br />
of program implementation<br />
One to two years<br />
Two to three years <strong>for</strong> shortterm<br />
<strong>and</strong> three to five years<br />
or longer <strong>for</strong> long-term<br />
A <strong>Guide</strong> <strong>for</strong> <strong>Monitoring</strong> <strong>and</strong> <strong>Evaluating</strong> <strong>Population</strong>-<strong>Health</strong>-Environment Programs 39
Trend Analysis<br />
Data sources — service statistics, project records<br />
Most programs have a system or protocol <strong>for</strong> collecting data, either <strong>for</strong> the<br />
purposes of reporting to donors or to improve the program. Even programs<br />
that do not have a <strong>for</strong>mal M&E system usually collect data on provided<br />
services. These data sources include health-facility records (e.g., patient<br />
records, stock inventories, training-course evaluations, budgets, strategic<br />
plans, operational plans, M&E plans, etc.) <strong>and</strong> environment <strong>for</strong>ms (e.g.,<br />
project logbooks <strong>and</strong> <strong>for</strong>ms from educational sessions, natural resource<br />
management plan development, etc.) that can be compiled to generate in<strong>for</strong>mation<br />
regarding service statistics <strong>and</strong> logistics data.<br />
Groups developing or revising M&E plans should review all <strong>for</strong>ms within<br />
the program that may collect data related to the selected indicators. Some<br />
<strong>for</strong>ms may collect only a part of the data required by indicators, while others<br />
may not be collected or collated in a timely manner to meet reporting<br />
requirements. Also, it may benefit the group to become familiar with the<br />
program-level data collection processes <strong>and</strong> <strong>for</strong>ms in other sectors (i.e.,<br />
health workers should learn about environment data collection <strong>and</strong> vice<br />
versa) to minimize redundancies <strong>and</strong> focus on complementary methods of<br />
data collection. The M&E working group should work closely with program<br />
implementers <strong>and</strong> managers to revise these <strong>for</strong>ms so that complete<br />
in<strong>for</strong>mation can be collected in a cost-efficient <strong>and</strong> time-efficient way.<br />
Program monitoring data can examine progress in implementation over<br />
time. Programs may select key indicators based on stakeholder interest<br />
<strong>and</strong> compare the in<strong>for</strong>mation. From this comparison, program teams can<br />
investigate changes in program operations, budget, <strong>and</strong> other factors to<br />
account <strong>for</strong> that change.<br />
How to Use Service Statistics <strong>for</strong> M&E Purposes<br />
Define the indicators to be measured from service statistics:<br />
• Redesign the <strong>for</strong>m to yield data of interest, or ensure the <strong>for</strong>m collects in<strong>for</strong>mation of<br />
interest.<br />
• Obtain authorization to incorporate changes into the in<strong>for</strong>mation system.<br />
• Train appropriate staff in the use of the revised instrument.<br />
• Ensure the quality of the data.<br />
• Process the in<strong>for</strong>mation manually or by computer.<br />
Present the in<strong>for</strong>mation in a <strong>for</strong>m that is easy to underst<strong>and</strong>.<br />
40 Part Two: Program <strong>Monitoring</strong> <strong>and</strong> Evaluation
Rapid Appraisal (Qualitative)<br />
Data sources — direct observation, focus groups, key in<strong>for</strong>mant interviews,<br />
facility surveys<br />
While <strong>for</strong>mal surveys may be conducted at long intervals (i.e., every five<br />
years <strong>and</strong> over several months), rapid appraisal methods can provide interim<br />
in<strong>for</strong>mation on program per<strong>for</strong>mance. Rapid appraisal methods are<br />
quick, low-cost ways to gather in<strong>for</strong>mation from stakeholders to respond<br />
to decision-makers. They generally require four to six weeks, depending on<br />
the population size, location <strong>and</strong> the number of sites observed. These methods<br />
provide qualitative in<strong>for</strong>mation that provides context <strong>for</strong> any quantitative<br />
data collected, to further underst<strong>and</strong> people’s values, motivations,<br />
<strong>and</strong> reactions. This category includes direct observation, focus groups, key<br />
in<strong>for</strong>mant interviews, <strong>and</strong> facility surveys.<br />
Key in<strong>for</strong>mant <strong>and</strong> in-depth interviews tend to be open-ended <strong>and</strong> range<br />
from a total lack of structure <strong>and</strong> minimum control over a respondent’s<br />
answers, to semi-structured interviews based on a written list of questions<br />
<strong>and</strong> topics that need to be covered in a particular order, <strong>and</strong> fully-structured<br />
interview techniques that may include tasks that require respondents<br />
to rate or rank order a list of things. Open-ended questions <strong>and</strong> probes are<br />
used to elicit respondent’s experiences, opinions, feelings, <strong>and</strong> knowledge.<br />
Focus groups are a particular type of in-depth interview that involve a<br />
small group of people (usually six to 12) <strong>and</strong> a moderator to discuss a particular<br />
topic. Focus groups are less expensive than surveys to conduct, <strong>and</strong><br />
provide insights into how people feel about a particular issue or behavior<br />
<strong>and</strong> why they feel that way.<br />
Direct observation entails fieldwork descriptions of activities, behaviors,<br />
actions, conversations, interpersonal reactions, <strong>and</strong> organizational <strong>and</strong><br />
community processes. Data consist of detailed descriptions that include<br />
the context in which the observations were made. Direct observations require<br />
the investigator to engage personally in all or part of the program<br />
under study or participate as a regular member or client, as a participant<br />
observer, to gain greater insights than could be obtained from a survey<br />
questionnaire.<br />
While focus groups <strong>and</strong> key in<strong>for</strong>mant interviews require questioning <strong>and</strong><br />
facilitating conversation with people, direct observation of conditions either<br />
in the environment (i.e., counting species) or as a part of a population-based<br />
survey (i.e., observing the availability of h<strong>and</strong>-washing supplies<br />
A <strong>Guide</strong> <strong>for</strong> <strong>Monitoring</strong> <strong>and</strong> <strong>Evaluating</strong> <strong>Population</strong>-<strong>Health</strong>-Environment Programs 41
in a household) do not necessarily require skills in questioning. A facility<br />
survey may involve a combination of questioning staff <strong>and</strong> observing conditions<br />
in the facility or provision of services.<br />
<strong>Population</strong>-Based Surveys<br />
Data sources — questionnaires (sometimes includes direct observation)<br />
<strong>Population</strong>-based surveys collect in<strong>for</strong>mation on key topics from a representative<br />
sample of people or households, <strong>and</strong> generalize that in<strong>for</strong>mation<br />
to the entire population. One example of a population-based survey at the<br />
national level is the Demographic <strong>and</strong> <strong>Health</strong> Survey. Surveys may also be<br />
conducted at the regional or district level, or among a target populations<br />
(e.g., youth, most-at-risk population, women of reproductive age).<br />
Most PHE projects/programs target either a particular demographic group<br />
or a sub-national or sub-regional population. Although large populationbased<br />
surveys draw from a population larger than a typical PHE program’s<br />
clientele, they can provide PHE programs with in<strong>for</strong>mation on outputlevel<br />
<strong>and</strong> outcome-level indicators. <strong>Population</strong>-based surveys’ structured<br />
interviews involve developing questionnaires <strong>and</strong> a sampling methodology,<br />
<strong>and</strong> pose closed questions to garner quantitative data that are representative<br />
at the population level <strong>for</strong> outputs <strong>and</strong> outcomes (<strong>for</strong> PHE programs,<br />
population level refers to the local level <strong>for</strong> the population targeted by the<br />
project). The data need to be collected <strong>and</strong> analyzed with the highest degree<br />
of integrity <strong>and</strong> may require special expertise. Although some population-based<br />
surveys conducted by PHE programs may not be large in scale,<br />
a specialized agency or institution should be contracted to per<strong>for</strong>m surveys<br />
at the population level to avoid bias in the data collection.<br />
42 Part Two: Program <strong>Monitoring</strong> <strong>and</strong> Evaluation
Steps in Carrying Out a Survey Using a Structured Questionnaire<br />
1. Plan the survey<br />
• Develop the questionnaire.<br />
• Review the questionnaire with experts <strong>and</strong> stakeholders <strong>and</strong> incorporate their revisions.<br />
• Review the study protocol (including the objective, target population, sample design,<br />
sample size, survey instruments, <strong>and</strong> timeline).<br />
• Have the study approved by the appropriate national ethics board.<br />
• Select <strong>and</strong> train the interviewers.<br />
2. Carry out the fieldwork<br />
• Conduct a pre-test in the field (among respondents similar to the population to be<br />
interviewed).<br />
• Modify the instruments based on the pre-test.<br />
• Coordinate logistical aspects <strong>for</strong> the fieldwork.<br />
• Collect the data.<br />
3. Process <strong>and</strong> analyze the data<br />
• Review the questionnaires while the interviewers are still on location.<br />
• Code the data.<br />
• Enter the data into the computer (with a program such as Epi-Info or SPSS).<br />
• Prepare the tables of results, according to the analysis plan.<br />
4. Produce the results <strong>and</strong> disseminate the report<br />
• Prepare a final report.<br />
• Share the results with people responsible <strong>for</strong> the project <strong>and</strong> other interested parties.<br />
Transect Survey<br />
Data sources — survey <strong>for</strong>m (mainly includes direct observation)<br />
A transect survey can measure the area of the habitat a project is targeting<br />
in its intervention. Transect routes should evenly sample the habitat<br />
types <strong>and</strong> natural resource management activity on sites. As much as possible,<br />
each survey should take place at the same of time of day, weather<br />
conditions, location, overall methodology, <strong>and</strong> observer training level so<br />
that these factors do not unevenly influence recorded results. This data<br />
collection method can produce in<strong>for</strong>mation <strong>for</strong> both quantitative (species<br />
counts) <strong>and</strong> qualitative (condition of habitat) aspects of the natural environment.<br />
Transects should be done by walking or driving the transect line in a given<br />
direction in a straight line. Data collectors should sample points at predetermined<br />
distances (e.g., approximately every 100 m) <strong>for</strong> a selected total<br />
distance (e.g., 1 or 2 km per transect). Data collectors should travel<br />
A <strong>Guide</strong> <strong>for</strong> <strong>Monitoring</strong> <strong>and</strong> <strong>Evaluating</strong> <strong>Population</strong>-<strong>Health</strong>-Environment Programs 43
the grid or transect at a slow, steady pace <strong>and</strong> take the same route <strong>for</strong><br />
each survey. Transects are divided into sections corresponding to different<br />
habitat or management units. One method of data collection is to mark<br />
off targeted fixed-route grids/transects to survey several times during each<br />
two or three-year period. Species are recorded along the route on a regular<br />
(monthly or yearly) basis. Data collectors should never wait at “hotspots”<br />
where they have seen species previously, as this will lead to bias. A st<strong>and</strong>ardized<br />
field recording <strong>for</strong>m should be used to record observations.<br />
The time of day of the transect walks should also be held constant <strong>for</strong><br />
comparison purposes. The grid/transect should be surveyed by trained observers<br />
at pre-determined times of the day or night (depending on the<br />
species) at the same times each year. Surveys should only take place during<br />
pre-specified “good” weather conditions, which will depend on the target<br />
species. Variations in species distribution <strong>and</strong> migration/hibernation<br />
behaviors must be taken into account when deciding when <strong>and</strong> where to<br />
conduct field surveys. The goal is to avoid biasing data collection by conducting<br />
a survey, <strong>for</strong> example, during weather conditions that would cause<br />
the selected species not to be active <strong>and</strong> out in their normal habitat.<br />
Marine sampling may be done in a similar way by using snorkeling, scubadiving,<br />
boat surveys, or <strong>for</strong> large marine mammals, aerial surveys. Some<br />
possible methodologies include use of quadrates, b<strong>and</strong> transects, r<strong>and</strong>ompoint<br />
contact plots, roving diver fish counts, artificial recruitment, size frequency<br />
measurements, <strong>and</strong> aerial photos.<br />
Data collection may require several people skilled in identifying species’<br />
normal ranges or habitats. Necessary materials may include spotting<br />
scopes, spotlights, night-vision goggles, binoculars, cameras, scuba-diving<br />
equipment, global positioning system (GPS) equipment, compasses, st<strong>and</strong>ardized<br />
notebooks to record observations, surveyor tape measures, diameter<br />
tape measures, <strong>and</strong> a biodegradable topofil line (a thread measuring<br />
device with a counter that is unreeled).<br />
Mapping<br />
Data sources — aerial photographs, global positioning systems, satellite<br />
images<br />
Program staff can use maps to measure changes in l<strong>and</strong> use, l<strong>and</strong> status, species<br />
location <strong>and</strong> species migration. The various technologies <strong>for</strong> mapping<br />
interventions <strong>and</strong> tracking indicators require different levels of knowledge<br />
<strong>and</strong> expertise. Taking aerial photographs, or using GPS or satellite images<br />
44 Part Two: Program <strong>Monitoring</strong> <strong>and</strong> Evaluation
of the targeted terrestrial or marine area help programs obtain more accurate<br />
<strong>and</strong> meaningful data collection. Some rural communities use h<strong>and</strong>drawn<br />
maps to identify places of interest <strong>and</strong> important community structures.<br />
Other methods that can take advantage of mapping include selected<br />
transects, key territories <strong>and</strong> identifying breeding sites with GPS so the<br />
exact site can be identified at a future date.<br />
Generally speaking, the environmental community has more experience<br />
<strong>and</strong> expertise with using mapping <strong>for</strong> data collection than the health <strong>and</strong><br />
population technical sectors. Leveraging expertise across sectors can be<br />
particularly useful to integrated programs in tracking the changes in outcomes<br />
geographically <strong>and</strong> over time. Mapping provides an opportunity to<br />
link the outcomes in environmental change with the changes in behaviors<br />
<strong>and</strong> knowledge of the community living in that habitat. In the last decade,<br />
the public health community had gained interest in spatial analysis, a useful<br />
method <strong>for</strong> presenting changes in health outcomes. PHE programs<br />
can take advantage of the interest in the public health community <strong>for</strong> spatially-related<br />
data with the vast expertise in the environment community<br />
<strong>for</strong> spatial analysis.<br />
A <strong>Guide</strong> <strong>for</strong> <strong>Monitoring</strong> <strong>and</strong> <strong>Evaluating</strong> <strong>Population</strong>-<strong>Health</strong>-Environment Programs 45
Part Three | Indicators<br />
A <strong>Guide</strong> <strong>for</strong> <strong>Monitoring</strong> <strong>and</strong> <strong>Evaluating</strong> <strong>Population</strong>-<strong>Health</strong>-Environment Programs 47
<strong>Population</strong> Sector Indicators: Family Planning <strong>and</strong><br />
Reproductive <strong>Health</strong><br />
<strong>Population</strong> sector activities within PHE programs aim to improve <strong>and</strong><br />
sustain voluntary family planning <strong>and</strong> reproductive health services <strong>and</strong><br />
use. <strong>Population</strong> programs need to collect <strong>and</strong> assess in<strong>for</strong>mation about two<br />
broad, sometimes overlapping areas: health facilities <strong>and</strong> relevant populations.<br />
The first area is important because facility quality <strong>and</strong> staff training,<br />
access, <strong>and</strong> population use of health facilities all strongly influence<br />
the overall health of a population. <strong>Population</strong> programs not only assess<br />
a population’s physical health, but also that population’s attitudes, knowledge,<br />
<strong>and</strong> behaviors about a specific health issue, as well as promote gender<br />
equality <strong>and</strong> male inclusion in discussions about contraception. An area<br />
of improving <strong>and</strong> sustaining voluntary family planning <strong>and</strong> reproductive<br />
health services that is particularly relevant to PHE programs’ work is a<br />
focus on providing access to underserved communities.<br />
While the ultimate long-term measurement in population programs is the<br />
total fertility rate, the indicators in this guide focus on measuring variables<br />
that can be measured <strong>for</strong> results over a shorter period of time but are<br />
equally important. Many of the indicators in this section may be valuable<br />
<strong>for</strong> population-sector M&E; however, programs that have a focused nature<br />
or that face limited budgets should concentrate on measuring indicators<br />
that best fit their needs.<br />
1.<br />
2.<br />
3.<br />
4.<br />
5.<br />
Outputs<br />
Program-Based<br />
Table 5 – <strong>Population</strong> Indicators<br />
Outcomes<br />
<strong>Population</strong>-Based<br />
Number of acceptors new to modern<br />
contraception<br />
Contraceptive prevalence rate<br />
Percent of deliveries occurring in a health<br />
facility<br />
Percent of program staff trained to work with 6.<br />
or provide reproductive health services to<br />
adolescents<br />
7.<br />
Percentage of women of reproductive age 8.<br />
(15-49) who were clients of a communitybased<br />
contraceptive distributor in the last year 9. Percent of births attended by skilled health<br />
Couple-years of protection (CYP)<br />
personnel<br />
Average household distance/time to the near- 10. Percent of women attended at least once<br />
est health center<br />
during pregnancy <strong>for</strong> reasons related to<br />
Percent of skilled health personnel knowl- pregnancy<br />
edgeable in obstetric warning signs<br />
48 Part Three: Indicators
1<br />
Percent<br />
of program staff trained to work with or provide<br />
reproductive health services to adolescents<br />
Level of Measurement: Output.<br />
Definition: Staff members are considered “youth-friendly” if they have the ability to provide services<br />
<strong>and</strong> an environment that targets young audiences. Youth-friendly training generally includes learning<br />
how to create a service environment that will attract <strong>and</strong> retain a youth clientele. This includes space<br />
or rooms dedicated to adolescent reproductive health services; staff who are competent in policies <strong>and</strong><br />
procedures to ensure privacy <strong>and</strong> confidentiality; peer educators who stay on-site during hours specified<br />
<strong>for</strong> provision of services to youth, <strong>and</strong> use of non-judgmental approaches to providing services to<br />
youth <strong>and</strong> accept drop-in clients. A staff member would need to go through specific training <strong>for</strong> working<br />
with youth to be counted in this indicator. The denominator should include all staff who work in the<br />
target area during the reference period (semi-annually or annually), even staff who work part-time.<br />
<strong>Population</strong><br />
Calculation<br />
# of program staff trained to work with<br />
or provide reproductive health services to adolescents during the reference period<br />
total # of health service providers in the target area during the reference period<br />
x 100<br />
Disaggregate: None.<br />
Purpose: Reproductive health services have traditionally been designed <strong>for</strong> older, married women.<br />
Increasing the number of health providers trained to work with youth may increase the chance that<br />
youth will take advantage of the basic reproductive health services they need.<br />
Data Sources: Project records.<br />
Time frame: Semi-annually; annually.<br />
Data Collection Considerations: Specific topics related to adolescent reproductive health,<br />
such as sexual health education <strong>and</strong> peer dynamics, should be covered in the training. Use of a pre<strong>and</strong><br />
post-test will assist in determining the staff’s level of underst<strong>and</strong>ing.<br />
Strengths & Limitations: This indicator targets the service improvement <strong>for</strong> an audience that<br />
has a strong, often unmet need <strong>for</strong> reproductive health services. However, training does not indicate<br />
whether or not providers give adequate care.<br />
A <strong>Guide</strong> <strong>for</strong> <strong>Monitoring</strong> <strong>and</strong> <strong>Evaluating</strong> <strong>Population</strong>-<strong>Health</strong>-Environment Programs 49
2<br />
percent<br />
of women of reproductive age (15-49) who were clients<br />
of a community-based contraceptive distributor in the last year<br />
<strong>Population</strong><br />
Level of Measurement: Output.<br />
Definition: This indicator measures how well community-based distribution of contraception provides<br />
coverage of family planning services to an area. In the context of PHE programs, community-based distribution<br />
means that the contraceptives are sold at a point that is not a traditional health facility, such<br />
as a clinic or hospital. Community-based distribution is generally through a local store or commercial<br />
site or an individual at a non-commercial site, as well as other variations that are community-based. As<br />
measured in this indicator, a client is a woman who receives contraception from the community-based<br />
distributor (CBD), but does not include a woman who only talks with the CBD about contraceptive<br />
methods. The method of contraception here can include any method – modern or traditional.<br />
Calculation<br />
total # of women clients<br />
age 15-49 of community-based distributors in the target area in the last year<br />
total # of women age 15-49 living in the target area in the last year<br />
x 100<br />
Disaggregate: By target community.<br />
Purpose: The aims of the CBD program are to increase contraceptive use by increasing access <strong>and</strong> raising<br />
dem<strong>and</strong> through in<strong>for</strong>mation, education, <strong>and</strong> communication (EIC) activities. For PHE programs,<br />
community volunteers are usually recruited to be community-based distributors, making CBD programs<br />
especially effective in rural <strong>and</strong> isolated communities where dem<strong>and</strong> is limited <strong>and</strong> access to<br />
alternative methods is low.<br />
Data Sources: <strong>Population</strong>-based survey or project records.<br />
Time frame: Annually <strong>for</strong> project records <strong>and</strong> every three to five years <strong>for</strong> surveys.<br />
Data Collection Considerations: The questionnaire <strong>for</strong> surveying women in the target area<br />
should include the type of commodities/methods received in the previous time period year.<br />
Strengths & Limitations: CBDs tend to be low-volume independent distributors in isolated <strong>and</strong><br />
sometimes difficult-to-reach areas, creating the need <strong>for</strong> field-workers to re-supply these posts frequently<br />
<strong>and</strong> provide supervision <strong>and</strong> continuous training in contraceptive methods use <strong>and</strong> risks.<br />
50<br />
Part Three: Indicators
3<br />
Couple-years<br />
of protection<br />
Level of Measurement: Output.<br />
Definition: Couple-years of protection (CYP) is the estimated protection provided by family planning<br />
services during a one-year period based upon the volume of all contraceptives sold or distributed to<br />
clients during that period.<br />
<strong>Population</strong><br />
Table 6: How to Calculate CYP<br />
Calculation: Multiply the quantity of each method distributed to clients by the conversion factor<br />
below to obtain a CYP per method. Then sum each CYP to obtain a total CYP figure.<br />
Method Units per CYP Conversion Factor<br />
Oral contraceptives 15 cycles per CYP ¹/₁₅<br />
Condoms 120 units per CYP ¹/₁₂₀<br />
Female condoms 120 units per CYP ¹/₁₂₀<br />
Vaginal foaming tablets 120 units per CYP ¹/₁₂₀<br />
Depo Provera injectable 4 doses per CYP ¹/₄<br />
Noristerat Injectable 6 doses per CYP ¹/₆<br />
Cyclofem monthly injectable 13 doses per CYP ¹/₁₃<br />
Emergency contraceptive pills 20 doses per CYP ¹/₂₀<br />
Copper-T380-A IUD 3.5 CYP per IUD inserted 3.5<br />
Norplant implant 3.5 CYP per Implant 3.5<br />
Implanon implant 2 CYP per Implant 2<br />
Jadelle implant 3.5 CYP per Implant 3.5<br />
Natural family planning<br />
(i.e. st<strong>and</strong>ard days method)<br />
Lactational amenorrhea method<br />
(LAM)<br />
Sterilization (male & female)<br />
Asia<br />
Latin America<br />
Africa<br />
Near East/North Africa<br />
2 CYP per trained, confirmed<br />
adopter<br />
4 active users per CYP (or 0.25<br />
CYP per user)<br />
10 CYP<br />
10 CYP<br />
8 CYP<br />
8 CYP<br />
2<br />
0.25<br />
10<br />
10<br />
8<br />
6<br />
A <strong>Guide</strong> <strong>for</strong> <strong>Monitoring</strong> <strong>and</strong> <strong>Evaluating</strong> <strong>Population</strong>-<strong>Health</strong>-Environment Programs 51
<strong>Population</strong><br />
Example: A facility that distributed the following family planning services<br />
Method Quantity Conversion Factor CYP<br />
Oral contraceptives 4,321 ¹/₁₅ 288.1<br />
Condoms 9,900 ¹/₁₂₀ 82.5<br />
IUDs 80 3.5 280.0<br />
Total 650.6<br />
Disaggregate: By method.<br />
Purpose: CYP is a simple, inexpensive way to measure program activity volume using routinely collected<br />
data. CYP can monitor progress of contraceptive service delivery at the program <strong>and</strong> project<br />
levels.<br />
Data Sources: Service statistics.<br />
Time frame: Annually.<br />
Data Collection Considerations: St<strong>and</strong>ardized <strong>for</strong>ms, facility “log books” <strong>and</strong> commodities<br />
tracking are necessary <strong>for</strong> this indicator calculation. Regarding the calculation of long-term methods,<br />
most programs credit the entire amount to the calendar year in which the client accepted the method.<br />
For example, if a family planning program in Asia per<strong>for</strong>med 100 voluntary sterilization procedures in<br />
a given year, it would credit all 1000 CYP (100 procedures x 10 years each) to that calendar year, even<br />
though the protection from those programs would in fact be realized over that year <strong>and</strong> the next nine<br />
years.<br />
Strengths & Limitations: CYP can be obtained from different service delivery mechanisms.<br />
However, the value of this indicator can be difficult to underst<strong>and</strong>. CYP data do not provide individual<br />
contraceptive use rates. The validity of the conversion factors is still debated <strong>and</strong> the number of people<br />
represented is not evident in this calculation.<br />
52<br />
Part Three: Indicators
4<br />
aVERAGE<br />
HOUSEHOLD DISTANCE/TIME TO THE NEAREST HEALTH CENTER<br />
Level of Measurement: Output.<br />
Definition: This is the average time or distance from a respondent’s place of residence to the nearest<br />
service delivery site offering the measured service. The services included in this measurement should<br />
be determined in advance by the project, depending on the project’s objectives.<br />
<strong>Population</strong><br />
Disaggregate: By services offered (if desired).<br />
Purpose: Distance to a health facility is often a major factor determining whether or not people truly<br />
have access to that facility, especially when transport is not easily available.<br />
Data Sources: GPS or mapping the routes can calculate the distance between health centers <strong>and</strong><br />
communities. A less reliable option is using a population-based survey where household members are<br />
asked their distance or time it takes them to reach the nearest health center that provides the measured<br />
service.<br />
Time frame: Every one to two years.<br />
Data Collection Considerations: This indicator is useful <strong>for</strong> demonstrating the effects of providing<br />
health services in remote, underserved areas. These areas may contain relatively few people, but<br />
the impact of providing services there may be great because there were no or few pre-existing services.<br />
In these instances, the PHE project should compare the distance or traveling time it previously took the<br />
target population to get to outside health centers with the calculation of the distance or average time<br />
it takes the target population to get to the newly established health center.<br />
Strengths & Limitations: Community members may visit distant health facilities in order to<br />
maintain confidentiality. The expense <strong>and</strong> ef<strong>for</strong>t required to obtain this indicator may mean it can only<br />
be collected every few years.<br />
A <strong>Guide</strong> <strong>for</strong> <strong>Monitoring</strong> <strong>and</strong> <strong>Evaluating</strong> <strong>Population</strong>-<strong>Health</strong>-Environment Programs 53
5<br />
PERCENT<br />
OF SKILLED HEALTH PERSONNEL KNOWLEDGEABLE in<br />
OBSTETRIC WARNING SIGNS<br />
<strong>Population</strong><br />
Level of Measurement: Output.<br />
Definition: Skilled health personnel include midwives, doctors, <strong>and</strong> nurses with midwifery <strong>and</strong> lifesaving<br />
skills. Traditional birth attendants (TBAs) are typically not included in this definition. Staff members<br />
are considered “knowledgeable” if they can name at least three of the following warning signs of<br />
obstetric complications:<br />
1. bleeding<br />
2. labor lasting more than 12 hours<br />
3. placenta retained more than one hour<br />
4. convulsions or swelling of the h<strong>and</strong>s or face (eclampsia)<br />
5. fever <strong>and</strong> vaginal discharge (puerperal sepsis)<br />
Calculation<br />
# of skilled health personnel who know at least three warning signs<br />
total # of skilled health personnel interviewed<br />
x 100<br />
Disaggregate: None.<br />
Purpose: This indicator is used to assess the knowledge of skilled health personnel as the basis <strong>for</strong> their<br />
ability to make timely referrals to obstetric services. TBAs are not usually included <strong>for</strong> this indicator; but<br />
because PHE projects often train TBAs, TBA numbers may be tracked separately.<br />
Data Sources: <strong>Health</strong> worker interviews.<br />
Time frame: Annually <strong>for</strong> training records. Every two to five years <strong>for</strong> surveys.<br />
Data Collection Considerations: Ensuring that obstetric warning signs are defined in advance<br />
<strong>and</strong> used consistently <strong>for</strong> tracking this indicator over time is essential to the validity of this figure.<br />
Strengths & Limitations: Knowledge of obstetric warning signs does not indicate that health<br />
personnel are knowledgeable about the severity of warning signs or that they know how to deal with<br />
the complications.<br />
54<br />
Part Three: Indicators
6<br />
number<br />
of acceptors new to modern contraception<br />
Level of Measurement: Outcome.<br />
Definition: For this indicator, an acceptor is a person using any modern contraceptive method <strong>for</strong> the<br />
first time in his or her life within the last year. Modern contraceptive methods include IUDs, the pill,<br />
implants, injections, condoms, spermicides, diaphragms, tubal ligation, <strong>and</strong> vasectomy.<br />
<strong>Population</strong><br />
Disaggregate: By method (if desired).<br />
Purpose: This indicator measures a program’s ability to attract new clients from an untapped segment<br />
of the population.<br />
Data Sources: Usually service statistics; occasionally from population-based surveys.<br />
Time frame: Annually using service statistics; every two to five years using a population-based survey.<br />
Data Collection Considerations: Program personnel can disaggregate service statistics by key<br />
variables (age, sex, place of residence, or other factors deemed relevant in the country of context).<br />
Strengths & Limitations: Defining this indicator in terms of first-time use in the life of an individual<br />
removes the ambiguity associated with the more general term “new acceptor” that can include<br />
individuals who are new to a clinic or a method but not to modern contraceptive use. However, this<br />
indicator measures absolute numbers, not the proportion of the population. It does not measure how<br />
long contraceptive use continues or if methods are used properly.<br />
A <strong>Guide</strong> <strong>for</strong> <strong>Monitoring</strong> <strong>and</strong> <strong>Evaluating</strong> <strong>Population</strong>-<strong>Health</strong>-Environment Programs 55
7<br />
contraceptive<br />
prevalence rate<br />
<strong>Population</strong><br />
Level of Measurement: Outcome.<br />
Definition: Contraceptive prevalence rate (CPR) is defined as the percent of reproductive-age women<br />
(ages 15-49 years) who are using a contraceptive method at a particular point in time. This is almost<br />
always reported <strong>for</strong> women married or in a sexual union. Generally, this includes all contraceptive<br />
methods, modern <strong>and</strong> traditional, but it may include modern methods only. The program manager<br />
should decide in advance whether any method or just modern methods will be included in calculating<br />
this indicator. The World <strong>Health</strong> Organization (WHO) defines modern contraceptive methods as female<br />
<strong>and</strong> male sterilization, injectable <strong>and</strong> oral hormones, intrauterine devices, diaphragms, hormonal<br />
implants, spermicides, <strong>and</strong> condoms. Traditional methods include the calendar method (or rhythm),<br />
withdrawal, abstinence, <strong>and</strong> lactational amenorrhea (LAM).<br />
Calculation<br />
# of partnered women<br />
(married or in union) of reproductive age using a contraceptive method<br />
total # of partnered women (married or in union) of reproductive age<br />
x 100<br />
Disaggregate: By modern <strong>and</strong> traditional methods.<br />
Purpose: CPR measures population coverage of contraceptive use, taking all sources of supply <strong>and</strong> contraceptive<br />
methods into account.<br />
Data Sources: <strong>Population</strong>-based surveys.<br />
Time frame: Every two to five years.<br />
Data Collection Considerations: In countries with a widespread practice of sexual activity<br />
outside marriage or stable sexual unions, a prevalence estimate based on women in unions only would<br />
ignore a considerable number of current users of contraception.<br />
Strengths & Limitations: This indicator is widely used. To calculate a true contraceptive rate, the<br />
denominator should include only women at risk of pregnancy, which is difficult to measure. This indicator<br />
does not measure how long women have been using contraceptives or if they are using them<br />
correctly.<br />
56<br />
Part Three: Indicators
8<br />
percent<br />
of deliveries occuring in a health facility<br />
Level of Measurement: Outcome.<br />
Definition: A health facility is defined as a permanent building where trained health providers work<br />
with the primary intent of practicing preventive or curative medicine.<br />
<strong>Population</strong><br />
Calculation<br />
total # of deliveries occurring in a health facility in a given period<br />
total # of births within a specified area in the same period<br />
x 100<br />
Using all births to calculate this indicator is ideal, but using only live births is also acceptable. Where<br />
data on the number of live births are unavailable, calculate total expected births by multiplying population<br />
by the crude birth rate. If the crude birth rate is unknown, WHO recommends using 3.5% of the<br />
total population as an estimate of the number of pregnant women.<br />
Disaggregate: None.<br />
Purpose: Institutionalized deliveries are associated with reduced maternal mortality <strong>and</strong> increased<br />
infant survival rates. Many PHE projects train personnel to increase the number of women seeking<br />
medical assistance during normal childbirth.<br />
Data Sources: Service statistics; population-based surveys.<br />
Time frame: Annually using service statistics; every three to five years using a population-based survey.<br />
Data Collection Considerations: Frequent surveys are generally unreliable because survey<br />
periods may overlap; <strong>for</strong> international comparisons, a reference period of three to five years is probably<br />
sufficient.<br />
Strengths & Limitations: This indicator is easily calculated from population-based surveys. This<br />
indicator is birth-based so it is representative of births. The sample will over-represent women with<br />
multiple births in the reference period. These women are also more likely to have other risk factors <strong>and</strong><br />
lower rates of health facility use. The indicator will there<strong>for</strong>e underestimate the percentage of women<br />
delivering in a health facility.<br />
A <strong>Guide</strong> <strong>for</strong> <strong>Monitoring</strong> <strong>and</strong> <strong>Evaluating</strong> <strong>Population</strong>-<strong>Health</strong>-Environment Programs 57
9<br />
percent<br />
of births attended by skilled health personnel<br />
<strong>Population</strong><br />
Level of Measurement: Outcome.<br />
Definition: “Skilled health personnel” are professionals with defined skills <strong>and</strong> knowledge that enable<br />
them to provide safe health care during child birth. Skilled health personnel includes doctors, midwives,<br />
<strong>and</strong> nurses with midwifery <strong>and</strong> life-saving skills. TBAs are generally not included in this indicator.<br />
However, because PHE projects often train TBAs, TBA numbers may be tracked <strong>for</strong> other purposes.<br />
Calculation<br />
# of births attended by skilled personnel during the reference period<br />
total # of live births occurring within the reference period<br />
x 100<br />
Using all births to calculate this indicator is ideal, but using only live births is also acceptable. Where<br />
data on the number of live births are available, calculate total expected births by multiplying population<br />
by the crude birth rate. If the crude birth rate is unknown, WHO recommends using 3.5% of the<br />
total population as an estimate of the number of pregnant women.<br />
Disaggregate: By geographic area or by type of attendant.<br />
Purpose: This indicator provides in<strong>for</strong>mation on women’s use of delivery services. Many argue that<br />
increasing the proportion of deliveries with a skilled attendant is the single most critical intervention<br />
<strong>for</strong> reducing maternal mortality. It is also important <strong>for</strong> reducing newborn mortality.<br />
Data Sources: Service statistics or population-based surveys.<br />
Time frame: Annually using service statistics; every three to five years using a population-based survey.<br />
Data Collection Considerations: Both the numerator <strong>and</strong> denominator should fall within the<br />
same defined period of time. Frequent surveys are generally unreliable because survey periods may<br />
overlap. For international comparisons, a reference period of three to five years is probably sufficient.<br />
Strengths & Limitations: Differences in definitions of “skilled health attendant” <strong>and</strong> other terms<br />
may lead to discrepancies between countries. Mothers who self-report <strong>for</strong> this indicator may not accurately<br />
identify who is or isn’t a skilled health attendant. This indicator does not include stillbirths.<br />
58<br />
Part Three: Indicators
10<br />
percent of women attended at least once during pregnancy<br />
<strong>for</strong> reasons related to pregnancy<br />
Level of Measurement: Outcome.<br />
Definition: The percent of women attended at least once during pregnancy by skilled health personnel<br />
<strong>for</strong> reasons related to pregnancy.<br />
<strong>Population</strong><br />
Calculation<br />
# of pregnant women attended<br />
by skilled personnel <strong>for</strong> pregnancy-related reasons during a specified period<br />
total # of live births occurring within the specified time period<br />
x 100<br />
Disaggregate: None.<br />
Purpose: This indicator provides in<strong>for</strong>mation about women’s use of antenatal care services.<br />
Data Sources: Service statistics or population-based surveys.<br />
Time frame: Annually using service statistics; every two to five years using a population-based survey.<br />
Data Collection Considerations: The number of live births is a proxy <strong>for</strong> the numbers of all<br />
women who need antenatal care. All births should be included in the denominator; however in<strong>for</strong>mation<br />
about non-live births is difficult to obtain, so the number of live births may be substituted in its<br />
place. Both numerator <strong>and</strong> denominator should fall within the same time period. Where in<strong>for</strong>mation<br />
about the total number of live births is not available, the total estimated live births can be estimated by<br />
multiplying the target area’s population by the crude birth rate. In settings where the crude birth rate<br />
is unknown, WHO recommends using 3.5% of the total population as an estimate of pregnant women<br />
(i.e. number of live births or pregnant women = total population x .035)<br />
Strengths & Limitations: This indicator does not capture detailed in<strong>for</strong>mation about the reasons<br />
or timing of visits or quality of care. Antenatal care services may not exist in some rural or remote<br />
regions where PHE programs work.<br />
A <strong>Guide</strong> <strong>for</strong> <strong>Monitoring</strong> <strong>and</strong> <strong>Evaluating</strong> <strong>Population</strong>-<strong>Health</strong>-Environment Programs 59
<strong>Health</strong> Indicators: Child Survival <strong>and</strong> Environmental <strong>Health</strong><br />
Child survival <strong>and</strong> environmental health activities work toward reducing<br />
child morbidity, mortality, <strong>and</strong> disease incidence. Child health <strong>and</strong> survival<br />
has been a focus <strong>for</strong> many large-scale international programs, including the<br />
Millennium Development Goals, the Integrated Management of Childhood<br />
Illness strategy, the Global Alliance <strong>for</strong> Vaccines <strong>and</strong> Immunization,<br />
<strong>and</strong> the Roll Back Malaria initiative.<br />
Many communities served by PHE projects have identified child health<br />
<strong>and</strong> survival as a priority. The indicators in this section have been chosen<br />
to measure indicators at the input, process, output, <strong>and</strong> short- to mediumterm<br />
outcome levels rather than the long-term outcomes of disease incidence<br />
<strong>and</strong> infant <strong>and</strong> child mortality. Together, these indicators cover<br />
a broad range of environmental <strong>and</strong> child health activities. Most PHE<br />
programs work on achieving the shorter-term outcomes in a smaller community<br />
<strong>and</strong> contribute to a larger ef<strong>for</strong>t in the area to improve child health.<br />
Depending on their focus <strong>and</strong> resources, PHE programs can choose the<br />
indicators most appropriate <strong>for</strong> their own work.<br />
1.<br />
2.<br />
3.<br />
4.<br />
Table 7 – <strong>Health</strong> Indicators<br />
Outputs<br />
Outcomes<br />
Number of doses of tetanus 5. Percent of pregnant women 9. Percent of households using<br />
vaccine distributed<br />
receiving at least two doses an improved toilet facility<br />
Number of insecti-<br />
of tetanus toxoid vaccine 10. Percent of households using<br />
cide-treated bed nets 6. Percent of children aged 12- soap in last 24 hours<br />
distributed<br />
23 months fully immunized 11. Percent of households storing<br />
Number of packets of oral be<strong>for</strong>e 12 months<br />
drinking water safely<br />
rehydration salts distributed 7. Percent of households with 12. Percent of children under<br />
Number of safe water stor- access to an improved source five years who slept under<br />
age vessels distributed<br />
of drinking water<br />
an insecticide-treated bed<br />
8. Time spent by household<br />
net the previous night<br />
members to collect water 13. Oral rehydration therapy<br />
use rate<br />
60 Part Three: Indicators
1<br />
Number<br />
of doses of tetanus vaccine distributed<br />
Level of Measurement: Output.<br />
Definition: This involves the total number of doses of tetanus vaccine distributed by a program or<br />
facility in a specified period. These doses include the total of any of tetanus-toxoid (TT) or tetanusdiphtheria<br />
toxoid (Td) vaccines. The period of time should be defined in advance. The in<strong>for</strong>matin is<br />
usually collected monthly at the facility <strong>and</strong> aggregated quarterly by the project manager.<br />
Disaggregate: None, or if desired, by facility/distributor.<br />
<strong>Health</strong><br />
Purpose: Neonatal tetanus kills 200,000 infants in the developing world every year. This indicator can<br />
measure program or clinic capacity to promote prevention of this disease. PHE projects frequently distribute<br />
immunizations through facility-based <strong>and</strong> community-based methods.<br />
Data Sources: Service statistics.<br />
Time frame: Monthly, quarterly.<br />
Data Collection Considerations: Doses of tetanus vaccine are given to women of child-bearing<br />
age <strong>and</strong> to pregnant women without previous exposure to TT, Td, or diphtheria, tetanus, <strong>and</strong> pertussis<br />
(DTP) vaccines. This indicator can be used as a template <strong>for</strong> measuring other vaccines distributed<br />
by the project, substituting tetanus with the vaccine of interest.<br />
Strengths & Limitations: Data <strong>for</strong> this indicator are easily collected, <strong>and</strong> the indicator can quickly<br />
estimate a program or facility’s reach in a given region. However, this indicator does not measure<br />
whether vaccines were administered correctly or the proportion of targeted populations reached.<br />
A <strong>Guide</strong> <strong>for</strong> <strong>Monitoring</strong> <strong>and</strong> <strong>Evaluating</strong> <strong>Population</strong>-<strong>Health</strong>-Environment Programs 61
2<br />
number<br />
of insecticide-treated bed nets distributed<br />
Level of Measurement: Output.<br />
Definition: This involves the number of insecticide-treated bed nets distributed by the project in a<br />
region in a given reference period (e.g., quarterly). Insecticide-treated bed nets have been dipped in<br />
an insecticide effective against local malaria-causing mosquitoes.<br />
<strong>Health</strong><br />
Disaggregate: None or by facility/distributor, if desired.<br />
Purpose: Insecticide-treaded bed nets are an inexpensive <strong>and</strong> effective way to reduce malaria transmission.<br />
Calculating the number of bed nets distributed is an important part of assessing the capacity<br />
of malaria prevention programs.<br />
Data Sources: Service statistics.<br />
Time frame: Monthly, quarterly.<br />
Data Collection Considerations: Distribution data are sometimes collected at the warehouse<br />
level <strong>and</strong> sometimes collected at the distributor level. There is a need to be clear about the level of the<br />
data. Distributor level data is preferred over warehouse level.<br />
Strengths & Limitations: Distribution data are much easier to collect than actual use of bed nets.<br />
However, this indicator does not measure use of bed nets or access to bed nets by groups that need<br />
them. This indicator will not estimate the proportion of bed nets distributed or used in a region; neither<br />
will it estimate distribution in relation to need, which varies from season to season <strong>and</strong> among population<br />
groups (i.e., infants <strong>and</strong> pregnant women). If data are collected at the warehouse level, then the<br />
indicator only measures the distribution to distributors, not to the target population.<br />
62<br />
Part Three: Indicators
3<br />
number<br />
of packets of oral rehydration salts distributed<br />
Level of Measurement: Output.<br />
Definition: This involves the number of oral rehydration salts (ORS) packets distributed by the project<br />
over a given period. ORS contain a balanced mixture of glucose <strong>and</strong> electrolytes to prevent <strong>and</strong> treat<br />
dehydration, potassium depletion, <strong>and</strong> base deficit due to diarrhea. When ORS packets are dissolved in<br />
water, the mixture is called an oral rehydration solution.<br />
Disaggregate: None; or if desired, by facility/distributor.<br />
<strong>Health</strong><br />
Purpose: Diarrhea is a principal cause of morbidity <strong>and</strong> mortality among children in developing countries.<br />
Diarrhea is defined as three or more loose or watery stools during a 24-hour period.<br />
Data Sources: Service statistics.<br />
Time frame: Monthly, quarterly.<br />
Data Collection Considerations: In some cases, a homemade mixture similar to packaged<br />
ORS may be used by households <strong>for</strong> oral rehydration therapy. Use of the homemade mixture would not<br />
be included in this indicator as it is not a product that the project has distributed to clients. Use of the<br />
packet does not measure whether the ORS was used with safe water.<br />
Strengths & Limitations: This indicator can measure the capacity of regional diarrhea-control<br />
programs <strong>and</strong> the number of ORS packets provided to a region but does not measure use of or access to<br />
ORS. The indicator will not estimate the proportion of packets distributed in relation to the population<br />
or in relation to the needs of the region.<br />
A <strong>Guide</strong> <strong>for</strong> <strong>Monitoring</strong> <strong>and</strong> <strong>Evaluating</strong> <strong>Population</strong>-<strong>Health</strong>-Environment Programs 63
4<br />
number<br />
of safe water storage vessels distributed<br />
Level of Measurement: Output.<br />
Definition: This measures the number of safe water storage vessels distributed in a region over a given<br />
period. Safe storage vessels should either have a narrow neck <strong>and</strong> be covered, or they should store<br />
water where household members can not serve themselves directly (such as roof tanks or cisterns).<br />
<strong>Health</strong><br />
Disaggregate: By facility/distributor, if desired.<br />
Purpose: Water must be stored safely to avoid contamination <strong>and</strong> the spread of infection. Some households<br />
may not have access to containers or vessels to store water where it can be free from dirt or other<br />
contamination.<br />
Data Sources: Service statistics.<br />
Time frame: Monthly, quarterly.<br />
Data Collection Considerations: It is useful to identify storage containers from which water<br />
is removed by dipping, which are not considered to be adequate <strong>for</strong> safe water storage. Dipping introduces<br />
objects (such as a ladle, cup, or dipper), <strong>and</strong> often h<strong>and</strong>s that hold these objects, into stored<br />
water, thereby negating the benefits of a cover.<br />
Strengths & Limitations: This indicator can be used to measure the capacity of safe water distribution<br />
ef<strong>for</strong>ts cheaply, as well as the number of water storage vessels provided to a region. However,<br />
people must have access to safe water to begin with <strong>for</strong> safe water storage vessels to have any impact;<br />
water safety also depends on proper use <strong>and</strong> knowledge, which this indicator does not measure. This<br />
indicator does not estimate the proportion of storage vessels distributed in relation to the population.<br />
64<br />
Part Three: Indicators
5<br />
percent<br />
of pregnant women receiving at least two doses of<br />
tetanus toxoid vaccine<br />
Level of Measurement: Outcome.<br />
Definition: A newborn’s protection against neonatal tetanus is determined by the mother. To protect<br />
newborns, women previously not immunized should receive two doses of TT or Td vaccine during their<br />
first pregnancy <strong>and</strong> one dose of TT or Td during each subsequent pregnancy up to a maximum of<br />
five doses. Td provides identical tetanus protection to TT <strong>and</strong> provides protection against diphtheria<br />
as well.<br />
<strong>Health</strong><br />
Calculation<br />
# of pregnant women who have received two or more doses of TT or Td vaccines<br />
total # of live births<br />
x 100<br />
Disaggregate: By facility or target area, if desired.<br />
Purpose: Neonatal tetanus is responsible <strong>for</strong> 14% of all neonatal deaths in the developing world. A<br />
child is considered fully protected if her/his mother has had at least two TT or Td doses within the past<br />
three years or has had five lifetime TT or Td doses.<br />
Data Sources: <strong>Population</strong>-based surveys or service statistics.<br />
Time frame: Annually using service statistics; every two to five years using a population-based survey.<br />
Data Collection Considerations: When using service statistics to calculate this indicator, the<br />
reference period is usually the previous 12 months, with the total number of doses given as the numerator<br />
<strong>and</strong> the total number of live births in the previous 12 months used as the denominator. When<br />
collecting this indicator using a population-based survey, the numerator is the number of women<br />
giving birth during a reference period (e.g., three years) who report receiving at least two doses of<br />
tetanus toxoid vaccine <strong>and</strong> the denominator is the number of live births in the same reference period.<br />
The number of live births serves as a proxy <strong>for</strong> the number of pregnant women.<br />
Where data on the number of live births are unavailable, evaluators can estimate the total number of<br />
live births using census data. Total expected births equal the area’s population times the crude birth<br />
rate. In settings where the crude birth rate is unknown, WHO recommends estimating the number of<br />
pregnant women as 3.5% of the total population (population x 0.035).<br />
A <strong>Guide</strong> <strong>for</strong> <strong>Monitoring</strong> <strong>and</strong> <strong>Evaluating</strong> <strong>Population</strong>-<strong>Health</strong>-Environment Programs 65
Strengths & Limitations: This indicator allows routine reporting to monitor TT coverage. Mothers<br />
who have not received two or more doses can be vaccinated immediately to protect their pregnancies<br />
<strong>and</strong> future children. However, pregnant women may have received two TT doses yet not be fully<br />
protected.<br />
<strong>Health</strong><br />
Table 8 – WHO-Recommended Tetanus Toxoid Immunization Schedule<br />
<strong>for</strong> Women of Childbearing Age <strong>and</strong> Pregnant Women without<br />
Previous Exposure to TT, Td, or DTP<br />
Dose of TT, Td, or<br />
DTP<br />
TT 1<br />
TT 2<br />
TT3<br />
TT 4<br />
TT 5<br />
Given Level of protection Duration of<br />
Protection<br />
At first contact or as None<br />
None<br />
early as possible in<br />
pregnancy<br />
At least four weeks 80% 1-3 years<br />
after TT 1<br />
At least 6 months after 95% At least 5 years<br />
TT 2 or during subsequent<br />
pregnancy<br />
At least one year after 99% At least 10 years<br />
TT 3 or during subsequent<br />
pregnancy<br />
At least one year after<br />
TT 4 or during subsequent<br />
pregnancy<br />
99% For all child-bearing<br />
years <strong>and</strong> possibly<br />
longer<br />
66<br />
Part Three: Indicators
6<br />
percent<br />
of children aged 12-23 months fully immunized be<strong>for</strong>e<br />
12 months<br />
Level of Measurement: Outcome.<br />
Definition: This measures the percent of children aged 12-23 months who have received three doses<br />
of oral polio vaccine, three doses of DTP, <strong>and</strong> one dose each of bacille Calmetter-Guérin <strong>and</strong> measles<br />
vaccines be<strong>for</strong>e 12 months (the definition of “fully immunized” may change as new <strong>and</strong> underutilized<br />
vaccines are introduced).<br />
Calculation<br />
# of children age 12-23 months fully vaccinated be<strong>for</strong>e the age of 12 months<br />
total # of children age 12-23 months surveyed<br />
x 100<br />
<strong>Health</strong><br />
Disaggregate: None.<br />
Purpose: This indicator measures how well a country or region delivers recommended vaccines during<br />
children’s first year of life. It also measures public dem<strong>and</strong> <strong>and</strong> perceived quality of services.<br />
Data Sources: <strong>Population</strong>-based surveys.<br />
Time frame: Every two to five years.<br />
Data Collection Considerations: Ideally, data are taken from a child’s vaccination card. If the<br />
mother cannot produce a card, she is asked about her child’s vaccinations. The source of data should be<br />
noted <strong>for</strong> each child surveyed.<br />
Strengths & Limitations: This indicator helps measure progress toward reducing morbidity <strong>and</strong><br />
mortality due to six common vaccine-preventable diseases. This indicator does not differentiate between<br />
a child that has received most but not all vaccinations <strong>and</strong> a child who has received none at all,<br />
<strong>and</strong> neither does it indicate whether doses were given at proper intervals or ages. Data sources <strong>for</strong> this<br />
indicator are not always reliable. The current definition of “fully immunized” is subject to change within<br />
a region <strong>and</strong> over time.<br />
A <strong>Guide</strong> <strong>for</strong> <strong>Monitoring</strong> <strong>and</strong> <strong>Evaluating</strong> <strong>Population</strong>-<strong>Health</strong>-Environment Programs 67
<strong>Health</strong><br />
Table 9 – <strong>Monitoring</strong> Immunization Programs<br />
This table provides a logic model <strong>for</strong> common elements of vaccination programs.<br />
Inputs Vaccines, refrigerators, temperature charts, vaccination cards, needles, syringes, etc.<br />
Process Training, supervision, service delivery, surveillance<br />
Outputs Functional Outputs<br />
Immunization sessions held, education sessions held, health workers trained in EPI<br />
Service outputs<br />
Client satisfaction, client services<br />
Outcomes Increased coverage, reduced drop-out, increased parents’ knowledge of when to<br />
return<br />
Impact Reduced disease incidence, lower infant <strong>and</strong> child mortality<br />
68<br />
Part Three: Indicators
7<br />
percent<br />
of households with access to an improved source of<br />
drinking water<br />
Level of Measurement: Output.<br />
Definition: This measures the percent of households with access to one of the following types of water<br />
supply <strong>for</strong> drinking: piped water into dwelling or yard; public tap; bore hole/pump; protected well;<br />
protected spring; rain water. “Unimproved” water sources include an unprotected dug well or spring,<br />
surface water (river, dam, lake, pond, stream, canal, <strong>and</strong> irrigation channel), water truck, <strong>and</strong> any other<br />
type of mobile supply.<br />
<strong>Health</strong><br />
Different definitions of “access” limit the usefulness of this indicator <strong>for</strong> cross-national comparisons. This<br />
indicator is mainly useful <strong>for</strong> indicating whether the available water source is improved or unimproved.<br />
While the household may access the water source, access could still be limited because of the time it<br />
may take to get water <strong>and</strong>/or the water source’s seasonal availability.<br />
Calculation<br />
# of households with access to an improved source of drinking water<br />
total # of households surveyed<br />
x 100<br />
Disaggregate: Target area (if necessary).<br />
Purpose: Lack of clean water <strong>for</strong> drinking <strong>and</strong> sanitation greatly increases disease transmission through<br />
contact with feces. This indicator is an approximation of access to safe water <strong>and</strong> an indirect indicator<br />
of water use. The closer a water source is to a family, the more water it tends to use.<br />
Data Sources: <strong>Population</strong>-based surveys.<br />
Time frame: Every two to five years.<br />
Data Collection Considerations: In<strong>for</strong>mation on the household’s main source of drinking water<br />
can be obtained verbally from heads of households or from interviewer observation. Interviewers<br />
should be familiar with different types of water supply. If bottled water is mentioned as the main<br />
source of drinking water, a second source of water <strong>for</strong> cooking <strong>and</strong> hygiene should also be recorded.<br />
The water source may differ according to season, <strong>and</strong> access during a dry season should be recorded.<br />
Distinguishing between protected water sources that are “improved” <strong>and</strong> those that are “unimproved” is<br />
a challenge. Protected dug wells are covered <strong>and</strong> have raised linings or casings <strong>and</strong> plat<strong>for</strong>ms to divert<br />
spilled water. Protected springs have boxes to protect the spring from runoff <strong>and</strong> other contamination.<br />
Both of these sources may be considered improved or unimproved, depending upon circumstances.<br />
A <strong>Guide</strong> <strong>for</strong> <strong>Monitoring</strong> <strong>and</strong> <strong>Evaluating</strong> <strong>Population</strong>-<strong>Health</strong>-Environment Programs 69
Strengths & Limitations: Data to calculate this indicator are easily collected; families <strong>and</strong> individuals<br />
use <strong>and</strong> drink most of their water at home. Specific, simple definitions <strong>for</strong> an “improved water<br />
source” increase the chances of getting precise, accurate in<strong>for</strong>mation from interviews. However, water<br />
from an improved source may still be unsafe if it is contaminated or used without proper hygiene<br />
practices, <strong>and</strong> this indicator does not address these issues of water quality. Water may be effectively<br />
treated even if taken from an unsafe source. Water usage may differ substantially within <strong>and</strong> outside<br />
of the household.<br />
<strong>Health</strong><br />
70<br />
Part Three: Indicators
8<br />
time<br />
spent by household members to collect water<br />
Level of measurement: Output<br />
Definition: This measures the time household members spent in the last 24 hours collecting water<br />
from one of the following safe sources: piped water, public taps, bore hole/pump, protected wells, protected<br />
springs, or rain water. Time should be collected in minutes, even if the time is over one hour (e.g.,<br />
75 minutes), <strong>and</strong> should be measured on a daily basis. It is the amount of time spent, rather than the<br />
distance, that is of interest — the water source could be reached by foot, car, or bicycle. This indicator<br />
should include time spent waiting in line, filling containers, <strong>and</strong> per<strong>for</strong>ming other collection activities<br />
— the “time spent” measure should be the sum total of all activities related to water collection.<br />
<strong>Health</strong><br />
Disaggregate: None.<br />
Purpose: In households without an improved water source at home, the ef<strong>for</strong>t required to obtain water<br />
can be a significant drain on already strained time <strong>and</strong> resources. This indicator allows an estimate of<br />
this ef<strong>for</strong>t <strong>and</strong> can be used to prioritize where ef<strong>for</strong>ts to improve water access should be focused.<br />
Data Sources: <strong>Population</strong>-based surveys.<br />
Time frame: Every two to five years.<br />
Data collection considerations: In<strong>for</strong>mation can be obtained verbally from heads of households<br />
<strong>and</strong> <strong>for</strong> each household member. Time collecting water needs to be summed across household<br />
members to obtain the total time spent collecting water by a household. Typically presented as the<br />
average time households spend collecting water at the population level.<br />
Strengths & Limitations: This indicator also measures economic status. Having respondents answer<br />
about their most recent experience lowers the likelihood that respondents will give inaccurate<br />
estimates. Data <strong>for</strong> this indicator are easily collected. However, the average time needed to collect water<br />
may vary substantially from year to year or season to season. Also, this indicator does not measure<br />
whether the source water is safe to drink.<br />
A <strong>Guide</strong> <strong>for</strong> <strong>Monitoring</strong> <strong>and</strong> <strong>Evaluating</strong> <strong>Population</strong>-<strong>Health</strong>-Environment Programs 71
9<br />
percent<br />
of households using an improved toilet facility<br />
Level of Measurement: Outcome.<br />
<strong>Health</strong><br />
Definition: An “improved” toilet facility means a flush/pour-flush toilet connected to a piped sewer<br />
system, septic tank, or pit; a ventilated-improved-pit latrine; simple pit latrine with slab that can be<br />
cleaned; or a composting toilet. An “unimproved” toilet facility includes flush/pour-flush toilets that<br />
empty elsewhere without connection to piped sewage systems, septic tanks, pits, or have unknown<br />
drainage; pit latrines without slabs or open pits; bucket latrines (where excreta are manually removed);<br />
hanging toilets/latrines; open defecation in field or bush or into plastic bags (flying toilets); <strong>and</strong> any<br />
other type of defecation.<br />
Calculation<br />
# of households that have working improved toilet facilities within their compounds<br />
total # of surveyed households<br />
x 100<br />
Disaggregate: None.<br />
Purpose: Access to a functioning <strong>and</strong> improved toilet facility is essential <strong>for</strong> improving a household’s<br />
hygienic situation. This indicator measures access to such facilities.<br />
Data Sources: <strong>Population</strong>-based surveys.<br />
Time frame: Every two to five years.<br />
Data Collection Considerations: Household heads or caretakers should be interviewed about<br />
the type of toilet facility they use; afterwards interviewers should observe the facility to see if it is accessible.<br />
Strengths & Limitations: This indicator does not measure whether toilet facilities are used or<br />
whether they are hygienic.<br />
72<br />
Part Three: Indicators
10<br />
percent of households using soap in last 24 hours<br />
Level of Measurement: Outcome.<br />
Definition: This indicator measures the percent of households where soap is used on a regular basis.<br />
Use of soap at the most critical times (after defecation <strong>and</strong> be<strong>for</strong>e cooking or eating) <strong>for</strong> h<strong>and</strong> washing<br />
can decrease the risk of diarrheal disease. Although ash, s<strong>and</strong>, <strong>and</strong> mud are mentioned in the literature<br />
as local alternatives, neither their acceptability as a cleansing agent nor their actual use on a significant<br />
scale has been established. The use of soap <strong>for</strong> washing h<strong>and</strong>s is commonly promoted through publicprivate<br />
partnerships.<br />
<strong>Health</strong><br />
Calculation<br />
# of households reporting washing h<strong>and</strong>s<br />
with soap be<strong>for</strong>e cooking/eating <strong>and</strong> after defecation over the past 24 hours<br />
total # of households surveyed<br />
x 100<br />
Disaggregate: None.<br />
Purpose: Washing h<strong>and</strong>s with soap is essential to controlling diarrheal diseases. This indicator represents<br />
actual behavior, not knowledge. Washing h<strong>and</strong>s with soap at two critical times is suggested<br />
as a minimum but programs may choose to set higher targets if more frequent h<strong>and</strong> washing seems<br />
achievable.<br />
Data Sources: <strong>Population</strong>-based surveys.<br />
Time frame: Every two to five years.<br />
Data Collection Considerations: Alternatively, the interviewer can observe h<strong>and</strong>-washing<br />
facilities <strong>and</strong> techniques but this would not measure soap use, only the availability of h<strong>and</strong>-washing<br />
supplies. The household respondent (often the caregiver of the youngest child) is asked about their<br />
use of soap in the last 24 hours to reduce recall bias. It is important to also ask whether the household<br />
has soap.<br />
Strengths & Limitations: This indicator is easily collected, <strong>and</strong> observation allows <strong>for</strong> a reliable<br />
assessment of available conditions. However, this indicator does not necessarily measure proper water<br />
storage, h<strong>and</strong> washing techniques, or how often h<strong>and</strong>s are washed on a regular basis.<br />
A <strong>Guide</strong> <strong>for</strong> <strong>Monitoring</strong> <strong>and</strong> <strong>Evaluating</strong> <strong>Population</strong>-<strong>Health</strong>-Environment Programs 73
11<br />
percent of households storing drinking water safely<br />
Level of Measurement: Outcome.<br />
<strong>Health</strong><br />
Definition: Storing drinking water safely means that the water should not be contaminated by exposure<br />
to dust or dirt. Safe containers should be tightly covered <strong>and</strong> narrow-necked. “Tightly covered”<br />
containers have a screw-top lid or a plate-like cover that completely covers the water storage container<br />
<strong>and</strong> fits tightly. “Narrow-necked” means containers have a neck of 3 cm or less in diameter. Additional<br />
water should be stored in cisterns or roof tanks.<br />
Calculation<br />
# households storing drinking water safely<br />
total # of surveyed households storing drinking water<br />
x 100<br />
Disaggregate: None.<br />
Purpose: Water will not remain safe from contaminants unless it is properly stored. Narrow necks <strong>and</strong><br />
tight lids keep dirt <strong>and</strong> dust out of water; cisterns <strong>and</strong> roof tanks are considered safe because they do<br />
not allow individual family members to serve themselves directly by introducing a cup, ladle, or other<br />
device into the water source.<br />
Data Sources: <strong>Population</strong>-based surveys.<br />
Time frame: Every two to five years.<br />
Data Collection Considerations: The interviewer <strong>for</strong> the household survey should ask how<br />
the household stores its water <strong>and</strong> then examine the container to ascertain if it is narrow-necked <strong>and</strong><br />
covered. A household is counted <strong>for</strong> the numerator if it meets all criteria <strong>for</strong> proper water storage. Roof<br />
tanks <strong>and</strong> cisterns are not usually observed, but are considered safe because they generally do not<br />
allow individuals to serve themselves directly. Only households that store drinking water are included<br />
in the denominator.<br />
Strengths & Limitations: Data <strong>for</strong> this indicator are simple to collect.<br />
74<br />
Part Three: Indicators
12<br />
percent of children under five years who slept under an<br />
insecticide-treated bed net the previous night<br />
Level of Measurement: Outcome.<br />
Definition: Insecticide-treated bed nets (ITN) have been dipped in an insecticide effective against<br />
local malaria-causing mosquitoes.<br />
Calculation<br />
# of children under five who slept under an ITN the previous night<br />
total # of children under five surveyed<br />
x 100<br />
<strong>Health</strong><br />
Disaggregate: None.<br />
Purpose: This indicator measures malaria prevention in a region. The Roll Back Malaria initiative has<br />
identified the use of insecticide-treated bed nets as one of the four main interventions to reduce malaria<br />
in Africa.<br />
Data Sources: <strong>Population</strong>-based surveys.<br />
Time frame: Every two to five years.<br />
Data Collection Considerations: Mosquito prevalence varies seasonally, so when evaluating<br />
trends in this indicator, consider the time of year the surveys were conducted to clarify whether<br />
estimates reflect levels during the peak or low malarial season. Data on ITNs are usually collected by<br />
asking women aged 15-49 in the household possessing bed nets about the use of bed nets by all of<br />
their children under five years old. Respondents are then asked whether the bed net under which the<br />
child (children) slept has ever been treated with insecticide to repel mosquitoes or bugs. The next<br />
question can ask how long ago the bed net was treated.<br />
Strengths & Limitations: This indicator easily <strong>and</strong> quickly measures an important area of malaria<br />
prevention. The “last night” condition helps to reduce recall bias. However, this indicator assumes that<br />
nets were properly used <strong>and</strong> maintained, <strong>and</strong> use <strong>and</strong> need vary depending on the season.<br />
A <strong>Guide</strong> <strong>for</strong> <strong>Monitoring</strong> <strong>and</strong> <strong>Evaluating</strong> <strong>Population</strong>-<strong>Health</strong>-Environment Programs 75
13<br />
oral rehydration therapy use rate<br />
Level of Measurement: Outcome.<br />
<strong>Health</strong><br />
Definition: The oral rehydration therapy (ORT) rate is the percent of children under five (0-59 months)<br />
with diarrhea (three or more loose or watery stools during a 24-hour period) in the last two weeks who<br />
were treated with fluid using ORS <strong>and</strong>/or recommended home fluids (RHF). ORS is a specific packet of<br />
dry powder that is mixed with water to make oral rehydration fluids. RHF are a specific group of liquids<br />
<strong>and</strong>/or foods recommended <strong>for</strong> treatment of diarrhea by a national health program or health professional.<br />
The specific liquids <strong>and</strong> foods approved <strong>for</strong> RHF vary from country to country.<br />
Calculation<br />
# of children under<br />
five with diarrhea in the last two weeks who were treated with ORS <strong>and</strong>/or RHF<br />
total # of children under five surveyed who had diarrhea in the last two weeks<br />
x 100<br />
Disaggregate: None<br />
Purpose: The basic principal of home management of diarrhea using ORT is to reduce dehydration by<br />
increasing fluid intake, including usage of ORS <strong>and</strong>/or RHF. Increases in the use of ORT are associated<br />
with marked falls in the annual number of deaths attributable to diarrhea in children under five years.<br />
Data Sources: <strong>Population</strong>-based surveys.<br />
Time frame: Every two to five years.<br />
Data Collection Considerations: To ascertain this in<strong>for</strong>mation, caretakers of children under<br />
five years old with an episode of diarrhea in the last two weeks are asked whether the child was<br />
treated with ORS <strong>and</strong>/or RHF. Although measuring ORS <strong>and</strong> RHF utilization is frequently used to measure<br />
ORT use <strong>for</strong> diarrhea in children, the definition of ORT has changed over time. The definitions of:<br />
1) treatment with ORS; 2) treatment with ORS <strong>and</strong>/or RHF; 3) treatment increased with fluids; <strong>and</strong> 4)<br />
treatment with increased fluids combined with continuous feeding (same or increased food) <strong>for</strong> the<br />
affected child. Because the definition of this indicator has changed over time, care should be taken to<br />
be consistent in the numerator <strong>and</strong> denominator of this calculation.<br />
76<br />
Part Three: Indicators
Strengths <strong>and</strong> Limitations: The indicator is easy to measure, <strong>and</strong> the two-week period reduces<br />
problems with recall. However, the indicator does not capture timely treatment of diarrhea. It also does<br />
not measure the severity of the illness, whether safe water was used to mix ORS, continuous feeding<br />
practices, or whether ORT was administered correctly.<br />
<strong>Health</strong><br />
A <strong>Guide</strong> <strong>for</strong> <strong>Monitoring</strong> <strong>and</strong> <strong>Evaluating</strong> <strong>Population</strong>-<strong>Health</strong>-Environment Programs 77
Environment Indicators: Natural Resource Management,<br />
Species Preservation, Income-Generation Activities<br />
The environment indicators in this section focus both on system health<br />
(“species abundance <strong>and</strong> distribution”) <strong>and</strong> measuring healthy, sustainable<br />
interactions between communities <strong>and</strong> their environments (“area under<br />
improved management”). While this section includes environmental<br />
outcomes, it also includes indicators that measure inputs, processes, <strong>and</strong><br />
outputs. Environment indicator topics include habitat status, improved<br />
practices/management, natural resource management committees, <strong>and</strong><br />
en<strong>for</strong>cement of environment protection laws. The environment indicators<br />
best suited <strong>for</strong> individual PHE or environment programs will depend on<br />
program goals <strong>and</strong> resources.<br />
Environment-related work in PHE programs naturally complements ef<strong>for</strong>ts<br />
to improve governance by building capacity of local government bodies,<br />
<strong>and</strong> even communities, to manage shared resources in a sustainable<br />
manner <strong>for</strong> current <strong>and</strong> future revenue generation or livelihood purposes.<br />
More than half of the environment indicators in this guidebook are valueadded<br />
in the governance, livelihoods, <strong>and</strong>/or underserved populations sectors.<br />
Five indicators in this section are value-added <strong>for</strong> more than one area.<br />
This reflects the multi-sectoral approach of environment-related activities<br />
in PHE programs.<br />
1.<br />
2.<br />
3.<br />
4.<br />
5.<br />
6.<br />
7.<br />
Process/Outputs<br />
Table 10 – Environmental Indicators<br />
Percent of communities in target area that<br />
have developed a community-based natural<br />
resource management plan<br />
Number of officers trained in laws <strong>and</strong><br />
en<strong>for</strong>cement procedures <strong>and</strong> posted to a<br />
permanent en<strong>for</strong>cement position<br />
Hours of en<strong>for</strong>cement patrols logged<br />
Area of legally protected habitat<br />
Number of trees planted<br />
Percent of trees planted that survive<br />
Number of educational sessions on improved<br />
agricultural/marine practices<br />
Outcomes<br />
8. Percent of community-based natural resource<br />
management plans that are approved by a<br />
government authority<br />
9. Percent of farmers/fishers who adopt<br />
improved agricultural/marine practices<br />
10. Area of habitat under improved management<br />
11. Area of secondary <strong>for</strong>est regenerated<br />
12. <strong>Population</strong> structure of species<br />
13. Species richness<br />
14. Species abundance <strong>and</strong> distribution<br />
78 Part Three: Indicators
1<br />
percent<br />
of communities in target area that have developed a<br />
community-based natural resource management plan<br />
Level of Measurement: Output.<br />
Definition: Community-based natural resource manangement (NRM) plans take place in community<br />
settings <strong>and</strong> involve community members participating in <strong>for</strong>mal discussions about the plan. Community-based<br />
NRM plans have elected members <strong>for</strong> drafting, finalizing, <strong>and</strong> implementing/en<strong>for</strong>cing<br />
the decisions set <strong>for</strong>th in the plan.<br />
An NRM plan is a written document, agreed to by an NRM committee, that proposes changes in the<br />
management of local natural resources. Examples of a plan include:<br />
• a regional l<strong>and</strong> use plan with details on the permitted yield that can be taken by area <strong>and</strong>/or<br />
volume<br />
• guidelines on permitted harvest levels, stock size, gender <strong>and</strong> age of species harvested, etc.<br />
• guidelines on seasonal quotas or restrictions in use of natural resources<br />
• a <strong>for</strong>est management plan with details on the allowable annual number of trees permitted to<br />
be cut, the minimum diameter of the trees to be cut, <strong>and</strong> the maximum number of trees to be<br />
harvested per hectare<br />
Environment<br />
Calculation<br />
# of communities in the target area that have a community-based NRM plan<br />
total # of communities in the target area<br />
x 100<br />
Disaggregate: Target area.<br />
Purpose: Community-based management integrates the ecological, social <strong>and</strong> economic dimensions<br />
of l<strong>and</strong>/marine protection management encouraging ownership <strong>and</strong> responsibility at a local level.<br />
Community involvement increases the likelihood of linking local economic development <strong>and</strong> conservation<br />
goals. This indicator measures the coverage of the project in the target area <strong>for</strong> the development<br />
of NRM plans. An implemented NRM plan should ultimately lead to better management <strong>and</strong> protection<br />
of the project’s natural area or habitat.<br />
Data Sources: Project records, secondary records (NRM plans).<br />
Time frame: Semi-annually, annually.<br />
A <strong>Guide</strong> <strong>for</strong> <strong>Monitoring</strong> <strong>and</strong> <strong>Evaluating</strong> <strong>Population</strong>-<strong>Health</strong>-Environment Programs 79
Data Collection Considerations: Communities should be asked about completed plans, plans<br />
currently in development, <strong>and</strong> plans proposed <strong>for</strong> the future. The plan is not counted toward this indicator<br />
until it is considered completed.<br />
Strengths & Limitations: This indicator is easy to collect with readily-available data. However, a<br />
community-based NRM is not easy to conduct <strong>and</strong> takes time <strong>and</strong> resources. Development of a plan<br />
does not mean it will be implemented or implemented effectively.<br />
Environment<br />
80<br />
Part Three: Indicators
2<br />
number<br />
of officers trained in laws <strong>and</strong> en<strong>for</strong>cement<br />
procedures <strong>and</strong> posted to a permanent en<strong>for</strong>cement position<br />
Level of Measurement: Process/Output.<br />
Definition: This indicator is defined as the total number of new <strong>and</strong> in-service officers trained in laws<br />
<strong>and</strong> en<strong>for</strong>cment procedures <strong>and</strong> posted within a 12-month period.<br />
An en<strong>for</strong>cement officer is someone who protects a habitat <strong>and</strong> its resources by participating in law<br />
en<strong>for</strong>cement activities. The officer could be participating in a community-based en<strong>for</strong>cement program<br />
<strong>and</strong> need not be affiliated with an official park or police service. Duties may include protecting habitat<br />
integrity; preventing illegal logging, fishing, hunting/poaching, wildlife trade or resource extraction;<br />
preventing pollution; preventing physical encroachments on protected l<strong>and</strong>s; <strong>and</strong> fining <strong>and</strong> prosecuting<br />
violators.<br />
“Officially trained” means that the officer has been trained to local st<strong>and</strong>ards <strong>and</strong>, when it is the norm<br />
in a region, has the full legal right <strong>and</strong> capacity to act in the position of a government-recognized<br />
en<strong>for</strong>cement officer. A “target area” is defined as the physical area legally protected where the en<strong>for</strong>cement<br />
officer will work.<br />
Environment<br />
The goal of this indicator is to measure whether new officers have been certified <strong>and</strong>/or trained be<strong>for</strong>e<br />
they receive their posting or whether permanent officers are trained in en<strong>for</strong>cement procedures.<br />
Disaggregate: New <strong>and</strong> in-service officers; target area (if desired).<br />
Purpose: En<strong>for</strong>cement activities <strong>and</strong> results measure the capacity to actually protect areas <strong>and</strong> species<br />
<strong>and</strong> to ensure that community natural resource management plans are respected. This is an indicator<br />
of the likelihood of being able to prevent illegal de<strong>for</strong>estation, hunting, <strong>and</strong> other prohibited activities<br />
by having trained officers posted in the appropriate areas.<br />
Data Sources: Project records.<br />
Time frame: Quarterly.<br />
Data Collection Considerations: The quality or length of training will vary by area. The definition<br />
of “trained” should be specifically defined to meet a local st<strong>and</strong>ard. If projects collaborate with<br />
local authorities, authorities should be contacted to verify the postings.<br />
A <strong>Guide</strong> <strong>for</strong> <strong>Monitoring</strong> <strong>and</strong> <strong>Evaluating</strong> <strong>Population</strong>-<strong>Health</strong>-Environment Programs 81
Strengths & Limitations: The number of trained officers may be an indication of improved commitment<br />
at a local, regional, or national level to en<strong>for</strong>ce laws regarding the protection of animals <strong>and</strong><br />
natural resources. However, this indicator does not take into account how many hours per week the<br />
officers work, the amount of corruption <strong>and</strong> violence in the region, <strong>and</strong> how likely it is that the officers<br />
are committed, or even able, to do their job safely. The overall amount of en<strong>for</strong>cement funding <strong>and</strong><br />
the amount <strong>and</strong> quality of available equipment will also determine what en<strong>for</strong>cement officers can<br />
achieve. This indicator neither measures the quality of training nor takes into account the turnover rate<br />
(i.e., how many officers are leaving or quitting per year compared to how many officers are retained<br />
or newly added).<br />
Environment<br />
82<br />
Part Three: Indicators
3<br />
hours<br />
of en<strong>for</strong>cement patrols logged<br />
Level of Measurement: Output.<br />
Definition: Hours of en<strong>for</strong>cement patrols logged is defined as the total number of cumulative hours<br />
that all officers are out in the field participating in en<strong>for</strong>cement activities in a given period. En<strong>for</strong>cement<br />
activities while on patrol may include routine monitoring of the target area, specific site inspections<br />
<strong>for</strong> suspected violations, writing up warnings <strong>and</strong> infractions <strong>for</strong> confirmed violations, participating in<br />
the prosecution <strong>and</strong> case against violators, <strong>and</strong> confiscating illegally taken resources. “Logged” means<br />
that the officers record their patrols in an official register that they either keep with them or is held at<br />
the station.<br />
En<strong>for</strong>cement patrols can be undertaken by boat, foot, or vehicle. The amount of en<strong>for</strong>cement needed<br />
depends on the number/type of entry points into the protected area <strong>and</strong> the level of threat to the<br />
area. Thus, it may not be possible to compare en<strong>for</strong>cement between areas by using only the hours of<br />
patrols.<br />
Environment<br />
Disaggregate: Target area (if desired).<br />
Purpose: The total number of patrol hours spent in the field will be directly related to the proportion<br />
of all occurring violations that are actually discovered. Effective en<strong>for</strong>cement is essential to allow areas<br />
to reach their potential in protecting <strong>and</strong> preserving resources <strong>and</strong> species. Hours logged indicates a<br />
commitment on the part of the en<strong>for</strong>cement officers <strong>and</strong>/or their comm<strong>and</strong>ing bodies to en<strong>for</strong>ce rules<br />
<strong>and</strong> regulations.<br />
Data Sources: Secondary records (logbooks) <strong>and</strong>/or project records.<br />
Time frame: Monthly.<br />
Data Collection Considerations: The logbooks should have sections where officers can record<br />
the date, hours spent on patrol, exactly when the patrol hours occurred (e.g., daytime or evening), the<br />
exact portion of the target area they were working in, total distance covered (using GPS data when<br />
possible) <strong>and</strong> the exact nature of their job <strong>for</strong> that day (i.e., if they were primarily involved in an antilogging<br />
patrol, a sea-patrol, or a general patrol <strong>for</strong> any type of violation). These log books or <strong>for</strong>ms<br />
should be st<strong>and</strong>ardized <strong>for</strong> all officers so that the same data points are collected <strong>and</strong> can be easily<br />
accumulated at the end of each month.<br />
A <strong>Guide</strong> <strong>for</strong> <strong>Monitoring</strong> <strong>and</strong> <strong>Evaluating</strong> <strong>Population</strong>-<strong>Health</strong>-Environment Programs 83
Strengths & Limitations: Data are easy to collect, assuming that there is a logbook <strong>for</strong> en<strong>for</strong>cement<br />
officers to record their activities. This is a reflection of the actual ef<strong>for</strong>t in the field. However, the<br />
recorded time spent on patrol does not necessarily reflect the quality of the patrol activity since quality<br />
may depend on many things such as the motivation <strong>and</strong> resources of the officers. The terrain of an area<br />
may limit en<strong>for</strong>cement activities or the number of hours spent on patrol: if the area is mountainous or<br />
has harsh conditions, then less en<strong>for</strong>cement may occur.<br />
Environment<br />
84<br />
Part Three: Indicators
4<br />
area<br />
of legally protected habitat<br />
Level of Measurement: Output.<br />
Definition: “Legally protected” means that the area is being shielded from damage or destruction by<br />
to legal authority. Many different levels of legal protection exist, allowing <strong>for</strong> a diverse range of acceptable<br />
or prohibited activities. Examples of protected areas include marine or <strong>for</strong>est reserves, no-take<br />
zones, sanctuaries, parks, locally managed resource protected areas, strictly protected areas/nature<br />
reserves/wilderness areas, <strong>and</strong> national or state parks, among others.<br />
An “area” is defined as a geographical region with defined boundaries based on legal status. For l<strong>and</strong><br />
areas, this is measured in hectares. One hectare is 10,000 square meters. (Acres are more commonly<br />
used in the United States <strong>and</strong> Canada, 1 hectare=2.471 acres.) For marine areas: square nautical miles<br />
or square kilometers are used to measure area. (Nautical square miles are more commonly used in the<br />
United States <strong>and</strong> Canada, 1 square kilometer = 0.292 nautical square miles.)<br />
Habitat is the natural, physical home or range of wildlife species. Protected areas are difficult to develop<br />
in isolation <strong>and</strong> should not st<strong>and</strong> alone. A protected area will rarely succeed unless it is embedded in,<br />
or is so large that it makes up, an integrated ecosystem management strategy.<br />
Environment<br />
Disaggregate: By specific marine/<strong>for</strong>est reserve area.<br />
Purpose: Habitat fragmentation occurs when external disturbances cause large intact habitats to be<br />
divided into smaller units, often resulting in adverse ecological effects. Protected areas are a <strong>for</strong>m of<br />
spatial environmental management <strong>and</strong> are needed to provide areas where fish/wildlife can spawn/<br />
breed <strong>and</strong> grow to their adult size <strong>and</strong> to maintain ecosystem goods <strong>and</strong> services such as clean drinking<br />
water. They can help accelerate the recovery of already depleted populations, as well as protect healthy,<br />
intact populations of species.<br />
Protected areas may lead to direct human benefits, such as increased yield or size of fish, wildlife, or<br />
other extracted products. Overall management generally improves due to the shift in focus from single<br />
species to an ecosystem. Protected areas also provide a “control” against which to compare areas that<br />
are impacted to a greater extent by human activities <strong>and</strong> this in<strong>for</strong>mation can be used to further in<strong>for</strong>m<br />
<strong>and</strong> improve resource management.<br />
Data Sources: Secondary records (laws, natural resource management plans).<br />
Time frame: Annually.<br />
A <strong>Guide</strong> <strong>for</strong> <strong>Monitoring</strong> <strong>and</strong> <strong>Evaluating</strong> <strong>Population</strong>-<strong>Health</strong>-Environment Programs 85
Data Collection Considerations: Examination of legal documents may be sensitive in some<br />
countries. However, as this is an indicator of legally protected habitat, these data should be available<br />
from policy makers, ministries, or other government sources. Other <strong>for</strong>ms of legal documents such as<br />
contracts with local communities or local authority agreements are also sources of these data. Further<br />
sources may include <strong>for</strong>mal agreements between local, regional or national authorities with nongovernmental<br />
organizations or foundations.<br />
Strengths & Limitations: Measurement of this indicator should be relatively easy <strong>and</strong> straight<strong>for</strong>ward<br />
to obtain since the indicator is unambiguous <strong>and</strong> has been legally defined. However, progress<br />
on this indicator may be slow: changing laws <strong>and</strong> policies may occur over the course of several years.<br />
Also, protected areas only fulfill their purpose when they are actually protected, which may require<br />
significant en<strong>for</strong>cement ef<strong>for</strong>ts. Additionally, this indicator does not reflect the location of the protected<br />
area <strong>and</strong> whether it protects key species or biodiversity hot spots.<br />
Environment<br />
86<br />
Part Three: Indicators
5<br />
number<br />
of trees planted<br />
Level of Measurement: Process/Output.<br />
Definition: This indicator is a number count of the trees (plants, seeds, or saplings) planted by species.<br />
Native tree species are likely to be more tolerant of local weather, pest <strong>and</strong> soil conditions, <strong>and</strong> will be of<br />
greater benefit to wildlife than non-native trees. Non-native trees may invade other areas, crowd native<br />
vegetation, <strong>and</strong> adversely impact ecosystems. The type of tree planted <strong>and</strong> in what area depends on<br />
the specific geographic location <strong>and</strong> project <strong>and</strong> community goals.The targeted areas selected by the<br />
project <strong>for</strong> replanting/regeneration should be determined in advance <strong>and</strong> remain fixed throughout the<br />
life of the project.<br />
Disaggregate: By tree species; geographic area.<br />
Purpose: <strong>Monitoring</strong> the number <strong>and</strong> species of trees planted measures the project’s success toward<br />
longer-term results, such as increasing the area of secondary <strong>for</strong>est regenerated, <strong>and</strong> may indicate<br />
a reduction in encroachments into primary, virgin <strong>for</strong>est. Secondary <strong>for</strong>ests can provide many of the<br />
products that people traditionally obtained from primary <strong>for</strong>ests, while providing some of the environmental<br />
benefits that primary <strong>for</strong>ests offer. Trees provide other benefits to humans such as shade<br />
<strong>and</strong> energy conservation, reduced soil erosion, <strong>and</strong> wind <strong>and</strong> noise buffering, while also providing<br />
wildlife habitat. Trees that produce fruits or nuts can provide food <strong>for</strong> many species of wildlife as well<br />
as <strong>for</strong> humans. In addition, tree planting can be a community education <strong>and</strong> engagement activity that<br />
builds community awareness <strong>and</strong> appreciation <strong>for</strong> their <strong>for</strong>est resources. Lastly, increasing the natural<br />
diversity of trees will provide habitat <strong>for</strong> additional wildlife species <strong>and</strong> makes it less likely that a single<br />
pest or disease will wipe out all the trees.<br />
Environment<br />
Data Sources: Project records, transect surveys.<br />
Time frame: Quarterly, annually.<br />
Data Collection Considerations: The project should keep detailed logbooks on the numbers<br />
<strong>and</strong> species of seedlings or trees planted, the specific locations where plantings occurred, the dates of<br />
plantings, <strong>and</strong> data on climate <strong>and</strong> pest outbreaks. In addition, data should also be kept on the number<br />
of tree nurseries or woodlots in the target area <strong>and</strong> seedlings or tree survival rates after one or two<br />
years, as assessed by transect surveys.<br />
Strengths & Limitations: The number of trees planted should be readily available through project<br />
records. However, the number of trees planted is not an indication of the tree survival rate, tree diversity,<br />
or suitability <strong>for</strong> local wildlife <strong>and</strong> conditions.<br />
A <strong>Guide</strong> <strong>for</strong> <strong>Monitoring</strong> <strong>and</strong> <strong>Evaluating</strong> <strong>Population</strong>-<strong>Health</strong>-Environment Programs 87
6<br />
percent<br />
of trees planted that survive<br />
Level of Measurement: Output.<br />
Definition: The survival rate should correspond to the same geographic area as the place where the<br />
trees were planted. The defined target area is the area that is considered in need of regeneration <strong>and</strong> is<br />
predetermined by the project. “Surviving” is defined as being alive at the end of a predetermined period<br />
of time. The exact period of time will vary by species.<br />
Environment<br />
Calculation<br />
# of plants, seeds, or saplings<br />
surviving at the end of a predetermined period of time in a defined target area<br />
# of plants, seeds, or saplings planted in a defined target area<br />
Disaggregate: Tree species; target area.<br />
x 100<br />
Purpose: <strong>Monitoring</strong> the number of trees surviving measures the project’s potential to achieve the<br />
ultimate goal of increasing the area of secondary <strong>for</strong>est regenerated. Secondary <strong>for</strong>ests can provide<br />
many of the products that people traditionally obtained from primary <strong>for</strong>ests, while providing some of<br />
the environmental benefits that primary <strong>for</strong>ests offer. Trees provide other benefits to humans such as<br />
shade <strong>and</strong> energy conservation, reduced soil erosion, wind <strong>and</strong> noise buffering, while also providing<br />
wildlife habitat. Trees that produce fruits or nuts can provide food <strong>for</strong> many species of wildlife as well<br />
as <strong>for</strong> humans.<br />
This indicator is an intermediate step between planting <strong>and</strong> actual <strong>for</strong>est regeneration. This indicator<br />
is important because actual <strong>for</strong>est regeneration may take many years. During this time, this indicator<br />
can assess if plantings are effective (i.e., is the project planting suitable species, are local conditions<br />
conducive to tree survival). For example, if a project is planting a tree species that does not do well<br />
in the target location then the project will become aware of this when measuring tree survival, rather<br />
than waiting the many years needed to assess actual <strong>for</strong>est regeneration.<br />
Data Sources: Transect surveys, project records.<br />
Time frame: Annually.<br />
Data Collection Considerations: As described in the previous indicator, the project should be<br />
keeping detailed logbooks on the numbers <strong>and</strong> species of seedlings or trees planted, the specific locations<br />
where planting was done, the dates of planting, as well as data on climate, pest outbreaks, illegal<br />
88<br />
Part Three: Indicators
logging, <strong>and</strong> fires. When choosing which types of trees to plant, in<strong>for</strong>mation on the rate of growth <strong>and</strong><br />
time needed to reach a tree’s full height <strong>and</strong> growth will determine how often this indicator should be<br />
assessed.<br />
Data collection methods will depend on the size of the target area. For small areas, transects done on<br />
foot may be possible to assess the number of surviving trees. For large areas, it may be necessary to<br />
do field surveys by vehicle over larger areas or to measure survival only in r<strong>and</strong>omly selected plots <strong>and</strong><br />
then extrapolate results to the total target area. Plot sampling is where a specific plot or quadrant is<br />
identified <strong>and</strong> studied.<br />
Strengths & Limitations: If the project has kept careful records <strong>and</strong> is working in a small area,<br />
this indicator should be simple <strong>and</strong> inexpensive to collect. However, the tree survival rate doesn’t account<br />
<strong>for</strong> tree diversity or suitability <strong>for</strong> local wildlife. The number of surviving trees may be affected<br />
by factors outside the control of the project, including weather conditions, disease outbreaks, insect or<br />
animal pests, illegal logging, fires, human uses of the <strong>for</strong>est, etc. The number of surviving trees may<br />
also be affected by things under the project’s control such as the suitability of the chosen species to the<br />
local climate <strong>and</strong> conditions, the time of year when planting was done, <strong>and</strong> the quality <strong>and</strong> storage of<br />
the initial plants, seeds, or seedlings.<br />
Environment<br />
A <strong>Guide</strong> <strong>for</strong> <strong>Monitoring</strong> <strong>and</strong> <strong>Evaluating</strong> <strong>Population</strong>-<strong>Health</strong>-Environment Programs 89
7<br />
number<br />
of educational sessions on improved agricultural/<br />
marine practices<br />
Level of Measurement: Process/Output.<br />
Definition: This measures the total number of times the project’s community educator teaches or<br />
works with farmers or fishers on improved practices. Each <strong>for</strong>mal or in<strong>for</strong>mal visit with the farmers<br />
or fishers should be counted using predetermined criteria, i.e., length of time spent, discussion of a<br />
specific message or method, etc. An improved agricultural/marine practice is any technique that provides<br />
additional human health <strong>and</strong> environmental benefits or does less harm to human health <strong>and</strong> the<br />
environment compared to previously used techniques.<br />
Environment<br />
Examples of improved practices include: use of green manure as a fertilizer; reductions in pesticide use;<br />
implementation of agro-<strong>for</strong>estry systems; use of sustainable extractive reserves; use of less destructive<br />
aquaculture techniques, a switch to less harmful fishing equipment; or a ban on intrusive boats,<br />
etc. The type of practice introduced by the project generally depends on the geographical setting <strong>and</strong><br />
pre-existing practices in that setting. Introducing the improved agricultural or marine practices in the<br />
target area means there is an organized ef<strong>for</strong>t to train <strong>and</strong> teach local people about the new methods<br />
<strong>and</strong> how they can be adopted. The specific practices measured in this indicator should be determined<br />
by the project in advance.<br />
Disaggregate: Type of improved agricultural or marine practice; geographic area (if desired).<br />
Purpose: Improved agricultural/marine practices are especially important where large areas are under<br />
human use <strong>and</strong> cannot remain in, or return to, a natural state. Such practices can increase the yield of<br />
products, generate additional income, protect wildlife, <strong>and</strong> prevent soil erosion <strong>and</strong> water pollution.<br />
Human health can also benefit as the result of increased crop yields, more food, better nutrition, increased<br />
income <strong>and</strong> money available to spend on family well-being, <strong>and</strong> reduced chemical exposures<br />
among farm families/workers.<br />
Data Sources: Project records.<br />
Time frame: Monthly or quarterly.<br />
Data Collection Considerations: The project’s community educator should have a logbook<br />
where this in<strong>for</strong>mation is recorded <strong>and</strong> reported monthly to the project manager. For each visit, the<br />
log book should include the date, location, type of practice introduced or message relayed, length of<br />
time of the visit, farmer(s)/fisher(s) targeted (names, if possible), whether permission from the farm<br />
owner has been granted, <strong>and</strong> type of agricultural/marine practice currently in use. A <strong>for</strong>m should be<br />
90<br />
Part Three: Indicators
developed that is st<strong>and</strong>ardized <strong>and</strong> used by all project community educators <strong>for</strong> easy comparison <strong>and</strong><br />
assembling of in<strong>for</strong>mation across the project. Other items of in<strong>for</strong>mation can be added to the st<strong>and</strong>ardized<br />
<strong>for</strong>m as fits the specific needs of the project.<br />
Strengths & Limitations: This indicator allows <strong>for</strong> regular monitoring of implementation of the<br />
project’s ef<strong>for</strong>ts to educate farmers/fishers <strong>and</strong> to introduce improved agricultural/marine practices<br />
into an area where destructive practices may currently be in use. In cases where the natural resource<br />
management plan of a community includes implementing improved agricultural/marine practices,<br />
this indicator is also useful in monitoring progress of ef<strong>for</strong>ts toward improved management. However,<br />
this indicator does not assess adoption or practice of new knowledge <strong>and</strong> skills. Care must be taken<br />
not to assume that a new practice is necessarily “improved.” Best practices <strong>for</strong> agricultural <strong>and</strong> marine<br />
production may vary greatly by geography <strong>and</strong> economic setting.<br />
Environment<br />
A <strong>Guide</strong> <strong>for</strong> <strong>Monitoring</strong> <strong>and</strong> <strong>Evaluating</strong> <strong>Population</strong>-<strong>Health</strong>-Environment Programs 91
8<br />
Percent<br />
of community-based natural resource management<br />
plans that are approved by a government authority<br />
Level of Measurement: Outcome.<br />
Definition: NRM is the management of all activities that use, develop, <strong>and</strong>/or conserve air, water, l<strong>and</strong>,<br />
plants, animals, <strong>and</strong> ecosystems. NRM committees are organized groups of people who meet regularly<br />
<strong>and</strong> attempt to practice natural resource management. A “government authority” is a person who works<br />
<strong>for</strong> the government <strong>and</strong> has the power to make legal decisions. “Approved” means the plan has been<br />
officially adopted as having the effect of law — it is en<strong>for</strong>ceable.<br />
Environment<br />
Calculation<br />
# of government-approved community-based NRM plans<br />
# of community-based NRM plans finished <strong>and</strong> submitted<br />
to a government authority <strong>for</strong> approval<br />
x 100<br />
Disaggregate: None.<br />
Purpose: Community control at the local level can result in more sustainable environmental management<br />
where locals are likely to benefit from their choice of l<strong>and</strong> or natural resource use. Often natural<br />
resources are owned <strong>and</strong>/or controlled by the state or commercial interests, even when local or indigenous<br />
people have occupied a territory <strong>for</strong> many years or generations. When local communities have the<br />
legal right to manage local resources, they begin to value resources leading to ongoing conservation.<br />
Data Sources: Secondary records.<br />
Time frame: Annually.<br />
Data Collection Considerations: Examining secondary records such as legal documents may<br />
be sensitive in some countries. The project should work with the locally-based NRM committee <strong>and</strong><br />
government authorities to receive documentation <strong>for</strong> this indicator.<br />
Strengths & Limitations: Measurements should be relatively easy <strong>and</strong> straight-<strong>for</strong>ward to obtain<br />
since the indicator is unambiguous <strong>and</strong> has been legally defined. However, changing laws <strong>and</strong> policies<br />
can be a slow process that may occur over the course of several years, requiring ongoing monitoring.<br />
Although a community-based NRM plan may not have been approved by a government authority, it<br />
may still be in the process of being implemented by the community. This indicator does not reflect<br />
whether there is improved management on a local level.<br />
92<br />
Part Three: Indicators
9<br />
Percent<br />
of farmers/fishers who adopt improved agricultural/<br />
marine practices<br />
Level of Measurement: Outcome.<br />
Definition: This indicator measures actual use of improved agricultural or marine practices that the<br />
project has introduced. “Adopt” means practicing or using the improved practices. A “farmer” refers<br />
to any person who works on or owns a farm. A “fisher” refers to any person who catches fish or other<br />
marine species <strong>for</strong> human consumption.<br />
Calculation<br />
total # of farmers/fishers using improved practices<br />
x 100<br />
total # of farmers/fishers targeted <strong>for</strong> improved practice adoption<br />
Disaggregate: By type of improved agricultural/marine practice; if desired, by target area .<br />
Environment<br />
Purpose: <strong>Monitoring</strong> only the educational sessions held or the practices introduced is not an indication<br />
of whether the practice has been adopted. This indicator will assist the project in better measuring the<br />
outcome of its ef<strong>for</strong>ts to introduce improved agricultural/marine practices.<br />
Data Sources: <strong>Population</strong>-based survey of farmers/fishers; project records; direct observation <strong>for</strong><br />
project records.<br />
Time frame: Annually or corresponding with agricultural or marine harvesting cycles. Every two to five<br />
years <strong>for</strong> surveys.<br />
Data Collection Considerations: Data collection strategies <strong>and</strong> the survey will need to be<br />
altered <strong>for</strong> specific types of farming/fishing such as fruit, vegetable, grain, meat, dairy, fish, seafood,<br />
or other. To reduce recall bias, data collection may need to occur several times a year to coincide with<br />
cropping/fishing cycles.<br />
Surveys should include such in<strong>for</strong>mation as date, position of the person providing the in<strong>for</strong>mation<br />
(e.g., farm owner, farm worker, fisher, etc), types <strong>and</strong> extent of use of previous practices, types <strong>and</strong><br />
extent of use of current practices, types <strong>and</strong> extent of use of practices being considered <strong>for</strong> the future,<br />
type of farming/fishing <strong>and</strong> size of the operation (e.g., total area of farm or area fished or the number<br />
of farm/fishing employees). Questions <strong>for</strong> this section should be adapted <strong>for</strong> the specific type of farming<br />
or fishing, <strong>and</strong> whether the improved practice introduced by the project has been used just once,<br />
consistently, exclusively, or over the long-term (with specific time frame specified).<br />
A <strong>Guide</strong> <strong>for</strong> <strong>Monitoring</strong> <strong>and</strong> <strong>Evaluating</strong> <strong>Population</strong>-<strong>Health</strong>-Environment Programs 93
Determining the total number of farmers or fishers living or working in the defined target area may<br />
be straight-<strong>for</strong>ward <strong>for</strong> small, well-known areas but may be considerably more difficult <strong>for</strong> large, dispersed<br />
target areas. Use of an improved practice should be monitored over time (e.g., yearly) to see if<br />
farmers/fishers are simply trying out improved practices or if they are more permanently switching to<br />
the improved practices over time.<br />
Strengths & Limitations: This indicator measures the percentage of farmers/fishers who adopt<br />
improved practices, yet the decision of what agricultural practices to use <strong>for</strong> a large area may be controlled<br />
by just one farmer if he owns the l<strong>and</strong> being worked. In this case, measuring the farms that<br />
adopt improved agricultural practices may be more useful. Similarly, a fisher working <strong>for</strong> a large commercial<br />
establishment might not be able to make independent decisions on resource practices.<br />
Environment<br />
94<br />
Part Three: Indicators
10<br />
area of habitat under improved management<br />
Level of Measurement: Outcome.<br />
Definition: “Improved management” means that the community is implementing a communitybased<br />
natural resource management plan <strong>for</strong> the area. To qualify <strong>for</strong> this indicator, community plans<br />
can be at any stage of completion but should currently be underway. This could mean that natural resources<br />
were not previously managed, or that existing management has been improved or exp<strong>and</strong>ed.<br />
“Habitat “ is defined as the geographical region with defined boundaries that is targeted <strong>for</strong> improved<br />
management. Boundaries may be based on legal, locally recognized, cultural, political, or geographic<br />
factors.<br />
The area measured is the total area covered (e.g., cumulative hectare total from year to year) by the<br />
implemented plan per community, municipality or key biologically important ecosystem or region,<br />
whether marine or <strong>for</strong>est habitat. For l<strong>and</strong> habitats, area should be measured in hectares. One hectare<br />
is 10,000 square meters. (Acres are more commonly used in the United States <strong>and</strong> Canada; 1 hectare=2.471<br />
acres.) For marine habitats, area should be measured in square nautical miles or square kilometers<br />
(nautical miles are more commonly used in the United States. <strong>and</strong> Canada; 1 square kilometer<br />
= 0.292 nautical square miles).<br />
Environment<br />
Examples of activities in improved management plans include <strong>for</strong>est regeneration from tree planting;<br />
coral reef regeneration <strong>and</strong> protection; selective logging plans; maintaining habitat in a way that<br />
prevents soil erosion, preserves water resources, protects against natural hazards or maintains other<br />
key ecosystem functions; leaving designated areas <strong>for</strong> conservation; utilization of <strong>for</strong>est tree genetic<br />
resources <strong>and</strong> seed production; leaving designated areas <strong>for</strong> wildlife species; <strong>and</strong> protection of key<br />
marine breeding waters <strong>and</strong> beaches.<br />
Disaggregate: Geographic area covered by NRM plan (if desired).<br />
Purpose: Improved <strong>for</strong>est or marine habitat management leads to a healthier environment <strong>and</strong> positively<br />
affects the species that depend on the environment. Areas must be managed to balance both<br />
immediate human needs <strong>and</strong> long-term environmental health. Increasing the area of improved management<br />
or establishing new areas under improved management is an indication of project outcomelevel<br />
success.<br />
Data Sources: Secondary records (NRM plan), transect survey, key in<strong>for</strong>mant interviews, mapping.<br />
Time frame: Annually.<br />
A <strong>Guide</strong> <strong>for</strong> <strong>Monitoring</strong> <strong>and</strong> <strong>Evaluating</strong> <strong>Population</strong>-<strong>Health</strong>-Environment Programs 95
Data Collection Considerations: Clearly defining “improved management” based on the criteria<br />
of the specific project <strong>and</strong> its interventions is integral to the meaningfulness of this indicator. The<br />
habitat measured should be defined in advance as the target area of the project <strong>and</strong> the change in l<strong>and</strong><br />
or marine area under improved management is tracked over time.<br />
In some cases the total area of the target region may already be known (e.g., <strong>for</strong> a national park). In<br />
other cases, the area of the target region may need to be measured via walk-through, by plane or boat<br />
to measure the distances.<br />
The existence of a management plan does not count toward this indicator. Although the existence of<br />
a plan could be a first step toward improved management, it does not indicate that the plan is being<br />
implemented. Implementation can be measured by the regular monitoring of habitat <strong>and</strong> species conditions,<br />
or en<strong>for</strong>cement mechanisms put in place to implement rules <strong>and</strong> regulations, <strong>for</strong> example.<br />
Environment<br />
Strengths & Limitations: Demonstrating improved habitat management can indicate implementation<br />
of community-based approaches to development of natural resource management plans.<br />
However, determining “improved management” can be subjective. Natural resource management plans<br />
may vary greatly in quality, implementation, supervision, <strong>and</strong> en<strong>for</strong>cement. Moreover, measuring the<br />
physical area of a region under community management may be time consuming <strong>and</strong> difficult.<br />
96<br />
Part Three: Indicators
11<br />
Area of secondary <strong>for</strong>est regenerated<br />
Level of Measurement: Outcome.<br />
Definition: This involves the total area (in hectares) of regenerated, secondary <strong>for</strong>est. Secondary <strong>for</strong>est<br />
is <strong>for</strong>est that has previously been logged or destroyed. Regeneration is defined as any re-growth or<br />
renewal of <strong>for</strong>ests or st<strong>and</strong>s of trees by natural (being left alone) or artificial (via, seed, sapling, or tree<br />
planting) means after a temporary condition reduced the primary <strong>for</strong>est to less than 10% canopy cover.<br />
An area of <strong>for</strong>est regeneration is defined as the geographic region with defined boundaries where trees<br />
were planted or where the area was left undisturbed <strong>for</strong> regeneration purposes. Boundaries may be<br />
based on legal, locally recognized, cultural, or geographic factors (e.g., a mountain range or a river).<br />
Disaggregate: Type of <strong>for</strong>est (if desired), target area.<br />
Purpose: Secondary <strong>for</strong>est provides refuge to a diversity of species by providing food <strong>and</strong> refuge. Conservation<br />
of secondary <strong>for</strong>ests may be an effective investment in future wildlife diversity since species<br />
recover relatively rapidly in secondary <strong>for</strong>ests. L<strong>and</strong>-use practices based on secondary <strong>for</strong>ests play a<br />
critical role in sustainable management <strong>and</strong> biodiversity conservation. Humans may also benefit from<br />
less soil erosion, improved watershed protection, less pollution from run-off, <strong>and</strong> increased income<br />
opportunities related to <strong>for</strong>est tree products such as fruits or latex.<br />
Environment<br />
Data Sources: Transect survey, plot sampling, mapping, project records.<br />
Time frame: Annually.<br />
Data Collection Considerations: When measuring what percent of the total target region was<br />
regenerated, it may be necessary to also do walk-throughs, drive the perimeters, or fly over the area<br />
to measure the distances. Physical surveys should use repeated transects with sample areas chosen<br />
r<strong>and</strong>omly if all areas will not be measured. Plot sampling, where a specific plot or quadrant is identified<br />
<strong>and</strong> studied, can also be completed.<br />
Strengths & Limitations: Some measurements, such as the number of trees replanted <strong>and</strong> the<br />
total amount of l<strong>and</strong> replanted should be readily available. However, this indicator does not measure<br />
the usefulness/appropriateness of the regenerated <strong>for</strong>est. It may not be a productive <strong>for</strong>est <strong>and</strong> it may<br />
not support much biodiversity if the right mix of species is not planted. External factors such as climate<br />
conditions can affect this indicator.<br />
A <strong>Guide</strong> <strong>for</strong> <strong>Monitoring</strong> <strong>and</strong> <strong>Evaluating</strong> <strong>Population</strong>-<strong>Health</strong>-Environment Programs 97
12<br />
population structure of species<br />
Level of Measurement: Outcome.<br />
Definition: Species monitoring should include assessments of species’ population structure (e.g.,<br />
breeding, mortality, or age-structure), taking into account spatial <strong>and</strong> temporal changes. The most appropriate<br />
indicators <strong>for</strong> monitoring species’ population structure will vary depending on the threats to<br />
the local species of interest <strong>and</strong> the life-stage the threat is most likely to impact. When baseline knowledge<br />
is sufficient <strong>and</strong> the main local threats are fully known, the most effective monitoring should<br />
focus on the life-stage most affected by the threat. A combination of short- <strong>and</strong> long-term (e.g., nest<br />
monitoring over time, change in the proportion of occupied territories) indicators are needed.<br />
Environment<br />
<strong>Population</strong> structure measures will vary depending on the species. Specific measures may include<br />
things such as den or nest occupancy rates during the breeding season; territory occupancy <strong>and</strong> reoccupancy<br />
rates; nesting status; number of eggs in nest, average number of offspring produced per<br />
territory size in hectares; fledgling or cub survival; sex-ratios of offspring; ratio of pre-adults to adults;<br />
<strong>and</strong> age-specific survival, number of adults in population, etc. All of these would need to be measured<br />
repeatedly over time.<br />
Disaggregate: Type of species; target area (if desired).<br />
Purpose: Changes in wildlife health may serve as early warnings <strong>for</strong> factors that can also affect human<br />
health. Reproductive health is especially sensitive to threats (e.g., pollutants, lack of sufficient food or<br />
water, changes in predator dynamics, etc) <strong>and</strong> thus measuring reproductive health of species can serve<br />
as an early warning of potential problems. Species that are successfully breeding <strong>and</strong> maintaining their<br />
numbers are an ecological indicator of ecosystem health. The number of breeding species is generally<br />
related to the available area of l<strong>and</strong>. Thus, these indicators serve as measurable surrogates <strong>for</strong> the<br />
health of the environment.<br />
<strong>Population</strong> structure <strong>and</strong> reproductive health/behavior may be susceptible to changes in a particular<br />
environmental stressor or reductions in a key resource. Species monitoring can detect ecosystem<br />
disturbance be<strong>for</strong>e it is too severe. If species are able to grow to maturity <strong>and</strong> to increase in overall<br />
numbers (richness) <strong>and</strong> abundance then this may lead to increased reproductive potential.<br />
Data Sources: Various combinations of data may be used, including:<br />
• transect surveys<br />
• existing species data<br />
• qualitative interviews with community<br />
• catch <strong>and</strong> release (e.g., to measure offspring sex ratios)<br />
98<br />
Part Three: Indicators
• radio/satellite-tracking of species (e.g., to identify where dens or nests are)<br />
• observation (nests, dens, other breeding sites, stationary viewing towers)<br />
Time frame: Every two or three years.<br />
Data Collection Considerations: Occupancy <strong>and</strong> nesting/breeding status may be measured<br />
by visiting <strong>and</strong> looking into nests, dens, or other known breeding sites each year. Trained observers<br />
would record signs of breeding (e.g., nest building) or signs of reproductive activity. <strong>Population</strong>-wide<br />
marking or telemetry may also be used (e.g., affixing transmitting collars to selected species), however<br />
this is expensive <strong>and</strong> is usually only done <strong>for</strong> large, charismatic <strong>and</strong> endangered species. Great care<br />
must be taken to avoid disturbing species, to avoid altering their normal behavior or driving them away<br />
from a particular location.<br />
New methods may need to be developed, especially <strong>for</strong> species that have not previously been monitored.<br />
It may be necessary to monitor a species <strong>for</strong> at least two years to determine whether changes<br />
are related to human activities.<br />
Strengths & Limitations: Data collection <strong>for</strong> these indicators has the potential to be very expensive<br />
<strong>and</strong> impractical. It may be possible to use existing data if some organizations are already tracking<br />
the health of key endangered wildlife. Species monitoring may be difficult, costly, time-intensive,<br />
<strong>and</strong> requires expertise. Detectable changes in some indicators (e.g., body size) may lag far behind the<br />
threat, such as habitat degradation. There is the risk that the indicator may detect threats too late, e.g.,<br />
when habitat has become too degraded to support viable populations.<br />
Environment<br />
A <strong>Guide</strong> <strong>for</strong> <strong>Monitoring</strong> <strong>and</strong> <strong>Evaluating</strong> <strong>Population</strong>-<strong>Health</strong>-Environment Programs 99
13<br />
species richness<br />
Level of Measurement: Outcome.<br />
Definition: This indicator measures the total number of species found during surveys in a defined area.<br />
The species chosen <strong>for</strong> measurement in this indicator will be project- <strong>and</strong> site-specific.<br />
Environment<br />
Species richness is the single most important component of species diversity. Despite the conclusions<br />
of many ecologists that species richness by itself is inadequate as a measure of species diversity, many<br />
programs use species richness as the only measure of species diversity. Species monitoring should<br />
include data collection on the total number of selected species in a defined target area, taking into<br />
account temporal changes.<br />
Calculation<br />
# of different species identified in a target area<br />
total target area<br />
x 100<br />
Disaggregate: Type of species.<br />
Purpose: Changes in the numbers of species may serve as early warnings <strong>for</strong> factors that can also affect<br />
human health. Species that are successfully maintaining their numbers are an ecological indicator of<br />
ecosystem health. L<strong>and</strong>-use change, climate change, <strong>and</strong> human activities such as fishing or hunting<br />
may affect the number of species in a region. Habitat conversion or fragmentation may lead to declines<br />
in the total number of species in a region or in certain species in particular.<br />
Data Sources: Transect survey.<br />
Time frame: Every two or three years.<br />
Data Collection Considerations: The best representative umbrella species are those that have<br />
the largest area requirements <strong>and</strong> the most diverse habitat requirements. These are species that may<br />
serve to protect many others with smaller ranges. A selection of species with different habitat requirements<br />
should be chosen <strong>for</strong> monitoring including seed dispersers, seed predators, food chain<br />
predators, <strong>and</strong> pollinators that affect local ecosystem structure, productivity, <strong>and</strong> resilience. It is important<br />
not to choose species <strong>for</strong> monitoring that are relatively scarce <strong>and</strong> have large geographic ranges<br />
because environmental changes affecting one habitat type or location are less likely to influence the<br />
total number of these species.<br />
100<br />
Part Three: Indicators
Strengths & Limitations: Species richness is often a good surrogate <strong>for</strong> other measures of biodiversity<br />
that are more difficult to measure directly. Species identification is usually straight<strong>for</strong>ward,<br />
except in some less-studied regions where baseline knowledge is inadequate. Species richness is related<br />
to not only the health of wildlife <strong>and</strong> the ecosystem but also to income-generation opportunities<br />
such as ecotourism.<br />
However, accurate estimation of total numbers of species may be difficult, costly, time-intensive, <strong>and</strong><br />
require expertise. Few st<strong>and</strong>ard data may initially be available <strong>for</strong> baseline comparisons. Methodologies<br />
<strong>for</strong> species monitoring may need to be newly developed <strong>for</strong> some species. Measuring species<br />
richness requires surveys of large sample sizes in order to achieve valid results. Large-scale species<br />
monitoring is usually expensive <strong>and</strong> difficult to implement <strong>and</strong> maintain. However, monitoring fewer,<br />
selected species usually costs less <strong>and</strong> is easier to implement <strong>and</strong> maintain.<br />
Environment<br />
A <strong>Guide</strong> <strong>for</strong> <strong>Monitoring</strong> <strong>and</strong> <strong>Evaluating</strong> <strong>Population</strong>-<strong>Health</strong>-Environment Programs 101
14<br />
Species abundance <strong>and</strong> distribution<br />
Level of Measurement: Outcome.<br />
Definition: Species abundance is a reflection of the total number of an individual species in a defined<br />
geographic area. Species abundance is the average number of a specific species found in a given area<br />
(e.g., per hectare, square kilometer, square mile, etc..); this is an indication of how common a given<br />
species is. The distribution of an individual species is defined as the geographic or spatial area within<br />
which that species can be found. Within any area, the spatial distribution of a particular species may be<br />
clustered in one location or may be more evenly distributed throughout the area.<br />
Environment<br />
Species’ abundance <strong>and</strong> distribution are key components of species diversity. When the pattern of diversity<br />
in protected areas or target areas is described only by the total number of different species<br />
(richness), the relative population size <strong>and</strong> geographic range can be missed (i.e., whether species are<br />
relatively rare or common). There<strong>for</strong>e, a more comprehensive species monitoring ef<strong>for</strong>t should include<br />
data collection on the number of selected species in a defined target area as well as mapping of the<br />
species’ geographic distribution, taking into account temporal changes such as seasonal or breeding<br />
patterns. Selection of the most appropriate species <strong>for</strong> monitoring abundance <strong>and</strong> distribution will vary<br />
depending on the species populations <strong>and</strong> local threats.<br />
Calculation<br />
# of individuals of a specific species identified in a survey of the target area<br />
total target area surveyed<br />
x 100<br />
Disaggregate: Type of species, type of targeted area.<br />
Purpose: Preserving species diversity is critical to ecosystem health <strong>and</strong> function including energy fixation,<br />
chemical cycling, soil maintenance, ground water purification <strong>and</strong> access to clean drinking water,<br />
protection against flooding, <strong>and</strong> maintenance of healthy populations of pollinators. <strong>Monitoring</strong> species<br />
abundance <strong>and</strong> locations can provide early warning of changes in conditions that may negatively<br />
impact biodiversity overall <strong>and</strong> may pinpoint critical areas <strong>and</strong> species to focus on.<br />
Large wildlife species are often the most affected by human activities because they have large habitat<br />
<strong>and</strong> nutritional requirements, are seldom found in high densities, <strong>and</strong> have relatively low reproductive<br />
rates. The goal is to maintain or increase species abundance of prominent groups of species within natural<br />
variation. Collecting data on trends in abundance may help guide project management decisions.<br />
Data Sources: Transect survey, mapping, secondary records (existing species data).<br />
102<br />
Part Three: Indicators
Time frame: Every two or three years.<br />
Data Collection Considerations: This indicator may be easiest to measure in national parks or<br />
other defined areas, or in confined or small areas. Exact methodology will vary greatly depending on<br />
the species that are being surveyed <strong>and</strong> the terrain. Ideally, samples should be collected using a variety<br />
of methods <strong>and</strong> should span a diversity of habitats, species, <strong>and</strong> seasons. Great care must be taken to<br />
avoid disturbing species, to avoid altering their normal behavior <strong>and</strong> activities or driving them away<br />
from a particular location.<br />
New methods may need to be developed, especially <strong>for</strong> species that have not previously been monitored.<br />
<strong>Monitoring</strong> of species over at least two years is thought necessary to determine whether change<br />
in abundance is related to human activities. A decrease in abundance or reduction in distribution observed<br />
along with a decrease in the average body size may indicate that the species is being overharvested.<br />
Strengths & Limitations: Identification of species is usually straight<strong>for</strong>ward, except in some lessstudied<br />
regions where baseline knowledge is inadequate. Species abundance <strong>and</strong> distribution is related<br />
to not only the health of wildlife <strong>and</strong> the ecosystem but also to income-generation opportunities,<br />
such as tourism. However, accurate estimation of species abundance <strong>and</strong> distribution may be difficult,<br />
costly, <strong>and</strong> time-intensive, <strong>and</strong> it requires expertise. Detectable changes (e.g., changes in distribution)<br />
may lag far behind the threat, such as habitat degradation. There is the risk that the indicator may allow<br />
detection of threats only once it is too late, e.g., a <strong>for</strong>mer habitat has become too degraded to support<br />
viable populations.<br />
Environment<br />
A <strong>Guide</strong> <strong>for</strong> <strong>Monitoring</strong> <strong>and</strong> <strong>Evaluating</strong> <strong>Population</strong>-<strong>Health</strong>-Environment Programs 103
Integration Indicators: Partnerships <strong>and</strong> Communication<br />
Recent assessments of integrated PHE programs in the Philippines have<br />
found that integrated programs have several advantages over st<strong>and</strong>-alone<br />
population, child health, or environment programs. The assessments found<br />
that integrated programs were cost-effective compared to the cost of single-sector<br />
population, child health <strong>and</strong> safety, or environment programs.<br />
Integrated programs also recruited a greater number of men to family<br />
planning ef<strong>for</strong>ts <strong>and</strong> a greater number of women <strong>and</strong> adolescents to environment/conservation<br />
ef<strong>for</strong>ts. Integrated programs also improved the<br />
perceived value of family planning ef<strong>for</strong>ts by packaging them with health<br />
interventions.<br />
One of the main long-term goals of integrated PHE programs is to ensure<br />
local ownership <strong>and</strong> sustainability. There<strong>for</strong>e, the outcome indicator “number<br />
of enabling local ordinances/policies/strategies/doctrines supporting<br />
PHE” is included in this section. Short-term outcome indicators in this<br />
section measure local PHE awareness (“number of policy-makers, media,<br />
<strong>and</strong> scholars knowledgeable about or aware of a specific PHE issue”), or<br />
the diversification of PHE ef<strong>for</strong>ts.<br />
Process indicators in this section measure linkages between materials<br />
(“number of linked messages/materials created”) <strong>and</strong> partnerships that increase<br />
integration (“number of new PHE partnerships created that make<br />
linkages among organizations or institutions from different sectors”). Output<br />
indicators in this section measure PHE promotion/education ef<strong>for</strong>ts<br />
(“number <strong>and</strong> frequency of PHE educational sessions provided in the target<br />
community”).<br />
While any of the indicators in this section may be valuable <strong>for</strong> the M&E<br />
of integrated programs, programs that have a focused nature or that face<br />
limited budgets may concentrate on measuring a few indicators that best<br />
fit their needs.<br />
104 Part Three: Indicators
1.<br />
2.<br />
3.<br />
4.<br />
5.<br />
Table 11 – Integration Indicators<br />
Process/Outputs<br />
Program-Based<br />
Outcomes/Impacts<br />
<strong>Population</strong>-Based<br />
Number of linked messages/materials created 6. Number of policy-makers, media, <strong>and</strong><br />
Instances of population, health, or environ- scholars knowledgeable about or aware of a<br />
ment organizations addressing non-traditional<br />
specific PHE issue<br />
audiences<br />
7. Percent of households knowledgeable about<br />
Number <strong>and</strong> frequency of PHE educational or aware of a specific PHE issue<br />
sessions provided in the target community 8. Percent of communities in target/project area<br />
Number of new PHE partnerships created<br />
receiving all three PHE elements<br />
that make linkages among organizations or 9. Number of enabling local ordinances/policies<br />
institutions from different sectors<br />
supporting PHE<br />
Instances of organizations facilitating access 10. Number of placements of linked PHE<br />
to services outside of their traditional sectors messages in print <strong>and</strong> electronic media by<br />
independent sources<br />
A <strong>Guide</strong> <strong>for</strong> <strong>Monitoring</strong> <strong>and</strong> <strong>Evaluating</strong> <strong>Population</strong>-<strong>Health</strong>-Environment Programs 105
1<br />
Number<br />
of linked messages/materials created<br />
Level of Measurement: Process.<br />
Definition: Each new communication material, such as an advertisement, video, or educational book,<br />
counts as a “created” message. Materials that demonstrate <strong>and</strong> educate about the linkages between<br />
population, health, <strong>and</strong> environment are considered linked messages.<br />
Disaggregate: None.<br />
Purpose: PHE programs often create messages to communicate the linkages between populationhealth-environment.<br />
This indicator is meant to capture the creation of those messages that are crosssectoral<br />
<strong>and</strong> are meant to communicate the interdependence of human health <strong>and</strong> the natural environment.<br />
Data Sources: Project records.<br />
Integration<br />
Time frame: Quarterly.<br />
Data Collection Considerations: Determining whether the message is linked could be subjective.<br />
The central criteria should be that the message examines a linkage between better human<br />
health <strong>and</strong> environmental quality.<br />
Strengths & Limitations: The creation of linked messages is simple <strong>and</strong> straight<strong>for</strong>ward to collect.<br />
However, this indicator does not give in<strong>for</strong>mation about whether the linked messages were adopted,<br />
disseminated, or where they appeared. The indicator does not show whether the messages were clear<br />
<strong>and</strong> of high quality; or whether they reached the target audiences.<br />
106<br />
Part Three: Indicators
2<br />
instances<br />
of population, health, or environment<br />
organizations addressing non-traditional audiences<br />
Level of Measurement: Process.<br />
Definition: This includes meetings, publications, coalitions, conferences, brochures, etc. Instances<br />
should be listed <strong>and</strong> described according to which PHE sector addressed a different sector or sectors,<br />
<strong>and</strong> on what topics (i.e., sector-specific or integration). Non-traditional audience means an audience<br />
that is in another sector from the one in which the addressee typically works.<br />
Disaggregate: None.<br />
Purpose: Measuring this indicator will capture the instances where sectors attempt to communicate<br />
outside of their traditional audiences. The cross-sectoral education ef<strong>for</strong>t is important to building links<br />
between health <strong>and</strong> environment practitioners.<br />
Data Sources: Project records, secondary records.<br />
Time frame: Semi-annually, annually.<br />
Data Collection Considerations: Using clearly defined terms in advance can reduce bias in<br />
collecting this indicator. When those addressing the audience work in a multi-sectoral setting or when<br />
the audience is multi-sectoral, this indicator may not give significant in<strong>for</strong>mation. Its goal is to collect<br />
in<strong>for</strong>mation about audiences being addressed by organizations that have not traditionally worked in<br />
a multi-sectoral setting.<br />
Integration<br />
Strengths & Limitations: This is only a measure of the number of instances that the program<br />
or project addresses non-traditional audiences. This indicator does not give in<strong>for</strong>mation on the topics<br />
covered. It is easy to collect as long as project records have a systematic <strong>for</strong>m of recording the instances<br />
in which the program or project is involved.<br />
A <strong>Guide</strong> <strong>for</strong> <strong>Monitoring</strong> <strong>and</strong> <strong>Evaluating</strong> <strong>Population</strong>-<strong>Health</strong>-Environment Programs 107
3<br />
Number<br />
<strong>and</strong> frequency of PHE educational sessions provided in<br />
the target community<br />
Level of Measurement: Output.<br />
Definition: This is a number count of the educational sessions provided by a project on specific PHE<br />
issues that the project chooses in advance. Educational sessions counted here should be on topics related<br />
to integration of population, health, <strong>and</strong> environment rather than educational sessions provided<br />
on specific <strong>and</strong> single-sector topics. These sessions could occur in any context such as presentations<br />
to local officials, a community theater presentation, or a more traditional setting such as a group that<br />
regularly meets or as part of a community educator’s typical work schedule. The critical part of this<br />
measurement is that the session is on PHE or linkages, as this indicator does not measure single-sector<br />
presentations or educational sessions. The project should define in advance which PHE issues will be<br />
addressed in the community <strong>and</strong> measure educational sessions on the pre-determined topics central<br />
to the project’s goals.<br />
Disaggregate: Target area (if desired).<br />
Integration<br />
Purpose: This captures the extent to which the project is educating the target population on the links<br />
between humans <strong>and</strong> the environment. While measuring knowledge or behavior provides outcome<br />
in<strong>for</strong>mation, measuring the number of sessions provided measures the progress made by the project<br />
in educating the community.<br />
Data Sources: Project records.<br />
Time frame: Monthly, quarterly.<br />
Data Collection Considerations: Educational sessions counted in this indicator may differ in<br />
methodology. Sessions may include community visits carried out, outreach home visits made, educational<br />
talks held, educational or communication programs with integrated approaches, video presentations,<br />
etc.<br />
Strengths & Limitations: This indicator is easy to collect with good project record-keeping; however<br />
it does not give an indication of whether the target audience received the message or of their<br />
underst<strong>and</strong>ing <strong>and</strong> acceptance of the linked message.<br />
108<br />
Part Three: Indicators
4<br />
Number<br />
of new PHE partnerships created that make linkages<br />
among organizations or institutions from different sectors<br />
Level of Measurement: Process.<br />
Definition: “New partnerships” are groups of organizations, either public or private, that have b<strong>and</strong>ed<br />
together to advance PHE policies or practices. The partnership is usually <strong>for</strong>med around the implementation<br />
of joint activities related to integration either through service provision in a community of environment<br />
<strong>and</strong> health related needs or through exp<strong>and</strong>ing knowledge of the links between population,<br />
health, <strong>and</strong> the environment. “Different sectors” means that at least two organizations represented in<br />
the partnership are from different technical sectors (population, health, or environment). This instance<br />
should be counted toward the <strong>for</strong>mation of the partnership rather than individual instances of collaboration.<br />
There<strong>for</strong>e, this indicator is only counted once <strong>for</strong> each partnership. The terms of the partnership<br />
should be defined carefully be<strong>for</strong>e this indicator can be useful. A partnership is a <strong>for</strong>mal arrangement<br />
either between organizations, whether governmental or nongovernmental, but should include a charter,<br />
mission, memor<strong>and</strong>um of underst<strong>and</strong>ing, <strong>and</strong> clear guidelines as to how the partners will work<br />
together to achieve the goals of the partnership.<br />
Disaggregate: None.<br />
Purpose: Creating new partnerships is what drives new <strong>and</strong> innovative linkages <strong>and</strong> programs. There<br />
is usually a long time investment in creating the terms <strong>and</strong> conditions of the partnership. A <strong>for</strong>mal<br />
partnership is generally necessary <strong>for</strong> the implementation of integrated activities except in cases where<br />
the organization is <strong>for</strong>med with an integrated mission. This indicator is meant to capture those partnerships<br />
between organizations from different <strong>and</strong> singular technical sectors that are <strong>for</strong>med with the<br />
purpose of discussing or implementing PHE.<br />
Integration<br />
Data Sources: Secondary records.<br />
Time frame: Annually.<br />
Data Collection Considerations: Care should be taken in deciding whether a group of organizations<br />
has reached the level of creating a partnership. This measure should only count toward<br />
<strong>for</strong>mal partnerships that have written charters <strong>and</strong> missions. There are many organizations that may<br />
collaborate on certain issues or topics but may not have <strong>for</strong>med a <strong>for</strong>mal partnership.<br />
Strengths & Limitations: This does not measure the level of success of the partnership or how<br />
long the partnership lasts. It does give an easy measurement of whether new <strong>and</strong> <strong>for</strong>mal partnerships<br />
are made among varying sectors <strong>and</strong> <strong>for</strong> the purpose of integrated work.<br />
A <strong>Guide</strong> <strong>for</strong> <strong>Monitoring</strong> <strong>and</strong> <strong>Evaluating</strong> <strong>Population</strong>-<strong>Health</strong>-Environment Programs 109
5<br />
Instances<br />
of organizations facilitating access to services<br />
outside of their traditional sectors<br />
Level of Measurement: Output.<br />
Definition: This indicator is targeting PHE project implementation models where an organization that<br />
traditionally works in one sector (i.e., population, health, or environment) is either working with an<br />
organization of a different sector or directly implementing services traditionally provided by a different<br />
sector. When one organization facilitates access to a service outside of its traditional sector, it is accepting<br />
or promoting an integrated approach to responding to community needs.<br />
Disaggregate: None.<br />
Purpose: The provision of health services is a new technical area <strong>for</strong> most employees of conservation<br />
organizations, <strong>and</strong> working with conservation organizations to provide health services is new to public<br />
health organizations. This indicator aims to capture instances where organizations implement a specific<br />
activity or group of activities outside their traditional sectors.<br />
Integration<br />
Data Sources: Project records, secondary records.<br />
Time frame: Annually.<br />
Data Collection Considerations: Some organizations already provide services across sectors<br />
as part of their mission or established programs. The goal of this indicator is to capture those organizations<br />
that make new or increased ef<strong>for</strong>ts to facilitate access to other sector services to communities<br />
outside of the longst<strong>and</strong>ing tradition of their organization. This instance may be a single event or may<br />
be described once but comprising multiple activities/events in the context of a larger ef<strong>for</strong>t.<br />
Strengths & Limitations: This indicator does not measure the quality of the facilitation of services<br />
but it is an indication of the ef<strong>for</strong>t of organizations to participate in multi-sectoral or integrated<br />
projects.<br />
110<br />
Part Three: Indicators
6<br />
Number<br />
of policy-makers, media, <strong>and</strong> scholars knowledgeable<br />
about or aware of a specific PHE issue<br />
Level of Measurement: Outcome.<br />
Definition: This is a number count of policy-makers, media members, <strong>and</strong> scholars knowledgeable<br />
about or aware of a specific PHE issue. The issue should be chosen by the project in advance <strong>and</strong> at<br />
the beginning of project implementation <strong>for</strong> tracking over the life of the project. This issue should be<br />
very specifically defined to avoid error in counting whether an influential person has knowledge or<br />
awareness. Choosing a broad <strong>and</strong> over-arching topic (i.e., the connection between family planning<br />
<strong>and</strong> environment) is not useful in counting this indicator. Similarly, policy-makers, media, <strong>and</strong> scholars<br />
should not already be involved with or active in the PHE issue selected by the project. They should<br />
normally be those who are targeted <strong>and</strong> monitored by the project on the specific issue selected.<br />
Disaggregate: By issue.<br />
Purpose: Persons of interest knowledgeable about the PHE issue is an indication that the program/<br />
project’s messages reached those in power or those who are in a position of educating/impacting the<br />
public.<br />
Data Sources: Secondary sources, key in<strong>for</strong>mant interviews.<br />
Time frame: Semi-annually, annually.<br />
Integration<br />
Data Collection Considerations: Complications in collecting this indicator with accuracy arise<br />
with the definition of knowledge or awareness. Knowledge <strong>and</strong> awareness are difficult to measure<br />
objectively without the ability to per<strong>for</strong>m pre <strong>and</strong> post tests <strong>for</strong> the persons of influence. Using key<br />
in<strong>for</strong>mant interviews where targeted policy-makers, media members <strong>and</strong> scholars are interviewed<br />
about their knowledge or awareness of a PHE issue can assist in confirming in<strong>for</strong>mation <strong>for</strong> this indicator.<br />
When possible, using an interview as a baseline <strong>and</strong> then repeating the interview at a scheduled<br />
interval can provide in<strong>for</strong>mation over time about increased knowledge or committment to as specific<br />
PHE issue.<br />
Strengths & Limitations: This indicator does not give in<strong>for</strong>mation on whether the policy-makers,<br />
media, or scholars are supportive of the specific PHE issue. It also does not measure the influential<br />
person’s level of knowledge or depth of awareness of the issue.<br />
A <strong>Guide</strong> <strong>for</strong> <strong>Monitoring</strong> <strong>and</strong> <strong>Evaluating</strong> <strong>Population</strong>-<strong>Health</strong>-Environment Programs 111
7<br />
Percent<br />
of households knowledgeable about or aware of a<br />
specific PHE issue<br />
Level of Measurement: Outcome.<br />
Definition: This is a percentage of the households in the project’s target area whose residents are<br />
knowledgeable about or aware of a specific PHE issue. The issue should be chosen by the project at<br />
the beginning of project implementation <strong>for</strong> tracking over the life of the project. This issue should be<br />
very specifically defined to avoid error in counting whether the person responding <strong>for</strong> the household<br />
has knowledge or awareness. Choosing a broad <strong>and</strong> over-arching topic (i.e., the connection between<br />
family planning <strong>and</strong> environment) is not useful in counting this indicator. The households included<br />
should normally be those who are targeted <strong>and</strong> monitored by the project on the specific issue selected<br />
<strong>for</strong> this indicator to be useful in determining whether the household gained the knowledge as a result<br />
of the PHE project.<br />
Integration<br />
Calculation<br />
# of households surveyed that are knowledgeable about a specific PHE issue<br />
total # surveyed households<br />
Disaggregate: PHE issue covered in survey.<br />
x 100<br />
Purpose: Household knowledge of a specific PHE issue may be an indication of the project’s success<br />
in communicating the PHE issue or in the increasing awareness of the community to the integration<br />
between human health <strong>and</strong> the natural environment.<br />
Data Source: <strong>Population</strong>-based survey.<br />
Time frame: Every two to five years.<br />
Data Collection Considerations: The specific PHE issues should be determined in advance, remain<br />
consistent, <strong>and</strong> be monitored over time. When collecting in<strong>for</strong>mation at the household level in a<br />
population-based survey, special attention should be made not to bias results by suggesting answers.<br />
Strengths & Limitations: This indicator only measures knowledge <strong>and</strong> does not indicate behavior<br />
change or where the knowledge was acquired. The questions utilized to measure knowledge must be<br />
carefully worded <strong>and</strong> pretested to ensure accurate measurement.<br />
112<br />
Part Three: Indicators
8<br />
Percent<br />
of communities in target/project area receiving all<br />
three PHE elements<br />
Level of Measurement: Outcome.<br />
Definition: “All three PHE elements” means that the community receives at least one service from each<br />
of the population, health, <strong>and</strong> environment sectors from the same project in the same municipality or<br />
township over a defined period of time.<br />
Calculation<br />
total # of communities that receive<br />
at least one service each from the population, health, <strong>and</strong> environment sectors<br />
total # of communities where the program is implementing activities<br />
x 100<br />
Disaggregate: Target areas.<br />
Purpose: This is meant to capture those projects that are integrating aspects of the project by providing<br />
family planning, health, <strong>and</strong> conservation-related activities in one community. This encourages the<br />
community to learn about the linkages between human behavior <strong>and</strong> the environment, as well as the<br />
health of the environment as integral to human health.<br />
Data Sources: Project records.<br />
Integration<br />
Time frame: Quarterly, annually.<br />
Data Collection Considerations: The project should determine in advance which activities fall<br />
under which category (population, health, or environment). If the services <strong>and</strong> activities are provided<br />
on a regional or country level, the denominator (the total number of communities where the integrated<br />
project is working) should remain constant to provide a baseline. This means that this indicator<br />
should be measured after the project has started implementation in all of the target communities <strong>and</strong><br />
then measured over time to account <strong>for</strong> the degree to which each community is receiving all three<br />
elements.<br />
Strengths & Limitations: This indicator does not measure the quality of services provided or<br />
whether the services provided <strong>for</strong> each sector are consistent across all communities. In some cases,<br />
where there is a community-driven response <strong>for</strong> selection of activities, the ability of the project to<br />
provide at least one activity from all three sectors may be limited (according to community priorities<br />
<strong>and</strong> desires <strong>for</strong> services).<br />
A <strong>Guide</strong> <strong>for</strong> <strong>Monitoring</strong> <strong>and</strong> <strong>Evaluating</strong> <strong>Population</strong>-<strong>Health</strong>-Environment Programs 113
9<br />
Number<br />
of enabling local ordinances/policies supporting PHE<br />
Level of Measurement: Outcome.<br />
Definition: An enabling policy refers to a policy that promotes integrated municipal <strong>and</strong>/or regional<br />
plans linking human <strong>and</strong> ecosystem health. This could be on a variety of topics or technical areas<br />
involving <strong>for</strong>ests or marine ecosystems <strong>and</strong> different issues that enhance the quality of human life. The<br />
exact definition of “enabling” will differ by region, according to local ecosystem <strong>and</strong> community needs.<br />
Achieving this is a strong indication that elements in local, regional, <strong>and</strong>/or national government are<br />
supportive of PHE integration.<br />
Disaggregate: Country (if desired).<br />
Purpose: Some PHE programs work toward changing policy to improve the implementation of PHE<br />
projects. The adoption of ordinances <strong>and</strong> policies supporting PHE sometimes involve allocation of<br />
budgets from public sources <strong>for</strong> integration of services <strong>and</strong> activities.<br />
Integration<br />
Data Sources: Secondary records (laws).<br />
Time frame: Annually, or every two to three years.<br />
Data Collection Considerations: Permission may be needed to research <strong>and</strong> track laws of<br />
another country or in a local setting. Strictly adhering to a predetermined definition of what exactly<br />
is an enabling ordinance or policy is important <strong>for</strong> consistency in collecting this indicator. Ordinances<br />
<strong>and</strong> policies generally take significant ef<strong>for</strong>t <strong>and</strong> time investment <strong>and</strong> may take years to achieve. If the<br />
ordinance also requires a budget allocation, projects could track the amount of funding appropriated<br />
connected with the PHE ordinance or policy.<br />
Strengths & Limitations: While this indicator gives in<strong>for</strong>mation on increased willingness of officials<br />
to codify integration, it does not indicate whether there was a budget allotted <strong>for</strong> activities or<br />
service provision or whether any other action was taken in the community. However, most legislative<br />
processes involve long review <strong>and</strong> public debate <strong>and</strong> should be a good indication of the governmental<br />
commitment to integrating the locality/country approach to development.<br />
114<br />
Part Three: Indicators
10<br />
Number of placements of linked PHE messages in print <strong>and</strong><br />
electronic media by independent sources<br />
Level of Measurement: Outcome.<br />
Definition: Placements by independent sources include those messages on linked topics (not singlesector<br />
topics related to specific projects) that are written by parties not associated or affiliated with the<br />
project. Print <strong>and</strong> electronic media include magazines, newspapers, radio, internet Web sites, etc. Each<br />
separate article is counted as one placement even if it was placed in multiple media sources.<br />
Disaggregate: None.<br />
Purpose: When a third party publishes in<strong>for</strong>mation or takes an interest through placing messages<br />
about integration in a public setting, it is an indication that the PHE project has reached an audience.<br />
Data Sources: Secondary sources.<br />
Time frame: Semi-annually, annually.<br />
Data Collection Considerations: Tracking messages placed by independent sources may be<br />
difficult <strong>and</strong> time-consuming without a systematic approach to monitoring media sources. Identifying<br />
in advance the sources that will be followed may provide a more streamlined approach.<br />
Integration<br />
Strengths & Limitations: While this will measure the independent sources’ knowledge <strong>and</strong><br />
awareness of a specific PHE issue, it does not give in<strong>for</strong>mation about where the independent source<br />
received or learned that knowledge unless the source is quoted in the article. Also, the placement of a<br />
message does not consider whether the message was accurate or supportive of PHE.<br />
A <strong>Guide</strong> <strong>for</strong> <strong>Monitoring</strong> <strong>and</strong> <strong>Evaluating</strong> <strong>Population</strong>-<strong>Health</strong>-Environment Programs 115
Value-Added Indicators<br />
This section is designed to capture an illustrative list of indicators <strong>for</strong> measuring<br />
the value-added indicators that the PHE projects have in multiple<br />
sectors. As previously stated, value-added indicators provide in<strong>for</strong>mation<br />
about one or more groups of people or sectors that may not have been<br />
targeted in the intervention but are reached <strong>and</strong> impacted through the<br />
intervention. Another concept that goes h<strong>and</strong> in h<strong>and</strong> with value-added<br />
is that of synergy, indicating the project’s success in implementing an approach<br />
that yields outcomes beyond those anticipated <strong>for</strong> single-sector<br />
population, health, or environmental programs. Hence, population, health,<br />
<strong>and</strong> environment are also listed as value-added categories here <strong>for</strong> those<br />
indicators that reach several sectors while the intended goal may be only<br />
to reach one or the other. The concept of synergy may also exist <strong>for</strong> those<br />
indicators listed in the sector categories earlier in this guide. However,<br />
measuring the added value in those sectors as a result of an integrated<br />
approach requires operational research <strong>and</strong> complicated methodologies.<br />
PHE projects are encouraged to pursue this type of research to continue<br />
to prove the organizational efficiencies inherent in a multi-sectoral or partnering<br />
approach to development.<br />
As this list is illustrative, a few examples will be elaborated here to further<br />
clarify the concept of adding value. However, although there is a table indicating<br />
the categories that each of the indicators listed here may affect, it is<br />
the responsibility of each PHE project through its conceptual framework<br />
<strong>and</strong> specific objectives to determine which of these indicators may represent<br />
a value-added indicator in the project. It is the project’s responsibility<br />
not only to select the indicators that may add value to another sector but<br />
also to select which sectors are affected, since the connections <strong>and</strong> implications<br />
can change depending on the context of the project’s activities.<br />
One example of a value-added indicator in a PHE project is “net dollar<br />
value of socially-marketed products sold.” The PHE project may intend to<br />
increase the use of condoms by providing commodities to local merchants<br />
<strong>and</strong> providing merchants with sales training, <strong>for</strong> example. In the process<br />
of reaching the goal of increasing use of condoms, the project may also<br />
diversify the livelihood of that merchant by providing an alternative or<br />
supplementary stream of income. The diversification of livelihood <strong>for</strong> that<br />
merchant is a value-added result.<br />
Another example lies in the development of community-based natural<br />
resource management plans. While the goal of this activity <strong>for</strong> a PHE<br />
116 Part Three: Indicators
project is generally to improve management of natural resources on a community<br />
level, the skills <strong>and</strong> methods that the community learns in developing<br />
the plan are improving participation in civil society <strong>and</strong> knowledge of<br />
democratic processes. The community <strong>for</strong>ms a committee to make decisions<br />
about the use of their l<strong>and</strong> <strong>and</strong> elects officials to head the committee<br />
through which they are learning about democratic election procedures <strong>and</strong><br />
majority consensus-building. These are skills imparted to the community<br />
that go above <strong>and</strong> beyond the protection <strong>and</strong>/or improved management of<br />
their natural resources. There<strong>for</strong>e, indicators related to the functioning of<br />
the natural resource management committee are governance value-added.<br />
The implication <strong>for</strong> women <strong>and</strong> youth participating in these committees<br />
adds another dimension of value-added related to gender equality <strong>and</strong><br />
youth empowerment.<br />
An example of an indicator that adds value in one sector as a result of work<br />
targeted at another sector is “number of children who show improvement<br />
on growth chart.” Many PHE projects work with communities to reduce<br />
practices that are detrimental to the environment. Some of the new or<br />
improved practices introduced by the PHE project will increase yields of<br />
crops/fish already used by the community or provide opportunities <strong>for</strong> new<br />
crops <strong>and</strong> fish to be consumed <strong>and</strong> sold by the community. Both of these<br />
activities could improve the nutrition of those in the community, thereby<br />
adding value that was unintentional by the PHE project. Measuring this<br />
added impact (<strong>for</strong> health) under circumstances where the project had programmed<br />
funds <strong>for</strong> another sector (agriculture or environment) serves to<br />
demonstrate the possibility <strong>for</strong> PHE <strong>and</strong> multi-sectoral programs to go<br />
beyond the stated objectives of the project.<br />
Table 12 gives an overview of possibilities <strong>for</strong> value-added indicators. This<br />
list is illustrative; there are other categories. PHE programs are diverse<br />
<strong>and</strong> have broad impact, <strong>and</strong> projects have used many other value-added<br />
indicators. Use this section as a guide to value-added indicators, <strong>and</strong> not a<br />
definitive list of all such indicators <strong>for</strong> various approaches.<br />
A <strong>Guide</strong> <strong>for</strong> <strong>Monitoring</strong> <strong>and</strong> <strong>Evaluating</strong> <strong>Population</strong>-<strong>Health</strong>-Environment Programs 117
Table 12 – Value-Added Indicators by Sectors<br />
VALUE-ADDED INDICATORS Gender Governance Youth Livelihood <strong>Population</strong> <strong>Health</strong> Environment<br />
1. Percent of communities with functioning community-based natural resource management<br />
x x<br />
committees<br />
2. Number of educational sessions provided on new or alternative income-generating activities x x x x<br />
3. Net dollar value of socially-marketed products sold x x x<br />
4. Percent of men <strong>and</strong> women who know where to access family planning services x x<br />
5. Number of children who show improvement on growth chart x<br />
6. Yield per area per year or cropping or fishing cycle x x<br />
7. Percent of youth participating in community-based natural resource management committees x x x<br />
8. Percent of leadership positions held by women on community-based natural resource<br />
x x x<br />
management committees<br />
9. Number of validated infractions reported in deputy logs x x<br />
10. Number of fuel-efficient stoves distributed x x x<br />
11. Percent of youth who used a condom at last high-risk sex in the previous year x x x<br />
12. Percent of adults who used a condom at last high-risk sex in the previous year x x x<br />
13. Percent of men who support the use of modern contraception <strong>for</strong> themselves or their partners x x<br />
14. Percent of households with ventilation in cooking area x x<br />
15. Percent of children under five years of age with low weight <strong>for</strong> age (underweight) x<br />
16. Average household consumption of firewood in target area X x x x<br />
17. Household income x<br />
18. Percent of households that earn income from new or alternative income-generating activities x x x x
1.<br />
2.<br />
Table 13 – Value-Added Indicators <strong>and</strong> Level of Measurement<br />
Processes Outputs Outcomes<br />
Program-Based<br />
Percent of communities 3. Net dollar value of sociallywith<br />
functioning community-based<br />
marketed products sold<br />
natural resource 4. Percent of men <strong>and</strong> women<br />
management committees<br />
Number of educational<br />
sessions provided on new or<br />
alternative income-generation<br />
activities<br />
5.<br />
who know where to access<br />
modern family planning<br />
services<br />
Number of children who<br />
show improvement on<br />
growth chart<br />
Yield per area per year or<br />
6.<br />
cropping or fishing cycle<br />
7. Percent of youth participating<br />
in community-based<br />
natural resource management<br />
committees<br />
8. Percent of leadership posi-<br />
tions held by women on<br />
community-based natural<br />
resource management<br />
committee<br />
Number of validated infrac-<br />
9.<br />
tions reported in deputy<br />
logs<br />
10. Number of fuel-efficient<br />
stoves distributed<br />
<strong>Population</strong>-Based<br />
11. Percent of youth who used a<br />
condom at last high-risk sex<br />
in the previous year<br />
12. Percent of adults who used<br />
a condom at last high-risk<br />
sex in the previous year<br />
13. Percent of men who support<br />
the use of modern contraception<br />
<strong>for</strong> themselves or<br />
their partners<br />
14. Percent of households with<br />
ventilation in cooking area<br />
15. Percent of children under<br />
five years of age with low<br />
weight <strong>for</strong> age (underweight)<br />
16. Average household<br />
consumption of firewood in<br />
target area<br />
17. Household income<br />
18. Percent of households that<br />
earn income from new or<br />
alternative income-generating<br />
activities<br />
A <strong>Guide</strong> <strong>for</strong> <strong>Monitoring</strong> <strong>and</strong> <strong>Evaluating</strong> <strong>Population</strong>-<strong>Health</strong>-Environment Programs 119
1<br />
Percent<br />
of communities with functioning community-based<br />
natural resource management committees<br />
Level of measurement: Process.<br />
Definition: An NRM committee is defined as an organized group of people who represent a defined<br />
geographic or political area <strong>and</strong> have the goal of improving management of the natural resources in<br />
the defined political or geographic area in which they reside. A functioning committee is defined as<br />
one that meets regularly at a defined periodicity (e.g., once a month).<br />
Calculation<br />
# of communities with functioning community-based NRM committees in target area<br />
# of communities targeted <strong>for</strong> community-based NRM (by project) in target area<br />
x 100<br />
Disaggregate: Targeted areas.<br />
Purpose: It is assumed that the most effective natural resource management will arise from those communities<br />
that have active, functioning committees. This indicator can measure the extent to which this<br />
project activity is being implemented in the community. Once the project introduces the process <strong>and</strong><br />
assists in the establishment of an NRM committee, this indicator will measure community ownership<br />
<strong>and</strong> dedication to the process.<br />
Value-Added<br />
Data Sources: Secondary records.<br />
Time frame: Annually.<br />
Data Collection Considerations: This indicator measures the functioning of the committee,<br />
not of the NRM plan. The presence of the project (i.e. asking to see meeting notes <strong>and</strong> to attend meetings)<br />
may change the way the committees function <strong>and</strong> may be an incentive <strong>for</strong> the committees to<br />
meet regularly.<br />
Strengths <strong>and</strong> Limitations: The independent functioning of a committee is a governance valueadded<br />
indicator. The fact that the committee is meeting on a regular basis shows a continued commitment<br />
to natural resource management. The committee is defined as functioning if meeting regularly,<br />
but this does not indicate the quality of the meetings, whether the committee has the needed expertise<br />
to develop an environmentally-sound plan, <strong>and</strong> whether the committee has made progress in<br />
drafting or finalizing a NRM plan.<br />
120<br />
Part Three: Indicators
2<br />
Number<br />
of educational sessions provided on new or<br />
alternative income-generating activities<br />
Level of Measurement: Process.<br />
Definition: This count includes the total number of training/educational sessions provided by the<br />
project to introduce members of the community to new livelihood options. A new income-generating<br />
activity is any income strategy that was not practiced by the community previously. It is intended<br />
to diversify livelihoods with a goal of locally-based sustainability by diversifying the income stream<br />
<strong>and</strong>/or providing livelihood alternatives to resource extraction <strong>and</strong> destruction.<br />
Examples of new income-generating activities are numerous. They include any agricultural activity<br />
that is new to a community, such as home gardening, new crops or livestock, or alternative farming<br />
techniques. New activities can also involve fishing or <strong>for</strong>estry, as well as tourism, h<strong>and</strong>icrafts, microenterprises,<br />
women’s cooperatives, <strong>and</strong> many other enterprises. Alternative income-generating activities<br />
usually stem from skills the community already has or resources to which the community already<br />
has access.<br />
Disaggregate: Type of income-generating activity.<br />
Purpose: Educational/training sessions are needed to provide the in<strong>for</strong>mation, skills, confidence, <strong>and</strong><br />
inputs people need to add or switch to a new income-generating activity. Rural populations need to<br />
be occupationally flexible, spatially mobile, <strong>and</strong> often cannot be dependent on agricultural income<br />
generating activities alone to provide sufficient yields or income. Many of the people who live in areas<br />
with high biodiversity are poor <strong>and</strong> depend directly upon the products of a healthy ecosystem to meet<br />
their basic needs. Economic pressures increase the need to exploit natural resources <strong>and</strong> can lead to<br />
soil erosion <strong>and</strong> species loss. Poverty <strong>and</strong> lack of knowledge about alternative livelihoods are drivers<br />
of biodiversity loss.<br />
Value-Added<br />
Alternative farming/fishing techniques can lead to improvements <strong>for</strong> the environment, increased<br />
yields <strong>for</strong> market, better nutrition, <strong>and</strong> general family well-being. Sometimes communities develop<br />
nutritional deficiencies that result from depletion of essential local plant <strong>and</strong> animal species. Alternative<br />
income-generating activities that allow local species to recover can lead to availability of essential<br />
nutrients, if the species are managed in a sustainable way.<br />
Training sessions may lead to the community’s increased local capacity, empowerment, <strong>and</strong> the ability<br />
to make group decisions about resources effectively. Livelihood diversification has the potential<br />
to positively affect poverty, income distribution, yields, nutrition, food security, health, capital assets,<br />
conservation of ecosystems <strong>and</strong> species, gender roles, <strong>and</strong> vulnerability (e.g., shielding communities<br />
from environmental <strong>and</strong> economic shocks, natural disasters, weather extremes <strong>and</strong> seasonality).<br />
A <strong>Guide</strong> <strong>for</strong> <strong>Monitoring</strong> <strong>and</strong> <strong>Evaluating</strong> <strong>Population</strong>-<strong>Health</strong>-Environment Programs 121
Data Sources: Project records.<br />
Time frame: Monthly, quarterly.<br />
Data Collection Considerations: The project’s logbook should include the following in<strong>for</strong>mation<br />
about the educational session: dates held, length of training <strong>and</strong> total number of sessions held,<br />
frequency of occurrence, specifics on type of training, names of people who did the training, list of<br />
training materials distributed, location of sessions, breakdown of people in attendance (e.g., percent<br />
adults, percent women, names, ages, <strong>and</strong> genders, etc.), <strong>and</strong> a list of any financial aid or resource<br />
inputs given to the community to help them make the change.<br />
A <strong>for</strong>m can be developed that is st<strong>and</strong>ardized <strong>and</strong> used by all project community educators <strong>for</strong> easy<br />
comparison <strong>and</strong> assembling of in<strong>for</strong>mation across the project. Other items of in<strong>for</strong>mation can be added<br />
to the st<strong>and</strong>ardized <strong>for</strong>m as fits the specific needs of the project.<br />
Strengths & Limitations: This is easy to collect through careful record-keeping. However, using<br />
only the number of training sessions as an indicator does not assess the quality of the training or how<br />
well-equipped <strong>and</strong> empowered the participants feel after the sessions to diversify their income-generation<br />
activities.<br />
Value-Added<br />
122<br />
Part Three: Indicators
3<br />
Net<br />
dollar value of socially-marketed products sold<br />
Level of Measurement: Output.<br />
Definition: “Socially marketed” products include contraceptives, condoms, insecticide-treated bed<br />
nets, oral re-hydration therapy, <strong>and</strong> other products sold to improve community health. The net dollar<br />
value is the amount of money that a community-based distributor earns as profit.<br />
Calculation<br />
(total amount that the products are sold <strong>for</strong>) – (total amount a community-based distributor<br />
spends on products) = net dollar value<br />
This indicator should be calculated <strong>for</strong> a specified period of time, e.g., monthly, quarterly, or annually.<br />
If the PHE project has more than one distributor, the time frames should be identical to allow comparisons<br />
among distributors. Local currencies can be converted into U.S. dollars using the most current<br />
exchange rate. Sellers should keep records of number <strong>and</strong> types of commodities, supply sources, <strong>and</strong><br />
the number <strong>and</strong> types of commodities sold.<br />
Disaggregate: By product type or by distributor.<br />
Purpose: Social marketing seeks to influence social behaviors <strong>and</strong> to benefit both the target audience<br />
<strong>and</strong> society as a whole. In social marketing sales, products <strong>and</strong> services are sold at subsidized prices<br />
rather than given away in order to motivate commercial-sector involvement. Many PHE projects support<br />
distributors in marketing <strong>and</strong> selling a health-related commodity which encourages entrepreneurship<br />
as well as improves the health impacts in the target community.<br />
Value-Added<br />
Data Sources: Sales logs of each distributor.<br />
Time frame: Depends on program/project goals; common time frames are monthly, quarterly, <strong>and</strong><br />
annually.<br />
Data Collection Considerations: The emphasis here is on the net dollar value, meaning the<br />
amount of profit that the seller receives after accounting <strong>for</strong> the purchase price <strong>and</strong> sale price of the<br />
commodities.<br />
Strengths & Limitations: It is important to track this indicator over time <strong>and</strong> in relation to marketing<br />
campaigns that the PHE project is focusing on to look at trends between the sales of the products<br />
<strong>and</strong> the marketing campaign, if possible.<br />
A <strong>Guide</strong> <strong>for</strong> <strong>Monitoring</strong> <strong>and</strong> <strong>Evaluating</strong> <strong>Population</strong>-<strong>Health</strong>-Environment Programs 123
4<br />
Percent<br />
of men <strong>and</strong> women who know where to access modern<br />
family planning services<br />
Level of Measurement: Output.<br />
Definition: “Modern” family planning methods refer to the following: pill, IUD, Norplant implant, injection,<br />
condom, spermicides, diaphragms, <strong>and</strong> sterilization (tubal ligation <strong>and</strong> vasectomy).<br />
Calculation<br />
# of adults age 15-49 who know where to access modern family planning services<br />
total # of adults age 15-49 in the target area<br />
x 100<br />
Disaggregate: Men/women.<br />
Purpose: This indicator provides program managers with a basis <strong>for</strong> assessing whether promotional<br />
or awareness-raising activities are required to educate men <strong>and</strong> women on where they can obtain<br />
modern family planning methods. This indicator also provides in<strong>for</strong>mation on gender differences in<br />
knowledge of where to obtain family planning methods.<br />
Data Sources: <strong>Population</strong>-based surveys.<br />
Time frame: Every two to five years.<br />
Value-Added<br />
Data Collection Considerations: Without prompting, adults should be asked to name a location<br />
where they can obtain family planning. For this indicator to have meaning, both men <strong>and</strong> women<br />
should be surveyed.<br />
Strengths & Limitations: Asking respondents to name a specific location prevents respondents<br />
from giving false affirmative answers to please the interviewer. However, this indicator does not measure<br />
knowledge or use of family planning services.<br />
124<br />
Part Three: Indicators
5<br />
Number<br />
of children who show improvement on growth chart<br />
Level of Measurement: Output.<br />
Definition: The number of children under five years old (0-59 months) who show improvement on<br />
a st<strong>and</strong>ardized growth record <strong>for</strong> the proper age (from birth to five months; six months to 23 months;<br />
<strong>and</strong> 24 months to 59 months). <strong>Health</strong> center workers will plot a child’s height/length <strong>and</strong> weight<br />
against charts, <strong>and</strong> then calculate the child’s weight <strong>for</strong> length/height <strong>and</strong> body mass index (BMI)<br />
<strong>for</strong> age. The four st<strong>and</strong>ardized growth charts are: length/height <strong>for</strong> age; weight <strong>for</strong> age; weight <strong>for</strong><br />
length/height; <strong>and</strong> BMI <strong>for</strong> age. Improvement on any of these four growth charts can be counted <strong>for</strong><br />
this indicator. Improvement depends on the gender <strong>and</strong> type of malnutrition. The st<strong>and</strong>ard charts <strong>for</strong><br />
all types of malnutrition are available on WHO’s Web site at www.who.int.<br />
Disaggregate: None.<br />
Purpose: Basic growth assessments determine whether a child is growing normally or has either a previous,<br />
current, or possible future growth problem that should be addressed. New WHO growth charts<br />
provide prescriptive st<strong>and</strong>ards <strong>for</strong> normal growth, rather than simple comparisons to other children in<br />
the region.<br />
Data Sources: Service statistics.<br />
Time frame: Quarterly.<br />
Data Collection Considerations: Using service statistics to collect this indicator is not representative<br />
of the general population. When collected using service statistics based at a health facility or<br />
through outreach per<strong>for</strong>med by the project, this can show improvement in child nutrition among the<br />
clients that the project aims to serve.<br />
Value-Added<br />
Strengths & Limitations: Data collected using current WHO growth charts will be able to identify<br />
whether children are growing within healthy norms instead of only comparing them to other children<br />
in the region. Charts are specific <strong>for</strong> different age groups, <strong>and</strong> these new st<strong>and</strong>ards will better identify<br />
stunted <strong>and</strong> overweight/obese children. However, because this indicator was newly adopted, recent<br />
data will not be fully comparable to earlier data. <strong>Health</strong> care workers may not be trained on how to<br />
use the newly revised charts properly. Also, this indicator could increase if more children participate in<br />
growth monitoring even if there is no improvement in malnutrition.<br />
A <strong>Guide</strong> <strong>for</strong> <strong>Monitoring</strong> <strong>and</strong> <strong>Evaluating</strong> <strong>Population</strong>-<strong>Health</strong>-Environment Programs 125
6<br />
Yield<br />
per area per year or cropping or fishing cycle<br />
Level of Measurement: Output.<br />
Definition: Yield is the total amount of usable/edible or sellable crop or marine product. This measures<br />
l<strong>and</strong> or marine productivity.<br />
Calculation<br />
amount of usable, edible, or sellable crop, marine product (by weight or volume)<br />
area planted with the selected crop (in hectares) or the marine area<br />
fished (in nautical square miles)<br />
x 100<br />
The numerator may be measured by weight, volume or total number (<strong>for</strong> harvested crops/marine<br />
products). If farmers/fishers are paid by weight, volume or total number <strong>for</strong> their crops or fish, then<br />
billing records may provide useful data on the numerator.<br />
Value-Added<br />
Volume may be measured in many ways (e.g., by bag, basket, cans, bundles, crates, etc). It is important<br />
to st<strong>and</strong>ardize the volume measurement so that it represents the same, fixed quantity on average. This<br />
can be achieved by weighing or measuring the volume of several samples from each household or farm<br />
using the same size container to calibrate the measurement at the beginning. The volume measurement<br />
can also be st<strong>and</strong>ardized by collecting the data at the point of sale. To reduce recall bias, data<br />
collection should occur near the end of cropping or fishing cycles, which may be seasonal.<br />
Hectares should be used to measure l<strong>and</strong> area. One hectare is an area of 10,000 square meters. In the<br />
United States <strong>and</strong> Canada, an acre may be used (1 hectare = 2.471 acres). Square kilometers should<br />
be used to measure aquatic areas. (In the United States <strong>and</strong> Canada, nautical miles are more commonly<br />
used: 1 square kilometer = 0.292 nautical square miles.)<br />
Disaggregate: Crop or marine product; geographic area.<br />
Purpose: Project staff may need to know how the improved agricultural/marine practices affect the<br />
yields of farmers <strong>and</strong> fishers. Increased yields can lead to improved economic <strong>and</strong> health outcomes.<br />
Increased yields can also be linked with indicators that measure household income <strong>and</strong>/or child protein<br />
intake <strong>and</strong> nutritional status.<br />
Data Sources: Secondary sources (farmer or fisher reported estimates); farm surveys (the “crop cutting”<br />
method).<br />
126<br />
Part Three: Indicators
Time frame: Annually, or corresponding with crop/fish/product harvesting cycles.<br />
Data Collection Considerations: The total area <strong>for</strong> all plots combined under each crop system<br />
should be calculated <strong>and</strong> the yield determined <strong>for</strong> each cropping system. Separate yields should not<br />
be calculated <strong>for</strong> each plot <strong>and</strong> combined. The denominator (total area planted <strong>for</strong> l<strong>and</strong> or total area<br />
fished <strong>for</strong> marine) can be measured by a transect survey <strong>for</strong> small areas; by aerial survey/photographs<br />
<strong>for</strong> larger areas (i.e., flying over area to measure distances or use of satellite images); or by traveling the<br />
distances by boat or via scuba diving <strong>for</strong> marine areas. At least one person experienced in this type of<br />
measurement should be involved in the denominator measurements.<br />
Many farmers/fishers likely already measure their crop/marine harvests <strong>and</strong> may already have accurate<br />
measurements of the areas planted with specific crops or areas fished. It is possible that existing data<br />
may be used. Farmer/fisher estimates may vary in accuracy. However, using the farmer/fisher estimate<br />
method is generally simpler, less expensive <strong>and</strong> more efficient.<br />
Data should also be collected on when specific crops or marine species are harvested throughout the<br />
year. Data collection should occur early in each planting or fishing season to measure the area planted<br />
or fished, <strong>and</strong> right after each harvest to measure yields.<br />
Strengths & Limitations: This indicator may not only provide data on the impact of the improved<br />
resource practice but also serve as an incentive <strong>for</strong> farmers/fishers to continue with <strong>and</strong> exp<strong>and</strong> on the<br />
use of improved practices. Data are relatively easy <strong>and</strong> inexpensive to collect, especially since most<br />
farmers/fishers already measure their yields. This indicator is widely used in the coastal resource management<br />
field <strong>and</strong> is sometimes called “catch per unit ef<strong>for</strong>t.” However, external factors can affect the<br />
yield. Improved natural resource management practices do not necessarily result in increased natural<br />
resource yields.<br />
Value-Added<br />
A <strong>Guide</strong> <strong>for</strong> <strong>Monitoring</strong> <strong>and</strong> <strong>Evaluating</strong> <strong>Population</strong>-<strong>Health</strong>-Environment Programs 127
7<br />
Percent<br />
of youth participating on community-based natural<br />
resources management committees<br />
Level of Measurement: Output.<br />
Definition: “Participation of youth” is defined as youth aged 15-24 regularly attending NRM committee<br />
meetings. Regular attendance means being present <strong>and</strong> counted as a participant at each meeting<br />
held (apart from occasional illness or need <strong>for</strong> absence). The frequency of meetings is determined in<br />
advance by the committees <strong>and</strong> in consultation with the project managers.<br />
Calculation<br />
total # of community youth age 15-24 participating on the NRM committee<br />
total # of youth age 15-24 in the community<br />
x 100<br />
Disaggregate: By community.<br />
Value-Added<br />
Purpose: The percent of youth participating on the committees is important because it reflects an ongoing,<br />
generational commitment <strong>and</strong> interest in the work of the committee. <strong>Monitoring</strong> this indicator<br />
can give indication to the project of the need to discuss more open policies toward youth participation<br />
or to create strategies with the community to increase youth participation in making decisions on the<br />
use of natural resources. There is the potential <strong>for</strong> youth to act as leaders in behavior change communication<br />
<strong>and</strong> adoption.<br />
Data Sources: Secondary sources (meetings notes with participants listed, membership lists).<br />
Time frame: Annually.<br />
Data Collection Considerations: Qualitative interviews with youth may also be used to assess<br />
their perceptions of involvement in the committees <strong>and</strong> to obtain more details on how youth are contributing<br />
to the committees. For instance, youth may not be participating or attending meetings due<br />
to the timing of the meeting, especially if meetings are held during school hours or after school when<br />
the youth may be doing homework or other chores. The increase or decrease in the percent of youth<br />
participating may be due to a variety of factors that should be considered <strong>and</strong> investigated.<br />
Strengths <strong>and</strong> Limitations: Being involved in the committee does not necessarily ensure that<br />
youth have the same power <strong>and</strong> decision-making ability as adults do. There may be cultural factors<br />
that prevent or inhibit the youth from speaking up or challenging the views of others.<br />
128<br />
Part Three: Indicators
8<br />
Percent<br />
of leadership positions held by women on communitybased<br />
natural resources management committees<br />
Level of Measurement: Output.<br />
Definition: A “leadership position” is any position that needs to be applied <strong>for</strong> with a vote taken to<br />
determine who is elected to the position, resulting in the chosen person having comm<strong>and</strong>ing authority<br />
or influence.<br />
Calculation<br />
total # of women with a leadership position on the NRM committee<br />
total # of available NRM leadership positions<br />
x 100<br />
Disaggregate: Community.<br />
Purpose: Women <strong>and</strong> men have different gender-based roles <strong>and</strong> responsibilities; different knowledge<br />
of, access to, <strong>and</strong> control over natural resources; <strong>and</strong> different opportunities to make decisions<br />
that affect environmental management. For example, in some regions men are much less involved,<br />
or not involved at all, in gathering, carrying, or providing water or firewood <strong>for</strong> household use <strong>and</strong><br />
activities such as weeding <strong>and</strong> planting. There<strong>for</strong>e, men may not appreciate the importance of these<br />
limited resources. Often, an NRM committee made up of only men makes decisions on issues that affect<br />
primarily women, such as regarding tasks that are typically completed by women. This indicator<br />
reflects gender equity <strong>and</strong> the ability of women to have a decision-making role in committee plans,<br />
actions, <strong>and</strong> control of resources. Differences in gender, age, <strong>and</strong> ethnicity may influence the use of<br />
natural resources. Increased participation of women on community-based NRM committees may lead<br />
to decreased local inequities, if gender equity <strong>and</strong> a leadership role <strong>for</strong> women is promoted. Exclusion<br />
of women may marginalize them from assets such as water or <strong>for</strong>est products <strong>and</strong> training, credit or<br />
other benefits that go only to the committee members.<br />
Value-Added<br />
Data Sources: Secondary records (membership <strong>and</strong> officers list).<br />
Time frame: Annually.<br />
Data Collection Considerations: Qualitative interviews with women may also be used to assess<br />
their perceptions of involvement in the committees <strong>and</strong> to obtain more details on how women are<br />
contributing to/involved in the committees. In these interviews women can be asked <strong>for</strong> exact details<br />
of their leadership position responsibilities.<br />
A <strong>Guide</strong> <strong>for</strong> <strong>Monitoring</strong> <strong>and</strong> <strong>Evaluating</strong> <strong>Population</strong>-<strong>Health</strong>-Environment Programs 129
Strengths <strong>and</strong> Limitations: If women become empowered <strong>and</strong> more involved in decision-making<br />
<strong>and</strong> community-based group activities, this may lead to their input in not only natural resource use<br />
decisions but also other decisions such as education, health <strong>and</strong> family planning decisions. However,<br />
holding a leadership position does not necessarily ensure that women have the same power <strong>and</strong> decision-making<br />
ability as men do. There may be cultural factors that prevent or inhibit the women who<br />
have leadership positions from speaking up or challenging the views of others. Reserving a certain<br />
number of leadership positions <strong>for</strong> women will not be effective if women play only a ceremonial role<br />
<strong>and</strong> stay silent.<br />
Value-Added<br />
130<br />
Part Three: Indicators
9<br />
Number<br />
of validated infractions reported in deputy logs<br />
Level of Measurement: Output.<br />
Definition: This indicator measures the total number of infractions reported by officers (or community<br />
members) <strong>and</strong> approved as authentic by a supervisor. Infractions are defined as illegal violations that<br />
are discovered by en<strong>for</strong>cement officers <strong>and</strong> officially recorded in the officers’ logbooks. Validated infractions<br />
are those infractions that are verified by a designated supervisor as authentic. The decision as to<br />
what to consider authentic should be based on the plausibility of the reported infraction <strong>and</strong>, whenever<br />
possible, evidence such as the confiscated goods, photos of the violation, or actual fines/penalties<br />
collected. Supervision to validate infractions <strong>and</strong> provide support to officers should occur monthly or at<br />
a minimum on a quarterly basis <strong>and</strong> may be provided by the project manager.<br />
Disaggregate: Community-reported (if desired).<br />
Purpose: This is an indicator of how well illegal de<strong>for</strong>estation, hunting, <strong>and</strong> other prohibited activities<br />
are controlled or prevented. The number of community-reported violations may indicate a local group<br />
ef<strong>for</strong>t <strong>and</strong> commitment to natural resource conservation. Validating infractions may prevent false or<br />
over-reporting of en<strong>for</strong>cement activities <strong>and</strong> is an indication of the level of supervision the officers received<br />
in their work. This indicator demonstrates progress towards improved governance, a key aspect<br />
of value-added programs.<br />
Data Sources: Secondary records, project records.<br />
Time frame: Quarterly.<br />
Data Collection Considerations: When appropriate (where projects are working closely with<br />
government authorities), in<strong>for</strong>mation may need to be jointly collected from project <strong>and</strong> government<br />
records. Officers should be given a space in their logbooks or on a st<strong>and</strong>ardized infraction report to<br />
record their total number of daily infractions, nature of the infraction (e.g., species affected), location<br />
of the infraction (using GPS when possible), <strong>and</strong> details on how the infraction came to their attention<br />
(e.g., community-reported), number of perpetrators, description of the perpetrators, quantity of resources<br />
affected, <strong>and</strong> what the final result was (e.g., caught the perpetrators in the act, or the perpetrators<br />
had already fled the area, etc). Supervisors should use these logbooks to record their assessments<br />
of the reported infractions <strong>and</strong> whether they validated the infraction.<br />
Value-Added<br />
An increase in infractions could indicate more ef<strong>for</strong>t from the officers, increased illegal activity in the<br />
area, or a combination of the two. If collected fines are used as a measure of validation, this indicator<br />
will be lagging since it may take months or years <strong>for</strong> the fines to be actually collected.<br />
A <strong>Guide</strong> <strong>for</strong> <strong>Monitoring</strong> <strong>and</strong> <strong>Evaluating</strong> <strong>Population</strong>-<strong>Health</strong>-Environment Programs 131
Strengths & Limitations: The ability to validate an infraction depends, in part, on the nature of<br />
the infraction <strong>and</strong> also on how dangerous the field conditions are. In some cases, it may be possible<br />
to bring in confiscated wildlife products as evidence of an infraction. In other cases, this may not be<br />
possible due to remote field conditions. It is also important that the project does not give rewards or<br />
benefits associated with increased infractions to avoid creating incentives <strong>for</strong> officers to falsify records<br />
of infractions.<br />
Value-Added<br />
132<br />
Part Three: Indicators
10<br />
Number of fuel-efficient stoves distributed<br />
Level of Measurement: Output.<br />
Definition: Fuel-efficient stoves are enclosed <strong>and</strong> often employ an elbow shape to provide a combustion<br />
chamber <strong>and</strong> insulation to increase the heat available to cook food. They conserve heat <strong>and</strong> have a<br />
chimney/vent to divert toxic smoke out of the cooking area. The specific type of fuel-efficient stove varies;<br />
there<strong>for</strong>e the type of stove to be included in the measurement of this indicator should be determined<br />
by the project in advance. Traditional indoor cooking stoves are associated with exposure to harmful air<br />
pollution. Fuel-efficient stoves function by burning wood more slowly <strong>and</strong> increasing the amount of<br />
heat trapped <strong>and</strong> effectively used. These features reduce total cooking time <strong>and</strong> produce less smoke.<br />
Purpose: Switching to fuel-efficient stoves can have direct impacts on both <strong>for</strong>est <strong>and</strong> human health by<br />
limiting wood collection <strong>and</strong> ecosystem disruption <strong>and</strong> by minimizing human exposure to pollutants<br />
<strong>and</strong> related acute respiratory diseases (especially among women <strong>and</strong> children). Use of fuel-efficient<br />
stoves is thought to reduce household fuel wood use by 50% to 70%. In addition to the environmental<br />
benefits, reducing the time needed to collect fire wood each week <strong>and</strong> the time needed <strong>for</strong> cooking may<br />
free up time <strong>for</strong> essential health, education <strong>and</strong> income-generation activities, especially among women<br />
<strong>and</strong> girls. In areas where people buy fire wood, the money saved may be invested in other important areas.<br />
Stoves may also provide other advantages such as additional indoor heat <strong>for</strong> families, more bathing<br />
opportunities <strong>and</strong> increased hygiene/less disease, reduced risk of burns as compared with open fires,<br />
<strong>and</strong> a reduction in back/neck injuries due to carrying heavy fire wood. Many designs of fuel-efficient<br />
stoves have also been linked with the reduction in the incidence of acute respiratory illnesses by reducing<br />
the amount of indoor air pollution created by traditional biomass fuel burning stoves.<br />
Data Sources: Project records.<br />
Time frame: Annually.<br />
Value-Added<br />
Data Collection Considerations: A st<strong>and</strong>ard <strong>for</strong>m should be used to keep track of these data.<br />
The <strong>for</strong>m should include a place to note the dates of distribution, total number of stoves distributed, a<br />
list of the actual households <strong>and</strong> addresses where the stoves went to, <strong>and</strong> the name of the village or<br />
community. Prior to distributing the new stoves, doing a baseline assessment would be useful.<br />
Strengths & Limitations: Data on the number of stoves distributed should be easy to obtain <strong>and</strong><br />
track over time. However, the distributed stoves only have an impact if they are used. This indicator<br />
does not measure the existence of a mechanism in the target area <strong>for</strong> timely repairs/maintenance to<br />
be sure the stoves are kept in use. The size <strong>and</strong> style of each stove should be designed <strong>for</strong> the specific<br />
setting (country, region, house size/layout, cultural preferences, etc.) where it will be distributed.<br />
A <strong>Guide</strong> <strong>for</strong> <strong>Monitoring</strong> <strong>and</strong> <strong>Evaluating</strong> <strong>Population</strong>-<strong>Health</strong>-Environment Programs 133
Firewood Collection <strong>and</strong> Gender-Based Violence<br />
Fuel-efficient stoves reduce the consumption of firewood, thereby conserving more of the natural<br />
environment <strong>and</strong> decreasing smoke in the cooking area which can lead to respiratory infections.<br />
However, they can also serve to protect women <strong>and</strong> girls by reducing their time spent searching<br />
<strong>for</strong> <strong>and</strong> collecting firewood.<br />
In many regions of the world, women <strong>and</strong> girls collect firewood <strong>and</strong> fuel used <strong>for</strong> cooking or <strong>for</strong><br />
income. In some regions, especially among refugee <strong>and</strong> displaced populations, women <strong>and</strong> girls<br />
are at risk of gender-based violence (GBV), including rape or physical assault while collecting firewood<br />
<strong>for</strong> their families. Female refugees interviewed by Refugees International cited the threat of<br />
violence while collecting firewood as one of their top concerns.<br />
In households with less need <strong>for</strong> firewood, women <strong>and</strong> girls will spend less time collecting firewood<br />
<strong>and</strong> also may not need to travel as far. Walking far from home to find firewood increases the<br />
risk of GBV because women may have to walk in isolated, unknown areas or go near military posts<br />
or checkpoints where assaults are more likely. Additionally, women can be trained to construct <strong>and</strong><br />
maintain fuel-efficient stoves. This alternative income-generation activity may further reduce the<br />
risk of GBV by reducing the need to sell firewood.<br />
Fuel-efficient stoves can enhance the lives of women <strong>and</strong> girls in several other ways, including<br />
reducing risk of respiratory infections, improving their natural environment, <strong>and</strong> freeing time <strong>for</strong><br />
other income-generating activities.<br />
Value-Added<br />
134<br />
Part Three: Indicators
11<br />
Percent of youth who used a condom at last high-risk sex in<br />
the previous year<br />
Level of Measurement: Outcome.<br />
Definition: This indicator measures the percent of youth aged 15-24 who used a condom the last<br />
time they had high-risk sex. “High-risk” sex is defined as sex with any non-marital, non-cohabitating<br />
partner. This indicator relates to sexual activity within the previous 12 months.<br />
Calculation<br />
# of sexually active youth age<br />
15-24 that used a condom the last time they had high risk sex in the last 12 months<br />
total # of youth age 15-24 who report having high risk sex in the last 12 months<br />
x 100<br />
Disaggregate: By age group (15-19, 20-24); sex.<br />
Purpose: Consistent <strong>and</strong> correct condom use has been shown to reduce the risk of HIV <strong>and</strong> other<br />
sexually transmitted infections <strong>and</strong> to prevent unintended pregnancy. Increasing condom use with<br />
non-marital, non-cohabiting partners is a goal of many reproductive health programs, including those<br />
aimed at youth. PHE programs frequently sell condoms or promote their use through social marketing<br />
campaigns; this indicator can be used to assess both men’s <strong>and</strong> women’s adoption of these messages.<br />
Data Source: <strong>Population</strong>-based surveys.<br />
Time frame: Every two to five years.<br />
Data Collection Considerations: This indicator measures condom use in high-risk sexual activity<br />
among both married <strong>and</strong> unmarried youth within the last 12 months. The target area or region<br />
<strong>for</strong> both the numerator <strong>and</strong> denominator should be the same. The target area should be defined in<br />
advance <strong>and</strong> remain constant over the course of the project <strong>for</strong> consistent comparison over time. Collection<br />
of these data requires gathering sexual histories from several previous partners, i.e., asking<br />
about condom use with the last three sexual partners within the previous year.<br />
Value-Added<br />
Strengths <strong>and</strong> Limitations: Measuring condom use among the last three sexual partners within<br />
the last year reduces recall bias. Questions about condom use <strong>and</strong> sexual activity are taboo <strong>for</strong> some<br />
audiences, particularly youth in many cultures, <strong>and</strong> this may lead to reporting bias. Youth may underreport<br />
their sexual behaviors, especially high-risk behaviors. Additionally, condom use at last sex does<br />
not measure either consistent or correct use of condoms.<br />
A <strong>Guide</strong> <strong>for</strong> <strong>Monitoring</strong> <strong>and</strong> <strong>Evaluating</strong> <strong>Population</strong>-<strong>Health</strong>-Environment Programs 135
12<br />
Percent of adults who used a condom at last high-risk sex in<br />
the previous year<br />
Level of Measurement: Outcome.<br />
Definition: This indicator measures the percent of men, ages 15-59, <strong>and</strong> women, ages 15-49, who<br />
used a condom the last time they had high risk sex. “High risk” sex is defined as sex with any non-marital,<br />
non-cohabitating partner. This indicator measures sexual activity within the previous 12 months.<br />
Calculation<br />
# of sexually active men age 15-59/women age<br />
15-49 that used a condom the last time they had high-risk sex in the last 12 months<br />
total # of men age 15-59/women age 15-49 who report having high-risk<br />
sex in the last 12 months<br />
x 100<br />
Disaggregate: By age group; sex.<br />
Value-Added<br />
Purpose: Consistent <strong>and</strong> correct condom use has been shown to reduce the risk of HIV <strong>and</strong> other<br />
sexually transmitted infections <strong>and</strong> to prevent unintended pregnancy. Increasing condom use with<br />
non-marital, non-cohabiting partners is an important component of programs aimed at reducing HIV<br />
infections among sexually active adults, both married <strong>and</strong> unmarried. PHE programs frequently sell<br />
condoms or promote their use through social marketing campaigns; this indicator can be used to assess<br />
both men’s <strong>and</strong> women’s adoption of these messages.<br />
Data Sources: <strong>Population</strong>-based surveys.<br />
Time frame: Every two to five years.<br />
Data Collection Considerations: This indicator measures high-risk sexual activity among<br />
married <strong>and</strong> unmarried men <strong>and</strong> women within the last 12 months. The target area or region <strong>for</strong> both<br />
the numerator <strong>and</strong> denominator should be the same. The target area should be defined in advance <strong>and</strong><br />
remain constant over the course of the project <strong>for</strong> consistent comparison over time. Collection of these<br />
data requires gathering sexual histories from several previous partners, i.e., asking about condom use<br />
with the last three sexual partners within the previous year.<br />
136<br />
Part Three: Indicators
Strengths & Limitations: Measuring condom use among the last three sexual partners within<br />
the last year reduces recall bias. Although condom use within marriage may be low, this indicator aims<br />
at measuring condom use outside of <strong>for</strong>malized unions. However, questions about condom use <strong>and</strong><br />
sexual activity are taboo <strong>for</strong> some audiences, <strong>and</strong> this may lead to reporting bias. Additionally, condom<br />
use at last sex does not measure either consistent or correct use of condoms.<br />
Value-Added<br />
A <strong>Guide</strong> <strong>for</strong> <strong>Monitoring</strong> <strong>and</strong> <strong>Evaluating</strong> <strong>Population</strong>-<strong>Health</strong>-Environment Programs 137
13<br />
Percent of men who support use of modern contraception<br />
<strong>for</strong> themselves or their partners<br />
Level of Measurement: Outcome.<br />
Definition: “Support” <strong>for</strong> modern contraception can be defined by a man’s acceptance of, communication<br />
about, or practice of any modern method (condom, pill, injection, implants, IUD, diaphragm,<br />
spermicides, <strong>and</strong> male <strong>and</strong> female sterilization) utilized to delay or prevent pregnancy with their partner.<br />
Men’s supportive attitudes can be ascertained by asking men questions about his attitudes (“Do<br />
you approve or disapprove of your wife’s or partner’s use of a contraceptive method to prevent pregnancy?”);<br />
communication with their partner (“Have you ever told or otherwise let your wife or partner<br />
know that you approve or disapprove of her using contraception?”); or practices (“Do you currently use<br />
any <strong>for</strong>m of contraceptive to delay or prevent pregnancy?”). For this indicator, “partner” is defined as<br />
within a marital or cohabitating union.<br />
Calculation<br />
# of men age 15-59<br />
who support modern contraceptive use by themselves or their partners<br />
total # of men age 15-59 surveyed<br />
x 100<br />
Disaggregate: None.<br />
Value-Added<br />
Purpose: In many developing countries, men are either not involved in reproductive health decisionmaking<br />
or have negative attitudes toward contraceptive use. These negative attitudes result in a greater<br />
number of unplanned pregnancies <strong>and</strong> can increase transmission of HIV <strong>and</strong> other sexually transmitted<br />
infections. More supportive attitudes can have the opposite effect, especially if coupled with improved<br />
communication <strong>and</strong> consistent practice.<br />
Data Sources: <strong>Population</strong>-based surveys.<br />
Time frame: Every two to five years.<br />
Data Collection Considerations: Support can be determined in multiple ways depending on<br />
the specific aims of the program. Determining attitudes <strong>and</strong> beliefs is tricky, <strong>and</strong> reporting bias is possible.<br />
Asking these questions in a matter-of-fact manner can reduce the chance of reporting bias <strong>and</strong><br />
increase the accuracy of results. Men’s attitudes <strong>for</strong> this indicator could be determined using structured<br />
interviews or surveys in the general population. Alternatively, although asking men about their own<br />
attitudes is preferable, women can also be asked about their partner’s attitudes <strong>and</strong> beliefs. Women<br />
who use family planning methods may be asked whether their partner/spouse is aware of their use.<br />
138<br />
Part Three: Indicators
For these data to be valid, the questions need to be measured the same way <strong>for</strong> the same population<br />
so that comparisons can be made across time.<br />
Strengths <strong>and</strong> Limitations: PHE programs often work on gender issues, especially to include<br />
men in the counseling <strong>and</strong> decision-making process <strong>for</strong> contraceptive use. However, answers to these<br />
questions are subject to reporting bias, especially <strong>for</strong> men who believe their attitudes deviate from socially<br />
held or interviewer beliefs. Additionally, this is an indicator of modern contraceptive use to delay<br />
or prevent pregnancy, not <strong>for</strong> protection against sexually transmitted infections, including HIV. Caution<br />
must be used to determine the motivation <strong>for</strong> the contraceptive use, especially <strong>for</strong> condoms. Lastly,<br />
support <strong>for</strong> use of modern contraceptives is not an indictor of consistent or correct use.<br />
Value-Added<br />
A <strong>Guide</strong> <strong>for</strong> <strong>Monitoring</strong> <strong>and</strong> <strong>Evaluating</strong> <strong>Population</strong>-<strong>Health</strong>-Environment Programs 139
14<br />
Percent of households with ventilation in cooking area<br />
Level of Measurement: Outcome.<br />
Definition: A ventilated cooking area should have some duct or hood that allows cooking smoke to<br />
escape through the roof or out a window.<br />
Calculation<br />
# of households that have ventilated cooking areas<br />
total # of households in the target area<br />
x 100<br />
Disaggregate: None.<br />
Purpose: Indoor air pollution is a major cause of morbidity <strong>and</strong> mortality in developing countries. Unventilated<br />
cooking areas, especially when solid fuels are used <strong>for</strong> cooking, greatly increase the risk <strong>for</strong><br />
developing lung cancer as well as acute or chronic respiratory diseases. Women are disproportionally<br />
affected as they do most of the cooking.<br />
Data Sources: <strong>Population</strong>-based surveys.<br />
Value-Added<br />
Time frame: Every two to five years.<br />
Data Collection Considerations: Determining what constitutes ventilation may be a challenge.<br />
Interviewers should ask heads of households if the cooking area has ventilation. Additionally,<br />
interviewers should request to observe the available ventilation.<br />
Strengths <strong>and</strong> Limitations: Data <strong>for</strong> this indicator are easily collected. This indicator can quickly<br />
estimate where to target interventions. However, exposure to <strong>and</strong> effects of indoor air pollution depend<br />
on many factors, such as type of cooking fuel used, whether or not sleeping <strong>and</strong> cooking areas are<br />
separated, <strong>and</strong> the amount of time spent in cooking areas.<br />
140<br />
Part Three: Indicators
15<br />
Percent of children under five years of age with low weight<br />
<strong>for</strong> age (underweight)<br />
Level of Measurement: Outcome.<br />
Definition: This measures the percent of children under five years (0-59 months) who weigh -2 st<strong>and</strong>ard<br />
deviations (S.D.) of the U.S. National Center <strong>for</strong> <strong>Health</strong> Statistics/WHO’s reference population’s<br />
median weight-<strong>for</strong>-age or less. See Tables 14 <strong>and</strong> 15 on page 143 <strong>for</strong> WHO’s recommendations.<br />
The st<strong>and</strong>ard deviation, or “Z-score,” is the simplest way of making comparison to the reference population.<br />
The Z-score is defined as the difference between the value <strong>for</strong> an individual <strong>and</strong> the median<br />
value of the reference population in the same age or weight, divided by the st<strong>and</strong>ard deviation of the<br />
reference population. The median is the value at exactly the mid-point between the largest <strong>and</strong> the<br />
smallest.<br />
The cut-off points <strong>for</strong> different malnutrition classifications under the WHO child growth st<strong>and</strong>ards are:<br />
Mild: Between -1 <strong>and</strong> -2 st<strong>and</strong>ard deviation<br />
Moderate: Between -2 <strong>and</strong> -3 st<strong>and</strong>ard deviation<br />
Severe: Below -3 st<strong>and</strong>ard deviation<br />
Children who are below -2 st<strong>and</strong>ard deviation from the median are considered underweight <strong>for</strong><br />
their age<br />
Calculation<br />
the # of children under five<br />
who weigh less than -2 S.D. of the reference population median weight-<strong>for</strong>-age<br />
the total # of surveyed children under five<br />
x 100<br />
Value-Added<br />
Disaggregate: None.<br />
Purpose: The low-weight-<strong>for</strong>-age measure identifies the condition of being underweight <strong>for</strong> a specific<br />
age. It reflects chronic <strong>and</strong> acute under-nutrition <strong>and</strong> measures the health <strong>and</strong> nutritional risk in a<br />
population. Improvements in crop yields or diversification in food sources associated with improved<br />
environmental or agricultural practices may impact this indicator.<br />
Data Sources: <strong>Population</strong>-based surveys.<br />
Time frame: Every two to five years.<br />
A <strong>Guide</strong> <strong>for</strong> <strong>Monitoring</strong> <strong>and</strong> <strong>Evaluating</strong> <strong>Population</strong>-<strong>Health</strong>-Environment Programs 141
Data Collection Considerations: The weight <strong>and</strong> date of birth <strong>for</strong> all children under five<br />
(child’s age in months is required) should be collected from their mothers. If the mother cannot recall<br />
the month her child was born, a local calendar should be used to assist her. A hanging scale can be<br />
used to measure children’s weight; alternatively, an electronic scale can be used by first recording the<br />
mother’s weight while holding the baby <strong>and</strong> then subtracting the mother’s weight while st<strong>and</strong>ing<br />
alone. Weights should be recorded in kilograms to one decimal point.<br />
Strengths & Limitations: Weight-<strong>for</strong>-age measures reflect present <strong>and</strong> past under-nutrition. This<br />
indicator can be used <strong>for</strong> continuous assessment of nutritional progress <strong>and</strong> growth, to identify infants<br />
<strong>and</strong> children with poor health <strong>and</strong> nutrition, <strong>and</strong> <strong>for</strong> interventions tailored to causes of poor growth.<br />
However, inaccuracies stemming from a caretaker’s estimated age of the child, as well as differences in<br />
weighing practices <strong>and</strong> instruments, can result in less reliable data. Additionally, the composite nature<br />
of this index makes interpretation difficult.<br />
Value-Added<br />
142<br />
Part Three: Indicators
Table 14 – Girls’ Z-Score Chart <strong>for</strong> <strong>Monitoring</strong> Weight-Related Malnutrition<br />
<br />
<br />
<br />
<br />
<br />
<br />
<br />
<br />
<br />
<br />
<br />
<br />
<br />
<br />
<br />
<br />
<br />
<br />
<br />
<br />
<br />
<br />
<br />
<br />
<br />
<br />
<br />
<br />
<br />
<br />
<br />
<br />
<br />
<br />
<br />
<br />
<br />
<br />
<br />
<br />
<br />
<br />
<br />
<br />
<br />
<br />
<br />
<br />
Table 15 – Boys’ Z-Score Chart <strong>for</strong> <strong>Monitoring</strong> Weight-Related Malnutrition<br />
<br />
<br />
<br />
<br />
<br />
<br />
<br />
<br />
<br />
<br />
Value-Added<br />
<br />
<br />
<br />
<br />
<br />
<br />
<br />
<br />
<br />
<br />
<br />
<br />
<br />
<br />
<br />
<br />
<br />
<br />
<br />
<br />
<br />
<br />
<br />
<br />
<br />
<br />
<br />
<br />
<br />
<br />
<br />
<br />
<br />
<br />
<br />
<br />
A <strong>Guide</strong> <strong>for</strong> <strong>Monitoring</strong> <strong>and</strong> <strong>Evaluating</strong> <strong>Population</strong>-<strong>Health</strong>-Environment Programs 143
16<br />
Average household consumption of firewood in target area<br />
Level of Measurement: Outcome.<br />
Definition: This measurement reflects the <strong>for</strong>est impact resulting from fuel-efficient stove distribution<br />
<strong>and</strong> also reflects how much time people need to invest in fire wood collection.<br />
Calculation<br />
(volume or weight of a typical bundle of firewood collected) x (# of bundles a household<br />
collects per week)<br />
This number will reflect a week’s worth of collected firewood. To measure over a larger period<br />
of time, multiply by the number of weeks (e.g., by six <strong>for</strong> a six-week estimate).<br />
At the beginning of project implementation, weigh or measure the volume of several “typical” bundles<br />
of firewood in order to calibrate this measurement accurately. In cases where the size/weight of bundles<br />
is not known, time spent collecting firewood can be used as a proxy.<br />
Value-Added<br />
Purpose: This indicator provides in<strong>for</strong>mation on the local de<strong>for</strong>estation rate <strong>for</strong> fuel needs. Switching<br />
to fuel-efficient stoves can have direct impacts on the <strong>for</strong>est by reducing wood consumption. Use of<br />
fuel-efficient stoves is thought to reduce household fuel-wood use by up to 50%. The need to collect<br />
firewood may pressure people to use protected areas <strong>for</strong> this purpose illegally, leading to conflicts with<br />
en<strong>for</strong>cement officers <strong>and</strong> dem<strong>and</strong>s on the officers’ time. Reducing overall firewood consumption may<br />
also benefit protected areas <strong>and</strong> species conservation. Also, reduction of firewood <strong>for</strong> household use<br />
may have positive effects on respiratory health.<br />
Data Sources: <strong>Population</strong>-based surveys.<br />
Time frame: Every two to five years (seasonally).<br />
Data Collection Considerations: Surveys should ask how much firewood is collected on<br />
a weekly basis (e.g., volume of a typical bundle collected <strong>and</strong> how many bundles are collected per<br />
week), if any fire wood is bought rather than collected, what the firewood is used <strong>for</strong> (cooking, heating,<br />
lighting, burning bricks, etc.), <strong>and</strong> what areas of the <strong>for</strong>est the firewood is taken from. It may also be<br />
desired to have data on the age, gender, <strong>and</strong> other details of who does the actual firewood collection.<br />
144<br />
Part Three: Indicators
Strengths & Limitations: When the size of an average bundle is known in advance, this is an<br />
accurate measure of consumption at a household level <strong>and</strong> is not complicated to collect. However,<br />
firewood may still be used <strong>for</strong> other purposes besides cooking. Trends in firewood consumption over<br />
time may vary due to external factors that have nothing to do with the type of stove distributed.<br />
Value-Added<br />
A <strong>Guide</strong> <strong>for</strong> <strong>Monitoring</strong> <strong>and</strong> <strong>Evaluating</strong> <strong>Population</strong>-<strong>Health</strong>-Environment Programs 145
17<br />
household income<br />
Level of Measurement: Outcome.<br />
Definition: This is the total monetary amount (converted into dollars) of all combined household income<br />
<strong>for</strong> the month. This is equal to the total monetary market income paid to all household family<br />
members <strong>for</strong> crops, fish, products or services <strong>for</strong> a given period minus the input, labor, transportation<br />
<strong>and</strong> transaction costs, converted to U.S. dollars.<br />
Income includes both goods <strong>and</strong> services that are sold, traded, exchanged, or per<strong>for</strong>med <strong>for</strong> money.<br />
Goods are defined as the value <strong>and</strong> quantity of marketed goods from <strong>for</strong>est <strong>and</strong> other wooded l<strong>and</strong> (or<br />
marine areas). Services are the value of market services in <strong>for</strong>est or marine areas (e.g., tourism, labor<br />
provided <strong>for</strong> logging) <strong>and</strong> services unrelated to natural resources (e.g., teaching).<br />
Disaggregate: By project; community; specific <strong>for</strong>est or marine products.<br />
Purpose: The natural environment is an income source <strong>and</strong> many livelihoods are directly linked to <strong>for</strong>ests,<br />
fisheries, farming, <strong>and</strong> use of other natural resources especially among the poor living in rural<br />
areas of developing countries. If managed properly, income from natural resources can reduce poverty<br />
over the long-term by providing increased household income, more secure livelihoods, <strong>and</strong> better education<br />
<strong>and</strong> health.<br />
Value-Added<br />
Total monthly household income reflects economic wealth <strong>and</strong> ability to buy needed items such as<br />
food <strong>and</strong> medicines or health care. The breakdown of income by specific <strong>for</strong>est or marine products can<br />
reflect local environmental degradation <strong>and</strong> how much of any particular resource is being exploited.<br />
Data Sources: <strong>Population</strong>-based surveys.<br />
Time frame: Monthly, quarterly, or annually, depending on design.<br />
Data Collection Considerations: Data on income from households should be complimented<br />
by price data to consider price differentials between regions. Price data may be obtained from various<br />
sources including field visits/observations particularly at markets, qualitative interviews, ecotourism<br />
records, harvest records, market records, cooperative registries <strong>and</strong> receipts, fishing records <strong>and</strong> agricultural<br />
surveys. Depending on whether the local economy is <strong>for</strong>mal or in<strong>for</strong>mal (or mixed), different<br />
approaches will be needed. Income will be in various local currencies. For comparisons, income needs<br />
to be converted into a common unit (e.g., U.S. dollars) <strong>and</strong> comparisons across time will need to account<br />
<strong>for</strong> inflation.<br />
146<br />
Part Three: Indicators
Strengths & Limitations: Total income in dollars is a reflection of the market value <strong>for</strong> specific<br />
goods in the specific area <strong>and</strong> does not describe the total number of species or products extracted from<br />
the <strong>for</strong>est or marine ecosystem. Monthly data will measure seasonality in income better, but is very<br />
expensive to collect.<br />
Special Consideration <strong>for</strong> Interpreting Household Income<br />
Measuring changes in household income over time is important <strong>for</strong> many PHE programs. However,<br />
collecting data to measure household income accurately <strong>and</strong> appropriately goes well beyond<br />
st<strong>and</strong>ard population-based surveys. Detailed questionnaires <strong>and</strong> surveys are warranted at both<br />
the household <strong>and</strong> community level, <strong>and</strong> interpretation of data is complex. In particular, there are<br />
several issues to consider in the measurement <strong>and</strong> interpretation of income of rural households,<br />
including the following:<br />
• Households have multiple sources of income, both monetary <strong>and</strong> non-monetary. A full picture<br />
of household income includes the production <strong>and</strong> sale of all goods <strong>for</strong> market as well<br />
as all <strong>for</strong>ms of labor: <strong>for</strong>mal, in<strong>for</strong>mal, <strong>and</strong> temporary (migration <strong>for</strong> brief periods of time).<br />
Non-monetary sources may include goods <strong>and</strong> services that are traded or exchanged.<br />
• Consideration must be given to the family size <strong>and</strong> to the number of working adults in the<br />
household. Also, variation within households might also occur due to migration of household<br />
members away from the household, members entering the labor <strong>for</strong>ce, or members<br />
moving to other households due to marriage.<br />
• People tend to under-declare income <strong>and</strong> to omit declaration of income from in<strong>for</strong>mal or<br />
illegal sources.<br />
• There are expected variations in household income due to normal seasonal factors (rainfall,<br />
temperature, harvest time) <strong>and</strong> occasional sales (i.e., a pig, cow, etc.).<br />
• Income is also affected by unpredictable factors such as r<strong>and</strong>om variation in weather<br />
(floods, drought, etc.) or in market prices that tend to fluctuate according to local <strong>and</strong> nonlocal<br />
conditions. These unexpected climate- or market-driven factors could be large, causing<br />
measurable changes in income over time.<br />
• Prices are likely to be different across localities <strong>and</strong> across time. There<strong>for</strong>e, a higher income<br />
in a neighboring region could only mean that prices are higher there. Also, inflation can<br />
cause changes in household income. These issues cause problems with interpretation of<br />
differences in household income across communities or over time.<br />
• Lastly, measurement of changes in household income do not take into consideration other<br />
factors related to income such as purchasing power, savings, access to <strong>for</strong>mal or in<strong>for</strong>mal<br />
credit markets, access to resources from other family members or from non-family social<br />
networks.<br />
Value-Added<br />
A <strong>Guide</strong> <strong>for</strong> <strong>Monitoring</strong> <strong>and</strong> <strong>Evaluating</strong> <strong>Population</strong>-<strong>Health</strong>-Environment Programs 147
18<br />
Percent of households that earn income from new or alternative<br />
income-generating activities<br />
Level of Measurement: Outcome.<br />
Definition: This indicator measures the ability <strong>and</strong> willingness of communities to adopt new income<br />
generation activities taught by the project <strong>and</strong> whether the new livelihood activity has been successful<br />
in earning income <strong>for</strong> the household. Earned income could be an increase over time from the new<br />
activity or a one-time earning event based on a new income-generating activity.<br />
Calculation<br />
# of households that earn income from a new or alternative<br />
activity that either was not practiced the previous year or that the project introduced<br />
total # of households in the same area earning any income<br />
x 100<br />
Disaggregate: Type of income-generating activity.<br />
Value-Added<br />
Purpose: Diversification leads to capital asset accumulation, reduced economic vulnerability, <strong>and</strong><br />
promotes flexibility, resilience, <strong>and</strong> financial stability. Linking this indicator to the number of educational<br />
sessions provided <strong>and</strong> disaggregating by type of livelihood introduced can help demonstrate<br />
the project’s success. While educational sessions may be provided to one member of a household, the<br />
entire household benefits from the increase or reliability of income <strong>and</strong>/or from the addition of a new<br />
wage-earner.<br />
Data Sources: <strong>Population</strong>-based survey or project-records.<br />
Time frame: Every two to five years or after a one-time event.<br />
Data Collection Considerations: Surveys can be used to ask about previous <strong>and</strong> current income-generating<br />
activities. Project records can also be used to assess the changes in household income<br />
from a new or alternative income source. Whether or not people adopt new income-generating<br />
activities depends not just on the educational sessions <strong>and</strong> inputs they received but also depends on<br />
their time <strong>and</strong> resource constraints, infrastructure limitations, <strong>and</strong> cultural values. A breakdown by age<br />
<strong>and</strong> gender of the household members included in the activity would be useful.<br />
148<br />
Part Three: Indicators
Strengths & Limitations: This indicator is a measure of the outcome of the project’s ef<strong>for</strong>ts to<br />
introduce new, alternative <strong>and</strong> more sustainable livelihoods into the target community. However, this<br />
indicator measures only “yes/no” responses <strong>for</strong> whether a household is earning income from any new<br />
livelihood practice not used the previous year. This indicator does not account <strong>for</strong> long-term use practices,<br />
such as whether a household continues to use the new practice over time. It is also not necessarily<br />
the case that the new activity is better <strong>for</strong> the environment than the old activity or in regard to how<br />
much money the household earns.<br />
Value-Added<br />
A <strong>Guide</strong> <strong>for</strong> <strong>Monitoring</strong> <strong>and</strong> <strong>Evaluating</strong> <strong>Population</strong>-<strong>Health</strong>-Environment Programs 149
Glossary<br />
Activity — An activity is any specific action or event implemented to reach<br />
a target audience. Activities are what programs or projects use to produce<br />
outputs from inputs <strong>and</strong> ultimately achieve their objectives. Activities<br />
should be linked, focused, feasible, <strong>and</strong> appropriate. A given activity, when<br />
frequently repeated, can become an intervention or strategy.<br />
Bias — Bias is a systematic flaw in the collection or analysis of data that<br />
makes recorded results differ from actual results. Bias can be created accidentally<br />
or deliberately.<br />
Conceptual framework — A conceptual framework is a diagram that<br />
shows the relationships between important elements of a program, including<br />
inputs, processes, outputs, outcomes, <strong>and</strong> impacts.<br />
Data — Data are raw facts, observations, or numbers collected through<br />
M&E; <strong>for</strong> example, the responses to an individual survey, or the number<br />
of vaccinations recorded in health survey records. Data that have been analyzed<br />
or processed to be useful <strong>for</strong> program or project ef<strong>for</strong>ts are referred<br />
to as in<strong>for</strong>mation.<br />
Evaluation — Evaluation is the systematic application of quantitative or<br />
qualitative research techniques to determine the appropriateness <strong>and</strong> effectiveness<br />
of the design <strong>and</strong> implementation of a program. Evaluations<br />
determine whether programs are achieving their stated objectives <strong>and</strong>, ultimately,<br />
making a difference.<br />
Goal — A goal is a broad, long-term improvement or change that a program<br />
or project intends to make. Goals should be wider in scope than<br />
objectives.<br />
Impact — Impacts are the ultimate results or improvements that projects<br />
or programs attempt to achieve, such as a reduction in HIV/AIDS incidence<br />
or an increased life expectancy. These can also be referred to as<br />
long-term outcomes.<br />
Indicator — An indicator is a variable that measures one aspect of a program,<br />
project, or a specific population, health, or environmental outcome.<br />
Indicators should describe a specific behavior, concept, or phenomenon. To<br />
provide effective M&E, a program or project should have enough indicators<br />
to measure every important aspect of the program or project.<br />
A <strong>Guide</strong> <strong>for</strong> <strong>Monitoring</strong> <strong>and</strong> <strong>Evaluating</strong> <strong>Population</strong>-<strong>Health</strong>-Environment Programs 151
Input — Inputs are resources used or designated <strong>for</strong> a project or program.<br />
Input is the term used in the initial level of measurement along a logical<br />
continuum in achieving project or program results.<br />
Intervention — An intervention is a group of related activities <strong>and</strong> procedures<br />
intended to address a specific identified problem.<br />
Logic Model — A logic model is a systematic, visual way to present the underlying<br />
assumptions <strong>and</strong> theoretical framework of a planned program. It<br />
is a picture of why <strong>and</strong> how you believe a program will work. Typically, the<br />
process is represented in five steps: inputs, processes, outputs, outcomes,<br />
<strong>and</strong> impact.<br />
<strong>Monitoring</strong> — <strong>Monitoring</strong> is a process used to make sure that a program<br />
or project is being implemented in the way that was intended. <strong>Monitoring</strong><br />
involves routinely gathering <strong>and</strong> recording in<strong>for</strong>mation on how a program<br />
or project is being implemented.<br />
Objective — An objective is a desired result of a project or program that<br />
contributes to the achievement of goals. Objectives should be specific,<br />
measurable, attainable, relevant, <strong>and</strong> time-bound.<br />
Outcome — Outcomes are the changes to the population, environment, or<br />
health-system that result from a program or project, such as the percent of<br />
pregnant women vaccinated.<br />
Output — Outputs are the services or materials that project or program<br />
activities produce, such as the number of trees planted or iron supplements<br />
distributed.<br />
<strong>Population</strong>-based survey — A population-based survey is a st<strong>and</strong>ardized,<br />
quantitative method of data collection. Formal surveys collect data<br />
on samples of individuals or groups of people who have been r<strong>and</strong>omly<br />
chosen <strong>and</strong> identified.<br />
Process — Process is the procedure that a project or program uses to achieve<br />
results <strong>and</strong> refers to the operational level of measurement in achieving outputs<br />
<strong>and</strong> outcomes.<br />
Program — A program is a combination of interventions or activities that<br />
an organization establishes as a fundamental part of its structure <strong>and</strong> mis-<br />
152
sion. Organizations develop programs consistent with their missions <strong>and</strong><br />
policies. A program may consist of several different projects.<br />
Project — A project is a combination of interventions or activities that an<br />
organization has established in response to specific circumstances or needs.<br />
Projects tend to have a definitive start <strong>and</strong> end date.<br />
Qualitative techniques — Qualitative techniques tend to answer “how” or<br />
“why” questions. Common qualitative techniques <strong>for</strong> M&E include focus<br />
groups, in-depth interviews, <strong>and</strong> observation.<br />
Quantitative techniques — Quantitative techniques tend to answer “how<br />
much” or “how many” questions. Structured interviews <strong>and</strong> service statistics<br />
are two common quantitative techniques <strong>for</strong> M&E.<br />
Results framework — A results framework is a diagram of program per<strong>for</strong>mance<br />
that begins with a program goal, which leads to multiple strategic<br />
objectives, which in turn lead to outcomes, <strong>and</strong> ultimately to impacts.<br />
Each step in a results framework should have one or more specific indicators<br />
to measure that step’s progress or status.<br />
A <strong>Guide</strong> <strong>for</strong> <strong>Monitoring</strong> <strong>and</strong> <strong>Evaluating</strong> <strong>Population</strong>-<strong>Health</strong>-Environment Programs 153
Bibliography<br />
ARD, Inc. Biodiversity Conservation: A <strong>Guide</strong> <strong>for</strong> USAID Staff <strong>and</strong><br />
Partners. Burlington, VT: ARD, Inc.; 2005.<br />
ARD, Inc. Nepal Natural Resource User Groups/<strong>Population</strong>, <strong>Health</strong> <strong>and</strong><br />
Environment Assessment. Report <strong>for</strong> U.S. Agency <strong>for</strong> International<br />
Development. Burlington, VT: ARD, Inc.; 2006.<br />
ARD, Inc. Opportunities in <strong>Population</strong> <strong>and</strong> <strong>Health</strong> <strong>for</strong> Community Forest<br />
User Groups in Nepal. Report <strong>for</strong> U.S. Agency <strong>for</strong> International<br />
Development. Burlington, VT: ARD, Inc.; 2006.<br />
Baumann, P. Improving Access to Natural Resources <strong>for</strong> the Rural Poor:<br />
A Critical Analysis of Central Concepts <strong>and</strong> Emerging Trends from<br />
a Sustainable Livelihoods Perspective. Washington, DC: Food <strong>and</strong><br />
Agriculture Organization of the United States; 2002. Available at:<br />
www.fao.org/docrep/006/ad683e/ad683e00.HTM Accessed May 3,<br />
2007.<br />
Bertr<strong>and</strong> JT, Escudero G. Compendium of Indicators <strong>for</strong> <strong>Evaluating</strong> Reproductive<br />
<strong>Health</strong> Programs. Chapel Hill, NC, USA: MEASURE<br />
Evaluation, University of North <strong>Carolina</strong> at Chapel Hill; 2002.<br />
Bertr<strong>and</strong> JT, Magnani RJ, Rutenberg N. <strong>Evaluating</strong> Family Planning Programs<br />
with Adaptations <strong>for</strong> Reproductive <strong>Health</strong>. Chapel Hill, NC,<br />
USA: The EVALUATION Project, <strong>Carolina</strong> <strong>Population</strong> Center,<br />
University of North <strong>Carolina</strong> at Chapel Hill; 1996.<br />
Bertr<strong>and</strong> JT, Magnani RJ, Rutenberg N. H<strong>and</strong>book of Indicators <strong>for</strong> Family<br />
Planning Program Evaluation. Chapel Hill, NC: The EVALU-<br />
ATION Project, <strong>Carolina</strong> <strong>Population</strong> Center, University of North<br />
<strong>Carolina</strong> at Chapel Hill; 1994.<br />
Bertr<strong>and</strong> J, Solis M. <strong>Evaluating</strong> HIV/AIDS Prevention Products: A Manual<br />
<strong>for</strong> Nongovernmental Organizations. Chapel Hill, NC: <strong>Carolina</strong><br />
<strong>Population</strong> Center, University of North <strong>Carolina</strong> at Chapel Hill;<br />
2000.<br />
Billig P, Bendahmane D, Swindale A. Water <strong>and</strong> Sanitation Indicators<br />
Measurement <strong>Guide</strong>. Washington, DC: Food <strong>and</strong> Nutrition Technical<br />
Assistance Project; 1999.<br />
A <strong>Guide</strong> <strong>for</strong> <strong>Monitoring</strong> <strong>and</strong> <strong>Evaluating</strong> <strong>Population</strong>-<strong>Health</strong>-Environment Programs 155
Buckles D, Rusnak G. Conflict <strong>and</strong> Collaboration in Natural Resource<br />
Management. New York: United Nations Online Network in Public<br />
Administration <strong>and</strong> Finance; 2006. Available at: unpan1.un.org/intradoc/groups/public/documents/APCITY/UNPAN022242.pdf.<br />
Accessed May 3, 2007.<br />
Buff J. Planting Seeds, Meeting Needs: Measuring Progress in Community-Based<br />
Conservation <strong>and</strong> Reproductive <strong>Health</strong>. 2002 Meeting<br />
Report. Washington, DC: <strong>Population</strong> Action International; 2003.<br />
Center <strong>for</strong> International Forestry Research (CIFOR). The Criteria <strong>and</strong> Indicators<br />
Generic Template. From The Criteria <strong>and</strong> Indicators Toolbox<br />
Series. Bogor, Indonesia: CIFOR; 1999.<br />
Center <strong>for</strong> International Forestry Research (CIFOR). Scoring <strong>and</strong> Analysis<br />
<strong>Guide</strong> <strong>for</strong> Assessing Human Well-Being. From The Criteria <strong>and</strong><br />
Indicators Toolbox Series. Bogor, Indonesia: Center <strong>for</strong> International<br />
Forestry Research; 1999.<br />
Centro Médico de Orientación y Planificación Familiar (CEMOPLAF).<br />
Integration of <strong>Population</strong> <strong>and</strong> Environment II: Ecuador Case Study.<br />
Oklahoma City, OK: World Neighbors; 1999.<br />
Coates J, Swindale A, Bilinsky P. Household Food Insecurity Access Scale<br />
(HFIAS) <strong>for</strong> Measurement of Food Access: Indicator <strong>Guide</strong>. Washington,<br />
DC: Food <strong>and</strong> Nutrition Technical Assistance Project; 2006.<br />
Conservation International. Combining Conservation <strong>and</strong> Care: Incorporating<br />
Gender into <strong>Population</strong> Environment Projects. Arlington,<br />
Virginia: Conservation International; 2005.<br />
Conservation International. Combining Conservation <strong>and</strong> Care: Promoting<br />
Alternative Livelihoods. Arlington, VA: Conservation International;<br />
2005.<br />
Conservation International. Conserving Earth’s Living Heritage: A Proposed<br />
Framework <strong>for</strong> Designing Biodiversity Conservation Strategies.<br />
Arlington, VA: Conservation International; 2004.<br />
Conservation International. FY04 Per<strong>for</strong>mance <strong>Monitoring</strong> Plan <strong>for</strong><br />
USAID/EGAT Biodiversity Program. Arlington, VA: Conservation<br />
International; 2005.<br />
156
Conservation International, <strong>Population</strong>-<strong>Health</strong>-Environment Program.<br />
Results Framework <strong>and</strong> Per<strong>for</strong>mance <strong>Monitoring</strong> Plan. Arlington,<br />
VA: Conservation International; 2006.<br />
Conservation International/Cambodia, <strong>Population</strong>-<strong>Health</strong>-Environment<br />
Program. <strong>Health</strong>y Families, <strong>Health</strong>y Forests: Combining Reproductive<br />
<strong>Health</strong> with Biodiversity Protection <strong>for</strong> Effective Programming.<br />
Arlington, VA: Conservation International; 2005.<br />
Conservation Measures Partnership. Open St<strong>and</strong>ards <strong>for</strong> the Practice of<br />
Conservation. Bethesda, MD: Conservation Measures Partnership;<br />
2004.<br />
Demers C, Hawkins L, Long A, McKelvy C. Providing Wildlife Cover.<br />
Gainesville, FL: University of Florida; 2001. Available at: edis.ifas.<br />
ufl.edu/pdffiles/FR/FR12400.pdf. Accessed May 3, 2007.<br />
Diskin P. Agricultural Productivity Indicators Measurement <strong>Guide</strong>. Washington,<br />
DC: Food <strong>and</strong> Nutrition Technical Assistance Project; 1997.<br />
Environmental Indicators Working Group. Per<strong>for</strong>mance <strong>Monitoring</strong> of<br />
USAID Environmental Programs: An Introduction to Per<strong>for</strong>mance<br />
<strong>Monitoring</strong> <strong>and</strong> a Review of Current Best Practice. Washington,<br />
D.C: U.S. Agency <strong>for</strong> International Development; 1998.<br />
Fujita, RM. Marine Protected Areas <strong>for</strong> Protecting Biological Diversity,<br />
Ecosystem Integrity, <strong>and</strong> Sustainable Fisheries. Testimony presented<br />
to U.S. Commission on Ocean Policy, April 19, 2002, Los Angeles,<br />
CA. Available at: www.oceancommission.gov/meetings/apr18_19_<br />
02/fujita_statement.pdf. Accessed May 3, 2007.<br />
Gibson E. Fuel Stoves: Out of the Woodshed at Last. Berkley, CA: Ecoworld;<br />
2002. Available at: www.ecoworld.com/home/articles2.<br />
cfm?tid=321. Accessed May 2, 2007.<br />
Gage AJ, Ali D, Suzuki C. A <strong>Guide</strong> <strong>for</strong> <strong>Monitoring</strong> <strong>and</strong> <strong>Evaluating</strong> Child<br />
<strong>Health</strong> Programs. Chapel Hill, NC: MEASURE Evaluation, University<br />
of North <strong>Carolina</strong> at Chapel Hill; 2005.<br />
Gottret MV, White D. Assessing the Impact of Integrated Natural Resource<br />
Management: Challenges <strong>and</strong> Experiences. Conserv Ecol.<br />
2000:5(2):17.<br />
A <strong>Guide</strong> <strong>for</strong> <strong>Monitoring</strong> <strong>and</strong> <strong>Evaluating</strong> <strong>Population</strong>-<strong>Health</strong>-Environment Programs 157
Integrated <strong>Population</strong> <strong>and</strong> Coastal Resource Management (IPOPCoRM).<br />
IPopCoRM BMS Questions <strong>for</strong> Round 1. Makati City, Philippines:<br />
Path Foundation Philippines Inc; 2001.<br />
Integrated <strong>Population</strong> <strong>and</strong> Coastal Resource Management (IPOPCoRM).<br />
Logical Framework <strong>for</strong> IPOPCoRM Initiative-Philippines. Makati<br />
City, Philippines: Path Foundation Philippines Inc; 2001.<br />
International Fund <strong>for</strong> Agricultural Development (IFAD). Why Women<br />
Should Be Included in Village Natural Resource Management Organizations.<br />
Rome, IFAD; 2007. Available at: www.ifad.org/gender/<br />
learning/project/part/p_nrm.htm. Accessed May 3, 2007.<br />
Jane Goodall Institute. Assessment of the Lake Tanganyika Catchment,<br />
Re<strong>for</strong>estation <strong>and</strong> Education (TACARE) Project, 2004. San Francisco:<br />
Jane Goodall Institute; 2005.<br />
Jendry C, Barakabuye N. Building a Better Stove; Saving a Bigger Rain<strong>for</strong>est.<br />
Powell, OH, USA: Columbus Zoo <strong>and</strong> Aquarium; 2006. Available<br />
at: www.colszoo.org/conservation/2006/rw<strong>and</strong>a.html. Accessed<br />
May 2, 2007.<br />
Joint United Nations Programme on HIV/AIDS (UNAIDS). MERG<br />
<strong>Monitoring</strong> <strong>and</strong> Evaluation Modules. Geneva: UNAIDS; 2002.<br />
Kelleher G, Recchia C. Marine Protected Areas. PARKS. 1998;8:2. Available<br />
at: www.iucn.org/themes/wcpa/pubs/pdfs/PARKS/Parks_<br />
Jun98.pdf. Accessed May 3, 2007.<br />
Kleinau E, Rosenzweig F, Tain F. Integration of <strong>Population</strong> <strong>and</strong> Environment<br />
Programs in Madagascar. Activity Report 115. Environmental<br />
<strong>Health</strong> Project. Washington, DC: Environmental <strong>Health</strong> Project;<br />
2002.<br />
Kleinau E, Talbot J. When the Whole is Greater than the Sum of it Parts:<br />
Integrated Indicators <strong>for</strong> <strong>Population</strong>-Environment Programs. Washington,<br />
DC: Environmental Change <strong>and</strong> Security Project, Woodrow<br />
Wilson Center; 2003.<br />
Lauren P. Chome Ward Fuel Efficient Stove Survey Follow-up. Arusha,<br />
Kenya: UNDP/GEF East African Cross Borders Biodiversity Project;<br />
2002. Available at www.xborderbiodiversity.org/dc<strong>for</strong>um/User_files/<br />
Chome_FuelwoodFollowups_Aug2002.pdf. Accessed May 2, 2007.<br />
158
Madin, LP. Fisheries, Oceanography <strong>and</strong> Society: Marine Protected Areas,<br />
Introduction. Woods Hole, MA: Ocean Life Institute; 2001. Available<br />
at: www.whoi.edu/institutes/oli/activities/symposia_marineprotected.htm.<br />
Accessed May 3, 2007.<br />
Maohua M. Species Richness vs Evenness: Independent Relationship <strong>and</strong><br />
Different Responses to Edaphic Factors. Oikos. 2005:111(1);192-<br />
198.<br />
Margoluis R, Salafsky N. Is Our Project Succeeding? A <strong>Guide</strong> to Threat<br />
Reduction Assessment <strong>for</strong> Conservation. Washington, DC: Biodiversity<br />
Support Program; 2001.<br />
Margoluis R, Salafsky N. Measures of Success: Designing, Managing, <strong>and</strong><br />
<strong>Monitoring</strong> Conservation <strong>and</strong> Development Projects. New York: Isl<strong>and</strong><br />
Press, 1998.<br />
MEASURE Evaluation. Quick Investigation of Quality (QIQ): A User’s<br />
<strong>Guide</strong> <strong>for</strong> <strong>Monitoring</strong> Quality of Care in Family Planning. Chapel<br />
Hill, NC, USA: MEASURE Evaluation, University of North <strong>Carolina</strong><br />
at Chapel Hill; 2001.<br />
Melnyk M. An Ounce of Prevention: Making the Link between <strong>Health</strong><br />
<strong>and</strong> Prevention.Washington, DC: World Wildlife Federation; 2001.<br />
Mock G. Can We Conserve Ecosystems by Fighting Poverty? Arlington,<br />
VA, USA: The Nature Conservancy; 2006. Available at: www.nature.<br />
org/magazine/summer2006/features/art17782.html. Accessed May<br />
3, 2007.<br />
New Mexico-Texas Water Commission. Biological Resources Technical<br />
Report: Wildlife Habitat Value <strong>and</strong> Use. El Paso, TX: New Mexico-Texas<br />
Water Commission; 2000. Available at: www.nm-txwatercomm.org/library/TechReports/Biological/Text/BIO_8.pdf.<br />
Accessed<br />
May 3, 2007.<br />
Oldham J. Rethinking the Link: A Critical Review of <strong>Population</strong>-Environment<br />
Programs. Amherst, MA: <strong>Population</strong> <strong>and</strong> Development<br />
Program at Hampshire College <strong>and</strong> Political Economy Research Institute<br />
at University of Massachusetts; 2006. Available at: popdev.<br />
hampshire.edu/publications/PE_oldham_06.pdf. Accessed February<br />
27, 2007.<br />
A <strong>Guide</strong> <strong>for</strong> <strong>Monitoring</strong> <strong>and</strong> <strong>Evaluating</strong> <strong>Population</strong>-<strong>Health</strong>-Environment Programs 159
Pielemeier J. A Review of PHE Programs Supported by the Packard Foundation<br />
<strong>and</strong> USAID’s First Generation <strong>Population</strong>-Environment Projects.<br />
Washington, DC: Woodrow Wilson Center. 2005. Available at:<br />
www.wilsoncenter.org/index.cfm?topic_id=1413&fuseaction=topics.<br />
event_summary&event_id=143972. Accessed February 27, 2007.<br />
Ribaira Y. Per<strong>for</strong>mance <strong>Monitoring</strong> Plan 2002-2005: Madagascar Green<br />
<strong>Health</strong>y Communities Project. Boston, MA, USA: John Snow, Inc;<br />
2003.<br />
Riely F, Mock N, Cogill B, Bailey L, Kenefick E. Food Security Indicators<br />
<strong>and</strong> Framework <strong>for</strong> Use in the <strong>Monitoring</strong> <strong>and</strong> Evaluation of Food<br />
Aid Programs. Washington, DC: Food <strong>and</strong> Nutrition Technical Assistance<br />
Project; 1999.<br />
Segnestam L. Indicators of Environment <strong>and</strong> Sustainable Development:<br />
Theories <strong>and</strong> Practical Experience. Washington, DC: The World<br />
Bank; 2002.<br />
Senderowitz J. Making Reproductive <strong>Health</strong> Services Youth Friendly. Research,<br />
Program <strong>and</strong> Policy Series. Washington, DC: FOCUS on<br />
Young Adults, Pathfinder International; 1999. Available at: www.<br />
dec.org/pdf_docs/PNACK127.pdf. Accessed February 28, 2007.<br />
Shastri C, Sangeetha G, Ravindranath, N. Dissemination of Efficient AS-<br />
TRA Stove: Case Study of a Successful Entreprenuer in Sirsi, India.<br />
Letter. Energy Sustain Devel. 2002;2(2):63-67.<br />
Shyamsundar P. Poverty-Environment Indicators. Environmental Economics<br />
Series, Paper No. 84. Washington, DC: The World Bank Environment<br />
Department; 2002.<br />
United Kingdom Butterfly <strong>Monitoring</strong> Scheme (UKBMS). <strong>Monitoring</strong><br />
Butterfly Numbers by the Transect Method – Summary In<strong>for</strong>mation<br />
<strong>for</strong> Recorders. Dorset, UK: UKBMS; 2006. Available at: www.<br />
ukbms.org/resources.htm. Accessed May 2, 2007.<br />
U.S. Agency <strong>for</strong> International Development (USAID). Fragile States<br />
Strategy. Washington, DC: USAID; 2005.<br />
U.S. Agency <strong>for</strong> International Development (USAID). Madagascar SO 5<br />
<strong>Health</strong> <strong>Population</strong> <strong>and</strong> Nutrition Per<strong>for</strong>mance Management Plan,<br />
2003-2008. Washington, DC: USAID; 2005.<br />
160
U.S. Agency <strong>for</strong> International Development (USAID). USAID/Madagascar<br />
Environment/Rural Development S06 Program. Washington,<br />
DC: USAID; 2006.<br />
U.S. Agency <strong>for</strong> International Development (USAID). SanteNet Madagascar<br />
Per<strong>for</strong>mance <strong>Monitoring</strong> Plan, 2005. Antananarivo, Madagascar:<br />
USAID; 2005.<br />
U.S. Agency <strong>for</strong> International Development (USAID). Strategic Framework<br />
<strong>for</strong> Africa <strong>and</strong> Annexes. Washington, DC: USAID; 2005.<br />
Voahary Salama. Manuel de Suivi et D’Evaluation du Programme Sante-<br />
<strong>Population</strong>-Environnement. Ambohidahy, Madagascar: Voahary<br />
Salama; 2007.<br />
Vogel CG, Engelman R. Forging the Link: Emerging Accounts of <strong>Population</strong><br />
<strong>and</strong> Environment Work in Communities. Washington, DC:<br />
<strong>Population</strong> Action International; 1999.<br />
Wallmo K, Jacobson S. A Social <strong>and</strong> Environmental Evaluation of Fuel<br />
Efficient Cook-Stoves <strong>and</strong> Conservation in Ug<strong>and</strong>a. Envir Conserv.<br />
1998; 25:99-108.<br />
Wolf D. Sudan: Rapidly Exp<strong>and</strong>ing the Use of Fuel-Efficient Stoves in Darfur.<br />
Washington, DC: Refugees International; 2005. Available at: www.<br />
refugeesinternational.org/content/article/detail/7099/. Accessed<br />
May 2, 2007.<br />
World Bank Operations Evaluation Department. <strong>Monitoring</strong> <strong>and</strong> Evaluation:<br />
Some Tools, Methods & Approaches. Washington, DC: World<br />
Bank, 2004.<br />
World <strong>Health</strong> Organization (WHO). <strong>Health</strong> <strong>and</strong> Environment: Tools<br />
<strong>for</strong> Effective Decision-Making. The WHO-UNEP <strong>Health</strong> <strong>and</strong> Environment<br />
Linkages Initiative. Review of Initial Findings. Geneva:<br />
WHO; 2005.<br />
World Wildlife Fund (WWF) International. Are Protected Areas Working?<br />
An analysis of Forest Protected areas by WWF. Washington,<br />
DC: WWF International; 2005.<br />
World Wildlife Fund (WWF). Marine Protected Areas – Providing a Future<br />
<strong>for</strong> Fish <strong>and</strong> People. Washington, DC: WWF; 2005. Available<br />
A <strong>Guide</strong> <strong>for</strong> <strong>Monitoring</strong> <strong>and</strong> <strong>Evaluating</strong> <strong>Population</strong>-<strong>Health</strong>-Environment Programs 161
at: www.p<strong>and</strong>a.org/news_facts/publications/index.cfm?uNewsID=2<br />
1432&uLangID=1. Accessed May 3, 2007.<br />
World Wildlife Fund (WWF). Sourcebook <strong>for</strong> WWF St<strong>and</strong>ards. Washington,<br />
DC: WWF; 2005.<br />
World Wildlife Fund (WWF). Successful Communities from Ridge to<br />
Reef: Per<strong>for</strong>mance <strong>Monitoring</strong> Plan 2003-2006. Washington, DC:<br />
WWF; 2006.<br />
162
MEASURE Evaluation<br />
<strong>Carolina</strong> <strong>Population</strong> Center<br />
The University of North <strong>Carolina</strong> at Chapel Hill<br />
206 W. Franklin St., CB8120<br />
Chapel Hill, NC 27516 USA<br />
www.cpc.unc.edu/measure<br />
MS-07-25


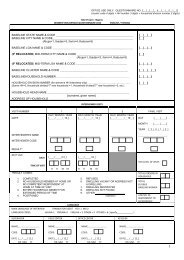
![questionnaire no: [__|__|__|__|__|__|__|__|__] - Measurement ...](https://img.yumpu.com/22729956/1/184x260/questionnaire-no-measurement-.jpg?quality=85)
![questionnaire serial no:[__|__|__|__] - Your Resource for Urban ...](https://img.yumpu.com/10870216/1/184x260/questionnaire-serial-no-your-resource-for-urban-.jpg?quality=85)