Agriculture, food and water - FAO.org
Agriculture, food and water - FAO.org
Agriculture, food and water - FAO.org

Create successful ePaper yourself
Turn your PDF publications into a flip-book with our unique Google optimized e-Paper software.
AGRICULTURE, FOOD AND WATER<br />
3<br />
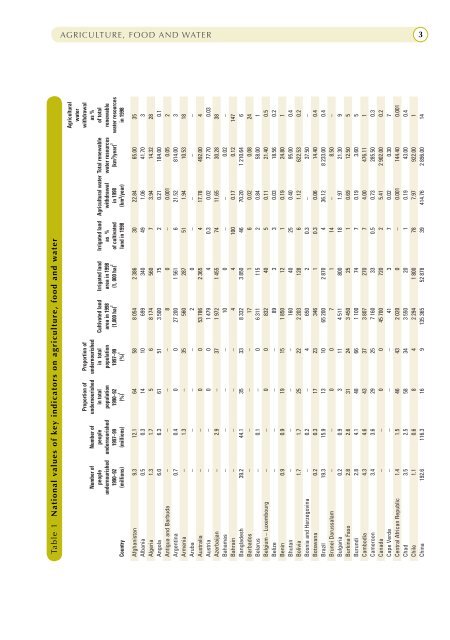
Table 1 National values of key indicators on agriculture, <strong>food</strong> <strong>and</strong> <strong>water</strong><br />
Agricultural<br />
<strong>water</strong><br />
Proportion of Proportion of<br />
withdrawal<br />
Number of Number of undernourished undernourished<br />
as %<br />
people people in total<br />
in total Cultivated l<strong>and</strong> Irrigated l<strong>and</strong> Irrigated l<strong>and</strong> Agricultural <strong>water</strong> Total renewable of total<br />
undernourished undernourished population population area in 1998 area in 1998 as % withdrawal <strong>water</strong> resources renewable<br />
1990–92 1997–99 1990–92 1997–99 (1,000 ha) 2 (1, 000 ha) 2 of cultivated in 1998 (km 3 /year) 3 <strong>water</strong> resources<br />
Country (millions) (millions) (%) 1 (%) 1 l<strong>and</strong> in 1998 (km 3 /year) in 1998<br />
Afghanistan 9.3 12.1 64 58 8 054 2 386 30 22.84 65.00 35<br />
Albania 0.5 0.3 14 10 699 340 49 1.06 41.70 3<br />
Algeria 1.3 1.7 5 6 8 174 560 7 3.94 14.32 28<br />
Angola 6.0 6.3 61 51 3 500 75 2 0.21 184.00 0.1<br />
Antigua <strong>and</strong> Barbuda – – – – 8 0 – 0.001 0.05 2<br />
Argentina 0.7 0.4 0 0 27 200 1 561 6 21.52 814.00 3<br />
Armenia – 1.3 – 35 560 287 51 1.94 10.53 18<br />
Aruba – – – – 2 0 – – – –<br />
Australia – – 0 0 53 786 2 365 4 17.78 492.00 4<br />
Austria – – 0 0 1 479 4 0.3 0.02 77.70 0.03<br />
Azerbaijan – 2.9 – 37 1 972 1 455 74 11.65 30.28 38<br />
Bahamas – – – – 10 0 – – 0.02 –<br />
Bahrain – – – – 4 4 100 0.17 0.12 147<br />
Bangladesh 39.2 44.1 35 33 8 332 3 850 46 70.20 1 210.64 6<br />
Barbados – – – – 17 1 6 0.02 0.08 24<br />
Belarus – 0.1 – 0 6 311 115 2 0.84 58.00 1<br />
Belgium – Luxembourg – – 0 0 832 40 5 0.11 21.40 0.5<br />
Belize – – – – 89 3 3 0.03 18.56 0.2<br />
Benin 0.9 0.9 19 15 1 850 12 1 0.19 24.80 1<br />
Bhutan – – – – 160 40 25 0.40 95.00 0.4<br />
Bolivia 1.7 1.7 25 22 2 203 128 6 1.12 622.53 0.2<br />
Bosnia <strong>and</strong> Herzegovina – 0.2 – 4 650 2 0.3 – 37.50 –<br />
Botswana 0.2 0.3 17 23 346 1 0.3 0.06 14.40 0.4<br />
Brazil 19.3 15.9 13 10 65 200 2 870 4 36.12 8 233.00 0.4<br />
Brunei Darussalam – – 0 0 7 1 14 – 8.50 –<br />
Bulgaria 0.2 0.9 3 11 4 511 800 18 1.97 21.30 9<br />
Burkina Faso 2.8 2.6 31 24 3 450 25 1 0.69 12.50 5<br />
Burundi 2.8 4.1 48 66 1 100 74 7 0.19 3.60 5<br />
Cambodia 4.3 4.6 43 37 3 807 270 7 4.00 476.11 1<br />
Cameroon 3.4 3.6 29 25 7 160 33 0.5 0.73 285.50 0.3<br />
Canada – – 0 0 45 700 720 2 5.41 2 902.00 0.2<br />
Cape Verde – – – – 41 3 7 0.02 0.30 7<br />
Central African Republic 1.4 1.5 46 43 2 020 0 – 0.001 144.40 0.001<br />
Chad 3.5 2.5 58 34 3 550 20 1 0.19 43.00 0.4<br />
Chile 1.1 0.6 8 4 2 294 1 800 78 7.97 922.00 1<br />
China 192.6 116.3 16 9 135 365 52 878 39 414.76 2 896.00 14