Agriculture, food and water - FAO.org
Agriculture, food and water - FAO.org
Agriculture, food and water - FAO.org

You also want an ePaper? Increase the reach of your titles
YUMPU automatically turns print PDFs into web optimized ePapers that Google loves.
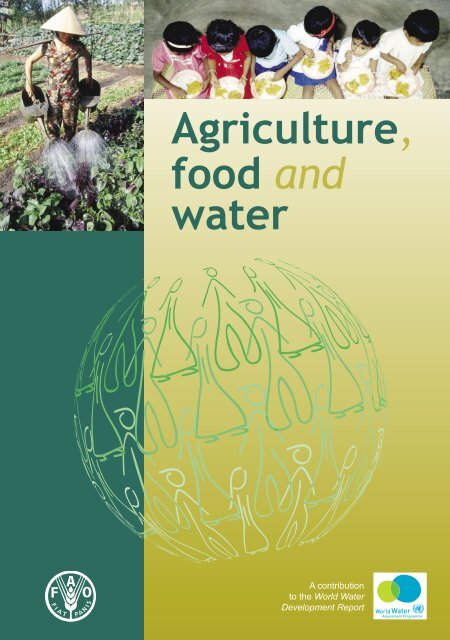
<strong>Agriculture</strong>,<br />
<strong>food</strong> <strong>and</strong><br />
<strong>water</strong><br />
A contribution<br />
to the World Water<br />
Development Report
<strong>Agriculture</strong>,<br />
<strong>food</strong> <strong>and</strong><br />
<strong>water</strong><br />
A contribution<br />
to the World Water<br />
Development Report
The designations employed <strong>and</strong> the presentation of material in this<br />
information product do not imply the expression of any opinion<br />
whatsoever on the part of the Food <strong>and</strong> <strong>Agriculture</strong> Organization of<br />
the United Nations concerning the legal status of any country,<br />
territory, city or area or of its authorities, or concerning the delimitation<br />
of its frontiers or boundaries.<br />
92-5-104943-2<br />
All rights reserved. Except for the quotation of short passages for the<br />
purpose of criticism <strong>and</strong> review, no part of this publication may be<br />
reproduced in any form or by any means, electronic or mechanical,<br />
including photocopying, recording, or any information storage <strong>and</strong> retrieval<br />
system now known or to be invented, without written permission of<br />
UNESCO-WWAP.<br />
© <strong>FAO</strong> 2003, for the present edition
AGRICULTURE, FOOD AND WATER<br />
iii<br />
Preface<br />
Food <strong>and</strong> agriculture are by far the largest consumers of <strong>water</strong>. They require one thous<strong>and</strong> times<br />
more than we use to drink <strong>and</strong> one hundred times more than we use to meet basic personal needs,<br />
with up to 70 percent of the <strong>water</strong> we take from rivers <strong>and</strong> ground<strong>water</strong> going into irrigation.<br />
Global <strong>food</strong> production has kept pace with population growth in recent decades; yet nearly 800<br />
million people remain undernourished, <strong>and</strong> the population shift from rural to urban environments<br />
will certainly increase the pressures <strong>and</strong> problems associated with <strong>food</strong> security. A growing<br />
population will need more <strong>food</strong> <strong>and</strong> thus more <strong>water</strong>. What is the status of <strong>food</strong> production in the<br />
world? How can it be made more efficient without compromising the environment? What are the<br />
contributions from rainfed <strong>and</strong> irrigated agriculture <strong>and</strong> from fisheries? What role does the market<br />
play? What is the connection between <strong>food</strong> security <strong>and</strong> poverty? These questions are discussed in<br />
this publication. However, the question remains whether we shall rise to the challenge of feeding<br />
the world’s hungry by being more efficient <strong>and</strong> productive in our use of <strong>water</strong> while still respecting<br />
the resource base <strong>and</strong> dem<strong>and</strong>s from competing sectors.
iv<br />
AGRICULTURE, FOOD AND WATER<br />
Acknowledgements<br />
This publication is based on Water for people – Water for life, the United Nations World Water<br />
Development Report ©UNESCO–WWAP 2003, where it appears as Chapter 8 “Securing <strong>food</strong> for<br />
a growing population”. The World Water Development Report was published jointly in 2003 by<br />
the United Nations Educational, Scientific <strong>and</strong> Cultural Organization (UNESCO) <strong>and</strong> Berghahn<br />
Books. A slightly modified version of Chapter 8 of the report is reproduced here by permission of<br />
UNESCO.<br />
The World Water Development Report, prepared under the overall coordination of Gordon<br />
Young, is a joint report by the United Nations Agencies concerned with fresh<strong>water</strong>. This chapter<br />
was prepared by Wulf Klohn, with inputs <strong>and</strong> support from Jean-Marc Faurès, Domitille Vallée,<br />
Åse Eliasson, Jippe Hoogeveen <strong>and</strong> Jacob Burke, <strong>FAO</strong>, L<strong>and</strong> <strong>and</strong> Water Development Division,<br />
<strong>and</strong> with contributions from Uwe Barg, Jelle Bruinsma, Gerold Boedeker, Robert Bos, Andy<br />
Bullock, Karen Frenken, David Molden <strong>and</strong> David Smith. Annex 1 on the right to adequate <strong>food</strong><br />
<strong>and</strong> the right to <strong>water</strong> was prepared by Kerstin Mechlem.<br />
Special thanks are due to Simone Morini for the design <strong>and</strong> layout of this publication.<br />
Credits for cover images are:<br />
<strong>FAO</strong>/17011/G. Bizzarri<br />
<strong>FAO</strong>/16242/P. Johnson
AGRICULTURE, FOOD AND WATER<br />
v<br />
Table of<br />
contents<br />
Preface<br />
Acknowledgements<br />
Acronyms<br />
The world <strong>water</strong> development report<br />
iii<br />
iv<br />
vii<br />
viii<br />
Chapter one – Introduction 1<br />
Chapter two – How the world is fed 9<br />
The world <strong>food</strong> system: sustained improvement in <strong>food</strong> availability 9<br />
The main source of <strong>food</strong> supply 11<br />
Major crops 11<br />
The prominent role of cereals <strong>and</strong> oil crops 11<br />
Source of growth in crop production 12<br />
Livestock: an increasing role 13<br />
Fisheries <strong>and</strong> the growing importance of aquaculture 13<br />
Food trade 14<br />
Developing countries are increasing their imports 14<br />
The concept of virtual <strong>water</strong> 15<br />
Chapter three – The use of <strong>water</strong> in agriculture 17<br />
Water for <strong>food</strong> production 17<br />
Food production: the dominant role of rainfed agriculture 18<br />
Role of irrigation in <strong>food</strong> production 18<br />
Future investments in irrigation 21<br />
Water use efficiency 22<br />
Future <strong>water</strong> withdrawals for irrigation 25<br />
The special role of ground<strong>water</strong> 25
vi<br />
AGRICULTURE, FOOD AND WATER<br />
Chapter four – Ensuring access to <strong>food</strong> for all 29<br />
The markets fail to provide <strong>food</strong> for all 29<br />
The undernourished: where, who, <strong>and</strong> why? 30<br />
The role of irrigation in alleviating poverty <strong>and</strong> improving <strong>food</strong> security 32<br />
Managing agricultural risk for sustainable livelihoods 33<br />
Irrigation contributes to creating off-farm employment 34<br />
The contribution of fisheries <strong>and</strong> aquaculture to <strong>food</strong> security 34<br />
Forestry <strong>and</strong> <strong>food</strong> security 36<br />
Chapter five – Trends in irrigation-<strong>water</strong> management 37<br />
Adapting institutional arrangements 37<br />
Increasing private investments in irrigation 38<br />
Reforming irrigation: modernization <strong>and</strong> empowerment 38<br />
Equity in the roles of men <strong>and</strong> women in irrigation 39<br />
Improving <strong>water</strong>-use productivity in agriculture 40<br />
Diversifying crops 40<br />
Chapter six – Agricultural <strong>water</strong> use, environment <strong>and</strong> health 43<br />
Environmental aspects 43<br />
Water-quality deterioration 44<br />
Health <strong>and</strong> irrigation 45<br />
Chapter seven – Conclusions 47<br />
References 49<br />
Annex one – The right to adequate <strong>food</strong> <strong>and</strong> the right to <strong>water</strong> 53<br />
The legal basis of the right to adequate <strong>food</strong> <strong>and</strong> the right to <strong>water</strong> 53<br />
The right to adequate <strong>food</strong> 53<br />
The right to <strong>water</strong> 54<br />
States’ obligations 54<br />
Outlook 55<br />
Annex two – Related global assessment publications 57<br />
Annex three – Some useful Web sites 61
AGRICULTURE, FOOD AND WATER<br />
vii<br />
Acronyms<br />
AQUASTAT<br />
DAC<br />
<strong>FAO</strong><br />
GDP<br />
GIS<br />
GNP<br />
IFAD<br />
IIED<br />
IWMI<br />
IWRM<br />
NEPAD<br />
NGO<br />
OECD<br />
OMVS<br />
UN<br />
UNESCO<br />
WCD<br />
WHO<br />
WWAP<br />
WWDR<br />
<strong>FAO</strong>’s information system on <strong>water</strong> <strong>and</strong> agriculture<br />
Development Assistance Committee (OECD Department)<br />
Food <strong>and</strong> <strong>Agriculture</strong> Organization of the United Nations<br />
Gross Domestic Product<br />
Geographic Information Systems<br />
Gross National Product<br />
International Fund for <strong>Agriculture</strong> <strong>and</strong> Development<br />
International Institute for Environment <strong>and</strong> Development<br />
International Water Management Institute<br />
Integrated Water Resources Management<br />
New Partnership for Africa’s Development<br />
Non-governmental Organization<br />
Organization for Economic Cooperation <strong>and</strong> Development<br />
Organization for the Development of the Senegal River<br />
(Organisation pour la mise en valeur du fleuve Sénégal)<br />
United Nations<br />
United Nations Educational, Scientific <strong>and</strong> Cultural Organization<br />
World Commission on Dams<br />
World Health Organization<br />
World Water Assessment Programme<br />
World Water Development Report
viii<br />
AGRICULTURE, FOOD AND WATER<br />
The world <strong>water</strong><br />
development report<br />
The World Water Development Report (WWDR) is a periodic review, continuously updated,<br />
designed to give an authoritative picture of the state of the world’s fresh<strong>water</strong> resources <strong>and</strong> our<br />
stewardship of them. The WWDR builds upon past assessments <strong>and</strong> will constitute a continuing<br />
series of assessments in the future. The WWDR is targeted to all those involved in the formulation<br />
<strong>and</strong> implementation of <strong>water</strong>-related policies <strong>and</strong> investments, <strong>and</strong> aims to influence strategies<br />
<strong>and</strong> practices at the local, national <strong>and</strong> international levels. While a broad, global picture is given,<br />
particular emphasis is placed on developing-country situations, where management capacities are<br />
likely to be weaker, with the intention of identifying areas in particular need of attention. It lays<br />
the foundations for efficient <strong>and</strong> effective capacity-building in areas where stewardship challenges<br />
are greatest.<br />
As a UN-led exercise, the preparation of the WWDR is a joint effort of the UN <strong>and</strong> its member<br />
states to collect <strong>and</strong> prepare reliable data in a harmonized <strong>and</strong> meaningful manner. Data <strong>and</strong><br />
information used in the report are from official sources such as national authorities <strong>and</strong> basin<br />
agencies, or equivalents. National <strong>and</strong> local governments, institutions <strong>and</strong> universities, user<br />
associations, the private sector, nongovernmental <strong>org</strong>anizations <strong>and</strong> national consultants are also<br />
involved. The first edition of the WWDR offers an inaugural assessment of progress since the Rio<br />
Summit.<br />
The Secretariat of the World Water Assessment Programme (WWAP), in charge of the<br />
preparation of the WWDR, is hosted by UNESCO. More details about the WWAP can be<br />
obtained through Internet at: www.unesco.<strong>org</strong>/<strong>water</strong>/wwap.
AGRICULTURE, FOOD AND WATER<br />
1<br />
CHAPTER ONE<br />
Introduction<br />
Since the 1960s, the world <strong>food</strong> system has responded to a doubling of the world population,<br />
providing more <strong>food</strong> per capita at progressively lower prices. Global nutrition has consistently<br />
improved. This performance was possible through a combination of high-yielding seeds, irrigation,<br />
plant nutrition <strong>and</strong> pest control. In the process, large quantities of <strong>water</strong> were appropriated for<br />
agriculture. As population keeps increasing, albeit at a slower rate, more <strong>food</strong> <strong>and</strong> livestock feed<br />
need to be produced in the future <strong>and</strong> more <strong>water</strong> applied to this purpose. Water withdrawals<br />
for irrigation in developing countries are expected to increase by an aggregated 14 percent until<br />
2030, while irrigation <strong>water</strong> use efficiency is expected to improve by an average 4 percent. Waterscarcity<br />
stress is foreseen to grow locally <strong>and</strong> in some cases regionally <strong>and</strong> a number of countries<br />
will have to rely more on trade for their <strong>food</strong> security.<br />
While <strong>food</strong> production is satisfying market dem<strong>and</strong> at historically low prices, an estimated 777<br />
million people in developing countries do not have access to sufficient <strong>and</strong> adequate <strong>food</strong> because<br />
they do not have the resources to buy it or, in the case of subsistence farmers, to produce it. In spite<br />
of the overall improvement in the nutritional situation, the absolute number of undernourished<br />
people is reducing at a much slower rate than had been anticipated. The 1996 World Food<br />
Summit (see Annex 1)set a target of reducing the number of chronically hungry people to about<br />
400 million, but current projections indicate that this figure may be achieved fifteen years later<br />
than targeted, i.e. by 2030, unless decisive policy <strong>and</strong> financial action is taken.<br />
Irrigated agriculture will by necessity claim large quantities of <strong>water</strong> to produce the <strong>food</strong><br />
required to feed the world. Irrigation-<strong>water</strong> management has a long way to go to adapt to the<br />
new production requirements <strong>and</strong> reconcile competing claims from other economic sectors <strong>and</strong><br />
calls for environmental protection. However, <strong>water</strong>-saving technologies are available <strong>and</strong> can<br />
significantly reduce the waste of <strong>water</strong>. In addition, the political, legal <strong>and</strong> institutional framework<br />
to support improved <strong>water</strong> productivity in irrigated agriculture also shows signs of adaptation.<br />
Water-management trends point to empowering stakeholders, with a priority for the poor <strong>and</strong> the<br />
marginalized. At the same time, the <strong>water</strong> needs for human health <strong>and</strong> for the aquatic environment<br />
call for closer attention. The message from agriculture, which will remain globally the largest<br />
<strong>water</strong> user, is cautiously optimistic.<br />
At the start of the twenty-first century, agriculture is using a global average of 70 percent of<br />
all <strong>water</strong> withdrawals from rivers, lakes <strong>and</strong> aquifers. The Food <strong>and</strong> <strong>Agriculture</strong> Organization<br />
(<strong>FAO</strong>, 200b) anticipates a net expansion of irrigated l<strong>and</strong> of some 45 million ha in ninety-three<br />
developing countries (for a total of 242 million ha in 2030) <strong>and</strong> projects that agricultural <strong>water</strong><br />
withdrawals will increase by some 14 percent from 2000 to 2030 to meet future <strong>food</strong> production
2 CHAPTER 1 Introduction<br />
needs. The analysis indicates a projected annual growth rate of 0.6 percent, compared with the 1.9<br />
percent observed in the period from 1963 to 1999.<br />
Only a part of agricultural <strong>water</strong> withdrawals are effectively used in the production of <strong>food</strong> or<br />
other agricultural commodities; a large proportion of <strong>water</strong> may not reach the crop plants because<br />
it evaporates or infiltrates during conduction, evaporates from the soil in the field, or is used<br />
by non-productive growth such as weeds. Irrespective of the actual outcomes, it is important to<br />
highlight the fact that <strong>water</strong> allocations for agriculture will face increasing competition from other<br />
higher utility uses – municipal, industrial uses <strong>and</strong> calls for <strong>water</strong> to be left in the environment.<br />
Under these circumstances it is crucial that the role of <strong>water</strong> in securing <strong>food</strong> supply is understood<br />
<strong>and</strong> the potential for improving overall agricultural productivity with respect to <strong>water</strong> fully<br />
realized.<br />
In this report, the facts about past, present <strong>and</strong> future <strong>water</strong> dem<strong>and</strong> in <strong>food</strong> production <strong>and</strong> <strong>food</strong><br />
security are discussed. For the purpose of discussion, three groups of countries are identified:<br />
developing countries, industrialized countries <strong>and</strong> countries in transition. Developing countries<br />
call for special attention because demographic growth rates are high <strong>and</strong> the potential dem<strong>and</strong> for<br />
<strong>food</strong> is not yet satisfied. This group of countries is considered in regional groupings, that is: sub-<br />
Saharan Africa, Near East/North Africa, Latin America <strong>and</strong> the Caribbean, South Asia <strong>and</strong> East<br />
Asia. It should always be kept in mind that aggregate <strong>and</strong> average figures tend to hide as much as<br />
or more than they reveal. Water problems are always local or, at most, regional in nature, <strong>and</strong> may<br />
vary over time. Countries with large territories also have a large diversity of situations, including<br />
arid <strong>and</strong> humid regions <strong>and</strong> plains as well as mountains.<br />
This section is largely based on <strong>FAO</strong>’s technical report World <strong>Agriculture</strong>: Towards 2015/2030,<br />
the most recent edition of <strong>FAO</strong>’s periodic assessments of likely future developments in world<br />
<strong>food</strong>, nutrition <strong>and</strong> agriculture. The report provides information on a global basis, with more<br />
detailed emphasis on ninety-three developing countries. The section also relies extensively on<br />
the data, information <strong>and</strong> knowledge provided by <strong>FAO</strong>STAT, the <strong>FAO</strong> statistical database,<br />
<strong>and</strong> AQUASTAT, <strong>FAO</strong>’s information system on <strong>water</strong> <strong>and</strong> agriculture. The contribution of<br />
the International Water Management Institute (IWMI) in the preparation of this section is<br />
acknowledged with thanks. National values of key indicators in 251 countries are presented in<br />
Table 1. The significance of each indicator is highlighted in the relevant part of the discussion by<br />
reference to this table.
AGRICULTURE, FOOD AND WATER<br />
3<br />
Table 1 National values of key indicators on agriculture, <strong>food</strong> <strong>and</strong> <strong>water</strong><br />
Agricultural<br />
<strong>water</strong><br />
Proportion of Proportion of<br />
withdrawal<br />
Number of Number of undernourished undernourished<br />
as %<br />
people people in total<br />
in total Cultivated l<strong>and</strong> Irrigated l<strong>and</strong> Irrigated l<strong>and</strong> Agricultural <strong>water</strong> Total renewable of total<br />
undernourished undernourished population population area in 1998 area in 1998 as % withdrawal <strong>water</strong> resources renewable<br />
1990–92 1997–99 1990–92 1997–99 (1,000 ha) 2 (1, 000 ha) 2 of cultivated in 1998 (km 3 /year) 3 <strong>water</strong> resources<br />
Country (millions) (millions) (%) 1 (%) 1 l<strong>and</strong> in 1998 (km 3 /year) in 1998<br />
Afghanistan 9.3 12.1 64 58 8 054 2 386 30 22.84 65.00 35<br />
Albania 0.5 0.3 14 10 699 340 49 1.06 41.70 3<br />
Algeria 1.3 1.7 5 6 8 174 560 7 3.94 14.32 28<br />
Angola 6.0 6.3 61 51 3 500 75 2 0.21 184.00 0.1<br />
Antigua <strong>and</strong> Barbuda – – – – 8 0 – 0.001 0.05 2<br />
Argentina 0.7 0.4 0 0 27 200 1 561 6 21.52 814.00 3<br />
Armenia – 1.3 – 35 560 287 51 1.94 10.53 18<br />
Aruba – – – – 2 0 – – – –<br />
Australia – – 0 0 53 786 2 365 4 17.78 492.00 4<br />
Austria – – 0 0 1 479 4 0.3 0.02 77.70 0.03<br />
Azerbaijan – 2.9 – 37 1 972 1 455 74 11.65 30.28 38<br />
Bahamas – – – – 10 0 – – 0.02 –<br />
Bahrain – – – – 4 4 100 0.17 0.12 147<br />
Bangladesh 39.2 44.1 35 33 8 332 3 850 46 70.20 1 210.64 6<br />
Barbados – – – – 17 1 6 0.02 0.08 24<br />
Belarus – 0.1 – 0 6 311 115 2 0.84 58.00 1<br />
Belgium – Luxembourg – – 0 0 832 40 5 0.11 21.40 0.5<br />
Belize – – – – 89 3 3 0.03 18.56 0.2<br />
Benin 0.9 0.9 19 15 1 850 12 1 0.19 24.80 1<br />
Bhutan – – – – 160 40 25 0.40 95.00 0.4<br />
Bolivia 1.7 1.7 25 22 2 203 128 6 1.12 622.53 0.2<br />
Bosnia <strong>and</strong> Herzegovina – 0.2 – 4 650 2 0.3 – 37.50 –<br />
Botswana 0.2 0.3 17 23 346 1 0.3 0.06 14.40 0.4<br />
Brazil 19.3 15.9 13 10 65 200 2 870 4 36.12 8 233.00 0.4<br />
Brunei Darussalam – – 0 0 7 1 14 – 8.50 –<br />
Bulgaria 0.2 0.9 3 11 4 511 800 18 1.97 21.30 9<br />
Burkina Faso 2.8 2.6 31 24 3 450 25 1 0.69 12.50 5<br />
Burundi 2.8 4.1 48 66 1 100 74 7 0.19 3.60 5<br />
Cambodia 4.3 4.6 43 37 3 807 270 7 4.00 476.11 1<br />
Cameroon 3.4 3.6 29 25 7 160 33 0.5 0.73 285.50 0.3<br />
Canada – – 0 0 45 700 720 2 5.41 2 902.00 0.2<br />
Cape Verde – – – – 41 3 7 0.02 0.30 7<br />
Central African Republic 1.4 1.5 46 43 2 020 0 – 0.001 144.40 0.001<br />
Chad 3.5 2.5 58 34 3 550 20 1 0.19 43.00 0.4<br />
Chile 1.1 0.6 8 4 2 294 1 800 78 7.97 922.00 1<br />
China 192.6 116.3 16 9 135 365 52 878 39 414.76 2 896.00 14
4 CHAPTER 1 Introduction<br />
Table 1 continued<br />
Proportion of<br />
Number of Number of undernourished<br />
people people in total<br />
undernourished undernourished population<br />
Proportion of<br />
undernourished<br />
in total<br />
population<br />
1990–92 1997–99 1990–92 1997–99<br />
Agricultural<br />
<strong>water</strong><br />
withdrawal<br />
as %<br />
Cultivated l<strong>and</strong> Irrigated l<strong>and</strong> Irrigated l<strong>and</strong> Agricultural <strong>water</strong> Total renewable of total<br />
area in 1998 area in 1998 as % withdrawal <strong>water</strong> resources renewable<br />
(1,000 ha) 2 (1,000 ha) 2 of cultivated in 1998 (km 3 /year) 3 <strong>water</strong> resources<br />
Country (millions) (millions) (%) 1 (%) 1<br />
l<strong>and</strong> in 1998 (km 3 /year) in 1998<br />
Colombia 6.1 5.3 17 13 4 115 850 21 4.92 2 132.00 0.2<br />
Comoros – – – – 118 0 – – 1.20 –<br />
Congo, Dem. Republic of 13.7 31.0 35 64 7 880 11 0.1 0.11 1 283.00 0.01<br />
Congo, Republic of 0.8 0.9 35 32 218 1 0.5 0.004 832.00 0.0005<br />
Costa Rica 0.2 0.2 6 5 505 105 21 1.39 112.40 1<br />
Côte d’Ivoire 2.5 2.4 19 16 7 350 73 1 0.60 81.00 1<br />
Croatia – 0.7 – 15 1 587 3 0.2 – 105.50 –<br />
Cuba 0.5 1.9 5 17 4 465 870 19 5.64 38.12 15<br />
Cyprus – – 0 0 144 40 28 0.17 0.78 22<br />
Czech Republic – 0.1 – 0 3 337 24 1 0.06 13.15 0.4<br />
Denmark – – 0 0 2 374 460 19 0.55 6.00 9<br />
Djibouti – – – – 1 1 100 0.007 0.30 2<br />
Dominica – – – – 15 0 – 0 – –<br />
Dominican Republic 1.9 2.0 27 25 1 550 265 17 2.16 21.00 10<br />
East Timor – – – – 80 0 – – – –<br />
Ecuador 0.9 0.6 8 5 3 001 865 29 13.96 432.00 3<br />
Egypt 2.6 2.4 5 4 3 300 3 300 100 54.00 58.30 93<br />
El Salvador 0.6 0.7 12 12 810 38 5 0.72 25.25 3<br />
Equatorial Guinea – – – – 230 0 – 0.001 26.00 0.004<br />
Eritrea – 2.0 – 57 500 22 4 0.30 6.30 5<br />
Estonia – 0.1 – 4 1 135 4 0.4 0.008 12.81 0.1<br />
Ethiopia – 29.6 – 49 10 650 190 2 2.47 110.00 2<br />
Fiji Isl<strong>and</strong>s – – – – 285 3 1 0.05 28.55 0.2<br />
Finl<strong>and</strong> – – 0 0 2 170 64 3 0.066 110.00 0.1<br />
France – – 0 0 19 517 2 000 10 3.56 203.70 2<br />
French Guiana – – – – 13 2 15 – – –<br />
French Polynesia – – – – 21 0 – – – –<br />
Gabon 0.1 0.1 11 9 495 15 3 0.05 164.00 0.03<br />
Gambia 0.2 0.2 19 15 200 2 1 0.02 8.00 0.3<br />
Gaza Strip (Palestine) – – – – 25 12 48 – 0.06 –<br />
Ge<strong>org</strong>ia – 1.0 – 18 1 062 470 44 2.13 63.33 3<br />
Germany – – 0 0 12 107 485 4 9.31 154.00 6<br />
Ghana 5.4 2.7 35 15 5 300 11 0.2 0.25 53.20 0.5<br />
Greece – – 0 0 3 882 1 422 37 6.12 74.25 8<br />
Greenl<strong>and</strong> – – – – 0 0 – – – –<br />
Grenada – – – – 11 0 – – – –
AGRICULTURE, FOOD AND WATER<br />
5<br />
Table 1 continued<br />
Guadeloupe – – – – 26 3 12 – – –<br />
Guam – – – – 12 0 – – – –<br />
Guatemala 1.3 2.3 14 22 1 905 130 7 1.61 111.27 1<br />
Guinea 2.6 2.7 40 34 1 485 95 6 1.36 226.00 1<br />
Guinea–Bissau – – – – 350 17 5 0.10 31.00 0.3<br />
Guyana 0.1 0.1 19 14 496 150 30 1.60 241.00 1<br />
Haiti 4.5 4.5 63 56 910 75 8 0.93 14.03 7<br />
Honduras 1.1 1.3 23 21 1 875 76 4 0.66 95.93 1<br />
Hungary 0.0 0.1 0 0 5 045 210 4 2.45 104.00 2<br />
Icel<strong>and</strong> – – 0 0 7 0 – 0.0002 170.00 0.0001<br />
India 214.6 225.3 25 23 169 650 57 000 34 556.05 1 896.66 29<br />
Indonesia 16.7 12.0 9 6 30 987 4 815 16 75.60 2 838.00 3<br />
Iran, Islamic Rep. of 2.7 3.5 4 5 18 803 7 562 40 66.78 137.51 49<br />
Iraq 1.2 3.0 7 14 5 540 3 525 64 39.38 75.42 52<br />
Irel<strong>and</strong> – – 0 0 1 088 0 – 0.0002 52.00 0.0004<br />
Israel – – 0 0 440 199 45 1.28 1.67 76<br />
Italy – – 0 0 11 137 2 698 24 20.00 191.30 10<br />
Jamaica 0.3 0.2 12 8 274 25 9 0.20 9.40 2<br />
Japan – – 0 0 4 905 2 679 55 56.03 430.00 13<br />
Jordan 0.1 0.2 3 5 384 75 20 0.76 0.88 86<br />
Kazakhstan – 1.7 – 11 30 135 2 332 8 28.41 109.61 26<br />
Kenya 11.5 13.4 47 46 4 520 67 1 1.01 30.20 3<br />
Korea, Dem. People’s Rep. 3.4 8.8 17 40 2 000 1 460 73 4.96 77.14 6<br />
Korea, Republic of 0.8 0.7 0 0 1 910 1 159 61 8.99 69.70 13<br />
Kuwait 0.5 0.1 23 4 6 6 100 0.20 0.02 1 000<br />
Kyrgyzstan – 0.5 – 10 1 428 1 072 75 9.45 20.58 46<br />
Lao, PDR 1.2 1.4 29 28 940 168 18 2.59 333.55 1<br />
Latvia – 0.1 – 4 1 871 20 1 0.04 35.45 0.1<br />
Lebanon 0.1 0.1 0 0 308 120 39 1.06 4.41 24<br />
Lesotho 0.5 0.5 28 25 325 1 0.3 0.01 3.02 0.3<br />
Liberia 0.8 1.0 37 42 390 3 1 0.06 232.00 0.03<br />
Libyan Arab Jamahiriya 0.0 0.0 0 0 2 150 470 22 4.27 0.60 712<br />
Lithuania – 0.1 – 3 3 004 8 0.3 0.02 24.90 0.1<br />
Macedonia, The Fmr. Yug. Rep. – 0.1 – 5 635 55 9 – 6.40 –<br />
Madagascar 4.3 6.1 35 40 3 108 1 090 35 14.31 337.00 4<br />
Malawi 4.8 3.8 49 35 2 000 28 1 0.81 17.28 5<br />
Malaysia 0.6 0.4 3 0 7 605 365 5 5.60 580.00 1<br />
Maldives – – – – 3 0 – 0 0.03 0<br />
Mali 2.2 3.0 25 28 4 650 138 3 6.87 100.00 7<br />
Malta – – – – 9 2 22 0.01 0.05 20<br />
Martinique – – – – 23 3 13 – – –<br />
Mauritania 0.3 0.3 14 11 500 49 10 1.50 11.40 13<br />
Mauritius 0.1 0.1 6 6 106 20 19 0.37 2.21 17<br />
Mexico 4.3 5.0 5 5 27 300 6 500 24 60.34 457.22 13
6 CHAPTER 1 Introduction<br />
Table 1 continued<br />
Proportion of<br />
Number of Number of undernourished<br />
people people in total<br />
undernourished undernourished population<br />
Proportion of<br />
undernourished<br />
in total<br />
population<br />
1990–92 1997–99 1990–92 1997–99<br />
Agricultural<br />
<strong>water</strong><br />
withdrawal<br />
as %<br />
Cultivated l<strong>and</strong> Irrigated l<strong>and</strong> Irrigated l<strong>and</strong> Agricultural <strong>water</strong> Total renewable of total<br />
area in 1998 area in 1998 as % withdrawal <strong>water</strong> resources renewable<br />
(1,000 ha) 2 (1,000 ha) 2 of cultivated in 1998 (km 3 /year) 3 <strong>water</strong> resources<br />
Country (millions) (millions) (%) 1 (%) 1<br />
l<strong>and</strong> in 1998 (km 3 /year) in 1998<br />
Moldova, Republic of – 0.4 – 10 2 182 307 14 0.76 11.65 7<br />
Mongolia 0.8 1.0 34 42 1 322 84 6 0.23 34.80 1<br />
Morocco 1.4 1.8 5 6 9 976 1 291 13 11.36 29.00 39<br />
Mozambique 9.6 9.5 69 54 3 350 107 3 0.55 216.11 0.3<br />
Myanmar 3.9 3.2 9 7 10 143 1 692 17 27.86 1 045.60 3<br />
Namibia 0.4 0.6 30 33 820 7 1 0.17 17.94 1<br />
Nepal 3.5 5.0 19 23 2 968 1 135 38 9.82 210.20 5<br />
Netherl<strong>and</strong>s – – 0 0 941 565 60 2.69 91.00 3<br />
New Caledonia – – – – 13 0 – – – –<br />
New Zeal<strong>and</strong> – – 0 0 3 280 285 9 0.89 327.00 0.3<br />
Nicaragua 1.2 1.4 30 29 2 746 88 3 1.08 196.69 1<br />
Niger 3.3 4.2 42 41 5 000 66 1 2.08 33.65 6<br />
Nigeria 12 7.6 14 7 31 000 233 1 5.51 286.2 2<br />
Norway – – – – 903 127 14 0.23 382.00 0.1<br />
Oman – – – – 62 62 100 1.23 0.99 125<br />
Pakistan 26.5 24.4 24 18 21 970 18 000 82 161.84 222.67 73<br />
Panama 0.5 0.4 19 16 655 35 5 0.23 147.98 0.2<br />
Papua New Guinea 0.9 1.2 24 26 670 0 – 0.001 801.00 0<br />
Paraguay 0.8 0.7 18 13 2 285 67 3 0.35 336.00 0.1<br />
Peru 8.9 3.1 41 13 4 170 1 195 29 16.42 1 913.00 1<br />
Philippines 16.0 17.2 26 24 10 000 1 550 16 21.10 479.00 4<br />
Pol<strong>and</strong> 0.3 0.3 0 0 14 379 100 1 1.35 61.60 2<br />
Portugal – – 0 0 2 620 650 25 8.81 68.70 13<br />
Puerto Rico – – – – 81 40 49 – 3.40 –<br />
Qatar – – – – 13 13 100 0.21 0.05 420<br />
Reunion – – – – 38 12 32 – 5.00 –<br />
Romania 0.7 0.3 3 0 9,843 2 880 29 14.23 211.85 7<br />
Russian Federation – 8.1 – 6 127 959 4 663 4 13.83 4 507.25 0.3<br />
Rw<strong>and</strong>a 2.2 2.6 34 40 1070 4 0.4 0.02 5.20 0.4<br />
Samoa – – – – 122 0 – – – –<br />
Sao Tome <strong>and</strong> Principe – – – – 41 10 24 – 2.18 –<br />
Saudi Arabia 0.3 0.4 0 0 1 620 1 620<br />
100 15.42 2.40 643<br />
Senegal 1.7 2.1 23 24 2 266 71 3 1.43 39.40 4<br />
Seychelles – – – – 7 0 – – – –<br />
Sierra Leone 1.9 1.7 46 41 540 29 5 0.34 160.00 0.2<br />
Singapore – – – – 1 0 – – – –
AGRICULTURE, FOOD AND WATER<br />
7<br />
Table 1 continued<br />
Slovakia – 0.1 – 0 1 604 174 11 – 50.10 –<br />
Slovenia – 0.0 – 0 203 2 1 – 31.87 –<br />
Solomon Isl<strong>and</strong>s – – – – 60 0 – – 44.70 –<br />
Somalia 4.8 6.0 67 75 1 065 200 19 3.28 13.50 24<br />
South Africa 2.7 3.5 4 5 15 750 1 350 9 10.03 50.00 20<br />
Spain – – 0 0 18 516 3 652 20 24.22 111.50 22<br />
Sri Lanka 5.0 4.3 29 23 1 889 651 34 11.74 50.00 23<br />
Saint Helena – – – – 4 0 – – – –<br />
Saint Kitts Nevis – – – – 7 0 – – 0.02 –<br />
Saint Lucia – – – – 17 3 18 – – –<br />
Saint Vincent/Grenadines – – – – 11 1 9 – – –<br />
Sudan 7.9 6.3 31 21 16 900 1 950 12 36.07 64.50 56<br />
Suriname 0.0 0.0 12 11 67 51 76 0.62 122.00 1<br />
Swazil<strong>and</strong> 0.1 0.1 10 12 180 69 38 0.75 4.51 17<br />
Sweden – – 0 0 2 784 115 4 0.26 174.00 0.2<br />
Switzerl<strong>and</strong> – – 0 0 439 25 6 0.05 53.50 0.1<br />
Syrian Arab Republic 0.2 0.2 0 0 5 484 1 213 22 18.96 26.26 72<br />
Tajikistan – 2.8 – 47 864 719 83 10.96 15.98 69<br />
Tanzania, United Republic of 9.1 15.5 34 46 4 650 155 3 1.79 91.00 2<br />
Thail<strong>and</strong> 16.9 12.9 30 21 18 297 4 749 26 79.29 409.94 19<br />
Togo 0.9 0.7 27 17 2 300 7 0.3 0.08 14.70 0.5<br />
Tonga – – – – 48 0 – – – –<br />
Trinidad <strong>and</strong> Tobago 0.1 0.2 12 13 122 3 2 0.02 3.84 0.5<br />
Tunisia 0.1 0.0 0 0 5 100 380 7 2.23 4.56 49<br />
Turkey 0.9 1.2 0 0 26 968 4 380 16 27.11 229.30 12<br />
Turkmenistan – 0.4 – 9 1 800 1 800 100 24.04 24.72 97<br />
Ug<strong>and</strong>a 4.2 6.2 24 28 6810 9 0.1 0.12 66.00 0.2<br />
Ukraine – 2.6 – 5 33 821 2 446 7 20.00 139.55 14<br />
United Arab Emirates 0.1 0.1 3 0 74 74 100 1.53 0.15 1 021<br />
United Kingdom – – 0 0 6 306 108 2 0.28 147.00 0.2<br />
United States of America – – 0 0 179 000 22 300 12 296.87 2 071.00 10<br />
Uruguay 0.2 0.1 6 3 1 307 180 14 3.03 139.00 2<br />
Uzbekistan – 0.9 – 4 4 850 4 281 88 54.37 50.41 108<br />
Venezuela 2.3 4.8 11 21 3 490 570 16 3.94 1 233.17 0.3<br />
Viet Nam 18.0 14.2 27 19 7 250 3 000 41 48.62 891.21 5<br />
West Bank – – – – 209 12 6 – 0.75 –<br />
Yemen 4.4 5.7 36 34 1 680 490 29 6.19 4.10 151<br />
Yugoslavia, Fed. Rep. of – 0.5 – 5 4 047 57 1 – 208.50 –<br />
Zambia 3.6 4.7 43 47 5 279 46 1 1.32 105.20 1<br />
Zimbabwe 4.6 4.8 43 39 3 350 117 3 2.24 20.00 11<br />
– No data available. (1) Values marked as 0 are < 2.5%. (2) Values marked as 0 are < 1,000 ha. (3) Aggregation of data can not be carried out as it would result in double counting of shared <strong>water</strong> resources.<br />
Source:<strong>FAO</strong> estimates.
AGRICULTURE, FOOD AND WATER<br />
9<br />
CHAPTER TWO<br />
How the world<br />
is fed<br />
The world <strong>food</strong> system:<br />
sustained improvement in <strong>food</strong> availability<br />
Between the early 1960s <strong>and</strong> the late 1990s, while world population almost doubled, the<br />
productive potential of global agriculture met the growth of effective dem<strong>and</strong>. Figure 1 shows<br />
that total investment in irrigation <strong>and</strong> drainage tends to correspond to <strong>food</strong> prices. But even with<br />
the observed decline in <strong>food</strong> prices, the nutritional status of the world’s population continued to<br />
improve. Clearly, some of the early investment in agriculture paid off <strong>and</strong> productivity gains were<br />
being made. Irrigation played an important role in ensuring the needed growth in <strong>food</strong> production.<br />
Today, as the <strong>food</strong> production issue becomes less critical, concern arises over the future for largescale<br />
irrigation in terms of its overall performance <strong>and</strong> the political <strong>and</strong> institutional viability<br />
of transferring the management of public irrigation schemes to users. The significance of nonstructural<br />
irrigation <strong>and</strong> <strong>water</strong> management reform will grow as world agriculture in general is<br />
becoming more responsive to dem<strong>and</strong>. These issues are taken up later in this report.<br />
Figure 1 Food prices <strong>and</strong> investment in irrigation <strong>and</strong> drainage<br />
Index<br />
(1961=100)<br />
200<br />
180<br />
160<br />
140<br />
120<br />
100<br />
Million US$<br />
3 000<br />
2 500<br />
2 000<br />
1 500<br />
Food price (indexed)<br />
Food per capita (indexed)<br />
Lending for irrigation<br />
<strong>and</strong> drainage (million US$)<br />
80<br />
1 000<br />
60<br />
40<br />
500<br />
20<br />
0<br />
1950 1955 1960 1965 1970 1975 1980 1985 1990 1995 2000<br />
This figure shows that total<br />
investment in irrigation <strong>and</strong><br />
drainage tends to correspond<br />
with <strong>food</strong> prices. Lending<br />
does not include lending by<br />
commercial banks to private<br />
farmers; it only includes<br />
lending by the World Bank.<br />
Source: Thompson, 2001.<br />
Per capita <strong>food</strong> consumption, expressed in kcal/person/day, is used as the indicator of <strong>food</strong> intake.<br />
The evolution of per capita <strong>food</strong> consumption in 1965 <strong>and</strong> 2030 is given in Table 2, which is based<br />
on historical data <strong>and</strong> on <strong>FAO</strong> projections for the years 2015 <strong>and</strong> 2030.
10 CHAPTER 2 How the world is fed<br />
Table 2 Per capita <strong>food</strong> consumption from 1965 to 2030 (Kcal/person/day)<br />
1965 1975 1985 1998 2015 2030<br />
World 2 358 2 435 2 655 2 803 2 940 3 050<br />
Developing countries 2 054 2 152 2 450 2 681 2 850 2 980<br />
Sub-Saharan Africa 2 058 2 079 2 057 2 195 2 360 2 540<br />
Near East/North Africa 2 290 2 591 2 953 3 006 3 090 3 170<br />
Latin America/Caribbean 2 393 2 546 2 689 2 826 2 980 3 140<br />
South Asia 2 017 1 986 2 205 2 403 2 700 2 900<br />
East Asia 1 957 2 105 2 559 2 921 3 060 3 190<br />
Industrial countries 2 947 3 065 3 206 3 380 3 440 3 500<br />
There is a global <strong>food</strong><br />
security situation that<br />
is steadily improving,<br />
with a consistently<br />
increasing global level<br />
of <strong>food</strong> consumption<br />
per capita.<br />
Transition countries 3 222 3 385 3 379 2 906 3 060 3 180 Source: <strong>FAO</strong>, 2002.<br />
Figure 2 Per capita <strong>food</strong> consumption from 1965 to 2030<br />
3 500<br />
Food consumption (kcal/person/day)<br />
3 000<br />
2 500<br />
2 000<br />
Threshold<br />
1 500<br />
1965 1970 1975 1980 1985 1990 1995 2000 2005 2010 2015 2020 2025 2030<br />
World<br />
Developing countries<br />
Sub-Saharan Africa<br />
Near East/North Africa<br />
Latin America & the Caribbean<br />
South Asia<br />
East Asia<br />
Industrial countries<br />
Transition countries<br />
This figure shows a global<br />
<strong>food</strong> security situation<br />
that is consistently<br />
improving, at both global<br />
<strong>and</strong> developing country<br />
levels. The threshold of<br />
2,700 kcal is taken as<br />
an indicator of the level<br />
of satisfaction of <strong>food</strong><br />
security requirements.<br />
Source: <strong>FAO</strong>, 2002.<br />
Table 2 <strong>and</strong> Figure 2 show a global <strong>food</strong> security situation that is consistently improving, with a<br />
steady increase in per capita <strong>food</strong> consumption at the global level as well as at the level of developing<br />
countries. Dem<strong>and</strong> for <strong>food</strong> tends to saturate at the level of 3500 kcal/person/day. They also<br />
clearly show that per capita <strong>food</strong> consumption in sub-Saharan Africa remained disappointingly<br />
low over the last forty-five years although recent improvement trends are expected to continue.<br />
It should be noted that gains in overall <strong>food</strong> consumption are not necessarily translated into<br />
commensurate declines in the absolute numbers of undernourished people, in particular when<br />
there is high population growth.
AGRICULTURE, FOOD AND WATER<br />
11<br />
The main sources of <strong>food</strong> supply<br />
The main source of <strong>food</strong> for the population of the world is agriculture. The term agriculture,<br />
as broadly used here, also includes livestock husb<strong>and</strong>ry, managed fisheries (aquaculture) <strong>and</strong><br />
forestry. The composition of meals changes gradually as dem<strong>and</strong> for <strong>food</strong> strengthens <strong>and</strong> lifestyles<br />
change. For those that can afford it, many products that are grown out of season or are exotic<br />
now appear on their local market. What agriculture produces is driven by consumer dem<strong>and</strong>, <strong>and</strong><br />
changes in consumer preferences have an influence on the <strong>water</strong> needed for <strong>food</strong> production.<br />
It has been estimated that unmanaged natural systems could provide <strong>food</strong> for 600 million people,<br />
one tenth of the current world population (Mazoyer <strong>and</strong> Roudart, 1998). Thus, about 90 percent<br />
of the present world population could not be sustained without agriculture. Yet, while few people<br />
live from only fishing, gathering <strong>and</strong> hunting, these unmanaged, or only loosely managed, natural<br />
<strong>food</strong> systems provide a strategically important contribution to the nutrition of indigenous people<br />
as well as to the existence <strong>and</strong> survival of many displaced, poor <strong>and</strong> marginal people. Except for<br />
marine fisheries, which are monitored, the diffuse reality of <strong>food</strong> resources directly obtained from<br />
natural ecosystems escapes most data collection <strong>and</strong> is usually not reflected in agricultural <strong>and</strong><br />
economic statistics.<br />
Therefore, the bulk of global <strong>food</strong> production (cereals, oils, livestock <strong>and</strong> fish) is dependent upon<br />
a whole range of agricultural systems in which <strong>water</strong> is a critical factor of production (<strong>FAO</strong>/<br />
World Bank, 2001).<br />
Major crops<br />
The prominent role of cereals <strong>and</strong> oil crops<br />
Cereals are by far the most important source of total <strong>food</strong> consumption as measured in calories. In<br />
developing countries, consumption of cereals thirty years ago was 141 kg/person/year, representing<br />
61 percent of total calories. At present it is 173 kg/person/year <strong>and</strong> provides 56 percent of calories.<br />
Thus, cereal use has increased, but less than other components of <strong>food</strong> intake. The fact that the<br />
growth of global dem<strong>and</strong> for cereals is declining reflects diet diversification, as more countries<br />
achieve higher levels of nutrition. However, it is expected that cereals will continue to still supply<br />
more than 50 percent of the <strong>food</strong> consumed in the foreseeable future.<br />
To satisfy the cereal dem<strong>and</strong> for a growing population using more cereals per capita, the annual<br />
world production of cereals grew by almost a billion tons from 0.94 billion tons in the mid-1960s<br />
to 1.89 billion tons in 1998. In the late 1990s, a slowdown in the growth of world consumption<br />
of cereals was recorded. It was, however, not caused by production constraints but by slowing<br />
dem<strong>and</strong>. The annual world production of cereals is projected by <strong>FAO</strong> to increase by another
12 CHAPTER 2 How the world is fed<br />
billion tons from the 1998 level, to 2.8 billion tons. Within the cereal group, the relative importance<br />
of rice is expected to decline slightly, while consumption of wheat will continue to grow in per<br />
capita terms.<br />
A large proportion of cereals are not produced for direct human consumption. Thus, of the future<br />
increment in cereal production projected by <strong>FAO</strong>, just under half will be for <strong>food</strong>, about 44<br />
percent for animal feed, with the balance going to other uses, such as seed, industrial non-<strong>food</strong>,<br />
<strong>and</strong> waste.<br />
One out of every five calories added to <strong>food</strong> consumption in developing countries in the last<br />
two decades originated in the group of oil crops, which includes palm oil, soybean, sunflower,<br />
groundnut, sesame <strong>and</strong> coconut. In projections towards the future, it is expected that 44 percent<br />
of additional calories may come from these products. This projection reflects the prospect, in the<br />
majority of developing countries, of only modest further growth in the direct consumption of<br />
staples such as cereals, roots <strong>and</strong> tubers, in favour of non-staples like vegetable oils. The major<br />
driving force of the world oil crops economy has been the growth of <strong>food</strong> dem<strong>and</strong> in the developing<br />
countries, but additional dem<strong>and</strong> growth has been experienced in the non-<strong>food</strong> industrial uses of<br />
oil <strong>and</strong> also in feed for the livestock sector. The future growth of aggregate world dem<strong>and</strong> for,<br />
<strong>and</strong> production of oil crops, is expected to remain well above that of total agriculture. In terms of<br />
trade, developing countries have so far been net exporters of oil crops, but this position is likely to<br />
change as local consumption increases.<br />
Sources of growth in crop production<br />
There are three sources of growth in crop production:<br />
arable l<strong>and</strong> expansion;<br />
increase in cropping intensities (multiple cropping <strong>and</strong> shorter fallow periods);<br />
yield growth.<br />
Since the early 1960s, l<strong>and</strong> in agricultural use (arable l<strong>and</strong> <strong>and</strong> l<strong>and</strong> under permanent crops)<br />
in the world has increased by 12 percent to about 1.5 billion ha. This amounts to 11 percent of<br />
the globe’s l<strong>and</strong> surface. During the same period, the world population nearly doubled from 3.1<br />
billion to over 5.9 billion in 1998. By implication, arable l<strong>and</strong> per person declined by 40 percent,<br />
from 0.43 ha in 1962 to 0.26 ha in 1998. As the world <strong>food</strong> system kept providing enough <strong>food</strong><br />
for a growing population, a secular decline in the real price of <strong>food</strong> took place <strong>and</strong> the global<br />
situation of nutrition improved, both in relative terms <strong>and</strong> in absolute numbers. In the context of<br />
low <strong>food</strong> prices <strong>and</strong> consequent relatively low value of agricultural l<strong>and</strong>, prime agricultural l<strong>and</strong> is<br />
being converted to higher value urban <strong>and</strong> industrial uses. Also, irrigated l<strong>and</strong> with inadequate or<br />
non-existing drainage infrastructure is being gradually lost to salinization that results in lowering<br />
yields. Yield increase <strong>and</strong> intensification have more than compensated for the reduction in per<br />
capita l<strong>and</strong> availability.
AGRICULTURE, FOOD AND WATER<br />
13<br />
As an example of growing crop yields, the world average grain yields doubled from 1.4 ton/ha/<br />
crop in 1962 to 2.8 ton/ha/crop in 1996. The average cropping intensity probably increased by<br />
some 5 percentage points, so that the arable l<strong>and</strong> required to produce a given amount of grain<br />
declined by some 56 percent. It is expected that in future 80 percent of increased crop production<br />
in developing countries will come from intensification through higher yields, increased multiple<br />
cropping <strong>and</strong> shorter fallow periods. The remaining 20 percent would come from expansion of<br />
agricultural l<strong>and</strong> in those developing countries <strong>and</strong> regions where the potential for expansion<br />
exists <strong>and</strong> where the prevailing farming systems <strong>and</strong> general demographic <strong>and</strong> socio-economic<br />
conditions favour it.<br />
From 1998 to 2030, arable l<strong>and</strong> in developing countries is projected to increase by 13 percent (120<br />
million ha). The bulk of the projected expansion is expected to take place in sub-Saharan Africa<br />
<strong>and</strong> Latin America, with a smaller part in East Asia. The slowdown in the expansion of arable l<strong>and</strong><br />
is mainly a consequence of the projected slowdown in the growth of crop production.<br />
Livestock: an increasing role<br />
Food production from the livestock sector includes meat (beef, pork, poultry, etc.), dairy products<br />
<strong>and</strong> eggs. In the last few decades, consumption of meat in developing countries has been growing<br />
at a rate of about 5 to 6 percent per year, that of milk <strong>and</strong> dairy products at 3 to 4 percent per<br />
year. Much of the growth has been occurring in a small number of countries, including such<br />
populous countries as Brazil <strong>and</strong> China. Many developing nations <strong>and</strong> whole regions, including<br />
sub-Saharan Africa <strong>and</strong> parts of the Near East/North Africa, where the need to increase protein<br />
consumption is the greatest, have not been participating in the buoyancy of the world meat sector.<br />
Worldwide, the poultry sector has been exp<strong>and</strong>ing fastest, <strong>and</strong> its share in the total meat output<br />
went from 13 percent in the mid-1960s to 28 percent currently. The increasing share of poultry in<br />
meat production is expected to continue in the future. The forces that made for the rapid growth<br />
of the meat sector in the past are, however, expected to weaken in the future owing to lower<br />
population growth <strong>and</strong> the deceleration of growth that follows the attainment of a fairly high level<br />
of consumption. Intensive forms of livestock production have led to a strong dem<strong>and</strong> for cereals<br />
used as animal feed <strong>and</strong> production is rising steadily to meet this dem<strong>and</strong>.<br />
Fisheries <strong>and</strong> the growing importance of aquaculture<br />
Average world per capita consumption of fish was at about 16.3 kg per year in 1999, with large<br />
differences ranging from countries with virtually no fish consumption to countries that reach over<br />
100 kg per year. Per capita consumption could grow to 19 to 20 kg by 2030, raising total fish use<br />
to 150-160 million tons. Of the total world fisheries <strong>and</strong> aquaculture production in 2000 (130
14 CHAPTER 2 How the world is fed<br />
million tons), some 74 percent (97 million tons) was available for direct human consumption as<br />
<strong>food</strong> fish. The remainder was reduced into fishmeal <strong>and</strong> fish oil for use in animal feeding (livestock<br />
<strong>and</strong> aquaculture) or for industrial purposes. Marine capture fisheries production, excluding<br />
aquaculture was in the range of 80 to 85 million tons per year in the 1990s. The long-term yearly<br />
sustainable yield of marine capture fisheries is estimated at no more than around 100 million<br />
tons per year; over-fishing of some species in certain parts of the worlds threatens the resource<br />
base. Achieving <strong>and</strong> sustaining these levels assumes more efficient utilization of stocks, healthier<br />
ecosystems <strong>and</strong> better conservation of critical habitats. Inl<strong>and</strong> catches (excluding aquaculture)<br />
were recorded at about 7 to 8 million tons per year. However, a recent in-depth study of inl<strong>and</strong><br />
fisheries revealed that actual catches may be double this amount. It is important to note that<br />
fishery resources in many inl<strong>and</strong> <strong>water</strong> bodies such as rivers <strong>and</strong> lakes are under increasing<br />
environmental threats resulting from continued trends of increasing aquatic pollution, habitat<br />
degradation, <strong>water</strong> abstraction, <strong>and</strong> other human-made pressures.<br />
The bulk in the future increase of fish supply will have to come from aquaculture, which has been<br />
growing at a rate of 10 percent per year during the 1990s <strong>and</strong> increased its share in world fish<br />
supplies to about 27 percent. Most aquaculture development was in Asia (some 70 percent of world<br />
aquaculture production is in China). At present, aquaculture production amounts to 35 million<br />
tons, of which 21 million inl<strong>and</strong> <strong>and</strong> 14 million marine. Over 90 percent of total aquaculture <strong>food</strong><br />
fish production in 1995 came from developing countries, compared with 51 percent of terrestrial<br />
animal meat production. Fish exports from developing countries have been growing rapidly <strong>and</strong><br />
now far exceed earnings from commodities such as coffee, cocoa, bananas or rubber. Strong growth<br />
may continue for some time, but constraints such as lack of feed stuffs <strong>and</strong> suitable sites, diseases<br />
<strong>and</strong> environmental constraints are becoming more binding. Major factors affecting both the<br />
sustainability of capture fisheries <strong>and</strong> the expansion of aquaculture will be improved management<br />
in the sector <strong>and</strong> a better underst<strong>and</strong>ing of aquatic ecosystems, as well as prevention <strong>and</strong> better<br />
management of environmental impacts affecting fishery resources <strong>and</strong> aquatic biodiversity.<br />
Food trade<br />
Developing countries are increasing their imports<br />
At the global level, <strong>food</strong> production equals consumption. For individual countries <strong>and</strong> clusters<br />
of countries, production <strong>and</strong> consumption differ depending on agricultural trade. In general,<br />
the growth rates of <strong>food</strong> production in the developing countries have been below growth rates<br />
of dem<strong>and</strong>, <strong>and</strong> <strong>food</strong> imports of these countries have been growing faster than their agricultural<br />
exports. For example, the net cereal imports of developing countries increased from 39 million<br />
tons in the mid-1970s to 103 million tons in 1998. Notwithst<strong>and</strong>ing lower growth in the dem<strong>and</strong><br />
for cereals in the future, the dependence of developing countries on cereal imports is expected<br />
to continue to grow owing to limited potential in these countries to increase production. One
AGRICULTURE, FOOD AND WATER<br />
15<br />
production constraint is scarcity of <strong>water</strong> resources for irrigation, but inadequate access to credit<br />
<strong>and</strong> markets, <strong>and</strong> poor agricultural policy <strong>and</strong> management have also hampered production<br />
increases. The course towards a widening net trade deficit of the developing countries continues in<br />
the projections to the future: net <strong>food</strong> imports are expected to rise fairly rapidly to 198 million tons<br />
in 2015 <strong>and</strong> 265 million tons in 2030. This compares to a projected cereal production in developing<br />
countries of the order of 1,650 million tons in 2030.<br />
Few countries pursue a policy of 100 percent <strong>food</strong> self-sufficiency, <strong>and</strong> few countries depend on<br />
imports for more than 20 percent of their <strong>food</strong> dem<strong>and</strong>. A number of countries with a chronic<br />
trade balance deficit <strong>and</strong> high population growth already have difficulty in raising the foreign<br />
exchange needed to satisfy the growing dem<strong>and</strong> for <strong>food</strong> imports. While in the past such a foreign<br />
exchange situation would have called for an increase in import taxes, <strong>and</strong> encouragement for<br />
local <strong>food</strong> production to supply the local market, the structural adjustment programmes <strong>and</strong><br />
market liberalization policies implemented in the 1980s <strong>and</strong> 1990s have precluded the adoption<br />
of national policies leading in the direction of <strong>food</strong> self-sufficiency (Stiglitz, 2002). Yet, farmers<br />
in many developing countries with weak infrastructure <strong>and</strong> no access to capital <strong>and</strong> technology<br />
cannot face competition from the international market. This is particularly the case when their<br />
production competes with that of the heavily subsidized agriculture of industrial countries where<br />
the productivity of labour can be 1 000 times higher than theirs (Mazoyer <strong>and</strong> Roudart, 1997).<br />
The concept of virtual <strong>water</strong><br />
The term “virtual <strong>water</strong>” was coined in the 1990s in support of a trade <strong>and</strong> <strong>water</strong> policy point: for<br />
the <strong>food</strong> security of arid countries, where <strong>water</strong> is needed for domestic use <strong>and</strong> in support of the<br />
services <strong>and</strong> industrial sector, it is not necessary to use <strong>water</strong> for local <strong>food</strong> production, because the<br />
easier <strong>and</strong> economically more attractive alternative is to import <strong>food</strong>, in particular the inexpensive<br />
cereal base of the national diet. Thus, using a hydrologic perspective, trade in <strong>food</strong> was called trade<br />
in virtual <strong>water</strong> that is the <strong>water</strong> consumed to produce an agricultural commodity. For example,<br />
a crop such as wheat consumes about 1 000 to 1 500 litres of <strong>water</strong> to produce one kilogram of<br />
cereal. For poultry with a feed/meat conversion factor of 4:1, the virtual <strong>water</strong> content would be<br />
6 000 litres per kg of poultry meat. For cattle, with a conversion factor of 10:1, the virtual <strong>water</strong><br />
content of one kg of beef would be 15 000 litres. Table 3 in the following section gives examples<br />
of specific <strong>water</strong> needs for the production of a unit of a selection of agricultural commodities. The<br />
amount of virtual <strong>water</strong> imported by a country is a measure of the degree to which the country<br />
depends on the international market for its <strong>food</strong> supply.<br />
Manipulation of the virtual <strong>water</strong> concept is subject to some caveats, one of which is that the <strong>water</strong><br />
actually used by a crop may have stemmed partially or totally from rain, which is free of cost,<br />
whereas piped <strong>water</strong> definitely has a cost. In the case of meat, one has to keep in mind that freeroaming<br />
animals are efficient collectors of virtual <strong>water</strong>: in arid areas, the pasture they consumed<br />
grew on rainfall that usually would have no other use.
AGRICULTURE, FOOD AND WATER<br />
17<br />
CHAPTER THREE<br />
The use of <strong>water</strong><br />
in agriculture<br />
Water for <strong>food</strong> production<br />
For vegetative growth <strong>and</strong> development, plants require, within reach of their roots, <strong>water</strong> of<br />
adequate quality, in appropriate quantity <strong>and</strong> at the right time. Most of the <strong>water</strong> a plant absorbs<br />
performs the function of raising dissolved nutrients from the soil to the aerial <strong>org</strong>ans, from where it<br />
is released to the atmosphere by transpiration: agricultural <strong>water</strong> use is intrinsically consumptive.<br />
Crops have specific <strong>water</strong> requirements, <strong>and</strong> these vary depending on local climatic conditions.<br />
Whereas an indicative figure for producing one kilogram of wheat is about 1000 litres of <strong>water</strong><br />
that is returned to the atmosphere, paddy rice may require twice this amount. The production of<br />
meat requires between six <strong>and</strong> twenty times more <strong>water</strong> than for cereals, depending on the feed/<br />
meat conversion factor. Specific values for the <strong>water</strong> equivalent of a selection of <strong>food</strong> products are<br />
given in Table 3. Water required for human <strong>food</strong> intake can be derived from these specific values<br />
in a grossly approximate way, depending on the size <strong>and</strong> composition of the meals (see Box 1).<br />
Table 3 Water requirement equivalent of main <strong>food</strong> products<br />
Product Unit Equivalent <strong>water</strong> in<br />
m 3 per unit<br />
Cattle head 4 000<br />
Sheep <strong>and</strong> goats head 500<br />
Fresh beef kg 15<br />
Fresh lamb kg 10<br />
Fresh poultry kg 6<br />
Cereals kg 1.5<br />
Citrus fruits kg 1<br />
Palm oil kg 2<br />
This table gives examples<br />
of <strong>water</strong> required per unit<br />
of major <strong>food</strong> products,<br />
including livestock, which<br />
consume the most <strong>water</strong><br />
per unit. Cereals, oil<br />
crops, <strong>and</strong> pulses, roots<br />
<strong>and</strong> tubers consume far<br />
less <strong>water</strong>.<br />
Pulses, roots <strong>and</strong> tubers kg 1 Source: <strong>FAO</strong>, 1997a.<br />
BOX 1 ASSESSING FRESHWATER NEEDS FOR GLOBAL FOOD PRODUCTION<br />
The amount of <strong>water</strong> involved in <strong>food</strong> production is significant, <strong>and</strong> most of it is provided directly by<br />
rainfall. A rough calculation of global <strong>water</strong> needs for <strong>food</strong> production can be based on the specific<br />
<strong>water</strong> requirements to produce <strong>food</strong> for one person. Depending on the composition of meals <strong>and</strong><br />
allowing for post-harvest losses, the present average <strong>food</strong> ingest of 2 800 kcal/person/day may<br />
require roughly 1 000 m 3 per year to be produced. Thus, with a world population of 6 billion, <strong>water</strong><br />
needed to produce the necessary <strong>food</strong> is 6 000 km 3 (excluding any conveyance losses associated<br />
with irrigation systems). Most <strong>water</strong> used by agriculture stems from rainfall stored in the soil profile<br />
<strong>and</strong> only about 15 percent of <strong>water</strong> for crops is provided through irrigation. Irrigation therefore<br />
needs 900 km 3 of <strong>water</strong> per year for <strong>food</strong> crops (to which some <strong>water</strong> must be added for non<strong>food</strong><br />
crops). On average, about 40 percent of <strong>water</strong> withdrawn from rivers, lakes <strong>and</strong> aquifers for<br />
agriculture effectively contribute to crop production, the remainder being lost to evaporation, deep<br />
infiltration or the growth of weeds. Consequently, the current global <strong>water</strong> withdrawals for irrigation<br />
are estimated to be about 2 000 to 2 500 km 3 per year.
18 CHAPTER 3 The use of <strong>water</strong> in agriculture<br />
Food production:<br />
the dominant role of rainfed agriculture<br />
Non-irrigated (rainfed) agriculture depends entirely on rainfall stored in the soil profile. This form<br />
of agriculture is possible only in regions where rainfall distribution ensures continuing availability<br />
of soil moisture during the critical growing periods for the crops. Non-irrigated agriculture<br />
accounts for some 60 percent of production in the developing countries. In rainfed agriculture,<br />
l<strong>and</strong> management can have a significant impact on crop yields: proper l<strong>and</strong> preparation leading<br />
surface runoff to infiltrate close to the roots improves the conservation of moisture in the soil.<br />
Various forms of rain<strong>water</strong> harvesting can help to retain <strong>water</strong> in situ. Rain<strong>water</strong> harvesting not<br />
only provides more <strong>water</strong> for the crop but can also add to ground<strong>water</strong> recharge <strong>and</strong> help to<br />
reduce soil erosion. Other methods are based on collecting <strong>water</strong> from the local catchment <strong>and</strong><br />
either relying on storage within the soil profile or else local storage behind bunds or ponds <strong>and</strong><br />
other structures for use during dry periods. Recently, conservation agriculture practices such as<br />
conservation tillage have proven to be effective in improving soil moisture conservation.<br />
The potential to improve non-irrigated yields is restricted where rainfall is subject to large seasonal<br />
<strong>and</strong> interannual variations. With a high risk of yield reductions or complete loss of crop from dry<br />
spells <strong>and</strong> droughts, farmers are reluctant to invest in inputs such as plant nutrients, high-yielding<br />
seeds <strong>and</strong> pest management. For resource-poor farmers in semi-arid regions, the overriding<br />
requirement is to harvest sufficient <strong>food</strong> stuff to ensure nutrition of the household through to the<br />
next harvest. This objective may be reached with robust, drought-resistant varieties associated<br />
with low yields. Genetic engineering has not yet delivered high-yield drought-resistant varieties,<br />
a difficult task to achieve because, for most crop plants, drought resistance is associated with low<br />
yields.<br />
Role of irrigation in <strong>food</strong> production<br />
In irrigated agriculture, <strong>water</strong> taken up by crops is partly or totally provided through human<br />
intervention. Irrigation <strong>water</strong> is withdrawn from a <strong>water</strong> source (river, lake or aquifer) <strong>and</strong> led to<br />
the field through an appropriate conveyance infrastructure. To satisfy their <strong>water</strong> requirements,<br />
irrigated crops benefit from both more or less unreliable natural rainfall, <strong>and</strong> from irrigation<br />
<strong>water</strong>. Irrigation provides a powerful management tool against the vagaries of rainfall <strong>and</strong> makes<br />
it economically attractive to grow high-yield seed varieties <strong>and</strong> to apply adequate plant nutrition<br />
as well as pest control <strong>and</strong> other inputs, thus giving room for a boost in yields. Figure 3 illustrates<br />
the typical yield response of a cereal crop to <strong>water</strong> availability <strong>and</strong> the synergy between irrigation,<br />
crop variety <strong>and</strong> inputs. Irrigation is crucial to the world’s <strong>food</strong> supplies. In 1998, irrigated l<strong>and</strong><br />
made up about one-fifth of the total arable area in developing countries but produced two-fifths of<br />
all crops <strong>and</strong> close to three-fifths of cereal production.
AGRICULTURE, FOOD AND WATER<br />
19<br />
Figure 3 Typical response to <strong>water</strong> for cereal crops<br />
8 000<br />
7 000<br />
High-yielding<br />
varieties,<br />
high inputs<br />
Cereal production (kg/ha)<br />
6 000<br />
5 000<br />
4 000<br />
3 000<br />
2 000<br />
1 000<br />
0<br />
1 000 2 000 3 000 4 000 5 000 6 000 7 000<br />
High-yielding<br />
varieties,<br />
low inputs<br />
Traditional<br />
varieties,<br />
high inputs<br />
Traditional<br />
varieties,<br />
low inputs<br />
The graph shows the<br />
yield response of crops<br />
to <strong>water</strong> availability. High<br />
yielding varieties produce<br />
more than rainfed<br />
varieties only when<br />
provided with adequate<br />
amount of <strong>water</strong>.<br />
Water availability (m 3 /ha)<br />
Source: Smith et al., 2001.<br />
The developed countries account for a quarter of the world’s irrigated area (67 million ha). Their<br />
annual growth of irrigated area reached a peak of 3 percent in the 1970s <strong>and</strong> dropped to only<br />
0.2 percent in the 1990s. The population of this group of countries is growing only slowly <strong>and</strong><br />
therefore a very slow growth in their dem<strong>and</strong> <strong>and</strong> production of agricultural commodities is<br />
foreseen. The focus of irrigation development is consequently expected to be concentrated on the<br />
group of developing countries where demographic growth is strong. Increasing competition from<br />
the higher valued industrial <strong>and</strong> domestic sector results in a decrease in the amount of overall <strong>water</strong><br />
allocated to irrigation. Figure 4 illustrates the case for the Zhanghe irrigation system in China.<br />
Figure 4 Competing uses of <strong>water</strong> in the Zhanghe irrigation district, China<br />
1 000<br />
900<br />
800<br />
Annual irrigation <strong>water</strong> supplied<br />
Water supplied for irrigation - 5 year moving averages<br />
Other uses - 5 year moving averages<br />
700<br />
Water (m 3 )<br />
600<br />
500<br />
400<br />
300<br />
200<br />
100<br />
0<br />
1963 1968 1973 1978 1983 1988 1993 1998<br />
Years<br />
This figure illustrates that<br />
increasing competition <strong>and</strong><br />
dem<strong>and</strong> from the industrial<br />
<strong>and</strong> domestic sectors result<br />
in the decrease of irrigation’s<br />
share of <strong>water</strong> use.<br />
Source: Molden, unpublished.
20 CHAPTER 3 The use of <strong>water</strong> in agriculture<br />
Map 1 Area equipped for irrigation as percentage of cultivated l<strong>and</strong> by country (1998)<br />
No data<br />
0 – 5%<br />
5 – 10%<br />
10 – 20%<br />
20 – 40%<br />
> 40%<br />
Source: <strong>FAO</strong>STAT, 2002.<br />
Map 1 shows irrigated l<strong>and</strong> as percentage of arable l<strong>and</strong> in developing countries. A high proportion<br />
of irrigated l<strong>and</strong> is usually found in countries <strong>and</strong> regions with an arid or semi-arid climate.<br />
However, low proportions of irrigated l<strong>and</strong> in sub-Saharan Africa point also to underdeveloped<br />
irrigation infrastructure. Data <strong>and</strong> projections of irrigated l<strong>and</strong> compared to irrigation potential<br />
in developing countries are shown in Figure 5. The irrigation potential figure already takes into<br />
account the availability of <strong>water</strong>. The graph shows that a sizeable part of irrigation potential is<br />
already used in the Near East/North Africa region (where <strong>water</strong> is the limiting factor) <strong>and</strong> in Asia<br />
(where l<strong>and</strong> is often the limiting factor), whereas a large potential is still unused in sub-Saharan<br />
Africa <strong>and</strong> in Latin America.<br />
According to <strong>FAO</strong> forecasts, the share of irrigation in world crop production is expected to<br />
increase in the next decades. In particular in developing countries, the area equipped for irrigation<br />
is expected to have exp<strong>and</strong>ed by 20 percent (40 million ha) by 2030. This means that 20 percent<br />
of total l<strong>and</strong> with irrigation potential but not yet equipped will be brought under irrigation, <strong>and</strong><br />
that 60 percent of all l<strong>and</strong> with irrigation potential (402 million ha) will be in use by 2030. The net<br />
increase in irrigated l<strong>and</strong> (40 million ha, 0.6 percent per year) projected to 2030 is less than half the<br />
increase over the preceding 36 years (99 million ha, 1.9 percent per year). The projected slowdown<br />
in irrigation development reflects the projected lower growth rate of <strong>food</strong> dem<strong>and</strong>, combined with
AGRICULTURE, FOOD AND WATER<br />
21<br />
Figure 5 Irrigated area as proportion of irrigation potential in developing countries<br />
100<br />
90<br />
80<br />
1997/99<br />
2030<br />
% of irrigated area<br />
70<br />
60<br />
50<br />
40<br />
30<br />
20<br />
10<br />
0<br />
Sub-Saharan<br />
Africa<br />
Latin America<br />
Near East/<br />
North Africa<br />
India<br />
South Asia<br />
China<br />
East Asia<br />
World<br />
This figure shows that a vast<br />
share of the irrigation potential<br />
is already being useg in Asia<br />
<strong>and</strong> in the Near East but there<br />
remains a large potential still<br />
untapped in sub-Saharan<br />
Africa <strong>and</strong> Latin America.<br />
Source: <strong>FAO</strong>, 2002.<br />
the increasing scarcity of suitable areas for irrigation <strong>and</strong> of <strong>water</strong> resources in some countries,<br />
as well as the rising cost of irrigation investment. The first selection of economically attractive<br />
irrigation projects has already been implemented, <strong>and</strong> prices for agricultural commodities have<br />
not risen to encourage investment in a second selection of more expensive irrigation projects.<br />
Most of the expansion in irrigated l<strong>and</strong> is achieved by converting l<strong>and</strong> in use in rainfed agriculture<br />
or l<strong>and</strong> with rainfed production potential but not yet in use into irrigated l<strong>and</strong>. The expansion<br />
of irrigation is projected to be strongest in South Asia, East Asia <strong>and</strong> Near East/North Africa.<br />
These regions have limited or no potential for expansion of non-irrigated agriculture. Arable<br />
l<strong>and</strong> expansion will nevertheless remain an important factor in crop production growth in many<br />
countries in sub-Saharan Africa, Latin America <strong>and</strong> some countries in East Asia, although to a<br />
much smaller extent than in the past. The growth in wheat <strong>and</strong> rice production in the developing<br />
countries will increasingly come from gains in yield, while expansion of harvested l<strong>and</strong> will<br />
continue to be a major contributor to the growth in production of maize.<br />
Future investments in irrigation<br />
In many developing countries, investments in irrigated infrastructures have represented a<br />
significant share of the overall agricultural budget during the second half of the twentieth<br />
century. The unit cost of irrigation development varies with countries <strong>and</strong> types of irrigated<br />
infrastructures, ranging typically from US$1 000 to US$10 000 per hectare, with extreme cases<br />
reaching US$25 000 per hectare (these costs do not include the cost of <strong>water</strong> storage as the cost of<br />
dam construction varies on a case-by-case basis). The lowest investment costs in irrigation are in<br />
Asia, which has the bulk of irrigation <strong>and</strong> where scale economies are possible. The most expensive
22 CHAPTER 3 The use of <strong>water</strong> in agriculture<br />
irrigation schemes are found in sub-Saharan Africa, where irrigation systems are usually smaller<br />
<strong>and</strong> developing l<strong>and</strong> <strong>and</strong> <strong>water</strong> resources is costly.<br />
In the future, the estimates of expansion in l<strong>and</strong> under irrigation will represent an annual<br />
investment of about US$5 billion, but most investment in irrigation, between US$10 <strong>and</strong> 12<br />
billion per year, will certainly come from the needed rehabilitation <strong>and</strong> modernization of aging<br />
irrigated schemes built during the years 1960-1980. In the 1990s, annual investment in storage<br />
for irrigation was estimated at about US$12 billion (WCD, 2000). In the future, the contrasting<br />
effects of reduced dem<strong>and</strong> for irrigation expansion <strong>and</strong> increased unit cost of <strong>water</strong> storage will<br />
result in an annual investment estimated between US$4 <strong>and</strong> 7 billion in the next thirty years.<br />
Typically, investment figures in irrigation do not include that part of the investment provided<br />
by the farmer in l<strong>and</strong> improvement <strong>and</strong> on-farm irrigation that can represent up to 50 percent of<br />
the overall investment. In total, it is estimated that annual investment in irrigated agriculture will<br />
therefore range between US$25 <strong>and</strong> 30 billion, about 15 percent of annual expected investments<br />
in the <strong>water</strong> sector.<br />
Water use efficiency<br />
Assessing the impact of irrigation on available <strong>water</strong> resources requires an estimate of total<br />
abstraction for the purpose of irrigation from rivers, lakes <strong>and</strong> aquifers. The volume extracted<br />
is considerably greater than the consumptive use for irrigation because of conveyance losses<br />
from the withdrawal site to the plant root zone. Water use efficiency is an indicator often used to<br />
express the level of performance of irrigation systems from the source to the crop: it is the ratio<br />
between estimated plant requirements <strong>and</strong> the actual <strong>water</strong> withdrawal.<br />
On average, it is estimated that overall <strong>water</strong> use efficiency of irrigation in developing countries is<br />
about 38 percent. Map 2 shows the importance of agriculture in the countries’ <strong>water</strong> balance, <strong>and</strong><br />
Figure 6 shows the expected growth in <strong>water</strong> abstraction for irrigation from 1998 to 2030. The<br />
predictions are based on assumptions about possible improvements in irrigation efficiency in each<br />
region. These assumptions take into account that, from the farmer’s perspective, wherever <strong>water</strong><br />
is abundant <strong>and</strong> its cost low, the incentives to save <strong>water</strong> are limited. Conversely, if farmers can<br />
profitably irrigate more l<strong>and</strong> using their allocation in an optimum way, irrigation efficiency may<br />
reach higher levels.<br />
Improving irrigation efficiency is a slow <strong>and</strong> difficult process that depends in large part on the<br />
local <strong>water</strong> scarcity situation. It may be expensive <strong>and</strong> requires willingness, know-how <strong>and</strong> action<br />
at various levels. Table 4 shows current <strong>and</strong> expected <strong>water</strong> use efficiency for developing countries<br />
in 1998 <strong>and</strong> 2030, as estimated by <strong>FAO</strong>. The investment <strong>and</strong> management decisions leading to
AGRICULTURE, FOOD AND WATER<br />
23<br />
higher irrigation efficiency are taken <strong>and</strong> involve irrigation system management <strong>and</strong> the systemdependent<br />
farmers. National <strong>water</strong> policy may encourage <strong>water</strong> savings in <strong>water</strong>-scarce areas by<br />
providing incentives <strong>and</strong> effectively enforcing penalties. When upstream managers cannot ensure<br />
conveyance efficiency, there may be no incentives for <strong>water</strong> users to make efficiency gains. With<br />
ground<strong>water</strong>, this caveat may not apply since the incentive is generally internalized by the users,<br />
<strong>and</strong> in many cases ground<strong>water</strong> users show much greater efficiency than those depending on<br />
surface resources. Box 2 provides an overview of different aspects of potential improvements in<br />
agricultural <strong>water</strong> use efficiency.<br />
Map 2 Agricultural <strong>water</strong> withdrawals as percentage of renewable <strong>water</strong> resources (1998)<br />
No data<br />
0 – 5%<br />
5 – 10%<br />
10 – 20%<br />
20 – 40%<br />
> 40%<br />
The importance of agriculture in countries’ <strong>water</strong> balance is shown here. Whereas agricultural <strong>water</strong> withdrawals account for<br />
little of the total renewable <strong>water</strong> resources in the majority of countries, certain regions, such as north-east Africa <strong>and</strong> western<br />
Asia, are notable in that their agricultural withdrawals add up to more than 40 percent of their total <strong>water</strong> resources. In parts of<br />
the Near <strong>and</strong> Middle East, agriculture <strong>water</strong> withdrawal represents more than total resources.<br />
Source: AQUASTAT, 2002.
24 CHAPTER 3 The use of <strong>water</strong> in agriculture<br />
Figure 6 Irrigation <strong>and</strong> <strong>water</strong> resources: current (1999) <strong>and</strong> predicted (2030) withdrawals<br />
Renewable <strong>water</strong> <strong>and</strong> <strong>water</strong> withdrawal (km 3 )<br />
0 2 000 4 000 6 000 8 000 10 000 12 000 14 000<br />
Latin America<br />
(25 > 25)<br />
East Asia<br />
(33 > 35)<br />
South Asia<br />
(44 > 49)<br />
Sub-Saharan Africa<br />
Near East &<br />
(33 > 37)<br />
(40 > 53)<br />
Renewable <strong>water</strong> resources<br />
Water withdrawal, 2030<br />
Water withdrawal, 1997-99<br />
North Africa<br />
In brackets: movement in irrigation efficiency from 1997-99 to 2030.<br />
This figure shows the expected<br />
growth in <strong>water</strong> abstraction for<br />
irrigation for the period 1999<br />
to 2030. There is a potential<br />
increase in all regions, most<br />
notably in south Asia, whereas<br />
the sub-Saharan Africa region<br />
is predicted to maintain its very<br />
low level of irrigation <strong>water</strong><br />
withdrawals.<br />
Source: <strong>FAO</strong> data <strong>and</strong><br />
projections.<br />
Table 4 Water use efficiency in 1998 <strong>and</strong> 2030 (predicted) in 93 developing countries<br />
Sub-Saharan Africa Latin America Near East & North Africa South Asia East Asia All countries<br />
Water use efficiency in irrigation (%)<br />
1998 33 25 40 44 33 38<br />
2030 37 25 53 49 35 42<br />
Irrigation <strong>water</strong> withdrawal as a percentage of renewable <strong>water</strong> resources (%)<br />
1998 2 1 53 36 8 8<br />
2030 3 2 58 41 8 9<br />
Source: <strong>FAO</strong>, 2002.<br />
BOX 2 POTENTIAL FOR IMPROVEMENTS IN AGRICULTURAL WATER USE EFFICIENCY<br />
Global <strong>water</strong> strategies tend to focus on the need to increase agricultural <strong>water</strong> use efficiency,<br />
reduce wastage <strong>and</strong> free large amounts of <strong>water</strong> for other, more productive uses as well as sustaining<br />
the environmental services of rivers <strong>and</strong> lakes. While there is scope for improved use of <strong>water</strong> in<br />
agriculture, these improvements can only be made slowly <strong>and</strong> are limited by several considerations.<br />
First, there are large areas of irrigated agriculture located in humid tropics where <strong>water</strong> is not scarce<br />
<strong>and</strong> where improved efficiency would not result in any gain in <strong>water</strong> productivity. Second, <strong>water</strong> use<br />
efficiency is usually computed at the level of the farm or irrigation scheme, but most of the <strong>water</strong><br />
that is not used by the crops returns to the hydrological system <strong>and</strong> can be used further downstream.<br />
In these conditions, any improvement in <strong>water</strong> use efficiency at field level translates into limited<br />
improvement in overall efficiency at the level of the river basin. Finally, different cropping systems<br />
have different potential for improvement in <strong>water</strong> use efficiency. Typically, tree crops <strong>and</strong> vegetables<br />
are well adapted to the use of localized, highly efficient irrigation technologies, while such<br />
equipments are not adapted to cereal or other crops.
AGRICULTURE, FOOD AND WATER<br />
25<br />
Future <strong>water</strong> withdrawals for irrigation<br />
Irrigation <strong>water</strong> withdrawal in developing countries is expected to grow by about 14 percent from<br />
the current 2 130 km 3 per year to 2 420 km 3 in 2030. This finding is consistent with the one given<br />
in Box 1 earlier but it is based specifically on individual assessments for each developing country.<br />
Harvested irrigated area (the cumulated area of all crops during a year) is expected to increase by<br />
33 percent from 257 million ha in 1998 to 341 million ha in 2030. The disproportionate increase<br />
in harvested area is explained by expected improvements in irrigation efficiency, which will result<br />
in a reduction in gross irrigation <strong>water</strong> abstraction per ha of crop. A small part of the reduction is<br />
due to changes in cropping patterns in China, where consumer preference is causing a shift from<br />
rice to wheat production.<br />
While some countries have reached extreme levels of <strong>water</strong> use for agriculture, irrigation still<br />
represents a relatively small part of total <strong>water</strong> resources of the developing countries. The<br />
projected increase in <strong>water</strong> withdrawal will not significantly alter the overall picture. At the local<br />
level, however, there are already severe <strong>water</strong> shortages, in particular in the Near East / North<br />
Africa region <strong>and</strong> in large parts of Asia.<br />
Of the ninety-three developing countries surveyed by <strong>FAO</strong>, ten are already using more than 40<br />
percent of their renewable <strong>water</strong> resources for irrigation, a threshold used to flag the level at which<br />
countries are usually forced to make difficult choices between their agricultural <strong>and</strong> urban <strong>water</strong><br />
supply sectors. Another eight countries were using more than 20 percent, a threshold that can be<br />
used to indicate impending <strong>water</strong> scarcity. By 2030 South Asia will have reached the 40 percent<br />
level, <strong>and</strong> the Near East <strong>and</strong> North Africa not less than 58 percent. However, the proportion of<br />
renewable <strong>water</strong> resources allocated to irrigation in sub-Saharan Africa, Latin America <strong>and</strong> East<br />
Asia in 2030 is likely to remain far below the critical threshold.<br />
The special role of ground<strong>water</strong><br />
Water contained in shallow underground aquifers has played a significant role in developing<br />
<strong>and</strong> diversifying agricultural production. This is underst<strong>and</strong>able from a resource management<br />
perspective: when ground<strong>water</strong> is accessible it offers a primary buffer against the vagaries of<br />
climate <strong>and</strong> surface <strong>water</strong> delivery. But its advantages are also quite subtle. Access to ground<strong>water</strong><br />
can occasion a large degree of distributive equity, <strong>and</strong> for many farmers, ground<strong>water</strong> has<br />
proved to be a perfect delivery system. Because ground<strong>water</strong> is on dem<strong>and</strong> <strong>and</strong> just-in-time,<br />
farmers have sometimes made private investments in ground<strong>water</strong> technology as a substitute for<br />
unreliable or inequitable surface irrigation services. In many senses, ground<strong>water</strong> has been used<br />
by farmers to break out of conventional comm<strong>and</strong> <strong>and</strong> control irrigation administration. Some<br />
of the management challenges posed by large surface irrigation schemes are avoided, but the
26 CHAPTER 3 The use of <strong>water</strong> in agriculture<br />
aggregate impact of a large number of individual users can be damaging, <strong>and</strong> moderating the ‘race<br />
to the pump-house’ has proved difficult. However, as ground<strong>water</strong> pumping involves a direct<br />
cost to the farmer, the incentives to use ground<strong>water</strong> efficiently are high. These incentives do not<br />
apply so effectively where energy costs are subsidized; such distortion has arguably accelerated<br />
ground<strong>water</strong> depletion in parts of India <strong>and</strong> Pakistan.<br />
The technical principles involved in sustainable ground<strong>water</strong> <strong>and</strong> aquifer management are well<br />
known but practical implementation of ground<strong>water</strong> management has encountered serious<br />
difficulties. This is largely due to ground<strong>water</strong>’s traditional legal status as part of l<strong>and</strong> property<br />
<strong>and</strong> the competing interests of farmers withdrawing <strong>water</strong> from common-property aquifers<br />
(Burke <strong>and</strong> Moench, 2000). Abstraction can result in <strong>water</strong> levels declining beyond the economic<br />
reach of pumping technology; this may penalize poorer farmers <strong>and</strong> result in areas being taken<br />
out of agricultural production. When near the sea, or in proximity to saline ground<strong>water</strong>, overpumped<br />
aquifers are prone to saline intrusion. Ground<strong>water</strong> quality is also threatened by the<br />
application of fertilizers, herbicides <strong>and</strong> pesticides that percolate into aquifers. These ‘non-point’<br />
sources of pollution from agricultural activity often take time to become apparent, but their effects<br />
can be long-lasting, particularly in the case of persistent <strong>org</strong>anic pollutants.<br />
Fossil ground<strong>water</strong>, that is, ground<strong>water</strong> contained in aquifers that are not actively recharged,<br />
represent a valuable but exhaustible resource. Thus, for example, the large sedimentary aquifers<br />
of North Africa <strong>and</strong> the Middle East, decoupled from contemporary recharge, have already<br />
been exploited for large-scale agricultural development in a process of planned depletion. The<br />
degree to which further abstractions occur will be limited in some cases by the economic limits to<br />
pumping, <strong>and</strong> promoted where strong economic dem<strong>and</strong> from agriculture or urban <strong>water</strong> supply<br />
becomes effective (Schiffle, 1998). Two countries, Libyan Arab Jamahiriya <strong>and</strong> Saudi Arabia, are<br />
already using considerably more <strong>water</strong> for irrigation than their annual renewable resources, by<br />
drawing on fossil ground<strong>water</strong> reserves. Several other countries rely to a limited extent on fossil<br />
ground<strong>water</strong> for irrigation. Where such ground<strong>water</strong> reserves have a high strategic value in terms<br />
of <strong>water</strong> security, the depletion of such reserves to irrigate is questionable.
AGRICULTURE, FOOD AND WATER<br />
27<br />
BOX 3 FOOD SECURITY AND ITS INDICATORS<br />
Food security is defined by <strong>FAO</strong> as physical, social <strong>and</strong> economic access for all people to sufficient,<br />
safe <strong>and</strong> nutritious <strong>food</strong> that meets their dietary needs <strong>and</strong> <strong>food</strong> preferences for an active <strong>and</strong> healthy<br />
life. Its converse, <strong>food</strong> insecurity, applies when people live with hunger <strong>and</strong> fear of starvation. Food<br />
security requires that:<br />
sufficient quantities of <strong>food</strong> of appropriate quality be available – a production issue;<br />
individuals <strong>and</strong> households have access to appropriate <strong>food</strong>s – a poverty issue; <strong>and</strong><br />
nourishment is taken under good conditions, including regular meals, safe <strong>food</strong>, clean <strong>water</strong><br />
<strong>and</strong> adequate sanitation – a public health issue.<br />
The individual state of health is also relevant for <strong>food</strong> security as disease-stricken people are<br />
hampered or unable to contribute to their own <strong>and</strong> their household’s <strong>food</strong> security. By the same<br />
token, undernourished people are much more prone to disease.<br />
For regional <strong>and</strong> global assessments, per capita <strong>food</strong> intake per day in kilocalories is used as the<br />
indicator for <strong>food</strong> security. This indicator is derived from agricultural production <strong>and</strong> trade statistics.<br />
At the national level, a per capita <strong>food</strong> intake of less than 2,200 kcal/day is taken as indicative of a<br />
very poor level of <strong>food</strong> security, with a large proportion of the population affected by malnutrition.<br />
A level of more than 2,700 kcal/day indicates that only a small proportion of people will be affected<br />
by undernourishment. As people are enabled to access <strong>food</strong>, per capita <strong>food</strong> intake increases rapidly<br />
but levels off in the mid-3,000s. It must be stressed that per capita <strong>food</strong> intake in terms of kilocalories<br />
is only an indicator of <strong>food</strong> security: adequate nutrition requires, in addition to calories, a balanced<br />
diversity of <strong>food</strong> including all necessary nutrients.
AGRICULTURE, FOOD AND WATER<br />
29<br />
CHAPTER FOUR<br />
Ensuring access<br />
to <strong>food</strong> for all<br />
The markets fail to provide <strong>food</strong> for all<br />
Since the 1960s, market <strong>food</strong> prices have been low while <strong>food</strong> production satisfied market<br />
dem<strong>and</strong>. However, <strong>FAO</strong>’s estimates indicate that in 1998 there were 815 million undernourished<br />
people in the world: 777 million in the developing countries, 27 million in countries in transition<br />
<strong>and</strong> 11 million in the industrialized countries. The world is capable of producing sufficient <strong>food</strong> to<br />
feed its population until 2030 <strong>and</strong> beyond (actually, a growing part of cereal production is already<br />
dedicated to animal feed). The 1996 World Food Summit set a target of reducing the number of<br />
undernourished people to 400 million by 2015. <strong>FAO</strong> projections indicate that this target may not<br />
be achieved before 2030. The normative target <strong>and</strong> the projection of the current course of events<br />
are illustrated in Figure 7.<br />
Figure 7 Progress towards the World Food Summit target<br />
Millions of undernourished<br />
1 000<br />
900<br />
Trend<br />
800<br />
700<br />
600<br />
<strong>FAO</strong><br />
projections<br />
500<br />
Path to the World<br />
Food Summit Target<br />
400<br />
World Food Summit<br />
base period 1990-92<br />
300<br />
1970 1980 1990 2000 2010 2020 2030<br />
<strong>FAO</strong> projections of attainment<br />
of the World Summit <strong>food</strong><br />
security goal are clearly at<br />
odds with the targeted goal.<br />
According to <strong>FAO</strong> estimates,<br />
the World Summit goal<br />
would not be achieved<br />
before 2030, fifteen years<br />
behind schedule.<br />
Source: <strong>FAO</strong>, 2002.<br />
The plight of undernourished people needs to be addressed through pro-active implementation of<br />
<strong>food</strong>-security programmes. Necessary policy adjustment should be tailored to ensure that people<br />
can apply their initiative <strong>and</strong> ingenuity to access <strong>food</strong> <strong>and</strong> establish a livelihood. Food security<br />
programmes should identify the most vulnerable categories of population <strong>and</strong> consider their assets<br />
<strong>and</strong> constraints in order to emerge from poverty. <strong>FAO</strong> has developed specific indicators for this<br />
purpose (see Box 3). A first level of support is emergency assistance to households that have been
30 CHAPTER 4 Ensuring access to <strong>food</strong> for all<br />
hit by natural, man-made or individual disasters. Households weakened by hunger <strong>and</strong> disease<br />
need to be restored to the necessary strength for being able to apply themselves to construction of<br />
a viable livelihood. At this point, people may need punctual support to realize their plans. External<br />
support may take a variety of forms, from provision of seeds <strong>and</strong> tools to capacity building <strong>and</strong><br />
infrastructure development. Many poverty alleviation activities bear some relation with <strong>water</strong>.<br />
The role of irrigation is discussed further on.<br />
The undernourished: where, who, <strong>and</strong> why?<br />
Figure 8 <strong>and</strong> map 3 identify the countries with the highest prevalence of undernourished people.<br />
Many of these countries have been stricken by war <strong>and</strong> natural disasters, including extended<br />
periods of drought. Within the countries, large numbers of undernourished people live in<br />
environmentally degraded rural areas <strong>and</strong> in urban slums. During the 1990s, the number of<br />
undernourished people fell steeply in East Asia. In South Asia, although the proportion fell, the<br />
total number remained almost constant. In sub-Saharan Africa, the proportion remained virtually<br />
unchanged, which meant that the number of undernourished people rose steeply. Food security<br />
action has therefore a special focus on sub-Saharan Africa.<br />
Many undernourished people are refugees who have lost their physical <strong>and</strong> social assets in<br />
displacement caused by war or natural disaster. The cause of displacement can also be unmitigated<br />
externalities stemming, for example, from urban development <strong>and</strong> consequent <strong>water</strong> pollution, as<br />
well as construction of dams <strong>and</strong> consequent flooding of the l<strong>and</strong>. Some national macro-policies have<br />
failed to recognize the importance of agriculture <strong>and</strong> have also contributed to the forces pushing<br />
Figure 8 Proportion of undernourished people in developing countries, 1990–1992 <strong>and</strong> 1997–1999<br />
%<br />
Category 1:<br />
AGRICULTURE, FOOD AND WATER<br />
31<br />
Map 3 Percentage of undernourished people by country (1998)<br />
No data<br />
< 2.5%<br />
2.5 – 5%<br />
5 – 20%<br />
20 – 35%<br />
> 35%<br />
This map shows large regional disparities in the proportion of undernourished people throughout the world, <strong>and</strong> illustrates<br />
the typical division between developed <strong>and</strong> underdeveloped countries. Whereas western Europe <strong>and</strong> North America have<br />
reasonable <strong>food</strong> security levels, much of Africa, <strong>and</strong> large parts of Latin America <strong>and</strong> Asia do not enjoy the same luxury.<br />
Source: <strong>FAO</strong>, 2001b.<br />
Category 4:<br />
20–34% undernourished<br />
Category 5:<br />
≥35% undernourished<br />
%<br />
Venezuela<br />
Sudan<br />
Thail<strong>and</strong><br />
Honduras<br />
Guatemala<br />
Bolivia<br />
Nepal<br />
India<br />
Sri Lanka<br />
Botswana<br />
Philippines<br />
Senegal<br />
Burkina Faso<br />
Dominican Republic<br />
Lesotho<br />
Cameroon<br />
Papua New Guinea<br />
Mali<br />
Ug<strong>and</strong>a<br />
Lao People's Dem. Rep.<br />
Nicaragua<br />
Congo<br />
Namibia<br />
Bangladesh<br />
Yemen<br />
Chad<br />
Guinea<br />
Malawi<br />
Cambodia<br />
Zimbabwe<br />
Rw<strong>and</strong>a<br />
Dem. People's Rep. of Korea<br />
Madagascar<br />
Niger<br />
Sierra Leone<br />
Liberia<br />
Mongolia<br />
Central African Republic<br />
Kenya<br />
United Rep. of Tanzania<br />
Zambia<br />
Ethiopia<br />
Angola<br />
Mozambique<br />
Haiti<br />
Eritrea<br />
Afghanistan<br />
Dem. Rep. of Congo<br />
Burundi<br />
Somalia<br />
This graph indicates the levels of malnutrition in developing countries between 1990-92 <strong>and</strong> 1997-99.<br />
While a majority of countries have reduced their level of malnutrition, there are still many cases of worsening situations.<br />
Source: <strong>FAO</strong>, 2001b.
32 CHAPTER 4 Ensuring access to <strong>food</strong> for all<br />
rural people into poverty. In rural areas, the people most affected include smallholders, l<strong>and</strong>less<br />
labourers, traditional herders, fishermen <strong>and</strong> generally marginalized groups such as refugees,<br />
indigenous peoples <strong>and</strong> female-headed households. Children are particularly vulnerable to the full<br />
impact of hunger, which can lead to permanent impairment of physical <strong>and</strong> mental development.<br />
Undernourishment is a characteristic feature of poverty. Poverty includes deprivation of health,<br />
education, nutrition, safety, <strong>and</strong> legal <strong>and</strong> political rights. Hunger is a symptom of poverty <strong>and</strong> also<br />
one of its causes. These dimensions of deprivation interact with <strong>and</strong> reinforce each other. Hunger is a<br />
condition produced by human action, or lack of human action to correct it. For example, in the early<br />
1990s nearly 80 percent of all malnourished children lived in developing countries that produced<br />
<strong>food</strong> surpluses. Lack of access to <strong>water</strong> to provide basic health services <strong>and</strong> support reliable <strong>food</strong><br />
production is often a primary cause of undernourishment. To eradicate hunger, abundant <strong>food</strong><br />
production is a requirement, but in addition existing <strong>food</strong> needs to be accessible to all.<br />
The role of irrigation in alleviating poverty<br />
<strong>and</strong> improving <strong>food</strong> security<br />
There is a positive, albeit complex, link between <strong>water</strong> services for irrigation <strong>and</strong> other farm<br />
use, poverty alleviation <strong>and</strong> <strong>food</strong> security (IFAD, 2001; <strong>FAO</strong>, 2001a; <strong>FAO</strong>/World Bank, 2001).<br />
Many of the rural poor work directly in agriculture, as smallholders, farm labourers or herders.<br />
The overall impact can be remarkable: in India, for example, in unirrigated districts 69 percent<br />
of people are poor, while in irrigated districts, only 26 percent are poor (World Bank, 1991).<br />
Their income can be boosted by pro-poor measures, such as ensuring fair access to l<strong>and</strong>, <strong>water</strong><br />
<strong>and</strong> other assets <strong>and</strong> inputs, <strong>and</strong> to services, including education <strong>and</strong> health. Relevant reforms of<br />
agricultural policy <strong>and</strong> practices can strengthen these measures.<br />
The availability of <strong>water</strong> confers opportunities to individuals <strong>and</strong> communities to boost <strong>food</strong><br />
production, both in quantity <strong>and</strong> diversity, to satisfy their own needs <strong>and</strong> also to generate income<br />
from surpluses. Irrigation has a l<strong>and</strong>-augmenting effect <strong>and</strong> can therefore mean the difference<br />
between extreme poverty <strong>and</strong> the satisfaction of the household’s basic needs. It is generally<br />
recognized that in order to have an impact on <strong>food</strong> security, irrigation projects need to be integrated<br />
with an entire range of complementary measures, ranging from credit, marketing <strong>and</strong> agricultural<br />
extension advice to improvement of communications, health <strong>and</strong> education infrastructure (see Box<br />
4 for an example from Senegal). L<strong>and</strong> tenure may also represent a major constraint: irrigation<br />
schemes controlled by absentee l<strong>and</strong>owners <strong>and</strong> serving distant markets, even when highly efficient,<br />
may fail to improve local <strong>food</strong> security when both commodities <strong>and</strong> benefits are exported.<br />
Irrigation projects are as diverse as the local situations in which they are implemented. Generally,<br />
small-scale irrigation projects including projects based on shallow ground<strong>water</strong> pumping provide
AGRICULTURE, FOOD AND WATER<br />
33<br />
BOX 4 WATER AND FOOD SECURITY IN THE SENEGAL RIVER BASIN<br />
Parts of the Senegal River basin in Senegal <strong>and</strong> Mauritania are entirely situated in the arid Sahelian<br />
zone with, in the lower valley <strong>and</strong> the delta, a total annual rainfall that rarely exceeds 400 mm.<br />
Thus, when used in the low-lying areas, the rain-dependent crops of the plateau <strong>and</strong> flood-recession<br />
crops barely meet the <strong>food</strong> needs of farming families. During periods of drought like those of the<br />
1970s, local populations are drastically affected; for this reason one of the four fundamental tasks<br />
for the Organization for the Development of the Senegal River (OMVS) at its founding in 1972 was<br />
‘to create <strong>food</strong> self-sufficiency for populations in the Senegal River basin <strong>and</strong>, by extension, for the<br />
subregion.’ To this end the goal set was to develop 375 000 hectares out of a potential irrigable area of<br />
823 000 hectares, by combined operation of the Manantali <strong>and</strong> Diama dams. The crops targeted for<br />
irrigation were rice <strong>and</strong> wheat, to be added to s<strong>org</strong>hum, maize <strong>and</strong> market gardening – the traditional<br />
rain-dependent <strong>and</strong> recession crops. With respect to this goal, a total of some 100 000 hectares has<br />
so far been developed. However, a 1996 study by the International Institute for Environment <strong>and</strong><br />
Development (IIED) indicated that no single type of farming could guarantee the survival of the<br />
family unit <strong>and</strong> that crop diversification was essential. The study also pointed out the major issues in<br />
optimizing flood plain development as part of the fight for <strong>food</strong> security. These geographical areas are<br />
vital for agriculture, fishing, livestock pasture <strong>and</strong> forest regeneration. This is why, after the dams were<br />
filled in 1986 <strong>and</strong> 1987, OMVS decided to simultaneously exp<strong>and</strong> the irrigated areas by delivering<br />
artificial flooding that would guarantee between 50 000 hectares <strong>and</strong> 100 000 hectares of recession<br />
crops <strong>and</strong> ensure 63 000 ha of pasture <strong>and</strong> wooded areas for 2.7 million cattle <strong>and</strong> 4.5 million sheep<br />
<strong>and</strong> goats. Fishing is also an economically <strong>and</strong> socially important activity in the Senegal River basin.<br />
With annual catches estimated at between 26 000 <strong>and</strong> 47 000 tons, it represents a substantial income<br />
for the populations concerned. The storage lakes of the Diama <strong>and</strong> Manantali dams – 11.5 million m 3<br />
spread over 500 km 2 – have attracted large fishing communities since the dams became operational.<br />
The programmes begun by OMVS thus contribute to achieving <strong>food</strong> security in the area. For this aim<br />
to be met as quickly as possible, the OMVS High Commission sees a need, on the one h<strong>and</strong>, for<br />
increased technical, institutional <strong>and</strong> financial means so as to accelerate development <strong>and</strong> ensure<br />
sound management, <strong>and</strong> on the other h<strong>and</strong>, for technical improvements permitting more intensive<br />
farming, higher yields <strong>and</strong> a close association between farming, fishing, livestock-raising, forestry <strong>and</strong><br />
the <strong>water</strong> economy.<br />
Source: Prepared for the World Water Assessment Programme (WWAP), by the<br />
Organization for the Development of the Senegal River (OMVS), 2002.<br />
a manageable framework that can give control to the local poor <strong>and</strong> avoid leaking resources<br />
to the non-poor. Large-scale irrigation, as may be determined by the need to carry out largescale<br />
engineering works to harness <strong>water</strong> <strong>and</strong> convey it to the fields, can also be made to work<br />
for the poor provided that the benefits can be shared equitably, <strong>and</strong> investment, operation <strong>and</strong><br />
maintenance costs are efficiently covered.<br />
Managing agricultural risk for sustainable livelihoods<br />
Community-managed small-scale irrigation systems, by improving yields <strong>and</strong> cropping intensities,<br />
have proved effective in alleviating rural poverty <strong>and</strong> eradicating <strong>food</strong> insecurity. Marketing of<br />
agricultural produce, both locally <strong>and</strong> at more distant places when adequate transport <strong>and</strong>
34 CHAPTER 4 Ensuring access to <strong>food</strong> for all<br />
communication infrastructure is available, can make a significant contribution to the income of<br />
farmers. Bank deposits <strong>and</strong> credits, as well as crop insurance, can be used to finance agricultural<br />
operations <strong>and</strong> buffer against climatic risk. However, banking services usually are not accessible<br />
to people who have no collateral assets. Many rural credit systems may also not accommodate payback<br />
over a period of years – the time needed to realize the benefits from investment in irrigation<br />
technology. However, non-conventional credit systems based on trust <strong>and</strong> social solidarity can<br />
support poor farmers. Improvement in poor people’s <strong>food</strong> commodity storage facilities reduces<br />
post-harvest losses <strong>and</strong> can save significant amounts of <strong>food</strong>, thus contributing to <strong>food</strong> security.<br />
Similarly, where technically <strong>and</strong> financially possible, storing <strong>water</strong> in surface reservoirs <strong>and</strong><br />
aquifers is a strategic means for managing agricultural risk. Water in the reservoir or the aquifer<br />
is, in a way, equivalent to money in the bank.<br />
Irrigation contributes to creating off-farm employment<br />
Irrigation, supported through inputs such as high-yielding varieties, nutrients <strong>and</strong> pest<br />
management, together with a more extended agricultural season, higher cropping intensity <strong>and</strong><br />
a more diverse assortment of crops, can generate rural employment in other non-agricultural<br />
services. The productivity boost provided by irrigated agriculture results in increased <strong>and</strong><br />
sustained rural employment, thereby reducing the hardships experienced by rural populations<br />
that might otherwise drift to urban areas under economic pressure. Growth in the incomes of<br />
farmers <strong>and</strong> farm labourers creates increased dem<strong>and</strong> for basic non-farm products <strong>and</strong> services<br />
in rural areas. These goods <strong>and</strong> services are often difficult to trade over long distances. They tend<br />
to be produced <strong>and</strong> provided locally, usually with labour-intensive methods, <strong>and</strong> so have great<br />
potential to create employment <strong>and</strong> alleviate poverty. Studies in many countries have shown<br />
multipliers ranging from two (in Malaysia, India <strong>and</strong> the United States) to six (in Australia,<br />
World Bank, 2002).<br />
The contribution of fisheries<br />
<strong>and</strong> aquaculture to <strong>food</strong> security<br />
Fish has a very good nutrient profile <strong>and</strong> is an excellent source of high-quality animal protein<br />
<strong>and</strong> of highly-digestible energy. Refugees <strong>and</strong> displaced people facing <strong>food</strong> insecurity may turn to<br />
fishing for survival, where this possibility exists. Staple-<strong>food</strong> fish, often low-valued fish species, is<br />
in high dem<strong>and</strong> in most developing countries, because of its affordability.<br />
Inl<strong>and</strong> fish production provides significant contributions to animal protein supplies in many rural<br />
areas. In some regions fresh<strong>water</strong> fish represent an essential, often irreplaceable source of cheap<br />
high-quality animal protein, crucial to a well-balanced diet in marginally <strong>food</strong>-secure communities.
AGRICULTURE, FOOD AND WATER<br />
35<br />
Most inl<strong>and</strong> fish produce is consumed locally, marketed domestically, <strong>and</strong> often contributes to the<br />
subsistence <strong>and</strong> livelihood of poor people. The degree of participation in fishing <strong>and</strong> fish farming<br />
is high in many rural communities. Fish production is often undertaken in addition to agricultural<br />
or other activities. Yields from inl<strong>and</strong> capture fisheries, especially subsistence fisheries, can be<br />
very significant, even though they are often greatly under-reported. Yields from inl<strong>and</strong> capture<br />
fisheries are highest in Asia in terms of total volumes, but are also important in sub-Saharan<br />
Africa. Fishery enhancement techniques, especially stocking of natural <strong>and</strong> artificial <strong>water</strong> bodies,<br />
are making a major contribution to the total catch (<strong>FAO</strong>, 2000).<br />
Rural aquaculture contributes to the alleviation of poverty directly through small-scale household<br />
farming of aquatic <strong>org</strong>anisms for domestic consumption <strong>and</strong> income. It also contributes indirectly<br />
through employment of the poor as service providers to aquaculture or as workers on aquatic<br />
farms. Poor rural <strong>and</strong> urban consumers can greatly benefit from low-cost fish provided by<br />
aquaculture. For aquaculture to be effective in alleviating poverty, it should focus on low-cost<br />
products favoured by the poor, <strong>and</strong> emphasis should be placed on aquatic species feeding low in<br />
the <strong>food</strong> chain. The potential exists for aquaculture production for local markets <strong>and</strong> consumers.<br />
Combined rice-fish systems are possible <strong>and</strong> carry high benefits because they provide cereals <strong>and</strong><br />
protein at the same time. These systems have also been shown to have beneficial effects on the<br />
malaria situation, where mosquito vectors breed in rice fields <strong>and</strong> where the selected fish species<br />
feed on the mosquito larvae. This is the case in parts of Indonesia, for example (see Box 5).<br />
BOX 5 RICE-FISH FARMING IN LAOS<br />
Lao People’s Democratic Republic has extensive <strong>water</strong> resources in the form of rivers, lakes <strong>and</strong><br />
wetl<strong>and</strong>s. Fisheries <strong>and</strong> the collection of aquatic animals during the rainy season are important<br />
activities in the country <strong>and</strong> fish forms an important part of the national diet. Rice cultivation is<br />
widespread in rainfed, irrigated <strong>and</strong> terraced fields. Rice is mostly cultivated on a one-crop-per-year<br />
basis, but in irrigated areas two crops per year are possible. In upl<strong>and</strong> rainfed fields, bunds are often<br />
raised to increase <strong>water</strong> depth for fish cultivation. In some cases, a small channel is constructed to<br />
facilitate fish capture. In the Mekong River plain, rice-fish farming is practiced in rainfed rice fields<br />
where soils are relatively impermeable as well as in irrigated rice fields, which offer ideal conditions<br />
for fish cultivation. As elsewhere, there is little reliable data available concerning production levels<br />
from rice-fish farming but productions of 125 to 240 kg/hectare/year have been reported for upl<strong>and</strong><br />
rice-fish production systems. Carp, tilapia <strong>and</strong> other species cultured in this system are mostly for<br />
consumption in the farmer’s home. While rice-fish farming is popular with farmers, there are some<br />
constraints that need to be addressed through proper support. Integrated pest management practices<br />
should be applied to reduce pesticide use. Furthermore, fingerlings need to be made available more<br />
easily <strong>and</strong> farmers’ access to credit should be improved.<br />
Source: Dixon et al., 2001.
36 CHAPTER 4 Ensuring access to <strong>food</strong> for all<br />
Forestry <strong>and</strong> <strong>food</strong> security<br />
A large number of forest products contribute to <strong>food</strong> security: <strong>FAO</strong> estimates that about 1.6<br />
billion people in the world rely to a certain extent on forest resources for their livelihoods. For<br />
most rural people in the world, firewood provides the fuel for cooking <strong>food</strong>, <strong>and</strong> so its availability<br />
is an integral part of <strong>food</strong> security. The bio-energy sector generates employment <strong>and</strong> income in<br />
developing countries.<br />
Most forests <strong>and</strong> tree plantations subsist on rain<strong>water</strong>, or may develop around irrigation schemes.<br />
Some tree species can use large amounts of <strong>water</strong> drawn from <strong>water</strong> storage in the soil profile<br />
<strong>and</strong> in shallow aquifers. Trees in forests <strong>and</strong> outside of forests provide significant benefits to poor<br />
people <strong>and</strong> contribute to <strong>food</strong> security. The benefits from <strong>water</strong> used by forests are largely seen<br />
in terms of wood <strong>and</strong> non-wood products, as well as in protecting the environment, reducing soil<br />
degradation, <strong>and</strong> preserving biodiversity.
AGRICULTURE, FOOD AND WATER<br />
37<br />
CHAPTER FIVE<br />
Trends in irrigation-<strong>water</strong><br />
management<br />
Adapting institutional arrangements<br />
The institutional arrangements governing irrigation-<strong>water</strong> appropriation <strong>and</strong> use have been<br />
established over the centuries in various countries under different environmental <strong>and</strong> social<br />
circumstances. Adapting to new pressures that call for higher <strong>water</strong> productivity <strong>and</strong> increased<br />
user participation <strong>and</strong> liability in cost recovery has proved difficult. With increasing competition<br />
for <strong>water</strong>, both within the irrigated subsector (between farmers) <strong>and</strong> with other economic<br />
sectors – principally municipalities, industry <strong>and</strong> hydropower - irrigation institutions are often<br />
not adequately equipped to adapt to changing circumstances <strong>and</strong> expectations. The competing<br />
dem<strong>and</strong>s from municipalities, industry <strong>and</strong> the energy sector are forcing transfers from agriculture<br />
to other, higher value, uses. Figure 4 earlier showed an example of this process at work in one<br />
district in China.<br />
Irrigated agriculture has played a pivotal role in keeping up with global <strong>food</strong> dem<strong>and</strong>s in the<br />
twentieth century, but into the twenty-first century there is continued evidence of lacklustre<br />
performance in the public sector alongside a frustrated private sector. In many cases, distorted<br />
markets, ill-conceived incentives <strong>and</strong> institutional rigidity plague the irrigation subsector.<br />
Producers are seeking financial returns against tight margins for <strong>food</strong> commodities, subsidies for<br />
rainfed agriculture <strong>and</strong> varying degrees of competition for raw <strong>water</strong> from other sectors, <strong>and</strong> are<br />
also expected to maintain environmental integrity.<br />
One troubling aspect is the continued expectation that the physical endowments of l<strong>and</strong> <strong>and</strong> <strong>water</strong><br />
equate to a ‘potential’ that needs to be realized, without parallel analysis of economic, financial,<br />
institutional <strong>and</strong> environmental constraints <strong>and</strong> without a realistic market analysis. This has<br />
conditioned the approach that many governments continue to take in implementing irrigation<br />
<strong>and</strong> <strong>water</strong> policies, irrigation institutions <strong>and</strong> in allocating public-sector budgets. There has<br />
been a dominance of supply-led approaches predicated upon large-scale irrigation infrastructure<br />
<strong>and</strong> governments have shown determination in continuing to play a role in operating public<br />
infrastructure for the supply of irrigation services. In many instances, there is a sharp discontinuity<br />
in policy, institutional capacity, investment between the provision of irrigation services <strong>and</strong> the<br />
promotion of agricultural systems. This applies to many of the key developing economies. It could<br />
be argued that if irrigated agriculture has its failures, it is in a large part because it has focused<br />
essentially on providing <strong>water</strong> <strong>and</strong> not enough on the productivity of the agricultural systems <strong>and</strong><br />
their responsiveness to agricultural markets.
38 CHAPTER 5 Trends in irrigation-<strong>water</strong> management<br />
Increasing private investment in irrigation<br />
Investment in large irrigation projects increased in the 1970s <strong>and</strong> then fell by more than 50 percent<br />
in the 1980s. It further declined in the 1990s. Most of the <strong>water</strong>-related infrastructure projects over<br />
the past forty to fifty years were financed by the governmental sector with significant intervention<br />
by the international development banks. Development costs for new irrigation l<strong>and</strong>s have increased<br />
markedly in recent years; for example, costs have been increasing by more than 50 percent in the<br />
Philippines, 40 percent in Thail<strong>and</strong> <strong>and</strong> have nearly tripled in Sri Lanka. With declining crop<br />
prices, it is difficult to justify new irrigation development. Financial capability is lacking for new<br />
infrastructure as well as for modernizing present structure <strong>and</strong> ensuring system sustainability.<br />
Recently there has been an increase in the private-sector financing of large <strong>water</strong>-sector<br />
infrastructure, <strong>and</strong> small-scale irrigation systems. According to the World Bank, 15 percent of<br />
the infrastructure is currently being financed through private funds, <strong>and</strong> this is part of a growing<br />
trend. Ground<strong>water</strong> development has proved a particularly attractive target for private investment<br />
because of the private level of control it offers.<br />
Reforming irrigation: modernization <strong>and</strong> empowerment<br />
During the green revolution of the 1960s <strong>and</strong> 1970s, making irrigation <strong>water</strong> available to farmers<br />
had a high priority. Governments had surface irrigation systems established <strong>and</strong> managed through<br />
public sector agencies. Some large-scale systems were poorly designed, with insufficient provision<br />
for drainage <strong>and</strong> consequent soil degradation. System management often failed to respond to the<br />
needs of users, in particular of smallholders <strong>and</strong> sectors carrying low social <strong>and</strong> political weight.<br />
Water-use fees were not collected or not applied to proper system operation <strong>and</strong> maintenance.<br />
Large rehabilitation needs emerged <strong>and</strong> as governments <strong>and</strong> international lending institutions<br />
found it difficult to raise funds for this purpose, it became clear that the economic <strong>and</strong> social<br />
context of large-scale irrigation needed to be reformed.<br />
Reforming efforts focused on transferring responsibility for operating <strong>and</strong> maintaining irrigation<br />
systems to the farmers, <strong>org</strong>anized in <strong>water</strong>-user associations. This highlighted the need for building<br />
<strong>and</strong> developing managerial capacity among stakeholders, while confining irrigation-system<br />
administration to the role of <strong>water</strong>-service provider. Empowerment alone may not be sufficient<br />
unless deficiencies in design <strong>and</strong> operation <strong>and</strong>/or upgrade of infrastructures are addressed.<br />
Irrigation modernization is a process of change from supply-oriented to service-oriented<br />
irrigation. It involves institutional, <strong>org</strong>anizational <strong>and</strong> technological changes <strong>and</strong> transforms a<br />
traditional irrigation scheme from protective to productive irrigation. The modernization <strong>and</strong><br />
transfer of some management responsibilities of government-held irrigation systems to <strong>water</strong>-user<br />
associations <strong>and</strong> service-providing companies have been carried out in several countries such as<br />
Mexico, China <strong>and</strong> Turkey <strong>and</strong> has proved beneficial in certain cases. However, governments
AGRICULTURE, FOOD AND WATER<br />
39<br />
have tended to be only half-hearted when enacting complementary policies <strong>and</strong> institutional<br />
reforms that are necessary to provide the appropriate environment for effective operation of<br />
the new irrigation management entities. The process of empowering marginalized stakeholders,<br />
including smallholders, <strong>and</strong> evicting political influence from irrigation management, is as yet not<br />
completed. Irrigation management transfer is complicated because of a number of factors. Firstly<br />
there is a need to promote poor stakeholders into equity with non-poor stakeholders <strong>and</strong> reconcile<br />
conflict between upstream <strong>and</strong> downstream users. Secondly, the transaction costs of <strong>water</strong>-user<br />
associations may be higher than under properly working ‘comm<strong>and</strong> <strong>and</strong> control’ management<br />
establishments. Finally, the apportionment of financial <strong>and</strong> operation risk <strong>and</strong> liability is difficult<br />
to make when a large-scale infrastructure is transferred to user associations or service companies<br />
not prepared for such responsibilities.<br />
Equity in the roles of men <strong>and</strong> women in irrigation<br />
Gender equity is a case in point. Women are among the main stakeholders in poverty alleviation,<br />
in <strong>food</strong> production in irrigated <strong>and</strong> non-irrigated agriculture, <strong>and</strong> in ensuring <strong>and</strong> dispensing<br />
nutrition at the household level. A majority of the poor, estimated at 70 percent, are rural<br />
people, <strong>and</strong> rural poverty has become feminized as men of productive age migrate away from<br />
impoverished rural areas to the more promising urban environment, or are forcibly recruited by<br />
warring factions, leaving behind the women, the elderly, the sick <strong>and</strong> the children. In rural areas<br />
endemically stricken by conflicts, whatever little infrastructure there was collapses or is wantonly<br />
destroyed <strong>and</strong> insecurity prevails, increasing the burden on women. Households headed by<br />
women are recognized among the poorest of the poor. Against a biased view that ‘women do not<br />
irrigate’, women are now recognized as actively involved in irrigation, often demonstrating high<br />
levels of skill (see Box 8).<br />
BOX 6 LAND OWNERSHIP AND ECONOMIC INDEPENDENCE<br />
A recent study in Dakiri, Burkina Faso, shows that allocating smaller plots to men <strong>and</strong> women<br />
separately instead of allocating larger plots to household heads has produced both higher yields<br />
<strong>and</strong> social benefits. When both men <strong>and</strong> women have irrigated plots, the productivity of irrigated<br />
l<strong>and</strong> <strong>and</strong> labour is higher than in households where only men have plots. Women are equally<br />
good or even better irrigation farmers than men, <strong>and</strong> those who have obtained irrigated plots are<br />
proud of their increased ability to contribute to the needs of their households. Women prefer to<br />
contribute to their households by working on their own plots rather than providing additional<br />
labour to their spouse’s or to the collective plots. As they become economically less dependent<br />
upon their husb<strong>and</strong>s, they can help support their relatives <strong>and</strong> increase their own opportunities for<br />
individual accumulation of wealth in the form of livestock. The effects of having an individual plot<br />
significantly improve the bargaining position of a woman within a household <strong>and</strong> are a source of<br />
pride in the household <strong>and</strong> the community.<br />
Source: OECD/DAC, 1998.
40 CHAPTER 5 Trends in irrigation-<strong>water</strong> management<br />
Improving <strong>water</strong>-use productivity in agriculture<br />
Improving <strong>water</strong>-use productivity is often understood in terms of obtaining as many kilograms of<br />
crop as possible per m 3 of <strong>water</strong> – ‘more crop for the drop’. Financially astute farmers may prefer<br />
to target a maximum income per m 3 – ‘more dollars for the drop’, while community leaders <strong>and</strong><br />
politicians could be looking for maximum employment <strong>and</strong> widespread income generated through<br />
the crop <strong>and</strong> its derivatives – ‘more jobs for the drop’. In a broad sense, increasing productivity<br />
in agriculture involves deriving more benefit, or achieving more welfare, for every unit of <strong>water</strong><br />
withdrawn from natural <strong>water</strong> bodies.<br />
Technology permits accurate <strong>water</strong> application in the optimum quantity <strong>and</strong> timing for crop<br />
development. Drip irrigation for example can respond to existing soil moisture conditions by<br />
leading the required quantity of <strong>water</strong> to the root zone of the plant. Laser-supported l<strong>and</strong>-levelling<br />
devices allow accurate bounded field irrigation. When such techniques are applied in <strong>water</strong>-scarce<br />
regions with high-value outputs their application results in profit for the farmer. The application of<br />
advanced technology is dependent on a level of investment <strong>and</strong> capacity as well as on an economic<br />
incentive to make it worthwhile. Most irrigation in the world was initially established to take<br />
advantage of otherwise-unused <strong>water</strong>. It should not be surprising that <strong>water</strong>-use efficiency makes<br />
only slow progress wherever <strong>water</strong> is cheap, either because it has no other uses <strong>and</strong> therefore a<br />
low opportunity value, or because it is subsidized. Actually improving efficiency can be a slow<br />
<strong>and</strong> laborious process that requires system modernization, therefore upgrading the technological<br />
environment <strong>and</strong> the knowledge <strong>and</strong> capacity of irrigation operators.<br />
From the perspective of a national economy, a key goal for <strong>water</strong>-use productivity is to improve<br />
net economic returns per dollar invested in <strong>water</strong> use, favouring investment in the urban<br />
<strong>and</strong> industrial sectors. However, such a view may not adequately recognize the social <strong>and</strong><br />
environmental benefits derived from agriculture.<br />
Diversifying crops<br />
Crop diversification, made possible by irrigation, has a beneficial influence on local <strong>food</strong> security<br />
in remote rural areas by supporting a longer growing season <strong>and</strong> providing a healthier, more<br />
diversified diet including fresh produce. At a medium scale, crop diversification strengthens<br />
the rural economy <strong>and</strong> reduces the uncertainty associated with the market vagaries that affect<br />
monocultures. In 1990 in Asia for example, cereals, pulses <strong>and</strong> other crops accounted for 66<br />
percent, 8 percent <strong>and</strong> 26 percent of the total cropped area. By 1997, this had changed to<br />
56 percent, 7 percent <strong>and</strong> 37 percent. Per capita cereal production nevertheless increased<br />
owing to higher yields. Irrigation systems designed for cereal cultivation often do not have<br />
sufficient regulation <strong>and</strong> the effective <strong>water</strong> control structures required for crop diversification.
AGRICULTURE, FOOD AND WATER<br />
41<br />
Diversification also calls for higher levels of management capacity, as it is not enough to produce<br />
a variety of crops: in addition to being produced, these have to be marketed. Policy <strong>and</strong> economic<br />
factors such as market incentives <strong>and</strong> availability of labour influence the crop choice of farmers.<br />
Availability of low-cost pumping technology has supported the expansion, under private initiative<br />
<strong>and</strong> finance, of diversified cropping systems.
AGRICULTURE, FOOD AND WATER<br />
43<br />
CHAPTER SIX<br />
Agricultural <strong>water</strong> use,<br />
environment <strong>and</strong> health<br />
Environmental aspects<br />
<strong>Agriculture</strong> may have distinct negative externalities in terms of <strong>water</strong> quantity <strong>and</strong> quality. Pasture<br />
<strong>and</strong> crops take up 37 percent of the Earth’s l<strong>and</strong> area. <strong>Agriculture</strong> is the largest <strong>water</strong> user <strong>and</strong> the<br />
main source of nitrate pollution of ground <strong>and</strong> surface <strong>water</strong>s, as well as the principal source of<br />
ammonia pollution. It is also a major contributor to the phosphate pollution of <strong>water</strong>ways <strong>and</strong> of<br />
release to the atmosphere of the greenhouse gases methane <strong>and</strong> nitrous oxide. L<strong>and</strong> degradation,<br />
Stalinization, over-abstraction of ground<strong>water</strong> <strong>and</strong> the reduction of genetic diversity in crop <strong>and</strong><br />
livestock affect the basis of agriculture’s own future. The vanishing Aral Sea is a clear example of<br />
the irreversible impacts of excessive withdrawals. The irrigation sector is coming under increasing<br />
public scrutiny as amenity <strong>and</strong> ecosystem values are lost while the expected economic <strong>and</strong> social<br />
benefits of irrigation systems are not fully realized. Competition between urban dwellers <strong>and</strong><br />
agriculture is also a growing issue <strong>and</strong> may worsen environmental pressure. In developed<br />
countries, environmental concerns have been a key driver for modernizing irrigation systems.<br />
Reclamation of wetl<strong>and</strong>s has historically made a major contribution to agricultural growth.<br />
Because of the presence of <strong>water</strong> during a large part of the year <strong>and</strong> in view of the relative<br />
fertility of their soils, many wetl<strong>and</strong>s have a good potential for agricultural use. However, this<br />
use leads to serious environmental damage, which has been recognized by the adoption of the<br />
Convention on Wetl<strong>and</strong>s (Ramsar, 1971) to protect wetl<strong>and</strong>s. The developing countries still have<br />
some 300 million ha of wetl<strong>and</strong>s that may be suitable for crop production but only a relatively<br />
small percentage is currently used to this end. Where no alternative additional l<strong>and</strong> resources are<br />
available to exploit, wetl<strong>and</strong>s will inevitably be converted to crop production. This is the case in<br />
many parts of sub-Saharan Africa, where the nutritional situation is bad <strong>and</strong> wetl<strong>and</strong>s represent<br />
an attractive opportunity for agricultural development.<br />
Unwise use of wetl<strong>and</strong>s may result in environmental degradation. Draining of wetl<strong>and</strong>s has often<br />
been carried out under the wrong assumption that wetl<strong>and</strong>s are useless <strong>and</strong> worthless. Sustainable<br />
use of wetl<strong>and</strong>s can be achieved by selecting crops adapted to wetl<strong>and</strong> conditions, using<br />
appropriate <strong>water</strong> <strong>and</strong> soil management technologies <strong>and</strong> planning wetl<strong>and</strong> development <strong>and</strong><br />
management carefully within the global framework of the <strong>water</strong>shed area. Wetl<strong>and</strong>s of particular<br />
international or national importance on account of their significance in terms of ecology, botany,<br />
zoology or biodiversity should be protected from any agricultural use <strong>and</strong> from the influences of<br />
agricultural activities in upstream areas.
44 CHAPTER 6 Agricultural <strong>water</strong> use, environment <strong>and</strong> health<br />
Water pollution, habitat degradation <strong>and</strong> massive <strong>water</strong> withdrawals can deprive fishing<br />
communities of their livelihood <strong>and</strong> push them into <strong>food</strong> insecurity. The resulting environmental<br />
impacts affecting fishery resources in inl<strong>and</strong> <strong>water</strong>s can be devastating. Even in estuarine <strong>and</strong><br />
coastal zones at the lower end of river basins, fishery resources are impacted by pollution, habitat<br />
degradation <strong>and</strong> upstream <strong>water</strong> withdrawal <strong>and</strong> use. It is increasingly recognized that agriculture<br />
also has positive externalities, including environmental services <strong>and</strong> products. The multifunctional<br />
nature of agriculture is increasingly acknowledged <strong>and</strong> encouraged, so that farmers are seen not<br />
only as commodity-producers but also appreciated as self-employed citizens, stewards of the<br />
l<strong>and</strong>scape <strong>and</strong> stakeholders in vibrant communities. Trade-offs between <strong>food</strong> security <strong>and</strong> the<br />
environment can be further reduced through already available or emerging technologies <strong>and</strong><br />
l<strong>and</strong>-management practices. By using more sustainable production methods, the negative impacts<br />
of agriculture on the environment can be attenuated. <strong>Agriculture</strong> can play an important role in<br />
reversing negative impacts by, for example, environmentally sound <strong>water</strong> use, biological treatment<br />
of waste, enhancing the infiltration of <strong>water</strong> to reduce flood runoff, preserving agricultural <strong>and</strong><br />
natural biodiversity, <strong>and</strong> storing carbon in soils.<br />
Water-quality deterioration<br />
With rising dem<strong>and</strong>s for <strong>water</strong>, quality concerns over <strong>water</strong> have risen rapidly. Pollutant loads<br />
have increased enormously, <strong>and</strong> at the same time the amounts of <strong>water</strong> available for dilution<br />
are decreasing. The situation is particularly alarming in developing nations while, in developed<br />
countries, the enforcement of <strong>water</strong> quality measures has resulted in improved <strong>water</strong>-quality<br />
conditions for most rivers. Water quality poses a serious threat to the sustainability <strong>and</strong> the safety<br />
of <strong>food</strong> produced by intensive farming systems upon which global <strong>food</strong> security has become<br />
increasingly dependent. Security <strong>and</strong> stability in <strong>food</strong> supplies in this century will be closely<br />
linked to success in <strong>water</strong> quality control. Organic matter, if free of pathogens, can actually be<br />
beneficial to irrigated agriculture (see Box 7), but <strong>water</strong> contamination with hazardous chemicals<br />
makes it unusable for <strong>food</strong> production.<br />
It is estimated that poor drainage <strong>and</strong> irrigation practices have led to <strong>water</strong>logging <strong>and</strong> salinization<br />
of about 10 percent of the world’s irrigated l<strong>and</strong>s, thereby reducing productivity. In particular,<br />
mobilization of resident salts is a widely-occurring phenomenon in irrigated river basins in arid<br />
regions. Waterlogging <strong>and</strong> salinization in large-scale irrigation projects are often the result of<br />
unavailable drainage infrastructure that was not included in the engineering design to make<br />
projects look economically more attractive. These problems are generally associated with<br />
large-scale irrigation development under arid <strong>and</strong> semi-arid conditions, as in the Indus, the<br />
Tigris-Euphrates <strong>and</strong> the Nile river basins. The solutions to these problems are known but their<br />
implementation is costly.
AGRICULTURE, FOOD AND WATER<br />
45<br />
BOX 7 USE OF WASTEWATER FOR IRRIGATION<br />
The cost of disposing of urban waste<strong>water</strong> is all too often externalized against the aquatic environment<br />
<strong>and</strong> downstream users in rivers, estuaries <strong>and</strong> coastal zones <strong>and</strong> hardly, if ever, appears in the benefit<br />
<strong>and</strong> cost accounts. However, waste<strong>water</strong> is recognized as a resource, particularly in <strong>water</strong>-scarce<br />
regions. If the polluter actually pays, waste<strong>water</strong> is free or has only a low cost, is reliable in time<br />
<strong>and</strong> close to urban markets. In addition to direct benefits to farmers who would otherwise have<br />
little or no <strong>water</strong> for irrigation, waste<strong>water</strong> improves soil fertility <strong>and</strong> reduces <strong>water</strong> contamination<br />
downstream. The total l<strong>and</strong> irrigated with raw or partially diluted waste<strong>water</strong> is estimated at 20<br />
million hectares in fifty countries, somewhat below 10 percent of total irrigated l<strong>and</strong> in developing<br />
countries. For irrigation use, waste<strong>water</strong> should be subject to primary <strong>and</strong> secondary treatment,<br />
but in poor countries that is often not the case <strong>and</strong> raw sewage is applied. Disadvantages <strong>and</strong> risks<br />
related to use of insufficiently treated waste<strong>water</strong> concern the exposure of irrigation workers <strong>and</strong><br />
<strong>food</strong> consumers to bacterial, amoebic, viral <strong>and</strong> nematode parasites as well as <strong>org</strong>anic, chemical<br />
<strong>and</strong> heavy metal contaminants. In a context of prevailing poverty, such <strong>water</strong> is used in the informal,<br />
unregulated sector, but sanitary concerns preclude the export of the products <strong>and</strong>, at least partially,<br />
the access to local <strong>food</strong> markets. Governments <strong>and</strong> the development community promote efforts to<br />
lead waste<strong>water</strong> reuse into sustainable channels, but countries <strong>and</strong> municipalities short of resources<br />
are slow in facing the cost of <strong>water</strong> treatment. Given <strong>water</strong> scarcity <strong>and</strong> the relatively high cost of<br />
obtaining potable fresh<strong>water</strong> for municipal uses, the use of treated waste<strong>water</strong> in the urban context<br />
is projected to increase in the future.<br />
Health <strong>and</strong> irrigation<br />
The key irrigation-related vector-borne diseases are malaria, schistosomiasis <strong>and</strong> Japanese<br />
encephalitis. Irrigation development has in the past sometimes been accompanied by adverse<br />
impacts on the health status of local communities. The principal causes for these impacts are<br />
rooted in ecosystem changes that created conditions conducive to the transmission of vectorborne<br />
diseases, <strong>and</strong> drinking <strong>water</strong> supply <strong>and</strong> sanitation conditions leading to gastrointestinal<br />
conditions. The attribution of the burden of each of these diseases to irrigation, or components<br />
thereof in specific settings is complex. Only where irrigation is introduced in an arid region where<br />
the diseases previously did not occur, is the association between the resulting dramatic l<strong>and</strong>scape<br />
changes <strong>and</strong> the explosive rise of disease incidence <strong>and</strong> prevalence clear-cut. In most cases,<br />
there is a complex mixture of contextual determinants of the diseases combined with a number<br />
of confounding factors. For example, in parts of Africa south of the Sahara, the transmission<br />
of malaria is so intense throughout the year that the additional risk factors from irrigation<br />
development will not add to the disease burden. Schistosomiasis, rightly equated with irrigation<br />
in Africa, is also determined by human behaviour <strong>and</strong> by the state of sanitation.<br />
Many vector-borne disease problems in irrigated areas can be traced to absent or inadequate<br />
drainage. The various forms of surface irrigation all impose increased vector-borne disease<br />
hazards, while overhead irrigation <strong>and</strong> drip irrigation are virtually free of such hazards. Crop<br />
selection can be important. In that sense, flooded rice <strong>and</strong> sugarcane are crops that carry increased
46 CHAPTER 6 Agricultural <strong>water</strong> use, environment <strong>and</strong> health<br />
vector-borne disease risk. Irrigated agriculture often requires additional chemical inputs for crop<br />
protection, <strong>and</strong> the application of pesticides can disrupt the ecosystem balance favouring certain<br />
disease vectors; it can also contribute to an accelerated development of resistance to insecticide in<br />
disease vector species.<br />
There are many opportunities in the planning, design <strong>and</strong> operation of irrigation schemes to<br />
incorporate health safeguards: hydraulic structures, for instance, can be designed so they provide<br />
less or no habitat for vector breeding. Improved <strong>water</strong>-management practices such as alternate<br />
wetting <strong>and</strong> drying of irrigated rice fields, rotational drying of parallel irrigation canals, flushing<br />
of canals with pools of st<strong>and</strong>ing <strong>water</strong> <strong>and</strong> clearing canals of aquatic weeks can reduce vector<br />
breeding. Moreover, the very infrastructural development that usually accompanies irrigation<br />
development <strong>and</strong> the economic development that follows in its wake imply improvements in<br />
access to health services <strong>and</strong> increased buying power to purchase drugs, mosquito nets <strong>and</strong> other<br />
preventative <strong>and</strong> protective tools <strong>and</strong> products.<br />
Until the 1980s, a drinking-<strong>water</strong>-supply component was often overlooked in the context<br />
of irrigation development. While this situation has improved, the two types of <strong>water</strong> use are<br />
occasionally at odds. Highly increased chemical inputs may pollute ground<strong>water</strong> <strong>and</strong> local<br />
communities have been known to revert to canal <strong>water</strong> because the quality of <strong>water</strong> from their<br />
pumps had deteriorated. Easy access to large quantities of <strong>water</strong> in irrigation canals for domestic<br />
needs other than drinking will contribute positively to overall hygiene. There are also important<br />
overlaps between operation <strong>and</strong> maintenance tasks for irrigation <strong>and</strong> drainage schemes <strong>and</strong> for<br />
drinking <strong>water</strong> supply <strong>and</strong> sanitation services that would allow important economies of scale to be<br />
achieved. A study carried out in three African countries (see Box 8) for instance, showed that small<br />
dams <strong>and</strong> wells acted as catalysts for change, initiating actions that generated income <strong>and</strong> allowed<br />
people to diversify diets, afford health services <strong>and</strong> better cope with hungry periods of the year.<br />
BOX 8 INTEGRATING IRRIGATION, NUTRITION AND HEALTH<br />
<strong>FAO</strong> assessed the impact of three small-scale irrigation projects on the health <strong>and</strong> welfare of villagers<br />
in Burkina Faso, Mali <strong>and</strong> the United Republic of Tanzania. The assessment showed that small dams<br />
<strong>and</strong> wells acted as catalysts for change, initiating actions that generated income <strong>and</strong> allowed people<br />
to better cope with the hungry periods of the year, diversify diets <strong>and</strong> afford health services. These<br />
projects encouraged production, processing <strong>and</strong> preparation of a variety of indigenous <strong>food</strong>s,<br />
nutrition education <strong>and</strong> the participation of women’s groups. In all three cases, irrigation increased<br />
<strong>food</strong> production or income by enough to provide one additional meal per day, even during the<br />
‘hungry season’ before the harvest (<strong>FAO</strong>, 2001b). In the arid countries of Asia, there are often large<br />
areas where ground<strong>water</strong> is brackish <strong>and</strong> people have to obtain <strong>water</strong> from irrigation canals for<br />
all uses, including domestic. A study by the International Water Management Institute in Pakistan<br />
showed that safe use of canal irrigation <strong>water</strong> is possible if households have a large <strong>water</strong> storage<br />
tank in their house <strong>and</strong> have a continuous <strong>water</strong> supply for sanitation <strong>and</strong> hygiene. The results also<br />
showed that children from households having a large storage capacity for <strong>water</strong> in the house had<br />
much lower prevalence of stunted growth than children from families lacking such a storage facility.<br />
Increasing the quantity of irrigation <strong>water</strong> available for domestic use <strong>and</strong> providing toilet facilities<br />
are the most important interventions to reduce the burden of diarrhoeal disease <strong>and</strong> malnutrition.
AGRICULTURE, FOOD AND WATER<br />
47<br />
CHAPTER SEVEN<br />
Conclusions<br />
<strong>Agriculture</strong> will remain the dominant user of <strong>water</strong> at the global level. In many countries, in<br />
particular those situated in the arid <strong>and</strong> semi-arid regions of the world, this dependency can be<br />
expected to intensify. Water appropriation by agriculture experienced strong growth with the<br />
Green Revolution. The contribution of irrigated agriculture to <strong>food</strong> production is substantial but<br />
the rate of growth will be lower than in the past. Both irrigated <strong>and</strong> non-irrigated agriculture still<br />
have scope for increasing productivity, including <strong>water</strong> productivity. Arguably, the expansion<br />
of irrigated agriculture protected people on the nutritional fringe from premature death, <strong>and</strong><br />
preserved tracts of l<strong>and</strong> under forest <strong>and</strong> wetl<strong>and</strong>s from encroachment by hard-pressed farmers.<br />
However, pressures to encroach on such l<strong>and</strong>s persist.<br />
Within the current demographic context, the global <strong>food</strong> security is slowly improving <strong>and</strong> towards<br />
2050, the increased world population could enjoy access to <strong>food</strong> for all. The fact that close to 800<br />
million people are at present ravaged by chronic undernourishment in developing countries is<br />
not due to a lack of capacity of the world to produce the required <strong>food</strong>, but to global <strong>and</strong> national<br />
social, economic <strong>and</strong> political contexts that permit, <strong>and</strong> sometimes cause, unacceptable levels of<br />
poverty to perpetuate. Malnutrition is being alleviated, albeit slowly, <strong>and</strong> as the share of <strong>food</strong> slips<br />
lower in household budgets, the prospects for agriculture to internalize its costs may improve.<br />
Water still has a large unmet potential to help alleviate poverty <strong>and</strong> undernourishment. In taking<br />
this direction, agricultural-<strong>water</strong> management will continue to require better integration with rural<br />
household <strong>water</strong> uses, <strong>and</strong> to make more positive contributions in environmental management.<br />
Food for all could be achieved much earlier than present projections indicate, provided that<br />
the necessary policies are backed with the necessary resources. The economic, social <strong>and</strong><br />
environmental cost of continued <strong>food</strong> insecurity for hundreds of millions of people is high.<br />
<strong>Agriculture</strong> can use <strong>water</strong> more efficiently than present practices indicate. Technology for<br />
efficient transport of <strong>water</strong> from the site of abstraction to the field, <strong>and</strong> for delivering it to the crop<br />
plants with a minimum of losses, is available <strong>and</strong> is being progressively applied where <strong>water</strong> is<br />
scarce. Irrigation-<strong>water</strong>-use efficiency increases when the right policy <strong>and</strong> market incentives are<br />
in place. As competition for limited <strong>water</strong> resources <strong>and</strong> pressure to internalize environmental<br />
impacts intensify in a number of countries, agriculture <strong>and</strong>, in particular, irrigation comes under<br />
growing pressure to review <strong>and</strong> adapt its policies <strong>and</strong> institutions, including the <strong>water</strong> rights <strong>and</strong><br />
allocation system. Under such circumstances as in the Near East/North Africa region, current<br />
<strong>water</strong> efficiency is relatively high <strong>and</strong> projected to further increase. Data show an aggregate<br />
low-<strong>water</strong>-use efficiency in the <strong>water</strong>-rich Latin America region, <strong>and</strong> it is not seen as increasing<br />
significantly in the future because no other large-scale users compete with agriculture; locally,<br />
however, wherever <strong>water</strong> is scarce, high efficiency is also obtained in that region. <strong>Agriculture</strong> can<br />
also increase the use of recycled <strong>water</strong> <strong>and</strong> of <strong>water</strong> stemming from non-conventional sources.
AGRICULTURE, FOOD AND WATER<br />
49<br />
References<br />
Alcamo, J., Döll, P., Henrichs, T., Lehner, B., Kaspar, F., Rösch, T., Siebert, T. Forthcoming.<br />
‘WaterGAP: Development <strong>and</strong> Application of a Global Model for Water Withdrawals <strong>and</strong><br />
Availability’. Hydrological Sciences Journal.<br />
Burke, J.-J. <strong>and</strong> Moench, M. 2000. Ground<strong>water</strong> <strong>and</strong> Society, Resources, Tensions <strong>and</strong> Opportunities:<br />
Themes in Ground<strong>water</strong> Management for the 21st Century. New York, United Nations.<br />
Dixon, J., Gulliver, A., Gibbon, D. 2001. Farming Systems <strong>and</strong> Poverty: Improving Farmer Livelihoods<br />
in a Changing World. Washington DC, Food <strong>and</strong> <strong>Agriculture</strong> Organization / World Bank.<br />
Döll, P.; Kaspar, F., Lehner, B. Forthcoming. ‘A. Global Hydrological Model for Deriving<br />
Water Availability Indicators: Model Tuning <strong>and</strong> Validation’. Journal of Hydrology.<br />
Döll, P. <strong>and</strong> Siebert, S. 2002. ‘Global Modelling of Irrigation Water Requirements’. Water<br />
Resources Research, Vol. 38, No. 4, 8.1–8.10, DOI 10.1029/2001WR000355.<br />
<strong>FAO</strong>. 2002. World <strong>Agriculture</strong>: Towards 2015/2030, an <strong>FAO</strong> Study. Rome.<br />
<strong>FAO</strong>. 2001a. Crops <strong>and</strong> Drops: Making the Best Use of Water for <strong>Agriculture</strong>. Rome.<br />
<strong>FAO</strong>. 2001b. The State of Food Insecurity in the World. (Annual report issued also in 1999 <strong>and</strong> 2000;<br />
see web link for the ongoing series of annual reports.) Rome.<br />
<strong>FAO</strong>. 2000a. The State of World Fisheries <strong>and</strong> Aquaculture 2000. Rome.<br />
<strong>FAO</strong>. 2000b. World <strong>Agriculture</strong> towards 2015/2030, Summary Report. Rome.<br />
<strong>FAO</strong>. 1999. ‘Integrating Fisheries <strong>and</strong> <strong>Agriculture</strong> for Enhanced Food Security’. In: The State of<br />
Food <strong>and</strong> <strong>Agriculture</strong> in 1998. Rome.<br />
<strong>FAO</strong>. 1997a. Water Resources of the Near East Region: A Review. Rome.<br />
<strong>FAO</strong>. 1997b. ‘Irrigation Potential in Africa: A Basin Approach’. In: <strong>FAO</strong> L<strong>and</strong> <strong>and</strong> Water Bulletin,<br />
Vol. 4. Rome.
50 References<br />
<strong>FAO</strong>. 1995. ‘Irrigation in Africa in Figures’. In: <strong>FAO</strong> Water Report No 7. Rome.<br />
<strong>FAO</strong>/World Bank. 2001. Farming System <strong>and</strong> Poverty: Improving Farmers’ Livelihoods in a Changing<br />
World. Rome.<br />
IFAD (International Fund for Agricultural Development). 2001. Rural Poverty Report 2001: The<br />
Challenge of Ending Rural Poverty. Oxford, Oxford University Press.<br />
IHE (Institute for Infrastructural, Hydraulic <strong>and</strong> Environmental Engineering). 2000. A Vision<br />
of Water for Food <strong>and</strong> Rural Development. Publication for the Second World Water Forum, The<br />
Hague.<br />
IUCN (World Conservation Union). 2000. A Vision for Water <strong>and</strong> Nature. Publication for the<br />
Second World Water Forum, The Hague.<br />
Mazoyer, M. <strong>and</strong> Roudart, L. 1998. 1997. ‘Développement des inégalités agricoles dans le monde<br />
et crise des paysanneries comparativement désavantagées’. In: L<strong>and</strong> Reform, 1997/1. Food <strong>and</strong><br />
<strong>Agriculture</strong> Organization, Rome.<br />
Molden, D., Amarasinghe, U., Bhattarai, M., Wang, Jinxia, Makin, I. 2002. Water <strong>and</strong> <strong>food</strong><br />
security: Background paper for the World Water Development Report. Comprehensive Assessment<br />
Research Paper 2 (draft). Colombo, Sri Lanka, Comprehensive Assessment Secretariat<br />
OECD/DAC (Organization for Economic Cooperation <strong>and</strong> Development/Development<br />
Assistance Committee). 1998. Guidelines for Gender Equality <strong>and</strong> Women’s Empowerment in<br />
Development Cooperation. Paris.<br />
Pitman, G.K. 2002. Bridging Troubled Waters: Assessing the World Bank Water Resources Strategy. A<br />
World Bank Operations Evaluation Study. Washington DC, World Bank. Ramsar Convention<br />
on Wetl<strong>and</strong>s. 1971. Ramsar, Iran.<br />
Schiffle, M. 1998. Economics of Ground<strong>water</strong> Management in Arid Countries. London, Frank Cass.<br />
Smith, M., Fereres, E., Kassam, A. 2001. ‘Crop Water Productivity Under Deficient Water<br />
Supply’. Paper presented on the occasion of the Expert Meeting on Crop Water Productivity<br />
Under Deficient Water Supply, 3–5 December 2001, Rome, Italy.<br />
Stiglitz, J. 2002. Globalization <strong>and</strong> its Discontents. New York, W. W. Norton.
AGRICULTURE, FOOD AND WATER<br />
51<br />
Thompson, R.-L. 2001. ‘The World Bank Strategy to Rural Development with Special Reference<br />
to the Role of Irrigation <strong>and</strong> Drainage’. Keynote address on the occasion of the 52nd IEC<br />
meeting of the International Commission on Irrigation <strong>and</strong> Drainage, 16–21 September 2001,<br />
Seoul.<br />
Vassolo, S. <strong>and</strong> Döll, P. 2002. ‘Development of a Global Data Set for Industrial Water Use’.<br />
Unpublished manuscript. University of Kassel, Centre for Environmental Systems Research.<br />
WCD (World Commission on Dams). 2000. Dams <strong>and</strong> Development: A New Framework for Decision-<br />
Making. London, Earthscan Publications.<br />
World Bank. 2002. Water Resources Sector Strategy (draft). Washington DC.<br />
World Bank. 1991. India Irrigation Sector Review, Vols. 1 <strong>and</strong> 2. Washington DC.
AGRICULTURE, FOOD AND WATER<br />
53<br />
ANNEX ONE<br />
The right to adequate <strong>food</strong><br />
<strong>and</strong> the right to <strong>water</strong><br />
The legal basis of the right to<br />
adequate <strong>food</strong> <strong>and</strong> the right to <strong>water</strong><br />
The right to adequate <strong>food</strong> <strong>and</strong> the right to <strong>water</strong> are human rights. Their most prominent legal<br />
basis is Art. 11 of the International Covenant on Economic, Social <strong>and</strong> Cultural Rights that<br />
enshrines the right of everyone to an adequate st<strong>and</strong>ard of living for himself <strong>and</strong> his family,<br />
including adequate <strong>food</strong>, clothing <strong>and</strong> housing. The Covenant is legally binding upon those 146<br />
States that ratified it. As the right to adequate <strong>food</strong> <strong>and</strong> the right to <strong>water</strong> are also recognized<br />
in a large number of other binding <strong>and</strong> non-binding legal instruments they are arguably part of<br />
customary international law as well.<br />
The compliance of State Parties with the Covenant is monitored by the Committee on Economic,<br />
Social <strong>and</strong> Cultural Rights, the treaty body of the Covenant consisting of 18 independent experts.<br />
The Committee adopts “General Comments” constituting authoritative interpretations of the<br />
provisions of the Covenant to clarify the normative content of the rights, States parties’ <strong>and</strong> other<br />
actors’ obligations, violations <strong>and</strong> implementation of the rights at the national level.<br />
The right to adequate <strong>food</strong><br />
In 1999 the Committee adopted General Comment 12 on the right to adequate <strong>food</strong>. It is the<br />
right of everyone to have physical <strong>and</strong> economic access to adequate <strong>food</strong> or the means for its<br />
procurement. Its core content implies the availability of <strong>food</strong> in a quantity <strong>and</strong> quality sufficient<br />
to satisfy the dietary needs of individuals, free from adverse substances, <strong>and</strong> acceptable within a<br />
given culture <strong>and</strong> the accessibility of such <strong>food</strong> in ways that are sustainable <strong>and</strong> do not interfere<br />
with the enjoyment of other human rights.<br />
Availability refers to the possibilities of either feeding oneself directly from productive l<strong>and</strong><br />
or other natural resources, or having means for its procurement through well functioning<br />
distribution, processing <strong>and</strong> market systems. Accessibility encompasses both economic <strong>and</strong><br />
physical accessibility.<br />
Sustainable access to <strong>water</strong> resources for agriculture must be ensured in order to realize the right<br />
to <strong>food</strong>. 1 Attention should be given to ensuring that disadvantaged <strong>and</strong> marginalized farmers,<br />
including women farmers, have equitable access to <strong>water</strong> <strong>and</strong> <strong>water</strong> management systems,<br />
1<br />
This aspect of the right to adequate <strong>food</strong> is dealt with mainly in the introduction to General Comment 15 on the Right to <strong>water</strong>.
54 ANNEX 1 The right to adequate <strong>food</strong> <strong>and</strong> the right to <strong>water</strong><br />
including sustainable rain harvesting <strong>and</strong> irrigation technology. As the Covenant also provides<br />
that “a people may not be deprived of its own means of subsistence” (Art. 1 (2)) it must also<br />
be ensured that there is adequate access to <strong>water</strong> for subsistence farming <strong>and</strong> for securing the<br />
livelihoods of indigenous peoples.<br />
The right to <strong>water</strong><br />
In 2002 the Committee adopted General Comment 15 on the right to <strong>water</strong> (Art. 11 <strong>and</strong> 12 of<br />
the Covenant). General Comment 15 was the first document that fleshed out in detail the right’s<br />
content <strong>and</strong> clearly stated that the right to <strong>water</strong> emanated from <strong>and</strong> was indispensable for an<br />
adequate st<strong>and</strong>ard of living as it is one of the most fundamental conditions for survival. The right<br />
to <strong>water</strong> entitles everyone to sufficient, safe, acceptable, physically accessible <strong>and</strong> affordable <strong>water</strong><br />
for personal <strong>and</strong> domestic use. Availability implies that the <strong>water</strong> supply for each person must be<br />
sufficient <strong>and</strong> continuous for drinking, personal sanitation, washing of clothes, <strong>food</strong> preparation,<br />
personal <strong>and</strong> household hygiene. It must be free from micro-<strong>org</strong>anisms, chemical substances <strong>and</strong><br />
radiological hazards that constitute a threat to a person’s health. Water <strong>and</strong> <strong>water</strong> facilities <strong>and</strong><br />
services have to be physically <strong>and</strong> economically accessible to everyone without discrimination.<br />
Water is also necessary to realize a number of other rights. Water use to ensure environmental<br />
hygiene is covered by the right to health. Water necessary for the enjoyment of certain cultural<br />
practices is protected by the right to take part in cultural life. The right to gain a living by work<br />
encompasses <strong>water</strong> for securing livelihoods. Finally, as mentioned above, <strong>water</strong> to produce <strong>food</strong><br />
is necessary to realize the right to adequate <strong>food</strong>. In case of competing uses priority in allocation<br />
must be given to the right to <strong>water</strong> for personal <strong>and</strong> domestic use as well as to the prevention of<br />
starvation <strong>and</strong> disease.<br />
States’ obligations<br />
The right to adequate <strong>food</strong> <strong>and</strong> the right to <strong>water</strong> pose on States obligations of progressive<br />
realization as well as immediate obligations. The principle obligation of States with respect<br />
to the right to adequate <strong>food</strong> <strong>and</strong> the right to <strong>water</strong> is the obligation to take steps to achieve<br />
progressively the full realization of both rights. States must move as expeditiously <strong>and</strong> effectively<br />
as possible within the limits of the maximum of their available resources towards this goal. While<br />
full realization might take time, steps must be taken immediately. Also of immediate effect is the<br />
obligation to ensure that the rights can be exercised on a non-discriminatory basis.<br />
States must respect, protect <strong>and</strong> fulfil the right to adequate <strong>food</strong> <strong>and</strong> the right to <strong>water</strong>. The obligation<br />
to respect requires that states refrain from interfering directly or indirectly with the enjoyment of
AGRICULTURE, FOOD AND WATER<br />
55<br />
the rights. They must refrain from engaging in any practice or activity that denies or limits access<br />
to <strong>food</strong> or <strong>water</strong> or interferes arbitrarily with existing arrangements, e.g. by unlawful excessive<br />
abstraction of <strong>water</strong> by the state. The obligation to protect requires states to take measures to<br />
ensure that third parties such as individuals, groups, corporations or other entities do not interfere<br />
in any way with the enjoyment of the rights, e.g., by adopting the necessary, effective <strong>and</strong><br />
enforced legislative <strong>and</strong> other measures to control <strong>and</strong> restrain third parties’ activities such as<br />
pollution control measures. The obligation to fulfil means that States must take positive measures<br />
to facilitate individuals’ enjoyment of their rights through the development of strategies, policies<br />
<strong>and</strong> legislative measures, to promote the rights by appropriate education concerning for example<br />
the protection of <strong>water</strong> resources <strong>and</strong> methods to minimize its waste <strong>and</strong>, finally, to provide for the<br />
fulfilment of the rights directly in those cases in which individuals are unable for reasons beyond<br />
their control to realize the rights themselves (e.g. orphaned children).<br />
Outlook<br />
Although a large number of individuals all over the world continue to be denied their rights<br />
to adequate <strong>food</strong> <strong>and</strong> <strong>water</strong>, some encouraging developments are taking place. More <strong>and</strong> more<br />
countries <strong>and</strong> international agencies adopt rights-based policies <strong>and</strong> approaches that incorporate,<br />
for example in <strong>food</strong> security strategies, mechanisms of accountability, the principles of nondiscrimination,<br />
equality <strong>and</strong> participation <strong>and</strong> the interdependence of rights. An increasing number<br />
of states explicitly or implicitly recognize the two rights in their constitutions or legal frameworks<br />
<strong>and</strong> endeavour to implement the rights comprehensively through the development of new sets of<br />
measures. Some have made the rights justiciable. Furthermore, <strong>FAO</strong> <strong>and</strong> UN Member States are<br />
currently developing within the framework of an Intergovernmental Working Group established<br />
by the <strong>FAO</strong> Council in October 2002 a set of Voluntary Guidelines for the progressive realization<br />
of the right to adequate <strong>food</strong> in the context of national <strong>food</strong> security.<br />
References<br />
Committee on Economic, Social <strong>and</strong> Cultural Rights, General Comment No. 12. 1999. The Right<br />
to Adequate Food, E/C.12/1999/5 (12 May 1999), available at: http://www.unhchr.ch/tbs/<br />
doc.nsf/(symbol)/E.C.12.1999.5,+CESCR+General+comment+12.En?OpenDocument<br />
Committee on Economic, Social <strong>and</strong> Cultural Rights, General Comment No. 15. 2002. The Right<br />
to Water, E/C.12/2002/11 (26 November 2002), available at: http://www.unhchr.ch/tbs/<br />
doc.nsf/(Symbol)/E.C.12.2002.11.En?Opendocument
56 ANNEX 1 The right to adequate <strong>food</strong> <strong>and</strong> the right to <strong>water</strong><br />
Links<br />
Food <strong>and</strong> Agricultural Organization (<strong>FAO</strong>), Right to Food Page of the Legal Office<br />
http://www.fao.<strong>org</strong>/Legal/rtf/rtf-e.htm<br />
Information on the right to <strong>food</strong> links to official documents <strong>and</strong> international instruments, to <strong>FAO</strong><br />
publications, to other <strong>org</strong>anizations <strong>and</strong> initiatives dealing with the right to <strong>food</strong>.<br />
Food <strong>and</strong> Agricultural Organization (<strong>FAO</strong>), The Intergovernmental Working Group (IGWG) for the<br />
elaboration of a set of Voluntary Guidelines to support the progressive realization of the right to<br />
adequate <strong>food</strong> in the context of national <strong>food</strong> security<br />
http://www.fao.<strong>org</strong>/rightto<strong>food</strong>/en/index.html<br />
Official documents, submissions <strong>and</strong> information about the sessions of the IGWG.
AGRICULTURE, FOOD AND WATER<br />
57<br />
ANNEX TWO<br />
Related global<br />
assessment publications<br />
This annotated list covers some of the more recent global reports in <strong>water</strong> <strong>and</strong> development issues<br />
related to <strong>food</strong> <strong>and</strong> agriculture.<br />
<strong>FAO</strong> (Food <strong>and</strong> <strong>Agriculture</strong> Organization). Annual publication. The State of Food <strong>and</strong><br />
<strong>Agriculture</strong>. Rome.<br />
<strong>FAO</strong>’s annual report on current developments <strong>and</strong> issues in world agriculture. The Organization<br />
monitors the global agricultural situation as well as the overall economic environment<br />
surrounding world agriculture. The 2002 report calls for increased international financial flows<br />
towards agriculture <strong>and</strong> rural areas. It also examines one of the possible new mechanisms for this<br />
financing: the Clean Development Mechanism (CDM) deriving from the Kyoto Protocol to the<br />
United Nations Framework Convention on Climate Change. Particular attention is paid to the<br />
potential use of the CDM as an instrument for both enhancing carbon sequestration through l<strong>and</strong><br />
use changes <strong>and</strong> for reducing rural poverty. [Main challenge area: Securing the <strong>food</strong> supply]<br />
<strong>FAO</strong> (Food <strong>and</strong> <strong>Agriculture</strong> Organization). Annual publication. The State of Food <strong>and</strong><br />
<strong>Agriculture</strong>. 2000. World <strong>Agriculture</strong>: Towards 2015/2030. Rome.<br />
A summary of <strong>FAO</strong> projections <strong>and</strong> messages intended for the general reader. The projections<br />
cover supply <strong>and</strong> dem<strong>and</strong> for the major agricultural commodities <strong>and</strong> sectors, including fisheries<br />
<strong>and</strong> forestry. This analysis forms the basis for a more detailed examination of other factors, such<br />
as nutrition <strong>and</strong> undernourishment, <strong>and</strong> the implications for international trade. The report also<br />
investigates the implications of future supply <strong>and</strong> dem<strong>and</strong> for the natural resource base <strong>and</strong><br />
discusses how technology can contribute to a more sustainable development. [Main challenge area:<br />
Securing the <strong>food</strong> supply]<br />
Leisinge, K.-M., Schmitt, K., P<strong>and</strong>ya-Lorch, R. 2002. Six Billion <strong>and</strong> Counting: Population<br />
Growth <strong>and</strong> Food Security in the 21 st Century. Baltimore, United States, Johns Hopkins<br />
University Press, International Food Policy Research Institute.<br />
More people will inevitably mean greater dem<strong>and</strong> for <strong>food</strong>, <strong>water</strong>, education, health care, sanitary<br />
infrastructure <strong>and</strong> jobs, as well as greater pressure on the environment. There must come a point<br />
when population growth threatens global <strong>food</strong> security <strong>and</strong> the Earth’s finite natural resources.<br />
But what specific threats does population growth present now <strong>and</strong> in the coming decades? How<br />
can the world achieve sustainable development in the face of an ever-growing population? This<br />
book deals with these questions. [Main challenge area: Securing the <strong>food</strong> supply]
58 ANNEX 2 Related global assessment publications<br />
Pardey, P.-G., Beintema, N.-M. 2001. Slow Magic. Agricultural R&D a Century After Mendel.<br />
Washington DC, International Food Policy Research Institute, Agricultural Science <strong>and</strong><br />
Technology Indicators Initiative.<br />
This report assembles <strong>and</strong> assesses new <strong>and</strong> updated evidence regarding investments in<br />
agricultural R&D by public <strong>and</strong> private agencies, contrasting developments in rich <strong>and</strong> poor<br />
countries. It tracks trends in agricultural R&D over the past several decades. [Main challenge area:<br />
Securing the <strong>food</strong> supply]<br />
Pinstrup-Andersen, P., P<strong>and</strong>ya-Lorch, R., Rosegrant, M.-W. 1999. World Food Prospects:<br />
Critical Issues for The Early Twenty-First Century. Washington DC, Food Policy Report,<br />
International Food Policy Research Institute.<br />
This report provides a summary of the most recent results from the International Food Policy<br />
Research Institute projections of the future world <strong>food</strong> situation. It then identifies <strong>and</strong> discusses<br />
six recent developments <strong>and</strong> emerging issues that will influence the prospects for global<br />
<strong>food</strong> security. It also discusses new evidence on the opportunities offered by agro-ecological<br />
approaches, the potential role of modern biotechnology <strong>and</strong> the relevance of new information<br />
technology <strong>and</strong> precision farming for small farmers in developing countries. [Main challenge area:<br />
Securing the <strong>food</strong> supply]<br />
Rosegrant, M.-W., Paisner, M.-S., Meijer, S., Witcover, J. 2001. 2020 Global Food Outlook:<br />
Trends, Alternatives, <strong>and</strong> Choices. A Vision for Food, <strong>Agriculture</strong>, <strong>and</strong> the Environment Initiative.<br />
Washington DC, International Food Policy Research Institute.<br />
This report shows how, <strong>and</strong> how much, certain policy decisions <strong>and</strong> social changes will affect the<br />
world’s future <strong>food</strong> security. It projects the likely <strong>food</strong> situation in 2020 if the world continues<br />
on more or less its present course, <strong>and</strong> it then shows how alternative choices could produce a<br />
different future. [Main challenge area: Securing the <strong>food</strong> supply]<br />
UNDP/UNEP/World Bank/WRI (United Nations Development Programme/United Nations<br />
Environment Programme/World Bank/World Resources Institute). 2000. World Resources<br />
2000–2001 – People <strong>and</strong> Ecosystems: The Fraying Web of Life. Washington DC.<br />
This book is a comprehensive guide to the global environment. This edition provides an assessment<br />
of five of the world’s major ecosystems: agro-, coastal <strong>and</strong> marine, forest, fresh<strong>water</strong> <strong>and</strong> grassl<strong>and</strong><br />
ecosystems. [Main challenge area: Protecting ecosystems]
AGRICULTURE, FOOD AND WATER<br />
59<br />
UNESCO (United Nations Educational, Scientific <strong>and</strong> Cultural Organization). 2001.<br />
Biennial publication. World Science Report. Paris.<br />
This report provides information on the more important technical development of the last two<br />
years with a discussion of the main issues raised in this area by some of the most eminent world<br />
specialists. The last release of the report (1998) includes chapters looking at how science is<br />
helping to safeguard our two most basic commodities – <strong>food</strong> <strong>and</strong> <strong>water</strong> – in a context of rapid<br />
demographic growth <strong>and</strong> environmental stress. [Main challenge area: Ensuring the knowledge base]<br />
UNESCO (United Nations Educational, Scientific <strong>and</strong> Cultural Organization). 2001.<br />
Biennial publication. World Social Science Report. Paris.<br />
First released in 1999, the report takes stock of the social sciences as they are, <strong>and</strong> looks forward<br />
to their continuing development in the coming decades. It is divided into two parts. The first, A<br />
Global Picture, provides an overview of the history (since the eighteenth century), future prospects<br />
<strong>and</strong> current <strong>org</strong>anization, financing <strong>and</strong> resources of the social sciences. The second takes up<br />
three central issues: science <strong>and</strong> technology in society, development <strong>and</strong> the environment. A final<br />
section reviews two areas of contact between the natural <strong>and</strong> social-cognitive science <strong>and</strong> the<br />
evolutionary study of human behaviour. [Main challenge area: Ensuring the knowledge base]<br />
UN-Habitat. 2001. The State of the World’s Cities Report 2001. Nairobi.<br />
The State of the World’s Cities Report 2001 is a first in-depth attempt to monitor, analyse <strong>and</strong> report<br />
on the realities faced by urban populations around the world. The report was produced by UN<br />
Habitat to coincide with the Istanbul + 5 Special Session of the United Nations General Assembly.<br />
Its central message is that people’s processes <strong>and</strong> initiatives <strong>and</strong> enabling governing structures<br />
must unite to form broad-based partnerships that will promote justice, equity <strong>and</strong> sustainability in<br />
cities. [Main challenge areas: Water <strong>and</strong> cities, Meeting basic needs]
AGRICULTURE, FOOD AND WATER<br />
61<br />
ANNEX THREE<br />
Some useful<br />
Web sites<br />
Food <strong>and</strong> <strong>Agriculture</strong> Organization (<strong>FAO</strong>), AQUASTAT<br />
http://www.fao.<strong>org</strong>/ag/agl/aglw/aquastat/main/<br />
Provides data on the state of <strong>water</strong> resources across the world, including an online database on<br />
<strong>water</strong> <strong>and</strong> agriculture, GIS, maps, etc.<br />
Food <strong>and</strong> <strong>Agriculture</strong> Organization (<strong>FAO</strong>), <strong>FAO</strong>STAT<br />
http://apps.fao.<strong>org</strong>/<br />
Time series records covering production, trade, <strong>food</strong> balance sheets, fertilizer <strong>and</strong> pesticides, l<strong>and</strong><br />
use <strong>and</strong> irrigation, forest <strong>and</strong> fishery products, population, agricultural machinery, etc.<br />
Food <strong>and</strong> <strong>Agriculture</strong> Organization (<strong>FAO</strong>), Fisheries Global Information System (FIGIS)<br />
http://www.fao.<strong>org</strong>/fi/figis/tseries/index.jsp<br />
Global fishery statistics on production, capture production, aquaculture production, fishery<br />
commodity production <strong>and</strong> trade, <strong>and</strong> fishing fleets.<br />
Food <strong>and</strong> <strong>Agriculture</strong> Organization (<strong>FAO</strong>), Food Insecurity<br />
http://www.fao.<strong>org</strong>/SOF/sofi/<br />
Provides information on the state of <strong>food</strong> insecurity in the world <strong>and</strong> on global <strong>and</strong> national<br />
efforts.<br />
International Water Management Institute (IWMI), Water for <strong>Agriculture</strong><br />
http://www.cgiar.<strong>org</strong>/iwmi/agriculture/<br />
Provides information on issues related to <strong>water</strong> for agriculture: research activities, list of<br />
publications <strong>and</strong> links. This site is part of a larger site that houses information on a plethora of<br />
<strong>water</strong> management-related topics, such as the environment, health, etc.<br />
Food <strong>and</strong> <strong>Agriculture</strong> Organization (<strong>FAO</strong>), WAICENT<br />
http://www.fao.<strong>org</strong>/Waicent/<br />
<strong>FAO</strong>’s information portal: this is a programme for improving access to documents, statistics, maps<br />
<strong>and</strong> multimedia resources.
Producing our daily <strong>food</strong> requires one thous<strong>and</strong> times more <strong>water</strong><br />
than we use to drink <strong>and</strong> one hundred times more than we use to<br />
meet our basic personal needs. Rainfed agriculture alone cannot<br />
ensure global <strong>food</strong> supply, <strong>and</strong> up to 70 percent of the <strong>water</strong> we take<br />
from rivers <strong>and</strong> aquifers goes into irrigated agriculture. <strong>Agriculture</strong><br />
is the major source of <strong>food</strong> <strong>and</strong> by far the largest consumer of <strong>water</strong><br />
on the globe.<br />
<strong>Agriculture</strong>,<br />
<strong>food</strong> <strong>and</strong><br />
<strong>water</strong><br />
What is the role of <strong>water</strong> in the world’s <strong>food</strong> production? What<br />
are the contributions to <strong>food</strong> production from rainfed <strong>and</strong> irrigated<br />
agriculture <strong>and</strong> from fisheries? How can more <strong>food</strong> be produced<br />
with the same amount of <strong>water</strong>? What role does the market play?<br />
How does <strong>food</strong> security connect to poverty <strong>and</strong> <strong>water</strong> use? This<br />
report discusses these <strong>and</strong> many other questions using up-to-date<br />
information <strong>and</strong> state-of-the-art knowledge.<br />
The United Nations World Water Development Report <strong>and</strong> its<br />
various thematic components provide a periodic review of the world’s<br />
fresh<strong>water</strong> resources <strong>and</strong> the way we steward them. Chapter 8 of the<br />
Report is re-issued here as <strong>Agriculture</strong>, <strong>food</strong> <strong>and</strong> <strong>water</strong>.<br />
ISBN 92-5-104943-2<br />
9 7 8 9 2 5 1 0 4 9 4 3 3<br />
TC/M/Y4683E/1/5.03/1100