Strong Ground Motion
Strong Ground Motion
Strong Ground Motion

You also want an ePaper? Increase the reach of your titles
YUMPU automatically turns print PDFs into web optimized ePapers that Google loves.
Bogazici University<br />
Kandilli Observatory and Earthquake Research Institute<br />
Department of<br />
Earthquake Engineering<br />
The October 23, 2011 Van, Turkey Earthquake (Mw=7.2)<br />
STRONG<br />
GROUND<br />
MOTION<br />
Distribution of estimated peak<br />
ground accelerations<br />
and peak ground velocities associated with<br />
the mainshock are shown in Figures 1 and 2. These figures are<br />
obtained by ELER and Google<br />
Earth and show site-dependent ground motion values obtained using the GMPE by Chiou and<br />
Youngs (2008). The figures suggest peak<br />
accelerations in the order of 0.6 g and peak velocities<br />
more than 50 cm/s<br />
may have been experienced in the epicentral region of the earthquake. It<br />
should be stated however that there is no evidence yet from the<br />
field, in terms of structural and<br />
utility damage and casulaties, to support these levels of ground motion.<br />
In Figure 3 we present the regional distribution of adjusted peak ground accelerations<br />
based on<br />
the ground motion data from the National<br />
<strong>Strong</strong> <strong>Ground</strong> <strong>Motion</strong><br />
network and from the<br />
National<br />
Network<br />
of Iran. The comparison between the actual and estimated peak accelerations can be<br />
seen in Figure 4 on<br />
station basis.<br />
The instrumental intensities due to the main shock and and the main-aftershock are presented in<br />
Figures 5 and 6. Until empirical data become available, the estimations suggest that an epicentral<br />
intensity<br />
of VIII was experienced in the region.
Bogazici University<br />
Kandilli Observatory and Earthquake Research Institute<br />
Department of<br />
Earthquake Engineering<br />
Figure 1. Distribution of peak ground accelerations associated with the mainshock.
Bogazici University<br />
Kandilli Observatory and Earthquake Research Institute<br />
Department of<br />
Earthquake Engineering<br />
Figure 2. Distribution<br />
of peak ground velocities associated with the mainshock.
Bogazici University<br />
Kandilli Observatory and Earthquake Research Institute<br />
Department of<br />
Earthquake Engineering<br />
Figure<br />
3. Distribution of peak ground accelerations<br />
bias-adjusted using strong ground<br />
motion<br />
data from regional networks.<br />
Figure<br />
4. Comparison between<br />
the actual and estimated peak ground accelerations for individual<br />
stations used in the bias adjustment
Bogazici University<br />
Kandilli Observatory and Earthquake Research Institute<br />
Department of<br />
Earthquake Engineering<br />
Figure 5. Instrumental intensities associated with the mainshock<br />
Figure 6. Instrumental intensities associated with the main aftershock (M 5.7)
Bogazici University<br />
Kandilli Observatory and Earthquake Research Institute<br />
Department of<br />
Earthquake Engineering<br />
National <strong>Strong</strong> <strong>Ground</strong> <strong>Motion</strong> Network<br />
The National <strong>Strong</strong> <strong>Ground</strong><br />
<strong>Motion</strong> Network is operated by the Earthquake Department<br />
(http://www.deprem.gov.tr/) of the Disaster and Emergency Management<br />
Presidency<br />
–AFAD<br />
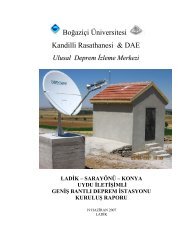
(http://www.afetacil.gov.tr/). The station layout as of<br />
June 2011 is given in Figure 7.<br />
Figure 7. http://kyh.deprem.gov.tr/<br />
7 stations of the national strong ground motion network, located in the provinces of Van, Mus,<br />
Bitlis and Agri, are<br />
within 120<br />
kms of the<br />
epicenter. A raw peak<br />
ground acceleration of 0.18g is<br />
recordedd at the station in Muradiye. The records obtained by the national network can be<br />
downloaded from http://kyh.deprem.gov.tr/ftpe.htm. For station information of the<br />
national<br />
network<br />
please seee link http:/ //kyh.deprem.gov.tr/istbilgien.htm.. The processed records can be<br />
found at link http: ://eerc.metu.edu.tr/Van_RawProc_Records. Comparison of the unprocessed<br />
PGA’s with the NGA GMPE’s, presented<br />
in Figure 8, indicates that the recorded ground motion<br />
levels are in agreement with the ground motion levels estimated by the GMPE’s at distances<br />
larger than 30kms. There are<br />
no records<br />
obtained within 30 km’s of the epicenter, where the<br />
damage is concentrated. In Figure 8, the<br />
distances are calculated according to the epicentral<br />
coordinates reported by KOERI.<br />
The two<br />
nearest records to the<br />
epicenter were obtained in Muradiye and Bitlis. The acceleration<br />
record in the Muradiye station<br />
is 46 km away from the epicenter. The one recorded in Bitlis is at<br />
116 km epicentral distance. The distance values are as reported by AFAD. In<br />
Figure 9 we present<br />
corrected accelererations, velocities, displacements,<br />
FAS, Arias<br />
Intensities and energy<br />
densities
Bogazici University<br />
Kandilli Observatory and Earthquake Research Institute<br />
Department of<br />
Earthquake Engineering<br />
associated with the Muradiye record. The records are uniformly corrected using<br />
baseline<br />
correction and a 4th order Butterworth bandpass filter between 0.1 and<br />
25 Hz. The same<br />
information for the<br />
Bitlis station is in Figure 10. The<br />
peak accelerations in station Muradiye are<br />
195 cm/ /s 2 and 167 cm/s 2 in the NS and EW directions respectively. In Bitlis stations the largest<br />
acceleration is 101.5 cm/s 2 in the EW direction. The<br />
largest velocities in Muradiye station are<br />
obtained<br />
as 27 cm/ s in the NS direction. Spectral accelerations associated with these two records<br />
are below the design levels<br />
of the Turkish rcode (Figure<br />
11). Spectral velocities and<br />
displacements are shown in<br />
Figure 12. Based on bias-adjusted PGA’s, the epicentral<br />
acceleration is estimated as 0.35 g (Figure<br />
3).<br />
Previous studies had varying views on the characteristics of the fault that this earthquake took<br />
place on<br />
(see sections on seismotectonics<br />
and hazard) ). Before detailed analysis of the aftershocks<br />
becomes available,<br />
regarding their hypocentral distribution, we can only hypothesize about the<br />
3D geometry of the fault plane based on<br />
information from the<br />
field on ground deformations,<br />
damage distribution<br />
and strong<br />
motion data. The particle motions of the Muradiye record can be<br />
seen in<br />
the two subplots of Figure 13. If<br />
a wide frequency range is used in getting the particle<br />
motions<br />
the sense of dominant motion is<br />
not very clear. If we<br />
use a narrow frequency range,<br />
however, the NW-SE direction<br />
emerges as the dominant sense of ground displacements. Using<br />
special processing techniques<br />
it is possible to deduce permanent displacements from strong<br />
motion data. The results of such a preliminary exercise can be seen in Figure 14, which shows<br />
permanent displacements in the order of 3 cm in the<br />
NS direction. It should be noted that more<br />
information from INSAR and<br />
from the field are needed to further comment on permanent<br />
displacements.<br />
PGA(g)<br />
1<br />
0.1<br />
Chiou-Youngs 2008<br />
Boore-Atkinson 2008<br />
Abrahamson-Silva 2008<br />
Campbell-Bozorgnia 2008<br />
Recordedd PGAs<br />
0.01<br />
0.1<br />
1<br />
10<br />
100 1000<br />
Distance (km)<br />
Figure 8. Comparison of recorded ground motion PGAs with NGA GMPEs
Bogazici University<br />
Kandilli Observatory and Earthquake Research Institute<br />
Department of<br />
Earthquake Engineering<br />
Acceleration,cm/s2<br />
EW<br />
200<br />
0<br />
-200<br />
0 20 40 60<br />
80 100<br />
200<br />
0<br />
-200<br />
0 20<br />
NS<br />
40 60<br />
80 100<br />
100<br />
0<br />
-100<br />
0 20<br />
UD<br />
40 60 80<br />
100<br />
20<br />
40<br />
10<br />
Velocity,cm/s<br />
0<br />
-20<br />
0 20 40 60<br />
80 100<br />
20<br />
0<br />
-20<br />
0 20<br />
40 60<br />
80 100<br />
0<br />
-10<br />
0 20<br />
40 60 80<br />
100<br />
Displacement,cm<br />
0.05<br />
0<br />
-0.05<br />
0 20 40 60<br />
Time,sec<br />
80 100<br />
0.1<br />
0<br />
-0.1<br />
0 20<br />
40 60<br />
Time,sec<br />
80 100<br />
0.02<br />
0<br />
-0.02<br />
0 20<br />
40 60 80<br />
Time,sec<br />
100<br />
Figure 9. 6503 Muradiye Station. Corrected acceleration, velocity, displacement time histories,<br />
FAS, Arias intensities and energy densities in EW, NS and UD directions
Bogazici University<br />
Kandilli Observatory and Earthquake Research Institute<br />
Department of<br />
Earthquake Engineering<br />
Acceleration,cm/s2<br />
100<br />
0<br />
-100<br />
0<br />
EW<br />
50 100 150<br />
NS<br />
100<br />
0<br />
-100<br />
0 50 100<br />
150<br />
50<br />
0<br />
-50<br />
0 50<br />
UD<br />
100<br />
150<br />
10<br />
10<br />
5<br />
Velocity,cm/s<br />
0<br />
-10<br />
0<br />
50 100 150<br />
0<br />
-10<br />
0 50 100<br />
150<br />
0<br />
-5<br />
0 50<br />
100<br />
150<br />
Displacement,cm<br />
0.02<br />
0<br />
-0.02<br />
0<br />
50 100 150<br />
Time,sec<br />
0.02<br />
0<br />
-0.02<br />
0 50 100<br />
Time,sec<br />
150<br />
0.05<br />
0<br />
-0.05<br />
0 50<br />
Time,sec<br />
100<br />
150<br />
100<br />
100<br />
30<br />
F.A.S.<br />
80<br />
60<br />
40<br />
20<br />
0<br />
10 -2<br />
10 -1 10 0<br />
Frequency,Hz<br />
10 1<br />
80<br />
60<br />
40<br />
20<br />
0<br />
10 -2 10 -1<br />
20<br />
10 0 10 1 10 -2 10 -1 10 0 10 1<br />
10<br />
0<br />
Frequency,Hz<br />
Freq quency,Hz<br />
Arias Intensity,(%)<br />
100<br />
50<br />
0<br />
0<br />
50 100 150<br />
100<br />
50<br />
0<br />
0 50 100<br />
150<br />
100<br />
50<br />
0<br />
0 50<br />
100<br />
150<br />
Energy,cm2/s<br />
100<br />
50<br />
0<br />
0<br />
50 100 150<br />
Time,sec<br />
100<br />
50<br />
0<br />
0 50 100<br />
Time,sec<br />
150<br />
40<br />
20<br />
0<br />
0 50<br />
Time,sec<br />
100<br />
150<br />
Figure 10. 1302 Bitlis Station. Corrected acceleration, velocity, displacement time<br />
histories, FAS, Arias intensities and<br />
energy densities in EW, NS and UD directions
Bogazici University<br />
Kandilli Observatory and Earthquake Research Institute<br />
Department of<br />
Earthquake Engineering<br />
1.2<br />
Spectral Acceleration with Turkish Design Spectrum<br />
Spectral Acceleration<br />
1<br />
0.8<br />
0.6<br />
0.4<br />
0.2<br />
Z1<br />
Z2<br />
Z3<br />
Z4<br />
6503-PSA(NS)<br />
6503-PSA(EW)<br />
1302-PSA(NS)<br />
1302-PSA(EW)<br />
0<br />
0<br />
0.5<br />
1 1.5<br />
Period, T(s)<br />
2<br />
2.5 3<br />
Figure<br />
11. Spectral accelerations of two horizontal components<br />
of the 6503<br />
Muradiye ve 1302<br />
Bitlis stations shown with<br />
the Turkish Design Spectra for four types of<br />
soil conditions.<br />
PSV (cm/s2)<br />
60<br />
50<br />
40<br />
30<br />
20<br />
Pseudo Spectral Velocity<br />
PSVEW1302<br />
PSVNS1302<br />
PSVEW6503<br />
PSVNS6503<br />
SD (cm)<br />
0.16<br />
0.14<br />
0.12<br />
0.1<br />
0.08<br />
0.06<br />
0.04<br />
Spectral Displacement<br />
SDEW1302<br />
SDNS1302<br />
SDEW6503<br />
SDNS6503<br />
10<br />
0.02<br />
0<br />
0.0<br />
0.5 1.0 1.5 2.0 2.5<br />
Period, T(s)<br />
3.0<br />
0<br />
0.0<br />
0.5 1.0 1.5 2.0 2.5<br />
3.0<br />
Period, T(s)<br />
Figure 12. Spectral velocities and displacements of two horizontal components of the 6503<br />
Muradiye and 1302 Bitlis records.
Bogazici University<br />
Kandilli Observatory and Earthquake Research Institute<br />
Department of<br />
Earthquake Engineering<br />
Figure 13. Particle motions, Muradiye record<br />
Figure 14. Muradiye record<br />
processed for permanent displacements
Bogazici University<br />
Kandilli Observatory and Earthquake Research Institute<br />
Department of<br />
Earthquake Engineering<br />
Networks operated<br />
by the Department of Earthquake Engineering<br />
The Department of<br />
Earthquake Engineering operates free-field<br />
and structural networks in the<br />
İstanbull region and<br />
in Antakya.<br />
The Antakya <strong>Strong</strong> <strong>Motion</strong> Network in the province<br />
of Hatay in southeastt Turkey consists of 6<br />
stations. The Van earthquake is recordedd by the five stations of the network. The network is<br />
about 685 km away<br />
from the epicenter. The accelerometric data can be seen in Figure 15.<br />
Figure 15. Van earthquake as recorded by the stations of the Antakya network
Bogazici University<br />
Kandilli Observatory and Earthquake Research Institute<br />
Department of<br />
Earthquake Engineering<br />
The main shock as recorded by<br />
the stations of the Istanbul Earthquake Early Warning System is<br />
shown in Figure 16. The distance between Van and Istanbul is about 1250 km. Detailed<br />
information<br />
on the early<br />
warning<br />
system<br />
is at link<br />
http://www.koeri.boun.edu.tr/Research/Early%20WarnIng%20System_13_139.depmuh.<br />
Figure 16. Van earthquake as recorded by<br />
the stations of the Istanbul Earthquake Early<br />
Warning<br />
System.<br />
The main shock as<br />
recorded by the stations of the Hagia Sophia Structural Health Monitoring<br />
System is shown in<br />
Figure 17.
Bogazici University<br />
Kandilli Observatory and Earthquake Research Institute<br />
Department of<br />
Earthquake Engineering<br />
Figure 17. Van<br />
earthquakee as recordedd by the nine stations of the Hagia Sophia Structural<br />
Health Monitoring System in Istanbul.<br />
<strong>Strong</strong> <strong>Motion</strong> Stations in Iran:<br />
The Iranian borderr is within 80 kms of the epicenter. We have informal information that the<br />
earthquake has been recorded by several stations of the Iranian network with a peak acceleration<br />
of 20 gals (Mehdi Zare, personal communication).<br />
The IIEES , International Institute of Earthquake Engineering and Seismology, has compiled<br />
avaliable<br />
data<br />
at<br />
link<br />
http://www.iiees.ac.ir/index.php?option=com_content&view=article&id=862:van-turkey-<br />
earthquake-mw72-23-october-2011-iiees-observations&<br />
&catid=71:2008-06-22-06-51-45&Itemid=918<br />
Contributed by: E. Çaktı, M.B. Demircioğlu, M. Erdik, Y. Kamer, B. Sungay, E. Şafak,<br />
K. Şeşetyan, E. Uçkan, E. Vuran, C. Yenidoğan, C. Zulfikar (in alphabetica<br />
order)