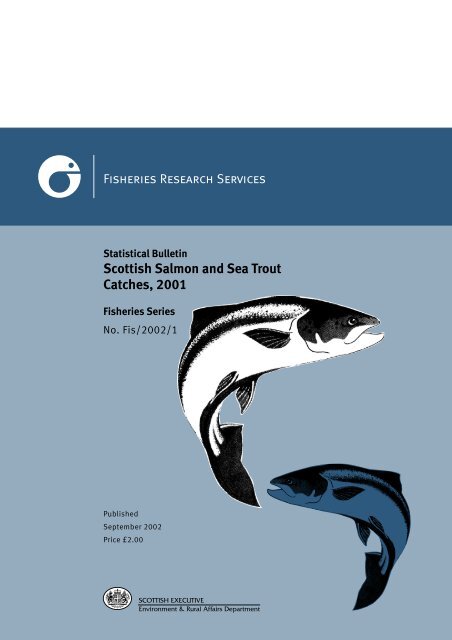
Scottish Salmon and Sea Trout Catches, 2001
Scottish Salmon and Sea Trout Catches, 2001
Scottish Salmon and Sea Trout Catches, 2001
Create successful ePaper yourself
Turn your PDF publications into a flip-book with our unique Google optimized e-Paper software.
Fisheries Research Services<br />
Statistical Bulletin<br />
<strong>Scottish</strong> <strong>Salmon</strong> <strong>and</strong> <strong>Sea</strong> <strong>Trout</strong><br />
<strong>Catches</strong>, <strong>2001</strong><br />
Fisheries Series<br />
No. Fis/2002/1<br />
Published<br />
September 2002<br />
Price £2.00<br />
SCOTTISH EXECUTIVE<br />
Environment & Rural Affairs Department
Fisheries Research Services<br />
<strong>Scottish</strong> <strong>Salmon</strong> <strong>and</strong> <strong>Sea</strong> <strong>Trout</strong> <strong>Catches</strong><br />
<strong>2001</strong><br />
SCOTTISH EXECUTIVE<br />
Environment <strong>and</strong> Rural Affairs Department<br />
1
Contents<br />
1. Summary ......................................................................................................................... 3<br />
2. Introduction .................................................................................................................... 4<br />
Data collection .............................................................................................................. 4<br />
Fishery Districts <strong>and</strong> Regions ......................................................................................... 4<br />
The fisheries ................................................................................................................. 4<br />
<strong>Catches</strong> ...................................................................................................................... 5<br />
Fishing effort ................................................................................................................. 5<br />
Provision of data ........................................................................................................... 5<br />
3. Annual catch of wild salmon & grilse <strong>and</strong> associated fishing effort ............. 6<br />
Fixed Engine ........................................................................................................................ 6<br />
Figure 1. Annual reported catch of salmon <strong>and</strong> grilse <strong>and</strong> the national index of fishing<br />
effort by fixed engine fisheries. ................................................................... 6<br />
Net & Coble ......................................................................................................................... 7<br />
Figure 2. Annual reported catch of salmon <strong>and</strong> grilse <strong>and</strong> reported fishing effort<br />
by net & coble fisheries. .............................................................................. 7<br />
Rod & Line ........................................................................................................................... 7<br />
Figure 3. Annual reported catch of salmon <strong>and</strong> grilse by rod & line fisheries. ............. 8<br />
Figure 4.<br />
Annual reported numbers of salmon <strong>and</strong> grilse caught <strong>and</strong> released<br />
from rod & line fisheries. ............................................................................. 9<br />
4. Annual catch of wild salmon & grilse by area <strong>and</strong> fishing method .............. 10<br />
Figure 5. Distribution of the annual reported catch of salmon <strong>and</strong><br />
grilse among Regions. ............................................................................... 10<br />
Figure 6. Trends in reported catch by Region <strong>and</strong> fishing method. ............................ 11<br />
5. Catch of wild spring salmon, summer salmon <strong>and</strong> grilse ............................... 12<br />
Figure 7. Annual reported catch of spring salmon by rod & line fisheries. .................... 12<br />
Figure 8. Annual reported numbers of spring salmon caught <strong>and</strong> released<br />
from rod & line fisheries. .............................................................................. 13<br />
6. Farmed salmon <strong>and</strong> grilse ........................................................................................ 14<br />
7. <strong>Sea</strong> <strong>Trout</strong> .................................................................................................................... 15<br />
Figure 9. Annual reported catch of sea trout <strong>and</strong> the national index of<br />
fishing effort by fixed engine fisheries. ...................................................... 15<br />
Figure 10.<br />
Annual reported catch of sea trout <strong>and</strong> reported fishing effort by<br />
net & coble fisheries. ................................................................................ 16<br />
Figure 11. Annual reported catch of sea trout by rod & line fisheries. ......................... 17<br />
Figure 12.<br />
Annual reported numbers of sea trout caught <strong>and</strong> released from<br />
rod & line fisheries. .................................................................................... 17<br />
Figure 13. Distribution of the annual reported catch of sea trout among Regions. ....... 18<br />
Figure 14. Trends in reported catch by Region <strong>and</strong> fishing method. ............................ 19<br />
Table 1. Number <strong>and</strong> weight of wild salmon, grilse <strong>and</strong> sea trout caught <strong>and</strong> retained<br />
by salmon fishery Region <strong>and</strong> by method during <strong>2001</strong>. ................................................ 20<br />
Table 2. Number <strong>and</strong> weight of wild salmon, grilse <strong>and</strong> sea trout caught <strong>and</strong> retained<br />
by salmon fishery District <strong>and</strong> Region during <strong>2001</strong>. ..................................................... 21<br />
Table 3. Number <strong>and</strong> weight of wild salmon, grilse <strong>and</strong> sea trout caught <strong>and</strong> released<br />
by salmon fishery District <strong>and</strong> Region from rod & line fisheries during <strong>2001</strong>. ............... 22<br />
Table 4. Number <strong>and</strong> weight of farmed salmon <strong>and</strong> grilse caught <strong>and</strong> retained by<br />
salmon fishery Region <strong>and</strong> by method during <strong>2001</strong>. .................................................... 23<br />
Table 5. Number <strong>and</strong> weight of farmed salmon <strong>and</strong> grilse caught <strong>and</strong> retained by salmon<br />
fishery District <strong>and</strong> Region during <strong>2001</strong>. ..................................................................... 24<br />
Table 6. Number of questionnaires sent to proprietors <strong>and</strong> occupiers of salmon fisheries<br />
in <strong>2001</strong> <strong>and</strong> the number of returns received. ............................................................... 25<br />
2<br />
<strong>Salmon</strong> Fisheries — Statistical Regions & Districts ................................................. 26<br />
Names of the <strong>Salmon</strong> Fishery Statistical Districts ................................................... 27
1. Summary<br />
• The reported annual Fixed Engine catch of 25,041 wild salmon <strong>and</strong> grilse<br />
for <strong>2001</strong> was the highest since 1997, but was still the fourth lowest<br />
catch on record. The catch represented an increase of 9% over 2000<br />
catches, <strong>and</strong> was 1% greater than the 1996-2000 5-year average. The<br />
national index of netting effort, excluding Solway, was 392 trap months,<br />
an increase of 2% compared to reports in 2000, but 74% of the 1996-<br />
2000 5-year average.<br />
• The reported annual Net & Coble catch of 7,233 wild salmon <strong>and</strong> grilse<br />
represented a decline of 42% from the numbers caught in 2000 <strong>and</strong> a<br />
decline to 57% of the 1996-2000 5-year average. Reported effort was 95<br />
crew months, a decline of 20% compared to reports in 2000 <strong>and</strong> 61% of<br />
the 1996-2000 5-year average.<br />
• Taking wild salmon <strong>and</strong> grilse which were retained together with those<br />
released, a total of 72,296 wild salmon <strong>and</strong> grilse were caught by Rod &<br />
Line in <strong>2001</strong>, an increase of 10% compared to the 2000 catch <strong>and</strong> 112%<br />
of the 1996-2000 5-year average.<br />
• A total of 27,699 wild salmon <strong>and</strong> grilse was reported caught <strong>and</strong> released<br />
by the Rod & Line fishery in <strong>2001</strong>. This represented the highest catch &<br />
release total on record, an increase of 31% over reports for 2000 <strong>and</strong><br />
196% of the 1996-2000 5-year average. Catch <strong>and</strong> release accounted for<br />
38% of all salmon <strong>and</strong> grilse caught by rod & line in <strong>2001</strong>.<br />
• 3,986 wild spring salmon were caught <strong>and</strong> retained by all methods in<br />
<strong>2001</strong>, 87% of which were taken by Rod & Line. This overall catch<br />
represented an increase of 24% compared to 2000, within which each<br />
method also registered an increase. A further 3,362 spring salmon were<br />
caught by Rod & Line <strong>and</strong> released, an increase of 91% over 2000. Fish<br />
caught <strong>and</strong> released comprised 49% of the Rod & Line catch of spring<br />
salmon in <strong>2001</strong>.<br />
• The annual sea trout catch by the Fixed Engine fishery (5,267 ) was the<br />
third lowest on record, while the Net & Coble catch (5,188) was the second<br />
lowest on record. The total number of sea trout taken by Rod & Line (caught<br />
<strong>and</strong> released plus caught <strong>and</strong> retained) in <strong>2001</strong> was 31,957, a decline of<br />
19% compared to 2000 catch <strong>and</strong> 86% of the 1996-2000 5-year average.<br />
• 10,898 sea trout were reported caught <strong>and</strong> released by the Rod & Line<br />
fishery, a decline of 19% compared to the 2000 catch. In spite of the<br />
decline, this catch represented 34% of the total Rod & Line catch of sea<br />
trout, the highest proportion on record.<br />
3
2. Introduction<br />
This Bulletin summarises catch <strong>and</strong> fishing effort data reported by <strong>Scottish</strong><br />
salmon <strong>and</strong> sea trout fisheries for the year <strong>2001</strong>. The information provides an<br />
accurate guide to the current state of the fisheries as reported, but should only<br />
be used as a rough guide to the status of salmon <strong>and</strong> sea trout populations.<br />
Catch size is influenced by many factors <strong>and</strong> differences in catch between years<br />
do not necessarily reflect differences in the abundance of the populations from<br />
which the catch is derived. Interpretation of the <strong>2001</strong> catch figures are made<br />
even more difficult as a consequence of the foot <strong>and</strong> mouth outbreak <strong>and</strong> the<br />
resulting restrictions imposed on access to the countryside during much of the<br />
season.<br />
Data collection<br />
The statistics presented here are obtained from returns made in response to an<br />
annual questionnaire sent to the proprietors <strong>and</strong> occupiers of salmon fisheries<br />
under the provisions of section 15 of the <strong>Salmon</strong> <strong>and</strong> Freshwater Fisheries<br />
(Protection) (Scotl<strong>and</strong>) Act 1951 as amended by the <strong>Salmon</strong> Act, 1986. In <strong>2001</strong>,<br />
1914 forms were sent, of which 96% were returned in time to be included in<br />
this summary (Table 6, page 25). The information presented in this Bulletin is<br />
the summation of reports from individual fisheries, no attempt has been made<br />
to correct the data for non-returns or gaps in the register of proprietors <strong>and</strong><br />
occupiers.<br />
Fishery Districts <strong>and</strong> Regions<br />
For the purposes of this Bulletin, data are combined geographically into 62<br />
statistical Districts which are further aggregated into 11 Regions (pages 26 <strong>and</strong><br />
27). Districts correspond either to a single river catchment together with adjacent<br />
coast or groups of neighbouring river catchments <strong>and</strong> associated coastline. Some<br />
parts of Scotl<strong>and</strong>, in particular Orkney <strong>and</strong> Shetl<strong>and</strong>, are not considered fully<br />
covered by the survey at present <strong>and</strong> have been omitted from the regional<br />
analyses. The register of owners <strong>and</strong> occupiers of <strong>Scottish</strong> salmon fisheries<br />
continues to be updated to improve the accuracy of the survey.<br />
The fisheries<br />
Data in this Bulletin are also collated by fishing method. All <strong>Scottish</strong> salmon<br />
<strong>and</strong> sea trout fisheries fall into one of three broad categories:<br />
• Fixed Engine fisheries largely operate in coastal areas. Within this category,<br />
bag nets, stake nets <strong>and</strong> jumper nets operate throughout Scotl<strong>and</strong>, while<br />
poke nets <strong>and</strong> haaf nets are restricted to the Solway Region.<br />
• Net & Coble fisheries are beach seine operations which are generally<br />
restricted to estuaries <strong>and</strong> the lower reaches of rivers<br />
4<br />
• Rod & Line fisheries cover recreational angling which generally takes place<br />
within river systems
<strong>Catches</strong><br />
Each fishery is asked to provide the numbers <strong>and</strong> total weight of wild salmon,<br />
grilse <strong>and</strong> sea trout caught <strong>and</strong> retained in each month of the fishing season as<br />
well as the numbers <strong>and</strong> weights of farmed salmon <strong>and</strong> grilse which have been<br />
caught <strong>and</strong> retained. In addition, Rod & Line fisheries are asked to provide, for<br />
each month, the numbers <strong>and</strong> total weight of those salmon, grilse <strong>and</strong> sea trout<br />
which were caught <strong>and</strong> may have been legally retained, but were released back<br />
into the river (catch & release). Data published in this Bulletin are as reported,<br />
no attempt has been made to correct for “grilse error”, the mis-classification of<br />
fish between grilse <strong>and</strong> salmon categories.<br />
Fishing effort<br />
Net fisheries are also asked to provide estimates of fishing effort. All fisheries<br />
report the minimum <strong>and</strong> maximum number of individuals directly employed in<br />
fishing operations in each month. In addition, Fixed Engine fisheries report<br />
minimum <strong>and</strong> maximum numbers of traps operated in each month while Net &<br />
Coble fisheries report the minimum <strong>and</strong> maximum number of crews which worked<br />
each month. In both cases, this latter information is used to derive median<br />
monthly effort data. Effort returns from those Fixed Engine fisheries unique to<br />
the Solway (poke <strong>and</strong> haaf nets) do not yield data which can be easily combined<br />
with returns from the more common gear types. Data from this region are currently<br />
omitted when calculating a national index for Fixed Engine fishing effort (Figures<br />
1 <strong>and</strong> 9).<br />
Rod & Line fisheries are not currently asked to provide estimates of fishing effort.<br />
Provision of data<br />
The figures presented in this Bulletin represent the best available information<br />
for the <strong>2001</strong> fishing season at the time of publication. Our records are amended<br />
when further information becomes available <strong>and</strong> the most accurate historical<br />
data may be obtained directly from the FRS Freshwater Laboratory. Contact<br />
information is given on the back cover.<br />
The numbers <strong>and</strong> weight of salmon <strong>and</strong> sea trout caught <strong>and</strong> retained by both<br />
net <strong>and</strong> rod fisheries have been collected since 1952 together with data on<br />
netting effort. <strong>Catches</strong> of farmed salmon <strong>and</strong> the numbers of wild salmon which<br />
have been caught <strong>and</strong> released have been collected since 1994. Catch data are<br />
publicly available grouped by fishing method <strong>and</strong> fishery Region. In order to<br />
maintain confidentiality of the data derived from individual fisheries, information<br />
for individual statistical Districts is only publicly available as all fishing methods<br />
combined.<br />
5
3. Annual catch of wild salmon & grilse <strong>and</strong><br />
associated fishing effort<br />
The categories of fishing method referred to in this section are descibed in the<br />
Introduction. Tables 1 <strong>and</strong> 2 (pages 20 <strong>and</strong> 21) summarise the numbers <strong>and</strong><br />
total weights of wild salmon <strong>and</strong> grilse caught <strong>and</strong> retained in <strong>2001</strong>. Table 3<br />
(page 22) summarises the numbers <strong>and</strong> weights of wild salmon <strong>and</strong> grilse caught<br />
by rod <strong>and</strong> line <strong>and</strong> released in <strong>2001</strong>.<br />
Fixed Engine<br />
The reported annual catch in <strong>2001</strong> was the highest since 1997, but was still the<br />
fourth lowest catch recorded since 1952, while netting effort increased slightly<br />
compared to 1999 <strong>and</strong> 2000, but was the third lowest on record (Figure 1).<br />
25,041 wild salmon <strong>and</strong> grilse were reported caught <strong>and</strong> retained in <strong>2001</strong><br />
(Table 1). This represents an increase of 9% over the numbers caught in 2000,<br />
<strong>and</strong> is 1% greater than the 1996-2000 5-year average. The national index of<br />
netting effort, excluding Solway, was 392 trap months, an increase of 2%<br />
compared to reports in 2000, but 74% of the 1996-2000 5-year average.<br />
Both reported effort <strong>and</strong> catch have tended to decline over much of the period<br />
covered by our records, effort since records began <strong>and</strong> catch since the early<br />
1970s. Annual catch in <strong>2001</strong> was 10% of the maximum reported catch on record<br />
(in 1964) while reported effort was 7% of the maximum reported (in 1952).<br />
Annual catch of salmon & grilse (x10,000)<br />
30<br />
25<br />
20<br />
15<br />
10<br />
5<br />
0<br />
1950 1960 1970 1980 1990 2000<br />
6000<br />
5000<br />
4000<br />
3000<br />
2000<br />
1000<br />
0<br />
Annual fishing effort (trap months)<br />
Figure 1.<br />
Annual reported catch of salmon <strong>and</strong> grilse (grey line) <strong>and</strong> the national index of<br />
fishing effort, excluding Solway, (blue line) by fixed engine fisheries.<br />
6
Net & Coble<br />
Both the reported annual catch <strong>and</strong> effort in the net & coble fishery in <strong>2001</strong><br />
were the lowest on record (Figure 2).<br />
7,233 wild salmon <strong>and</strong> grilse were reported caught <strong>and</strong> retained in <strong>2001</strong> (Table<br />
1). This represents a decline of 42% from the numbers caught in 2000, <strong>and</strong> a<br />
decline to 57% of the 1996-2000 5-year average. Reported effort was 95 crew<br />
months, a decline of 20% compared to reports in 2000 <strong>and</strong> 61% of the 1996-<br />
2000 5-year average.<br />
Both reported catch <strong>and</strong> effort have tended to decline over much of the period<br />
covered by our records, catch since around 1970 <strong>and</strong> effort since the early 1960s.<br />
Annual catch in <strong>2001</strong> was 3% of the maximum reported catch on record (in<br />
1969) while reported effort was 9% of the maximum reported (in 1959).<br />
Annual catch of salmon & grilse (x10,000)<br />
30<br />
25<br />
20<br />
15<br />
10<br />
5<br />
0<br />
1950 1960 1970 1980 1990 2000<br />
Figure 2.<br />
Annual reported catch of salmon <strong>and</strong> grilse (grey line) <strong>and</strong> reported fishing effort<br />
(blue line) by net & coble fisheries.<br />
1200<br />
1000<br />
800<br />
600<br />
400<br />
200<br />
0<br />
Annual fishing effort (crew months)<br />
Rod & Line<br />
The number of salmon <strong>and</strong> grilse caught <strong>and</strong> retained in <strong>2001</strong> showed a marginal<br />
decline compared to 2000, <strong>and</strong> was the third lowest on record. The numbers of<br />
fish caught <strong>and</strong> released represented the highest total since 1994 when these<br />
data were first recorded. Taking reports of fish which were retained together<br />
with those released, total rod & line catches in <strong>2001</strong> showed a 10% increase<br />
over reports for 2000, <strong>and</strong> remained close to the long term average (Figure 3).<br />
44,597 wild salmon <strong>and</strong> grilse were reported caught <strong>and</strong> retained in <strong>2001</strong> (Table<br />
1), a decline of 0.1% over reports for 2000 <strong>and</strong> 89% of the 1996-2000 5-year<br />
average. A proportion of this reduction may be attributed to the increasing<br />
practice of catch & release.<br />
7
A growing number of local management interests such as District <strong>Salmon</strong> Fishery<br />
Boards, Fisheries Trusts <strong>and</strong> proprietors are encouraging the practice of catch &<br />
release as a means of protecting salmon populations. A total of 27,699 salmon<br />
<strong>and</strong> grilse was reported caught <strong>and</strong> released by the rod & line fishery (Table 3)<br />
in <strong>2001</strong>, an increase of 31% over reports for 2000 <strong>and</strong> 196% of the 1996-2000<br />
5-year average.<br />
12<br />
Annual catch of salmon & grilse (x10,000)<br />
10<br />
8<br />
6<br />
4<br />
2<br />
0<br />
1950 1960 1970 1980 1990 2000<br />
Figure 3.<br />
Annual reported catch of salmon <strong>and</strong> grilse by rod & line fisheries. Fish reported<br />
as caught <strong>and</strong> retained (grey line) <strong>and</strong> the total number of fish retained <strong>and</strong><br />
released (blue line) are shown separately. Information on catch & release has<br />
only been collected since 1994.<br />
Both the numbers of fish caught <strong>and</strong> released, <strong>and</strong> the proportion of the total<br />
rod catch which these fish represent, have tended to increase since 1994, when<br />
catch & release information was first recorded (Figure 4). Catch & release<br />
accounted for 38% of all salmon <strong>and</strong> grilse caught by rod & line in <strong>2001</strong>.<br />
Taking fish caught <strong>and</strong> retained together with catch & release, a total of 72,296<br />
wild salmon <strong>and</strong> grilse were caught by rod & line in <strong>2001</strong> (Figure 3), an increase of<br />
10% compared to the 2000 catch <strong>and</strong> 112% of the 1996-2000 5-year average.<br />
We have no record of effort in the rod <strong>and</strong> line fishery.<br />
8<br />
Rod & line catches show a markedly different pattern from those observed in<br />
both net fisheries. Despite the major declines in both net fisheries <strong>and</strong> the fall<br />
in the numbers of fish intercepted in coastal <strong>and</strong> estuarine areas, overall rod
Annual numbers of salmon & grilse<br />
caught <strong>and</strong> released (x10,000)<br />
3<br />
2<br />
1<br />
0<br />
1993 1994 1995 1996 1997 1998 1999 2000 <strong>2001</strong><br />
Figure 4.<br />
Annual reported numbers of salmon <strong>and</strong> grilse caught <strong>and</strong> released from rod &<br />
line fisheries (grey line) <strong>and</strong> the proportion of the total rod catch accounted for<br />
by catch & release (blue line). Information on catch <strong>and</strong> release has only been<br />
collected since 1994.<br />
35<br />
30<br />
25<br />
20<br />
15<br />
10<br />
5<br />
0<br />
Catch & release as a proportion of total rod catch (%)<br />
catch (caught <strong>and</strong> retained plus caught <strong>and</strong> released) show no long term trends.<br />
Thus, catches in <strong>2001</strong> are 108% of the catch averaged over the entire period<br />
covered by our records <strong>and</strong> are 101% <strong>and</strong> 112% of the 1991-2000 10-year<br />
average <strong>and</strong> the 1996-2000 5-year average, respectively. As a result overall rod<br />
<strong>and</strong> line catch constituted 69% of the total <strong>Scottish</strong> catch in <strong>2001</strong> compared to<br />
11% when records began in 1952.<br />
9
4. Annual catch of wild salmon & grilse by<br />
area <strong>and</strong> fishing method<br />
The statistical regions referred to in this section are shown on page 26 <strong>and</strong> the<br />
fishing methods employed in <strong>Scottish</strong> fisheries described in the Introduction.<br />
Table 1 summarises the numbers <strong>and</strong> total weights of wild salmon <strong>and</strong> grilse<br />
caught <strong>and</strong> retained by region <strong>and</strong> by method in <strong>2001</strong> <strong>and</strong> Table 3 summarises<br />
the numbers <strong>and</strong> weights of wild salmon <strong>and</strong> grilse caught by rod <strong>and</strong> line <strong>and</strong><br />
released in <strong>2001</strong>. Orkney <strong>and</strong> Shetl<strong>and</strong> have been omitted from the analysis<br />
because of the low reported catch from these areas compared to the other<br />
regions.<br />
The distribution of catch among regions is shown in Figure 5 by method. The<br />
catches in both net fisheries in <strong>2001</strong> were dominated by relatively few regions.<br />
70% of Fixed Engine catches were taken in the North East region, while 88%<br />
were taken in the North East <strong>and</strong> North combined. In the Net & Coble fishery,<br />
43% of catches were taken in the East region while the East <strong>and</strong> North East<br />
contributed 73% of the total. Rod & Line catches (including both retained <strong>and</strong><br />
released), were more evenly spread with no region accounting for more than<br />
one third of the total catch.<br />
Fixed Engine<br />
Net & Coble<br />
East<br />
North East<br />
Moray Firth<br />
North<br />
North West<br />
West<br />
Clyde<br />
Solway<br />
Outer Hebrides<br />
Rod & Line<br />
10<br />
Figure 5.<br />
Distribution of the annual reported catch of salmon <strong>and</strong> grilse among Regions.<br />
Data for each fishing method are shown separately, rod & line catch includes<br />
both retained <strong>and</strong> released fish.
Figure 6 shows how regional catches of salmon <strong>and</strong> grilse in <strong>2001</strong> have changed<br />
compared to the previous 5-year-average (1996-2000). Fixed Engine catches<br />
declined in all but 2 regions (North East <strong>and</strong> Moray Firth), the largest declines<br />
generally occurring in the west coast of Scotl<strong>and</strong>. Net & Coble catches also<br />
declined in all but 2 regions (Moray Firth <strong>and</strong> Solway), but with little geographical<br />
pattern in evidence. Rod & Line catches (including both retained <strong>and</strong> released),<br />
on the other h<strong>and</strong>, showed increases in most regions, only North West <strong>and</strong><br />
Solway proving exceptions. Increases were generally higher in the west coast<br />
regions compared to the east.<br />
Proportion change (%)<br />
Proportion change (%)<br />
Proportion change (%)<br />
40<br />
20<br />
0<br />
-20<br />
-40<br />
-60<br />
-80<br />
-100<br />
150<br />
100<br />
50<br />
0<br />
-50<br />
-100<br />
80<br />
60<br />
40<br />
20<br />
0<br />
-20<br />
-40<br />
Fixed Engine<br />
East N East M Firth North N West West Clyde Solway O Hebs<br />
Net & Coble<br />
East N East M Firth North N West West Clyde Solway O Hebs<br />
Rod & Line (retained <strong>and</strong> released)<br />
East N East M Firth North N West West Clyde Solway O Hebs<br />
Figure 6.<br />
Trends in reported catch by Region <strong>and</strong> fishing method. Percentage difference<br />
between the annual reported catch of salmon <strong>and</strong> grilse for <strong>2001</strong> <strong>and</strong> the average<br />
catch for the previous 5-year period (1996 to 2000) is shown for each Region.<br />
Data for each fishing method are shown separately, rod & line catch includes<br />
both retained <strong>and</strong> released fish.<br />
11
5. Catch of wild spring salmon, summer salmon<br />
<strong>and</strong> grilse<br />
The reported number of spring salmon (multi sea-winter fish taken before<br />
1 May) caught <strong>and</strong> retained by all methods in <strong>2001</strong> was 3,986, 87% of which<br />
were taken by rod <strong>and</strong> line, 8% by fixed engine <strong>and</strong> 5% by net & coble (Table 1).<br />
This overall catch represented an increase of 24% compared to 2000, within<br />
which each method also registered an increase.<br />
A further 3,362 spring salmon were caught by rod & line <strong>and</strong> released (Table 3),<br />
an increase of 91% over 2000. Taking fish caught <strong>and</strong> retained together with<br />
catch & release, a total of 6,808 spring fish were caught by rod & line in <strong>2001</strong><br />
(Figure 7). The total catch of spring salmon by rod & line increased by 44%<br />
compared to the 2000 catch <strong>and</strong> was 127% of the of the 1996-2000 5-year<br />
average.<br />
3.0<br />
Spring salmon catch (x10,000)<br />
2.5<br />
2.0<br />
1.5<br />
1.0<br />
0.5<br />
0<br />
1950 1960 1970 1980 1990 2000<br />
Figure 7.<br />
Annual reported catch of spring salmon by rod & line. Fish reported as caught<br />
<strong>and</strong> retained (grey line) <strong>and</strong> the total number of fish retained <strong>and</strong> released (blue<br />
line) are shown separately. Information on catch & release has only been collected<br />
since 1994.<br />
12
Fish caught <strong>and</strong> released comprised 49% of the rod & line catch of spring salmon<br />
in <strong>2001</strong>. Both the numbers of spring salmon caught <strong>and</strong> released <strong>and</strong> the<br />
proportion of total spring rod catch which is released has tended to rise since<br />
1994 when records on catch & release were first kept (Figure 8).<br />
4<br />
60<br />
Annual numbers of spring salmon<br />
caught <strong>and</strong> released (x1,000)<br />
3<br />
2<br />
1<br />
50<br />
40<br />
30<br />
20<br />
10<br />
Catch & release as a proportion of<br />
total rod catch of spring salmon (%)<br />
0<br />
0<br />
1993 1994 1995 1996 1997 1998 1999 2000 <strong>2001</strong> 2002<br />
Figure 8.<br />
Annual reported numbers of spring salmon caught <strong>and</strong> released from rod & line<br />
fisheries (grey line) together with the proportion of the total spring salmon rod<br />
catch accounted for by catch & release (blue line). Information on catch <strong>and</strong><br />
release has only been collected since 1994.<br />
The reported number of summer salmon (multi sea-winter fish taken after 30<br />
April) caught <strong>and</strong> retained in <strong>2001</strong> was 30,657 (Table 1). The rod & line fishery<br />
took 74% of the catch with the fixed engine <strong>and</strong> net & coble fisheries taking<br />
20% <strong>and</strong> 6% respectively. This overall catch represented a decline of 8% over<br />
2000.<br />
A further 14,964 summer salmon were caught by rod & line <strong>and</strong> released<br />
(Table 3), a 25% increase over 2000. Fish caught <strong>and</strong> released comprised 40%<br />
of the total rod & line summer salmon catch in <strong>2001</strong>.<br />
The reported number of grilse caught <strong>and</strong> retained in <strong>2001</strong> was 42,228<br />
(Table 1). The rod & line fishery caught 44% of the total <strong>and</strong> the fixed engine<br />
<strong>and</strong> net & coble fisheries accounted for 44% <strong>and</strong> 12% respectively. This overall<br />
catch represented a 3% decrease on the numbers of grilse caught <strong>and</strong> retained<br />
in 2000, a decline which reflected the sharp drop in the net & coble catch.<br />
A total of 9,373 grilse were caught by rod & line <strong>and</strong> released (Table 3), a 27%<br />
increase over 2000. Catch & release comprised 34% of the total rod & line grilse<br />
catch in <strong>2001</strong>.<br />
13
6. Farmed salmon <strong>and</strong> grilse<br />
Tables 4 <strong>and</strong> 5 (pages 23 <strong>and</strong> 24) summarise the reported numbers <strong>and</strong> total<br />
weights of salmon <strong>and</strong> grilse of farmed origin caught <strong>and</strong> retained in <strong>2001</strong>. A<br />
total of 602 fish of farmed origin were reported in <strong>2001</strong>, an increase of 61%<br />
over reports for 2000. <strong>Salmon</strong> <strong>and</strong> grilse of farmed origin represented 0.6% of<br />
the total number of salmon <strong>and</strong> grilse caught in <strong>2001</strong>, a slight increase over the<br />
value of 0.4% for 2000. No fish of farmed origin were reported as having been<br />
caught <strong>and</strong> released from the rod fishery in <strong>2001</strong>.<br />
The geographical distribution of catches was highly uneven, 38% being taken<br />
in the Clyde Coast region <strong>and</strong> 25% in the West Coast. These regions, together<br />
with the North West, Solway <strong>and</strong> Outer Hebrides accounted for 97% of the fish<br />
of farmed origin reported in the <strong>2001</strong> catches.<br />
14
7. <strong>Sea</strong> <strong>Trout</strong><br />
A total of 5,267 sea trout were reported caught <strong>and</strong> retained in <strong>Scottish</strong> Fixed<br />
Engine fisheries in <strong>2001</strong> (Table 1 <strong>and</strong> Figure 9), which was a decline of 30%<br />
compared to 2000, but remained at 102% of the 1996-2000 5-year average.<br />
On the other h<strong>and</strong>, the national index of fishing effort was 392 trap months, a<br />
slight increase compared to reports for 2000, but 74% of the 1996-2000 5-year<br />
average.<br />
Annual catch of sea trout (x10,000)<br />
7<br />
6<br />
5<br />
4<br />
3<br />
2<br />
1<br />
6000<br />
5000<br />
4000<br />
3000<br />
2000<br />
1000<br />
Annual fishing effort (trap months)<br />
0<br />
1950 1960 1970 1980 1990 2000<br />
Figure 9.<br />
Annual reported catch of sea trout (grey line) <strong>and</strong> the national index of fishing<br />
effort, excluding Solway, (blue line) by fixed engine fisheries.<br />
0<br />
15
A total of 5,188 sea trout was reported caught <strong>and</strong> retained in <strong>Scottish</strong> Net &<br />
Coble fisheries in <strong>2001</strong> (Table 1, Figure 10), an increase of 22% on the reported<br />
catch in 2000, but nevertheless the second lowest on record. The reported catch<br />
in <strong>2001</strong> was 68% of the 1996-2000 5-year average. Reported effort was 95 crew<br />
months which was the lowest on record, a decline of 20% compared to reports in<br />
2000 <strong>and</strong> 61% of the 1996-2000 5-year average.<br />
Annual catch of sea trout (x10,000)<br />
20<br />
18<br />
16<br />
14<br />
12<br />
10<br />
8<br />
6<br />
4<br />
2<br />
0<br />
1950 1960 1970 1980 1990 2000<br />
1200<br />
1000<br />
800<br />
600<br />
400<br />
200<br />
0<br />
Annual fishing effort (crew months)<br />
Figure 10.<br />
Annual reported catch of sea trout (grey line) <strong>and</strong> reported fishing effort (blue<br />
line) by net & coble fisheries.<br />
21,059 sea trout were reported caught <strong>and</strong> retained in the Rod & Line fisheries in<br />
<strong>2001</strong> (Table 1, Figure 11). This represents a decline of 23% compared to the<br />
2000 catch <strong>and</strong> was 73% of the 1996-2000 5-year average. As with the salmon<br />
<strong>and</strong> grilse returns, additional sea trout were taken by the rod & line fishery <strong>and</strong><br />
subsequently released.<br />
A total of 10,898 sea trout was reported caught <strong>and</strong> released by the rod & line<br />
fishery (Table 3, Figure 11). This represents a decline of 10% compared to the<br />
2000 catch, but was nevertheless the second highest catch & release total on<br />
record <strong>and</strong> 129% of the 1996-2000 5-year average. Despite the decline in the<br />
numbers of sea trout released from the rod & line fishery, the proportion of the<br />
total rod catch which these fish represent increased to 34% in <strong>2001</strong>. Indeed, the<br />
numbers of sea trout fish caught <strong>and</strong> released <strong>and</strong> the proportion of the total rod<br />
16
8<br />
Annual catch of sea trout (x10,000)<br />
7<br />
6<br />
5<br />
4<br />
3<br />
2<br />
1<br />
0<br />
1950 1960 1970 1980 1990 2000<br />
Figure 11.<br />
Annual reported catch of sea trout by rod & line fisheries. Fish reported as caught<br />
<strong>and</strong> retained (grey line) <strong>and</strong> the total number of fish retained <strong>and</strong> released (yellow<br />
line) are shown separately. Information on catch & release has only been collected<br />
since 1994.<br />
catch which these fish represent, have generally tended to increase since 1994,<br />
when catch & release information was first recorded (Figure 12).<br />
Taking fish caught <strong>and</strong> retained together with catch & release, a total of 31,957<br />
sea trout were caught by rod & line in <strong>2001</strong> (Figure 11), a decrease of 19%<br />
compared to the 2000 catch <strong>and</strong> 86% of the 1996-2000 5-year average. We<br />
have no record of effort in the rod & line fishery.<br />
Annual numbers of sea trout<br />
caught <strong>and</strong> released (x10,000)<br />
1.50<br />
1.25<br />
1.00<br />
0.75<br />
0.50<br />
0.25<br />
0<br />
1993 1994 1995 1996 1997 1998 1999 2000 <strong>2001</strong><br />
Figure 12.<br />
Annual reported numbers of sea trout caught <strong>and</strong> released from rod & line<br />
fisheries (grey line) together with the proportion of the total rod catch accounted<br />
for by catch & release (blue line). Information on catch & release has only been<br />
collected since 1994.<br />
40<br />
35<br />
30<br />
25<br />
20<br />
15<br />
10<br />
5<br />
0<br />
Catch & release as a proportion of total rod catch (%)<br />
17
The distribution of the sea trout catch among regions is shown in Figure 13 by<br />
method. As with salmon <strong>and</strong> grilse returns, the catches of sea trout in both net<br />
fisheries were dominated by relatively few regions in <strong>2001</strong>. 90% of Fixed Engine<br />
catches were taken in just two Regions (North East <strong>and</strong> Solway) while 98% of<br />
Net & Coble catches were also taken in two Regions (East <strong>and</strong> North East). Rod<br />
& Line catches (which includes both retained <strong>and</strong> released fish), showed a more<br />
even geographical spread with no Region accounting for more than 30% of the<br />
catch.<br />
Fixed Engine<br />
Net & Coble<br />
East<br />
North East<br />
Moray Firth<br />
North<br />
North West<br />
West<br />
Clyde<br />
Solway<br />
Outer Hebrides<br />
Rod & Line<br />
Figure 13.<br />
Distribution of the annual reported catch of sea trout among Regions. Data for<br />
each fishing method are shown separately, rod & line catch includes both retained<br />
<strong>and</strong> released fish.<br />
18
Figure 14 shows how regional catches of sea trout in <strong>2001</strong> compare with the<br />
previous 5-year-average (1996-2000). Net fisheries showed no clear<br />
geographical pattern in catch while the numbers of fish caught by the Rod &<br />
Line fishery (including both retained <strong>and</strong> released) declined in all regions except<br />
the Clyde coast.<br />
Proportion change (%)<br />
Proportion change (%)<br />
160<br />
120<br />
80<br />
40<br />
0<br />
-40<br />
-80<br />
-120<br />
150<br />
100<br />
50<br />
0<br />
-50<br />
-100<br />
Fixed Engine<br />
East N East M Firth North N West West Clyde Solway O Hebs<br />
Net & Coble<br />
East N East M Firth North N West West Clyde Solway O Hebs<br />
Proportion change (%)<br />
80<br />
40<br />
0<br />
-40<br />
Rod & Line (retained + released)<br />
East N East M Firth North N West West Clyde Solway O Hebs<br />
Figure 14.<br />
Trends in reported catch by Region <strong>and</strong> fishing method. Percentage difference<br />
between the annual reported catch of sea trout for <strong>2001</strong> <strong>and</strong> the average catch<br />
for the previous 5-year period (1996 to 2000) is shown by Region. Data for each<br />
fishing method are shown separately, rod & line catch includes both retained<br />
<strong>and</strong> released fish.<br />
19
Table 1:<br />
Number <strong>and</strong> weight of wild salmon, grilse <strong>and</strong> sea trout caught <strong>and</strong> retained by salmon fishery Region<br />
<strong>and</strong> by method during <strong>2001</strong>.<br />
Number<br />
Weight (kg)<br />
Region <strong>Salmon</strong> Grilse <strong>Salmon</strong> <strong>Sea</strong> <strong>Salmon</strong> Grilse <strong>Salmon</strong> <strong>Sea</strong><br />
Method Jan-Apr May-Dec Annual + Grilse <strong>Trout</strong> Jan-Apr May-Dec Annual + Grilse <strong>Trout</strong><br />
East<br />
Rod <strong>and</strong> Line 1500 8007 9507 4214 13721 2599 6300 34203 40504 9835 50339 3421<br />
Net <strong>and</strong> Coble 64 785 849 2253 3102 2332 363 4287 4650 5854 10504 3948<br />
Fixed Engine 123 50 173 244 417 480 606 255 860 904 1764 1002<br />
All Methods 1687 8842 10529 6711 17240 5411 7269 38745 46014 16593 62606 8370<br />
North East<br />
Rod <strong>and</strong> Line 834 2096 2930 1084 4014 4419 3524 8981 12505 2684 15189 4136<br />
Net <strong>and</strong> Coble 152 430 582 1561 2143 2746 621 1756 2376 3186 5562 1873<br />
Fixed Engine 187 4297 4484 12974 17458 2378 761 19211 19972 30856 50828 2121<br />
All Methods 1173 6823 7996 15619 23615 9543 4906 29947 34853 36726 71579 8130<br />
Moray Firth<br />
Rod <strong>and</strong> Line 628 6766 7394 7097 14491 5644 2871 28648 31519 15960 47479 6165<br />
Net <strong>and</strong> Coble 159 159 489 648 22 540 540 1141 1681 28<br />
Fixed Engine 86 86 343 429 22 429 429 802 1231 15<br />
All Methods 628 7011 7639 7929 15568 5688 2871 29617 32488 17903 50391 6209<br />
North<br />
Rod <strong>and</strong> Line 419 2303 2722 2484 5206 1045 1805 9232 11037 5878 16915 860<br />
Net <strong>and</strong> Coble 309 309 490 799 9 1139 1139 1099 2238 11<br />
Fixed Engine 4 1253 1257 3392 4649 21 20 6398 6417 8682 15099 22<br />
All Methods 423 3865 4288 6366 10654 1075 1824 16769 18593 15659 34252 894<br />
North West<br />
Rod <strong>and</strong> Line 1 251 252 253 505 483 4 950 954 638 1592 255<br />
Net <strong>and</strong> Coble 40 40 86 126 33 131 131 171 302 23<br />
Fixed Engine 3 3 8 11 16 16 19 35<br />
All Methods 1 294 295 347 642 516 4 1097 1100 828 1928 278<br />
West Coast<br />
Rod <strong>and</strong> Line 3 294 297 105 402 544 6 1031 1037 271 1308 349<br />
Net <strong>and</strong> Coble 48 48 63 111 25 148 148 127 275 25<br />
Fixed Engine 8 100 108 209 317 13 37 434 471 586 1057 12<br />
All Methods 11 442 453 377 830 582 43 1613 1656 985 2641 385<br />
Clyde Coast<br />
Rod <strong>and</strong> Line 52 1643 1695 1592 3287 2896 225 6150 6375 4065 10439 1984<br />
Net <strong>and</strong> Coble<br />
Fixed Engine 9 9 32 41 11 69 69 80 149 19<br />
All Methods 52 1652 1704 1624 3328 2907 225 6219 6444 4145 10588 2002<br />
Solway<br />
Rod <strong>and</strong> Line 9 1145 1154 696 1850 1739 47 4758 4805 1682 6487 1776<br />
Net <strong>and</strong> Coble 34 34 270 304 21 153 153 713 866 18<br />
Fixed Engine 2 455 457 1262 1719 2342 7 2347 2354 2862 5215 3404<br />
All Methods 11 1634 1645 2228 3873 4102 54 7258 7311 5257 12568 5198<br />
Orkney<br />
Rod <strong>and</strong> Line<br />
Net <strong>and</strong> Coble<br />
Fixed Engine<br />
All Methods<br />
Shetl<strong>and</strong><br />
Rod <strong>and</strong> Line 144 80<br />
Net <strong>and</strong> Coble<br />
Fixed Engine<br />
All Methods 144 80<br />
Outer Hebrides<br />
Rod <strong>and</strong> Line 94 94 1027 1121 1546 380 380 2363 2743 1066<br />
Net <strong>and</strong> Coble<br />
Fixed Engine<br />
All Methods 94 94 1027 1121 1546 380 380 2363 2743 1066<br />
20<br />
All Scotl<strong>and</strong><br />
Rod <strong>and</strong> Line 3446 22599 26045 18552 44597 21059 14781 94335 109115 43375 152491 20091<br />
Net <strong>and</strong> Coble 216 1805 2021 5212 7233 5188 984 8153 9136 12291 21427 5926<br />
Fixed Engine 324 6253 6577 18464 25041 5267 1430 29158 30588 44791 75379 6594<br />
All Methods 3986 30657 34643 42228 76871 31514 17195 131645 148839 100457 249296 32611
Table 2:<br />
Number <strong>and</strong> weight of wild salmon, grilse <strong>and</strong> sea trout caught <strong>and</strong> retained by salmon fishery District<br />
<strong>and</strong> Region during <strong>2001</strong>.<br />
Number<br />
Weight (kg)<br />
Region <strong>Salmon</strong> Grilse <strong>Salmon</strong> <strong>Sea</strong> <strong>Salmon</strong> Grilse <strong>Salmon</strong> <strong>Sea</strong><br />
District Jan-Apr May-Dec Annual + Grilse <strong>Trout</strong> Jan-Apr May-Dec Annual + Grilse <strong>Trout</strong><br />
East 1687 8842 10529 6711 17240 5411 7269 38745 46014 16593 62606 8370<br />
Tweed 914 4151 5065 3194 8259 3492 3906 17990 21896 8323 30219 6429<br />
Forth 34 858 892 816 1708 719 169 3439 3608 1677 5285 702<br />
Tay 739 3833 4572 2701 7273 1200 3194 17316 20509 6593 27102 1239<br />
North East 1173 6823 7996 15619 23615 9543 4906 29947 34853 36726 71579 8130<br />
South Esk 179 2549 2728 6565 9293 2641 746 11733 12479 17552 30031 2691<br />
North Esk <strong>and</strong> Bervie 615 2901 3516 7715 11231 3009 2545 11660 14205 15824 30029 1630<br />
Dee (Aberdeenshire) 159 220 379 264 643 973 652 948 1600 542 2142 832<br />
Don 219 838 1057 760 1817 615 958 4175 5133 1942 7075 614<br />
Ythan 1 239 240 251 491 1302 5 1042 1046 687 1733 1221<br />
Ugie 76 76 64 140 1003 390 390 179 569 1142<br />
Moray Firth 628 7011 7639 7929 15568 5688 2871 29617 32488 17903 50391 6209<br />
Deveron 75 1468 1543 1031 2574 897 311 5625 5936 2177 8112 1164<br />
Spey 350 2848 3198 2802 6000 3125 1572 13793 15365 6119 21484 3773<br />
Lossie 2 2 85 87 313 8 8 163 171 290<br />
Findhorn 110 723 833 1061 1894 329 555 2913 3468 2134 5603 308<br />
Nairn 9 129 138 388 526 131 36 450 486 820 1305 128<br />
Ness 64 684 748 661 1409 181 306 2761 3067 1597 4665 121<br />
Beauly 5 424 429 534 963 87 24 1409 1434 1309 2743 75<br />
Conon <strong>and</strong> Alness 15 733 748 1367 2115 625 66 2658 2725 3585 6309 351<br />
North 423 3865 4288 6366 10654 1075 1824 16769 18593 15659 34252 894<br />
Kyle of Sutherl<strong>and</strong> 77 661 738 1464 2202 388 326 2609 2935 3410 6344 279<br />
Fleet <strong>and</strong> Brora 86 357 443 173 616 36 343 1336 1679 401 2080 25<br />
Helmsdale 101 310 411 227 638 137 453 1294 1747 548 2294 103<br />
Berriedale to Wick 3 169 172 701 873 39 9 725 734 1624 2358 27<br />
Thurso <strong>and</strong> Forss 82 939 1021 201 1222 0 366 3672 4038 510 4549 0<br />
Halladale <strong>and</strong> Strathy 13 1225 1238 3161 4399 27 54 6246 6301 8142 14443 25<br />
Naver <strong>and</strong> Kinloch 61 167 228 359 587 16 273 745 1018 844 1862 12<br />
Hope <strong>and</strong> Grudie 37 37 80 117 432 142 142 181 322 423<br />
North West 1 294 295 347 642 516 4 1097 1100 828 1928 278<br />
Inchard to Kirkaig 1 112 113 181 294 100 4 454 458 446 904 53<br />
Kennart to Gruinard 10 10 33 43 30 37 37 88 126 12<br />
Ewe 70 70 70 77 244 244 244 51<br />
Badachro to Applecross 7 7 7 22 21 21 21 16<br />
Kishorn <strong>and</strong> Carron 1 1 1 15 4 4 4 7<br />
Loch Long <strong>and</strong> Croe 44 44 87 131 64 145 145 173 318 31<br />
Glenelg to Kilchoan 3 3 35 7 7 13<br />
Morar to Shiel 41 41 32 73 19 144 144 85 229 14<br />
Skye <strong>and</strong> Small Isles 9 9 11 20 154 48 48 29 77 81<br />
West Coast 11 442 453 377 830 582 43 1613 1656 985 2641 385<br />
Sunart <strong>and</strong> Aline 51 51 2 53 30 163 163 4 167 14<br />
S<strong>and</strong>a to Creran 8 84 92 228 320 163 37 416 453 633 1086 107<br />
Awe <strong>and</strong> Nell 3 69 72 59 131 27 6 302 308 162 470 21<br />
Add <strong>and</strong> Ormsary 71 71 71 142 83 215 215 142 357 41<br />
Isl<strong>and</strong> of Mull 35 35 11 46 64 107 107 33 140 47<br />
Islay <strong>and</strong> Jura 132 132 6 138 215 410 410 12 421 155<br />
Clyde Coast 52 1652 1704 1624 3328 2907 225 6219 6444 4145 10588 2002<br />
Carradale <strong>and</strong> Iorsa 13 13 1 14 64 39 39 3 42 48<br />
Fyne 9 9 34 43 30 69 69 85 154 39<br />
Ruel <strong>and</strong> Drummachloy 1 1 3 4 3 3 6 9<br />
Echaig 6 6 11 17 187 16 16 31 47 187<br />
Clyde 49 325 374 381 755 2422 212 1301 1513 880 2393 1559<br />
Irvine 169 169 165 334 35 605 605 418 1023 22<br />
Ayr 479 479 270 749 7 1631 1631 697 2327 6<br />
Doon 298 298 366 664 3 1172 1172 983 2154 3<br />
Girvan 3 153 156 152 308 144 13 582 594 425 1020 123<br />
Stinchar 199 199 241 440 15 803 803 618 1421 14<br />
Solway 11 1634 1645 2228 3873 4102 54 7258 7311 5257 12568 5198<br />
Luce 85 85 23 108 55 273 273 47 320 42<br />
Bladenoch 1 14 15 29 44 1 3 47 50 74 124 1<br />
Cree <strong>and</strong> Fleet 114 114 472 586 146 468 468 1200 1668 121<br />
Dee (Kirkcudbright) 19 19 14 33 1 73 73 35 108 1<br />
Urr 34 34 76 110 41 135 135 227 362 40<br />
Nith 8 1065 1073 948 2021 1400 43 4640 4683 2075 6758 1567<br />
Annan 2 303 305 666 971 2458 7 1622 1629 1600 3230 3426<br />
Orkney<br />
Shetl<strong>and</strong> 144 80<br />
Shetl<strong>and</strong> 144 80<br />
Outer Hebrides 94 94 1027 1121 1546 380 380 2363 2743 1066<br />
Isle of Lewis 36 36 736 772 772 98 98 1655 1753 380<br />
Harris 58 58 251 309 608 282 282 608 890 497<br />
The Uists 40 40 166 100 100 188<br />
All Scotl<strong>and</strong> 3986 30657 34643 42228 76871 31514 17195 131645 148839 100457 249296 32611<br />
21
Table 3:<br />
Number <strong>and</strong> weight of wild salmon, grilse <strong>and</strong> sea trout caught <strong>and</strong> released by salmon fishery District<br />
<strong>and</strong> Region from rod & line fisheries during <strong>2001</strong>.<br />
Number<br />
Weight (kg)<br />
Region <strong>Salmon</strong> Grilse <strong>Salmon</strong> <strong>Sea</strong> <strong>Salmon</strong> Grilse <strong>Salmon</strong> <strong>Sea</strong><br />
District Jan-Apr May-Dec Annual + Grilse <strong>Trout</strong> Jan-Apr May-Dec Annual + Grilse <strong>Trout</strong><br />
East 1302 5048 6350 1822 8172 944 5314 20999 26314 4375 30689 1261<br />
Tweed 817 2841 3658 601 4259 398 3189 11783 14972 1706 16677 701<br />
Forth 70 853 923 398 1321 190 282 3166 3448 716 4164 195<br />
Tay 415 1354 1769 823 2592 356 1843 6051 7894 1954 9848 365<br />
North East 1416 3312 4728 1401 6129 3932 5985 14386 20371 3252 23622 2722<br />
South Esk 60 217 277 45 322 373 240 805 1046 91 1137 332<br />
North Esk <strong>and</strong> Bervie 224 547 771 231 1002 174 902 2175 3077 616 3693 179<br />
Dee (Aberdeenshire) 1098 1923 3021 990 4011 1929 4717 8507 13224 2158 15381 1510<br />
Don 33 556 589 121 710 859 122 2601 2722 346 3069 389<br />
Ythan 1 65 66 10 76 597 4 275 279 29 308 313<br />
Ugie 4 4 4 8 23 23 12 35<br />
Moray Firth 204 3003 3207 1866 5073 1057 938 13052 13990 4397 18387 1115<br />
Deveron 12 824 836 306 1142 383 47 3231 3278 663 3940 513<br />
Spey 113 1018 1131 568 1699 312 475 5097 5572 1198 6769 380<br />
Lossie 3 3 28 31 7 11 11 51 62 7<br />
Findhorn 15 612 627 367 994 22 76 2519 2595 778 3374 21<br />
Nairn 1 41 42 109 151 29 3 138 141 230 370 29<br />
Ness 44 190 234 36 270 73 247 860 1107 101 1207 34<br />
Beauly 1 125 126 173 299 73 5 430 435 433 867 42<br />
Conon <strong>and</strong> Alness 18 190 208 279 487 158 86 766 853 944 1797 89<br />
North 402 1990 2392 2133 4525 881 1743 8406 10149 5020 15170 599<br />
Kyle of Sutherl<strong>and</strong> 250 789 1039 962 <strong>2001</strong> 196 1043 3237 4280 2211 6491 99<br />
Fleet <strong>and</strong> Brora 1 50 51 18 69 1 6 183 189 45 234 2<br />
Helmsdale 44 767 811 741 1552 13 203 3272 3475 1754 5229 6<br />
Berriedale to Wick 47 47 93 140 181 181 219 399<br />
Thurso <strong>and</strong> Forss 10 10 13 23 38 38 37 75<br />
Halladale <strong>and</strong> Strathy 2 47 49 114 163 6 214 220 292 512<br />
Naver <strong>and</strong> Kinloch 105 250 355 127 482 8 486 1161 1647 310 1957 10<br />
Hope <strong>and</strong> Grudie 30 30 65 95 663 121 121 153 273 481<br />
North West 1 216 217 202 419 1153 4 800 804 508 1312 500<br />
Inchard to Kirkaig 1 47 48 28 76 569 4 204 208 59 266 231<br />
Kennart to Gruinard 98 98 129 227 105 350 350 323 673 56<br />
Ewe 23 23 3 26 84 80 80 6 86 52<br />
Badachro to Applecross 3 3 3 3 6 6 6 2<br />
Kishorn <strong>and</strong> Carron 5 5 72 12 12 37<br />
Loch Long <strong>and</strong> Croe 10 10 11 21 48 48 35 83<br />
Glenelg to Kilchoan 2 2 87 4 4 19<br />
Morar to Shiel 21 21 22 43 158 77 77 65 142 84<br />
Skye <strong>and</strong> Small Isles 14 14 2 16 75 36 36 5 41 19<br />
West Coast 6 458 464 665 1129 468 17 2106 2123 1910 4034 237<br />
Sunart <strong>and</strong> Aline 8 8 8 73 39 39 39 34<br />
S<strong>and</strong>a to Creran 163 163 400 563 153 826 826 1191 2017 92<br />
Awe <strong>and</strong> Nell 1 213 214 265 479 33 5 1018 1023 720 1743 16<br />
Add <strong>and</strong> Ormsary 6 6 6 16 16 16<br />
Isl<strong>and</strong> of Mull 25 25 25 107 71 71 71 49<br />
Islay <strong>and</strong> Jura 5 43 48 48 102 11 136 148 148 46<br />
Clyde Coast 18 470 488 454 942 1430 81 1803 1884 1139 3023 954<br />
Carradale <strong>and</strong> Iorsa 9 9 1 10 34 26 26 2 28 17<br />
Fyne 2 2 2 8 6 6 6 16<br />
Ruel <strong>and</strong> Drummachloy 3 3 3 10 10 10<br />
Echaig 127 107<br />
Clyde 18 217 235 197 432 1120 81 844 925 454 1379 712<br />
Irvine 32 32 35 67 118 118 92 210<br />
Ayr 36 36 5 41 4 123 123 15 138 1<br />
Doon 39 39 119 158 50 166 166 327 494 24<br />
Girvan 57 57 22 79 38 199 199 59 258 40<br />
Stinchar 75 75 75 150 49 311 311 189 500 38<br />
Solway 13 446 459 219 678 362 49 1924 1974 539 2513 342<br />
Luce 2 2 2 6 6 6<br />
Bladenoch 5 41 46 37 83 13 156 169 90 258<br />
Cree <strong>and</strong> Fleet 7 30 37 16 53 30 31 124 155 42 198 25<br />
Dee (Kirkcudbright) 4 4 2 6 5 18 18 6 24 2<br />
Urr 7 7 1 8 18 31 31 2 33 11<br />
Nith 1 326 327 141 468 189 6 1405 1411 346 1757 214<br />
Annan 36 36 22 58 120 184 184 53 238 91<br />
Orkney<br />
Shetl<strong>and</strong><br />
Outer Hebrides 21 21 611 632 671 68 68 1468 1536 367<br />
Isle of Lewis 18 18 573 591 336 58 58 1369 1427 210<br />
Harris 3 3 19 22 38 10 10 51 62 20<br />
The Uists 19 19 297 48 48 137<br />
22<br />
All Scotl<strong>and</strong> 3362 14964 18326 9373 27699 10898 14131 63544 77676 22609 100285 8097
Table 4:<br />
Number <strong>and</strong> weight of farmed salmon <strong>and</strong> grilse caught <strong>and</strong> retained by salmon fishery Region <strong>and</strong> by<br />
method during <strong>2001</strong>.<br />
Number<br />
Weight (kg)<br />
Region <strong>Salmon</strong> Grilse <strong>Salmon</strong> <strong>Salmon</strong> Grilse <strong>Salmon</strong><br />
Method Jan-Apr May-Dec Annual + Grilse Jan-Apr May-Dec Annual + Grilse<br />
East<br />
Rod <strong>and</strong> Line 4 4 4 5 5 5<br />
Net <strong>and</strong> Coble<br />
Fixed Engine 1 1 1 4 4 4<br />
All Methods 5 5 5 9 9 9<br />
North East<br />
Rod <strong>and</strong> Line<br />
Net <strong>and</strong> Coble<br />
Fixed Engine 1 1 2 3 5 5 5 10<br />
All Methods 1 1 2 3 5 5 5 10<br />
Moray Firth<br />
Rod <strong>and</strong> Line 1 1 1 3 3 3<br />
Net <strong>and</strong> Coble<br />
Fixed Engine 1 1 3 3<br />
All Methods 1 1 1 2 3 3 3 6<br />
North<br />
Rod <strong>and</strong> Line 1 1 3 3<br />
Net <strong>and</strong> Coble<br />
Fixed Engine 5 5 3 8 24 24 7 31<br />
All Methods 5 5 4 9 24 24 10 34<br />
North West<br />
Rod <strong>and</strong> Line 26 26 12 38 68 68 26 94<br />
Net <strong>and</strong> Coble 10 10 36 46 30 30 49 79<br />
Fixed Engine<br />
All Methods 36 36 48 84 98 98 74 173<br />
West Coast<br />
Rod <strong>and</strong> Line 40 40 11 51 207 207 28 235<br />
Net <strong>and</strong> Coble 8 8 8 16 24 24 16 40<br />
Fixed Engine 3 42 45 39 84 17 237 254 95 349<br />
All Methods 3 90 93 58 151 17 468 485 140 624<br />
Clyde Coast<br />
Rod <strong>and</strong> Line 10 10 19 29 34 34 39 73<br />
Net <strong>and</strong> Coble<br />
Fixed Engine 100 100 100 200 454 454 227 680<br />
All Methods 110 110 119 229 488 488 266 754<br />
Solway<br />
Orkney<br />
Shetl<strong>and</strong><br />
Rod <strong>and</strong> Line 9 9 4 13 24 24 7 31<br />
Net <strong>and</strong> Coble 15 15 27 27<br />
Fixed Engine 5 5 57 62 28 28 102 131<br />
All Methods 14 14 76 90 52 52 136 188<br />
Rod <strong>and</strong> Line<br />
Net <strong>and</strong> Coble<br />
Fixed Engine<br />
All Methods<br />
Rod <strong>and</strong> Line<br />
Net <strong>and</strong> Coble<br />
Fixed Engine<br />
All Methods<br />
Outer Hebrides<br />
Rod <strong>and</strong> Line 29 29 33 33<br />
Net <strong>and</strong> Coble<br />
Fixed Engine<br />
All Methods 29 29 33 33<br />
All Scotl<strong>and</strong><br />
Rod <strong>and</strong> Line 90 90 76 166 340 340 136 476<br />
Net <strong>and</strong> Coble 18 18 59 77 54 54 91 146<br />
Fixed Engine 3 154 157 202 359 17 751 768 440 1208<br />
All Methods 3 262 265 337 602 17 1146 1163 667 1830<br />
23
Table 5:<br />
Number <strong>and</strong> weight of farmed salmon <strong>and</strong> grilse caught <strong>and</strong> retained by salmon fishery District <strong>and</strong><br />
Region during <strong>2001</strong>.<br />
Number<br />
Weight (kg)<br />
Region <strong>Salmon</strong> Grilse <strong>Salmon</strong> <strong>Salmon</strong> Grilse <strong>Salmon</strong><br />
District Jan-Apr May-Dec Annual + Grilse Jan-Apr May-Dec Annual + Grilse<br />
East 5 5 5 9 9 9<br />
Tweed<br />
Forth<br />
1<br />
4<br />
1<br />
4<br />
1<br />
4<br />
4<br />
5<br />
4<br />
5<br />
4<br />
5<br />
Tay<br />
North East 1 1 2 3 5 5 5 10<br />
South Esk<br />
North Esk <strong>and</strong> Bervie<br />
1 1 2 3 5 5 5 10<br />
Dee (Aberdeenshire)<br />
Don<br />
Ythan<br />
Ugie<br />
Moray Firth 1 1 1 2 3 3 3 6<br />
Deveron 1 1 1 3 3 3<br />
Spey<br />
Lossie<br />
Findhorn<br />
Nairn<br />
Ness<br />
Beauly<br />
Conon <strong>and</strong> Alness 1 1 3 3<br />
North 5 5 4 9 24 24 10 34<br />
Kyle of Sutherl<strong>and</strong><br />
Fleet <strong>and</strong> Brora<br />
Helmsdale<br />
Berriedale to Wick<br />
Thurso <strong>and</strong> Forss<br />
Halladale <strong>and</strong> Strathy 5 5 4 9 24 24 10 34<br />
Naver <strong>and</strong> Kinloch<br />
Hope <strong>and</strong> Grudie<br />
North West<br />
Inchard to Kirkaig<br />
36<br />
1<br />
36<br />
1<br />
48<br />
1<br />
84<br />
2<br />
98<br />
4<br />
98<br />
4<br />
74<br />
2<br />
173<br />
5<br />
Kennart to Gruinard 11 11 2 13 24 24 5 28<br />
Ewe 3 3 3 11 11 11<br />
Badachro to Applecross<br />
Kishorn <strong>and</strong> Carron 10 10 8 18 27 27 19 46<br />
Loch Long <strong>and</strong> Croe 10 10 36 46 30 30 49 79<br />
Glenelg to Kilchoan<br />
Morar to Shiel 1 1 0 0<br />
Skye <strong>and</strong> Small Isles 1 1 1 2 2 2<br />
West Coast 3 90 93 58 151 17 468 485 140 624<br />
Sunart <strong>and</strong> Aline 4 4 6 6<br />
S<strong>and</strong>a to Creran<br />
Awe <strong>and</strong> Nell<br />
3 78<br />
1<br />
81<br />
1<br />
45 126<br />
1<br />
17 430<br />
3<br />
447<br />
3<br />
116 563<br />
3<br />
Add <strong>and</strong> Ormsary 10 10 8 18 32 32 16 48<br />
Isl<strong>and</strong> of Mull 1 1 2 2<br />
Islay <strong>and</strong> Jura 1 1 1 3 3 3<br />
Clyde Coast 110 110 119 229 488 488 266 754<br />
Carradale <strong>and</strong> Iorsa<br />
Fyne 100 100 100 200 454 454 227 680<br />
Ruel <strong>and</strong> Drummachloy<br />
Echaig 1 1 3 3<br />
Clyde<br />
Irvine 9 9 9 28 28 28<br />
Ayr 1 1 2 2<br />
Doon<br />
Girvan<br />
16 16 33 33<br />
Stinchar 1 1 1 2 6 6 2 8<br />
Solway<br />
Luce<br />
14 14 76 90 52 52 136 188<br />
Bladenoch<br />
Cree <strong>and</strong> Fleet 8 8 18 26 20 20 33 53<br />
Dee (Kirkcudbright)<br />
Urr<br />
Nith 1 1<br />
2<br />
10<br />
2<br />
11 4 4<br />
6<br />
16<br />
6<br />
19<br />
Annan 5 5 46 51 28 28 82 110<br />
Orkney<br />
Shetl<strong>and</strong><br />
Outer Hebrides 29 29 33 33<br />
Isle of Lewis<br />
Harris<br />
29 29 33 33<br />
The Uists<br />
All Scotl<strong>and</strong> 3 262 265 337 602 17 1146 1163 667 1830<br />
24
Table 6 :<br />
Number of questionnaires sent to proprietors <strong>and</strong> occupiers of salmon fisheries in <strong>2001</strong> <strong>and</strong> the<br />
number of returns received.<br />
Statistical District No. of Forms Sent Returns Received<br />
Tweed 148 147<br />
Forth 96 92<br />
Tay 243 235<br />
South Esk 37 37<br />
North Esk <strong>and</strong> Bervie 41 41<br />
Dee (Aberdeen) 64 62<br />
Don 72 66<br />
Ythan 23 20<br />
Ugie 14 14<br />
Deveron 58 58<br />
Spey 70 68<br />
Lossie 6 5<br />
Findhorn 28 22<br />
Nairn 34 31<br />
Ness 42 40<br />
Beauly 19 19<br />
Conon <strong>and</strong> Alness 44 42<br />
Kyle of Sutherl<strong>and</strong> 36 36<br />
Fleet <strong>and</strong> Brora 5 5<br />
Helmsdale 1 1<br />
Berriedale to Wick 9 9<br />
Thurso <strong>and</strong> Forss 11 11<br />
Halladale <strong>and</strong> Strathy 4 4<br />
Naver <strong>and</strong> Kinloch 11 11<br />
Hope <strong>and</strong> Grudie 11 9<br />
Inchard to Kirkaig 24 23<br />
Kennart to Gruinard 17 16<br />
Ewe 7 7<br />
Badachro to Applecross 7 7<br />
Kishorn <strong>and</strong> Carron 9 8<br />
Loch Long <strong>and</strong> Croe 10 10<br />
Glenelg to Kilchoan 8 8<br />
Morar to Shiel 31 29<br />
Skye <strong>and</strong> Small Isles 29 28<br />
Sunart <strong>and</strong> Aline 9 9<br />
S<strong>and</strong>a to Creran 38 38<br />
Awe <strong>and</strong> Nell 52 50<br />
Add <strong>and</strong> Ormsary 31 31<br />
Isl<strong>and</strong> of Mull 38 37<br />
Islay <strong>and</strong> Jura 11 11<br />
Carradale <strong>and</strong> Iorsa 18 16<br />
Fyne 26 25<br />
Ruel <strong>and</strong> Drummachloy 16 13<br />
Eachaig 20 19<br />
Clyde 25 24<br />
Irvine 11 11<br />
Ayr 41 39<br />
Doon 29 29<br />
Girvan 29 27<br />
Stinchar 30 28<br />
Luce 5 5<br />
Bladenoch 20 20<br />
Cree <strong>and</strong> Fleet 29 27<br />
Dee (Kirkcudbright) 27 26<br />
Urr 27 27<br />
Nith 38 37<br />
Annan 41 38<br />
Isle of Lewis 14 14<br />
Harris 11 10<br />
The Uists 5 3<br />
Orkney 1 1<br />
Shetl<strong>and</strong> 3 3<br />
Totals 1914 1839<br />
25
<strong>Salmon</strong> Fisheries — Statistical Regions<br />
<strong>and</strong> districts<br />
ORKNEY<br />
61<br />
Region Boundary<br />
District Boundary<br />
OUTER<br />
HEBRIDES<br />
60<br />
59<br />
58<br />
34<br />
26<br />
27<br />
N O R T H<br />
W E S T<br />
29<br />
28<br />
32<br />
33<br />
30<br />
31<br />
16<br />
25<br />
24<br />
N O R T H<br />
19<br />
18<br />
17<br />
23<br />
20<br />
13<br />
22<br />
21<br />
M O R A Y F I R T H<br />
15<br />
36<br />
14<br />
12<br />
11<br />
10<br />
N O R T H<br />
E A S T<br />
5<br />
7<br />
SHETLAND<br />
62<br />
6<br />
8<br />
9<br />
35<br />
W E S T<br />
3<br />
4<br />
39<br />
37<br />
EAST<br />
42<br />
2<br />
40<br />
43<br />
44<br />
38<br />
41<br />
45<br />
C L Y D E<br />
C O A S T<br />
46<br />
47<br />
1<br />
49<br />
48<br />
56<br />
50<br />
51 52<br />
53<br />
S O L W A Y<br />
54 55<br />
57<br />
0 10 20 30 40 50Miles<br />
0 10 20 30 40 50 60 70 80Kilometres<br />
26
Names of the salmon fishery statistical<br />
Districts<br />
Except in the case of the isl<strong>and</strong> groups, the names are taken from the names of the<br />
constituent administrative districts as given in Schedule A to the <strong>Salmon</strong> Fisheries<br />
(Scotl<strong>and</strong>) Act 1868. Where more than one such district is included in a single statistical<br />
district this is indicated by the word "<strong>and</strong>" implying two districts or "to" which implies<br />
more than two districts <strong>and</strong> includes all the coast between the two districts named.<br />
1. Tweed<br />
2. Forth<br />
3. Tay<br />
4. South Esk<br />
5. North Esk <strong>and</strong> Bervie<br />
6. Dee (Aberdeen)<br />
7. Don<br />
8. Ythan<br />
9. Ugie<br />
10. Deveron<br />
11. Spey<br />
12. Lossie<br />
13. Findhorn<br />
14. Nairn<br />
15. Ness<br />
16. Beauly<br />
17. Conon <strong>and</strong> Alness<br />
18. Kyle of Sutherl<strong>and</strong><br />
19. Fleet <strong>and</strong> Brora<br />
20. Helmsdale<br />
21. Berriedale to Wick<br />
22. Thurso <strong>and</strong> Forss<br />
23. Halladale <strong>and</strong> Strathy<br />
24. Naver <strong>and</strong> Kinloch<br />
25. Hope <strong>and</strong> Grudie<br />
26. Inchard to Kirkaig<br />
27. Kennart to Gruinard<br />
28. Ewe<br />
29. Badachro to Applecross<br />
30. Kishorn <strong>and</strong> Carron<br />
31. Loch Long <strong>and</strong> Croe<br />
32. Glenelg to Kilchoan<br />
33. Morar to Shiel<br />
34. Skye <strong>and</strong> Small Isles<br />
35. Sunart <strong>and</strong> Aline<br />
36. S<strong>and</strong>a to Creran<br />
37. Awe <strong>and</strong> Nell<br />
38. Add <strong>and</strong> Ormsary<br />
39. Isl<strong>and</strong> of Mull<br />
40. Islay <strong>and</strong> Jura<br />
41. Carradale <strong>and</strong> Iorsa<br />
42. Fyne<br />
43. Ruel <strong>and</strong> Drummachloy<br />
44. Eachaig<br />
45. Clyde<br />
46. Irvine<br />
47. Ayr<br />
48. Doon<br />
49. Girvan<br />
50. Stinchar<br />
51. Luce<br />
52. Bladenoch<br />
53. Cree <strong>and</strong> Fleet<br />
54. Dee (Kirkcudbright)<br />
55. Urr<br />
56. Nith<br />
57. Annan<br />
58. Isle of Lewis<br />
59. Harris<br />
60. The Uists<br />
61. Orkney<br />
62. Shetl<strong>and</strong><br />
27
Fisheries Research Services is an agency of the <strong>Scottish</strong> Executive<br />
FRS Freshwater Laboratory Field Station 16 River Street Montrose Angus DD10 8DL UK<br />
tel +44 (0)1674 677070 fax +44 (0)1674 672604<br />
enquiries@marlab.ac.uk http://www.marlab.ac.uk<br />
Any queries about this Bulletin should be made to the address above.<br />
Additional copies of this Bulletin may be obtained from:<br />
The Stationery Office Bookshop<br />
71 Lothian Road<br />
Edinburgh<br />
EH3 9AZ<br />
Tel: 0870 606 5566<br />
Fax: 0870 606 5588<br />
ISSN 0264-116X<br />
ISBN 0 9532838 7 9


