MAKING SOLID SOLUTIONS WITH ALKALI ... - Smith College
MAKING SOLID SOLUTIONS WITH ALKALI ... - Smith College
MAKING SOLID SOLUTIONS WITH ALKALI ... - Smith College

You also want an ePaper? Increase the reach of your titles
YUMPU automatically turns print PDFs into web optimized ePapers that Google loves.
temperature should be hot enough to melt any sample except pure NaCl, which melts at 801°C.<br />
(You can put a sample of pure NaCl in the oven if you want to check the temperature. If the<br />
sample is dry and any melting occurs, the sample and oven have reached temperatures of<br />
801°C or higher. In fact, melting points of pure substances like NaCl are so consistent that<br />
they are used to calibrate thermocouples and other high temperature thermometers.)<br />
• When your sample has melted (5-10 minutes), carefully remove the crucible (it's now at<br />
800°C!) from the oven with the tongs and gloves. Set the crucible on a heat-resistant surface<br />
and let it cool. Initially, the NaCl-KCl mixture should be molten. However, it will crystallize<br />
in a few seconds, cooling rapidly because the sample is small – much more rapidly than most<br />
igneous rocks. Crystallization is very fast in this system and the crystals will have grown from<br />
the melt at high temperatures (probably above 600°C). The sample and crucible will contract<br />
upon cooling, making cracking sounds.<br />
• Be sure to wear eye protection if you want to watch the crystals grow.<br />
• After the crucible has cooled, the alkali halide crystals can be easily removed as a disc from the<br />
crucible with a spatula.<br />
X-RAY DIFFRACTION<br />
The easiest way to examine the crystals you have grown is with powder x-ray diffraction – if<br />
you have an x-ray diffractometer. The ionic radius of potassium (0.138 nm) is considerably<br />
larger than the ionic radius of sodium (0.102 nm), if both are in six coordination with chlorine.<br />
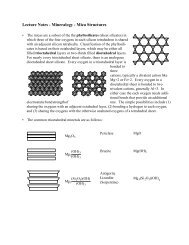
Halite (NaCl) and sylvite (KCl) have the same crystal structure (they are isostructural) based on<br />
a cubic closest packing of large Cl -1 anions (radius = 0.181 nm) with the smaller cations (Na +1 or<br />
K +1 ) filling all the six-coordinated (octahedral) sites. In sylvite the chlorine atoms are farther<br />
apart, to accommodate the larger K +1 ions, than they are in halite with its smaller Na +1 ions.<br />
Thus, the d-spacing of each lattice plane (hkl) in sylvite is larger than the d-spacing of the same<br />
plane (hkl) in halite. If a crystal has a composition intermediate between that of NaCl and KCl,<br />
the d-spacing for any plane (hkl) should be intermediate between that of the same plane (hkl) in<br />
halite and sylvite. If the solid solution is ideal, then there is no V of mixing and a graph of the<br />
d-spacing vs. molar composition should be a straight line.<br />
• The crystals you have grown are surprisingly unstable at room temperature. Therefore, the<br />
best diffraction patterns are obtained by mounting the (Na,K)Cl disc directly in the<br />
diffractometer without grinding. Alternatively, crush the sample lightly in a mortar. Grind as<br />
little as possible! Excessive grinding will cause the solid solution to unmix, leading to separate<br />
halite and sylvite crystals.<br />
• Because of the high symmetry of halite, very few planes (hkl) give strong diffraction peaks.<br />
To speed the analysis, scan a small range of diffraction angles (2) from 27° to 33°. This<br />
range of 2 should include the (200) peak for your samples. Remembering Bragg's Law (n =<br />
2 d sin ), which mineral, halite or sylvite, would you expect to have the larger 2 value for<br />
each peak?<br />
• A scan rate of 1°2 per minute is normally sufficient. Slower or faster scan rates may give you<br />
more or less accurate peak positions, respectively.<br />
DATA ANALYSIS<br />
• Measure or look up the position of the (200) peak on diffraction patterns for pure halite and<br />
pure sylvite.<br />
• Draw a graph with d-values on the y-axis and molar composition (from NaCl to KCl) on the x-<br />
axis.<br />
• Plot d (200) for each sample at the appropriate composition on this graph.<br />
• Connect the data points for pure halite and pure sylvite with a straight line. Do the data points<br />
for the other samples fall on the line? If not, are they distributed randomly about the line or do<br />
they fall systematically above or below the line? Do these data demonstrate that you have<br />
grown crystals of composition between NaCl and KCl?<br />
2