Waitakere City Transport Strategy - Full Document - Auckland ...
Waitakere City Transport Strategy - Full Document - Auckland ...
Waitakere City Transport Strategy - Full Document - Auckland ...

Create successful ePaper yourself
Turn your PDF publications into a flip-book with our unique Google optimized e-Paper software.
ISBN - 10: 473-11411-9<br />
ISBN - 13: 978-0-473-11411-4
Contents<br />
Mayor’s Message <strong>Waitakere</strong>: Way to go 3<br />
Overview 5<br />
PAGE<br />
SECTION 1: Introduction - Purpose and Context 7<br />
SECTION 2: Key Issues and Trends; Current Infrastructure and Services 9<br />
SECTION 3: Vision, Objectives, Desired Outcomes 13<br />
SECTION 4: Foundations of the <strong>Strategy</strong>, Strategic Direction 15<br />
SECTION 5: Policies and <strong>Transport</strong> Programme 17<br />
SECTION 6: Role of <strong>Transport</strong> Modes and <strong>Transport</strong> Corridors 21<br />
SECTION 7: Monitoring and Review 27<br />
SECTION 8: Conclusion 29<br />
APPENDIX 1: Budgeted <strong>Transport</strong> Programme 2006-2016 31<br />
Map 1: Passenger <strong>Transport</strong> Projects Budgeted 2006-2016 39<br />
Map 2: Roading <strong>Transport</strong> Projects Budgeted 2006-2016 40<br />
Map 3: Cycleway Projects Budgeted 2006-2016 41<br />
Map 4: Henderson <strong>Transport</strong> Projects Budgeted 2006-2016 42<br />
Map 5: New Lynn <strong>Transport</strong> Projects Budgeted 2006-2016 43<br />
Map 6: Westgate <strong>Transport</strong> Projects Budgeted 2006-2016 44<br />
APPENDIX 2: Background to Strategic Options 45<br />
APPENDIX 3: <strong>Auckland</strong> Regional <strong>Transport</strong> <strong>Strategy</strong> 2005 - Policies 49<br />
APPENDIX 4: Supporting and Technical Papers 59<br />
1
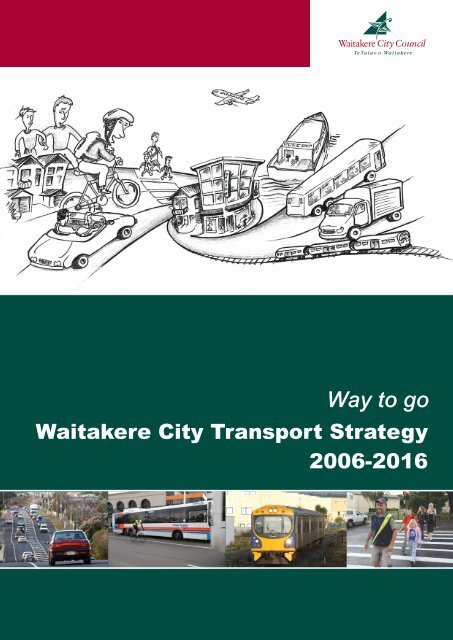
<strong>Waitakere</strong>: Way to go<br />
The rising price of petrol is changing the way we live. Every<br />
household will query if there are better ways to get around,<br />
if they can be more mobile, but spend less time in traffic<br />
jams, and less money on travel.<br />
Your <strong>City</strong> Council is facing the same queries, the same<br />
financial questions of affordability. We have resolved to<br />
change direction in our investment and management of<br />
transport. This strategy outlines those changes. It adds up<br />
to more choices for you.<br />
Firstly, we’re developing our town centres at New Lynn,<br />
Henderson and Westgate. These will be more than shopping<br />
centres; they will be ‘down-town’ places with jobs, high<br />
rise residential development, and economic activity. They<br />
will be attractive places to establish new businesses, new<br />
residences, and new places to work, shop and play.<br />
Secondly, we will make these town centres easily<br />
accessible by foot, bike or passenger transport, so that you<br />
can leave the car at home. And the town centres will have<br />
frequent services to other destinations. Consider a rapid,<br />
comfortable, reliable train service to and from New Lynn or<br />
Henderson every ten minutes. Consider more than 10,000<br />
jobs in Henderson, 10,000 in New Lynn, and exciting new<br />
developments at Westgate and Hobsonville Village. You<br />
won’t have to leave the city to work!<br />
New passenger services will take you to the city centre<br />
nodes and across the city and if you need to go further<br />
east there will be improvements to those routes as well.<br />
Within five years we will see a motorway connect Westgate<br />
to the North Shore; we will see the rail line double–tracked<br />
as far as Swanson with efficient, comfortable trains, much<br />
upgraded stations and safer park and ride facilities.<br />
Road congestion will not be easily defeated, but we will<br />
invest in road improvements that will allow buses and high<br />
occupancy vehicles to get through – to sidestep the traffic<br />
queues.<br />
Mayor Bob Harvey and Deputy Mayor Carolynne<br />
Stone, Henderson Interchange - <strong>Waitakere</strong> Central.<br />
We will look to give priority to goods vehicles too, to keep<br />
our centres as attractive, efficient and productive places to<br />
locate businesses and attract jobs.<br />
3
WAITAKERE: WAY TO GO<br />
We want to make it safer and easy for children to get to<br />
school by walking, cycling or passenger transport, so we<br />
support school travel plans. This is critical because 40% of<br />
peak hour trips are journeys to education. Carefully located<br />
new schools, the expansion of Unitec in <strong>Waitakere</strong>, and<br />
school travel plans will all assist families in making a choice<br />
other than using the car to get to school.<br />
Our annual investment in transport will double over the<br />
next decade. It’s not just more of the same. It’s a new “way<br />
to go”.<br />
- students going to school more safely by walking school<br />
buses, cycling and passenger transport;<br />
- living and working locally;<br />
- using passenger transport or car pooling to get to<br />
work;<br />
- vibrant town centres which are a focus for retail,<br />
business and activity;<br />
- addressing congestion points and completing the State<br />
Highway network;<br />
- upgrading footpaths and providing new cycle ways.<br />
This provides more choice that will make getting about the<br />
city work for you. Please think about your travel choices and<br />
how together we can improve the productivity, liveability,<br />
and resilience of <strong>Waitakere</strong> <strong>City</strong>.<br />
Bob Harvey<br />
MAYOR, WAITAKERE CITY<br />
<strong>Waitakere</strong> Central<br />
4
Overview<br />
This document sets out <strong>Waitakere</strong> <strong>City</strong> Council’s strategic<br />
position and plans to develop a sustainable and integrated<br />
transport system for the city over the period 2006 to 2016.<br />
The vision for transport in <strong>Waitakere</strong> is:<br />
‘A sustainable multi-modal transport system that is<br />
integrated with land use and contributes to <strong>Waitakere</strong> as<br />
an eco city.’<br />
This vision supports a change from single-occupancy<br />
vehicle use to more sustainable modes of travel. That shift<br />
is necessary to enhance the quality of life in our city, to<br />
create dynamic town centres and liveable communities, and<br />
to protect the natural environment. To cope with expected<br />
growth, without a corresponding increase in vehicles on<br />
the road, <strong>Waitakere</strong> needs to make the transition to a more<br />
compact city which maximises the benefits of the rail line<br />
and its three main town centres.<br />
Strategic Direction<br />
The strategy to achieve the city’s transport vision and<br />
objectives is to reduce congestion in parts of the network<br />
and to encourage people to walk, cycle, use passenger<br />
transport and car pool. The flow of goods and people<br />
is vital to the economy and the functioning of the city.<br />
Sustainable solutions are required in order to achieve the<br />
city and lifestyle that people want. The strategy aims to<br />
provide benefits both in the short and long term.<br />
This strategic direction is a balanced approach to investment<br />
in roads, passenger transport, walking and cycling, and<br />
travel demand management. The strategic direction is<br />
closely aligned with the <strong>Auckland</strong> Regional Land <strong>Transport</strong><br />
<strong>Strategy</strong> 2005. Therefore, <strong>Waitakere</strong>’s transport programme<br />
has a greater likelihood of receiving funding from Land<br />
<strong>Transport</strong> New Zealand.<br />
Aims<br />
The <strong>Waitakere</strong> <strong>City</strong> <strong>Transport</strong> <strong>Strategy</strong> aims to develop a<br />
sustainable integrated transport system that:<br />
• Contributes to <strong>Waitakere</strong> as an eco city;<br />
• Provides attractive alternatives to the motor vehicle;<br />
• Integrates land use and transport;<br />
• Supports the development of the town centres and<br />
economic growth;<br />
• Manages traffic and congestion.<br />
Walking school bus, Woodlands Park Primary<br />
5
OVERVIEW<br />
The strategic direction requires the transport programme<br />
for <strong>Waitakere</strong> to focus on the following:<br />
• Commitment to the essentials – safety, maintenance of<br />
existing transport assets, existing commitments, and<br />
operation of traffic systems.<br />
• A balance of investment in roads, footpaths, passenger<br />
transport infrastructure, walking and cycling initiatives,<br />
and travel demand management measures.<br />
• A commitment to integration between different modes of<br />
transport, with rail providing the backbone of passenger<br />
transport in <strong>Waitakere</strong>.<br />
• Planning for integration of transport and land use. This<br />
requires growth to be in the right places, with good<br />
urban design and appropriate roads, footpaths, cycle<br />
ways, access to passenger transport and/or the state<br />
highway network.<br />
• Ensuring that the implementation of transport projects<br />
is smart, cost effective and well planned so that they<br />
directly contribute to the type of city that people want<br />
to live and do business in.<br />
<strong>Transport</strong> Programme<br />
A costed 10-year transport programme proposes how<br />
the Council will implement the strategy. The transport<br />
programme emphasises passenger transport and<br />
investment in the three main town centres and the northwest<br />
growth area.<br />
Key features of the programme are:<br />
• Passenger transport improvements;<br />
• Bus priority measures on state highways and key arterial<br />
roads;<br />
• Cycle ways and footpath improvements;<br />
• Travel demand measures.<br />
Conclusion<br />
This strategy is an affordable and sustainable approach that<br />
aims to get the best out of the existing roading network and<br />
encourage greater use of sustainable alternatives – regular<br />
walking and cycling, passenger transport, fuel-efficient<br />
vehicles, ride sharing, shorter trips, fewer trips, travelling<br />
outside peak hours and working from home.<br />
Bus advance lane, Westgate<br />
Cycleway, North Western Motorway<br />
6
Section 1: Introduction -<br />
Purpose and Context<br />
Purpose of this document<br />
This document sets out <strong>Waitakere</strong> <strong>City</strong> Council’s strategic<br />
position and plans to develop a sustainable and integrated<br />
transport system for the city over the period 2006 to 2016.<br />
This strategy provides direction and policy guidance to<br />
assist the Council and other transport organisations in<br />
decisions regarding transport projects.<br />
The strategy will be reviewed every three years to align<br />
with the review of the Long Term Council Community Plan<br />
(LTCCP) and regional plans.<br />
Context<br />
<strong>Waitakere</strong> is making the transition to a more sustainable<br />
urban form which maximises the benefits of the rail line<br />
and the three main town centres. A shift away from singleoccupancy<br />
vehicle travel to more sustainable modes of<br />
travel is needed for a higher quality of life, better functioning<br />
town centres, liveable communities and to protect our<br />
natural environment. This strategy is based on the <strong>Auckland</strong><br />
Regional Land <strong>Transport</strong> <strong>Strategy</strong> 2005 and incorporates<br />
<strong>Waitakere</strong> <strong>City</strong> Council policies and objectives. This<br />
strategy includes a costed 10-year transport programme<br />
which proposes how the Council will deliver the strategy.<br />
<strong>Waitakere</strong>’s population is growing by about 1.7% each year<br />
and the volume of traffic is increasing by about 3% each<br />
year. This is not sustainable in terms of the economy, the<br />
natural environment and the effects on communities.<br />
Our dependence on the motor vehicle has brought about<br />
significant health and environmental problems. The<br />
negative impacts of transport include noise, air pollution<br />
and greenhouse gases, contaminated water run-off and<br />
transport-related wastes. The Council’s role is to reduce<br />
these negative impacts in a manner that reflects and<br />
delivers on the community outcomes for <strong>Waitakere</strong>. This is<br />
particularly significant in the context of increasing demand<br />
for energy and dwindling worldwide supplies of fossil<br />
fuels.<br />
<strong>Waitakere</strong> has been characterised by low-density<br />
development with some concentration along the rail line.<br />
The city’s urban strategy envisages intensified urban<br />
development particularly in and around the three town<br />
centres of New Lynn, Henderson and Westgate, and also<br />
along other major transport corridors such as Lincoln<br />
Road.<br />
Buses on Great North Road, Henderson<br />
The <strong>Auckland</strong> Regional Growth <strong>Strategy</strong>, 1999, adopted<br />
by all councils in the region, requires such an approach<br />
to growth. The Regional Growth <strong>Strategy</strong> defined a<br />
metropolitan urban limit for the region to constrain the<br />
urban sprawl and set targets for concentration of growth in<br />
growth nodes (the three main town centres) over the next 50<br />
years. The Local Government (<strong>Auckland</strong>) Amendment Act<br />
7
SECTION 1: Introduction - Purpose And Context<br />
2004 requires that regional and city resource management<br />
plans incorporate the growth concepts of the Regional<br />
Growth <strong>Strategy</strong>.<br />
The basic premise of this strategy is that compact cities<br />
are more sustainable because they make more efficient use<br />
of land, transport and infrastructure. Living in a compact<br />
city enables communities to access employment, social<br />
and recreational opportunities with less travel. Compact<br />
cities also support the development and improvement of<br />
passenger transport systems which results in less reliance<br />
on private cars. This in turn contributes to reduced air<br />
emissions and less vehicle pollutants. Compact cities result<br />
in less pressure for sprawl and reduce the need for people<br />
to travel long distances.<br />
The <strong>Auckland</strong> Regional Land <strong>Transport</strong> <strong>Strategy</strong> 2005<br />
sets the direction and funding priorities for transport in<br />
the <strong>Auckland</strong> region. This requires a balance of funding for<br />
state highways, roads, passenger transport, travel demand<br />
management, walking and cycling.<br />
In order to manage growth, significant improvements are<br />
needed in transport infrastructure, integration of transport<br />
with land use and travel demand management. We also<br />
need a significant shift to more sustainable modes of travel.<br />
<strong>Waitakere</strong> is in the process of catching up on investment in<br />
state highways, passenger transport and cycle ways. This<br />
will provide some ability to deal with existing demand and<br />
some future demand. Increased central government funding<br />
is available where there is a matched local contribution<br />
(except for state highways and rail lines, which are 100%<br />
funded by central government).<br />
Key legislation and national and regional strategies<br />
provide a policy and strategic framework against which<br />
Residential development adjacent rail, New Lynn<br />
Cyclist taking bike onto train, Ranui Rail Station<br />
<strong>Waitakere</strong> <strong>City</strong> Council can prepare its transport strategy<br />
programme.<br />
The Land <strong>Transport</strong> Management Act 2003 and the Local<br />
Government (<strong>Auckland</strong>) Amendment Act 2004 have<br />
significantly altered the planning, governance and funding<br />
of transport. New Zealand’s vision for transport is an<br />
affordable, integrated, safe, responsive and sustainable<br />
transport system. The government’s transport objectives<br />
guide Land <strong>Transport</strong> New Zealand’s funding decisions in<br />
relation to transport projects.<br />
New Zealand’s five transport objectives are:<br />
• Assist economic development;<br />
• Assist safety and personal security;<br />
• Improve access and mobility;<br />
• Protect and promote public health;<br />
• Ensure environmental sustainability.<br />
The goal of the <strong>Auckland</strong> Regional Land <strong>Transport</strong> <strong>Strategy</strong><br />
2005 is a transport system which enhances the <strong>Auckland</strong><br />
region as a great place to live, work and play. The objectives<br />
of the <strong>Auckland</strong> Regional Land <strong>Transport</strong> <strong>Strategy</strong> 2005 are<br />
the New Zealand transport objectives plus the objectives of<br />
‘Supporting the <strong>Auckland</strong> Regional Growth <strong>Strategy</strong>’ and<br />
‘Achieving economic efficiency’.<br />
The <strong>Auckland</strong> Regional Land <strong>Transport</strong> <strong>Strategy</strong> 2005<br />
provides for a high investment in passenger transport,<br />
a medium investment in travel demand management<br />
(including walking and cycling) and significant investment<br />
in completing the state highway network and roading<br />
improvements. The <strong>Auckland</strong> Regional <strong>Transport</strong> Authority<br />
(ARTA) is required to prioritise the transport programme<br />
submitted by <strong>Waitakere</strong> <strong>City</strong> Council for funding and is<br />
guided by national and regional requirements.<br />
8
Section 2: Key Issues and Trends;<br />
Current Infrastructure and Services<br />
Setting the scene in <strong>Waitakere</strong><br />
<strong>Waitakere</strong> is a diverse city ranging from urbanised centres<br />
in the east to the sparsely populated and protected<br />
environment of the <strong>Waitakere</strong> Ranges and West Coast<br />
beaches. <strong>Waitakere</strong> may be characterised as young, fastgrowing<br />
and ethnically diverse. It is the fifth largest city in<br />
New Zealand, similar to Wellington <strong>City</strong> in population.<br />
Key transport issues and trends<br />
Growth<br />
The population of <strong>Waitakere</strong> as at March 2006 was 186,444,<br />
forecast to grow to around 235,000 people by the year 2016<br />
(high growth scenario). To meet this growth the transport<br />
system needs to provide for around 4,000 more residents in<br />
<strong>Waitakere</strong> annually. In order to cater for forecast population<br />
growth and to bolster local employment, provision for<br />
approximately 2,000 more employees in <strong>Waitakere</strong> will<br />
need to be made each year. The existing transport system<br />
is inadequate to meet current and future demands.<br />
The cost of improvements to the transport system<br />
The costs of improving the transport system in <strong>Waitakere</strong><br />
are borne by users, developers, regional and central<br />
government and by ratepayers. Therefore, improvements<br />
have to be affordable and effective.<br />
Location of employment<br />
<strong>Waitakere</strong> accounts for approximately 15% of <strong>Auckland</strong>’s<br />
total population, but the city only generates around 8% of<br />
the region’s income and jobs. Approximately 56% of our<br />
workforce travels outside <strong>Waitakere</strong> to work. As a result,<br />
average trip lengths for <strong>Waitakere</strong> residents are very high.<br />
About 25% of local jobs are filled by people who commute<br />
into <strong>Waitakere</strong> from other parts of the region. The transport<br />
system needs to support local jobs as well as provide for<br />
access to jobs outside of the city.<br />
Hobsonville Road<br />
Dependence on the motor vehicle<br />
Travel by motor vehicle is growing faster than the rate of<br />
increase in population growth. Low car-occupancy rates<br />
– an average of 1.2 persons per vehicle at peak times –<br />
exacerbates the problem of too much traffic on the roading<br />
network.<br />
In 2001, 74% of <strong>Waitakere</strong> residents travelled to work in a<br />
motor vehicle. This was the second highest figure recorded<br />
for all the major New Zealand cities. In 2001, only 4% of<br />
<strong>Waitakere</strong>’s workforce travelled to work by bus, 2% walked,<br />
1% travelled by train, 1% by bicycle, 6% worked from home<br />
and around 11% did not work on census day (figure 3.2).<br />
Car ownership per person in the <strong>Auckland</strong> region is<br />
increasing rather than decreasing as indicated in figure<br />
3.1. Subject to the effects of increases in oil prices and the<br />
9
SECTION 2: Key Issues and Trends, Current Infrastructure and Services<br />
introduction of road pricing, it is projected<br />
that, by 2016, 11% of trips at peak times<br />
in the <strong>Auckland</strong> region will be by passenger<br />
transport, up from 7% in 2001.<br />
Figure 3.1: Car Ownership (1981 - 2021)<br />
Source: <strong>Auckland</strong> Regional Council (ART model), Statistics New Zealand.<br />
Traffic congestion<br />
The build-up of traffic, particularly on key<br />
arterials and on the motorway in the peak<br />
periods, results in travel delays, greater costs<br />
for business (estimated at one billion dollars<br />
a year for the <strong>Auckland</strong> region), negative<br />
impacts on the natural environment, and<br />
extra time away from family or the household.<br />
The most heavily trafficked arterial roads in<br />
<strong>Waitakere</strong> are sections of Te Atatu Road,<br />
Lincoln Road and Great North Road, which<br />
carry approximately 47,000, 45,000 and<br />
32,000 vehicles per day respectively. The<br />
North Western Motorway (State Highway<br />
16) between Te Atatu Road and Patiki Road<br />
now carries approximately 95,000 vehicles<br />
per day.<br />
Figure 3.2: Means of travel to work, <strong>Waitakere</strong> Residents<br />
Source: Statistics New Zealand.<br />
Lack of walking and<br />
cycling for short trips<br />
Approximately 18% of all trips in the<br />
<strong>Auckland</strong> region are less than two kilometres<br />
during the morning peak: 64% of those<br />
are by car and many of these are to drop<br />
children off at school. Figures 3.3 and 3.4<br />
indicate the length of trips and the mode<br />
taken for these trips in the morning peak.<br />
Figure 3.3: Trip lengths by mode (2001 morning peak period. 07:00 - 09:00)<br />
Source: <strong>Auckland</strong> Regional Council (ART model)<br />
10
SECTION 2: Key Issues and Trends, Current Infrastructure and Services<br />
Figure 3.4: Trip lengths by purpose (2001 morning peak period. 07:00 - 09:00)<br />
Source: <strong>Auckland</strong> Regional Council (ART model)<br />
Movement of goods and services<br />
It is vital that the transport system enables efficient<br />
movement of goods and services in a growing local<br />
economy. The transport system needs to allow for more<br />
local business activity in the future and better access to<br />
new motorways. Subject to the effects of increases in oil<br />
prices and the introduction of congestion charges, by 2016<br />
it is projected that travel speeds between key business<br />
centres in the <strong>Auckland</strong> region will decrease by 5.6%.<br />
Access and social isolation<br />
Around 92% of <strong>Waitakere</strong> households have access to a car.<br />
However, around 25% of households do not have access to<br />
a car during the day; they may not own a car, or it is being<br />
used by a family member to commute. These households<br />
rely on taxis, walking, cycling and passenger transport<br />
to move about the city. Travel choice is limited in some<br />
parts of <strong>Waitakere</strong>, including the northwest and beyond<br />
the metropolitan area. The transport system is required to<br />
provide for a range of mobility needs.<br />
Low emission buses, Henderson town centre<br />
Allocation of road space<br />
A key issue for <strong>Waitakere</strong> <strong>City</strong> Council is the allocation,<br />
use and priority of the road reserve. Competing demands<br />
for use of road space include vehicle traffic, passenger<br />
transport, pedestrians, cyclists and car parking. There are<br />
also impacts from the type of land use next to arterial roads<br />
and roads in town centres.<br />
Need for improved integration of<br />
land use and transport<br />
The historically low-density in <strong>Waitakere</strong> has resulted in<br />
long distances to travel and inefficient passenger transport.<br />
Inefficient bus services are often the result of an inadequate<br />
road network including a lack of linkages. High growth and<br />
development is required in <strong>Waitakere</strong>’s three main town<br />
centres. This will support passenger transport and restrict<br />
low-density sprawl.<br />
The health and environmental effects<br />
of pollution from motor vehicles<br />
Pollution from motor vehicles severely reduces the quality<br />
of our air and water. There are approximately 250 deaths<br />
each year in the <strong>Auckland</strong> region due to air pollution from<br />
motor vehicles. Subject to the effects of increases in oil<br />
prices and the introduction of road pricing, it is projected<br />
that CO 2<br />
emissions in the <strong>Auckland</strong> region will increase by<br />
21% by 2016 and that discharges to water from transport<br />
will increase by 20%.<br />
Increasing oil prices<br />
Fuel use for transport in the <strong>Auckland</strong> region is expected<br />
to increase by 26% by 2016. There are significant risks<br />
regarding security of supply and increases in oil prices over<br />
the next 10 years.<br />
11
SECTION 2: Key Issues and Trends, Current Infrastructure and Services<br />
Safety<br />
There has been an increase in the number of crashes on<br />
<strong>Waitakere</strong> roads since 2000.<br />
Innovation and opportunities<br />
As an eco city, <strong>Waitakere</strong> <strong>City</strong> Council has been a leader in<br />
implementing and providing information on new technology.<br />
Current examples include solar-powered lighting and<br />
information on vehicle fuel efficiency. Future opportunities<br />
to support new technologies will arise over the period<br />
of this <strong>Transport</strong> <strong>Strategy</strong> and will be investigated and<br />
implemented as appropriate.<br />
Infrastructure and services at July 2006<br />
<strong>Waitakere</strong>’s transport infrastructure includes:<br />
• The Western Rail Corridor – Tracks, signals, platforms<br />
and pedestrian bridges are managed by ONTRACK.<br />
Infrastructure on the platforms is managed by ARTA.<br />
• State Highways and interchanges – managed by Transit<br />
New Zealand.<br />
• The local roading network – managed by <strong>Waitakere</strong> <strong>City</strong><br />
Council.<br />
• The pedestrian and cycling network – managed by<br />
<strong>Waitakere</strong> <strong>City</strong> Council.<br />
• Whenuapai airport – managed by the Ministry of<br />
Defence.<br />
• Water access to two harbours.<br />
Rail improvements have been the focus of <strong>Waitakere</strong> <strong>City</strong><br />
Council’s passenger transport advocacy over the past<br />
decade. The Western Rail Corridor links the main town<br />
centres of New Lynn, Glen Eden and Henderson (as well<br />
as Fruitvale, Sunnyvale, Sturges, Ranui, Swanson and<br />
<strong>Waitakere</strong> Village) with the <strong>Auckland</strong> central business<br />
district (CBD) and the remainder of the regional and national<br />
rail network.<br />
<strong>Waitakere</strong> <strong>City</strong> Council has a role in relation to bus and<br />
rail interchanges and upgrading the precincts around the<br />
stations, including the provision of park and ride and dropoff<br />
facilities. The Council also has a key role in promoting<br />
and enabling increased population and employment<br />
densities around rail nodes.<br />
The local road network is mostly complete, but:<br />
• is straining to cope with demand at peak times;<br />
• needs to be expanded for new growth areas;<br />
• has many cul-de-sacs and unconnected communities;<br />
• needs realignment in town centres.<br />
The Council has completed studies of road corridors<br />
throughout the city which indicate decreases in performance<br />
of the road network in the future if the roading network<br />
remains unchanged. Most new local roads have been built<br />
and funded as part of new subdivisions.<br />
<strong>Waitakere</strong>’s bus services are mainly focused on trips to and<br />
from the <strong>Auckland</strong> CBD with limited ability to interchange<br />
with rail or ferry services or other bus services. <strong>Waitakere</strong><br />
<strong>City</strong> Council’s focus is on delivering bus related infrastructure<br />
(bus stops, signs, timetable holders, shelters, lighting) and<br />
working with ARTA and providers to improve bus services,<br />
service quality and frequency.<br />
<strong>Waitakere</strong>’s rail services operate every 37 minutes during<br />
the day and more frequently at peak times. The double<br />
tracking of the western rail line and new signalling should<br />
result in trains every 10 minutes at peak times.<br />
People walking and cycling use the road and footpath<br />
network, walkways in parks and a limited length of<br />
dedicated walk and cycle ways. The <strong>Waitakere</strong> <strong>City</strong> Walking<br />
and Cycling <strong>Strategy</strong> was adopted in 2003.<br />
The Ministry of Defence has transferred the Hobsonville<br />
Airbase to the Housing Corporation of New Zealand which<br />
is undertaking a sustainable development which includes<br />
sustainable transport solutions.<br />
Whenuapai Airport is currently occupied by the Ministry of<br />
Defence and is expected to include commercial operations<br />
within the next ten years.<br />
The Manukau and Waitemata harbours provide sea access<br />
for ferries. Ferry services operate at West Harbour on the<br />
Waitemata Harbour to and from the <strong>Auckland</strong> CBD.<br />
The roading network is well developed, comprising<br />
motorways, urban arterials and other local roads. State<br />
Highway 18 Upper Harbour Corridor and the State Highway<br />
16 Brigham Creek Extension are expected to be completed<br />
over the next five years.<br />
12
Section 3: Vision, Objectives,<br />
Desired Outcomes<br />
Eco <strong>City</strong> – Outcomes and Priorities<br />
<strong>Waitakere</strong> <strong>City</strong> Council has a long-established over-arching<br />
vision of being an eco city – a city which celebrates its<br />
people, has a sustainable economic base, honours its<br />
environment and builds on culture and heritage.<br />
<strong>Waitakere</strong>’s Community Outcomes<br />
<strong>Transport</strong> is an important contributor to a number of<br />
Community Outcomes as identified by the people of<br />
<strong>Waitakere</strong>. In 2005 the community of <strong>Waitakere</strong> identified<br />
the following transport outcomes to be achieved:<br />
• Sustainable transport systems provide fast and effective<br />
movement of people, goods and services within, and in<br />
and out of, the city.<br />
• The transport network is integrated, innovative, safe<br />
and environmentally responsible and supports excellent<br />
lifestyles and quality urban and village design.<br />
• Passenger transport services are appealing, reduce car<br />
dependency and match local need.<br />
A number of other Community Outcomes also affect the<br />
function and nature of the transport system in <strong>Waitakere</strong>.<br />
These include a strong economy, strong communities and<br />
a sustainable environment.<br />
Vision for <strong>Transport</strong><br />
The Council’s vision for transport in <strong>Waitakere</strong> is:<br />
‘A sustainable multi-modal transport system that is<br />
integrated with land use and contributes to <strong>Waitakere</strong> as<br />
an eco city.’<br />
The concepts of this vision are:<br />
Sustainable – The transport system must serve existing<br />
and future generations, taking into account the economic,<br />
social, environmental and cultural effects. Our transport<br />
system must be resilient enough to cope with the future<br />
and change.<br />
The following transport priorities were also identified:<br />
• Sustainable transport systems that prioritise meeting<br />
high needs and demand.<br />
• Develop alternative options that reflect global trends.<br />
• Develop walking and cycling opportunities.<br />
• Ensure route planning involves public and community<br />
input and enables access to key places and services,<br />
e.g. health centres and hospitals, shops, civic and<br />
leisure centres, beaches, parks and schools.<br />
• Improve the quality, accessibility and amount of<br />
passenger transport to best practice internationally<br />
(including added services, e.g. wireless access).<br />
• Develop targeted travel planning initiatives, particularly<br />
for getting to school and work.<br />
Great North Road, Henderson<br />
13
SECTION 3: Vision, Objectives, Desired Outcomes<br />
Multi-modal – This means travel by motor vehicle, train,<br />
bus, ferry, bicycle and on foot. A good transport system<br />
is safe, affordable, efficient and provides easy interchange<br />
from one mode to another.<br />
Integrated with land use – This means higher density at<br />
transport centres and activity which supports an efficient<br />
and effective transport system. Well-designed transport<br />
infrastructure is functional and fits with the local surrounds.<br />
For example, a parking area could be used as a park and<br />
ride facility by day and for residential parking at night.<br />
Eco city – This means working together for better social,<br />
economic and environmental outcomes for our children, our<br />
grandchildren and ourselves. This requires a compact urban<br />
form which enables the town centres and transport system<br />
to operate effectively and protects the rural aspect and<br />
natural character of the foothills and <strong>Waitakere</strong> Ranges.<br />
The Objectives of the <strong>Waitakere</strong> <strong>City</strong><br />
<strong>Transport</strong> <strong>Strategy</strong><br />
The objectives of the strategy are to develop a sustainable,<br />
integrated transport system that:<br />
1. Enables <strong>Waitakere</strong> to achieve desired social, economic,<br />
environmental and cultural benefits for both current and<br />
future communities;<br />
2. Facilitates and promotes more sustainable travel<br />
modes;<br />
3. Supports implementation of the <strong>Auckland</strong> Regional Land<br />
<strong>Transport</strong> <strong>Strategy</strong> 2005 and the <strong>Auckland</strong> Regional<br />
Growth <strong>Strategy</strong>, 1999 in a collaborative manner;<br />
4. Integrates land use and transport;<br />
5. Facilitates and underpins development of town centres<br />
and supports employment growth.<br />
The desired outcomes of the <strong>Waitakere</strong><br />
<strong>City</strong> <strong>Transport</strong> <strong>Strategy</strong><br />
The desired outcomes for transport in <strong>Waitakere</strong> are:<br />
a) People have safe, effective, integrated and sustainable<br />
travel choice options;<br />
b) Less traffic and more mobility through innovative travel<br />
demand management;<br />
c) Opportunity to live, work and play locally;<br />
d) Land use is integrated with transport and both are<br />
mutually supportive;<br />
e) Business travel and location needs are met in a<br />
sustainable way;<br />
f) People have choices that enable them to participate in<br />
society;<br />
g) The environment and human health are protected;<br />
h) Reduced non-renewable energy use for transport;<br />
i) People work in a collaborative and innovative manner to<br />
maximise these outcomes.<br />
‘Less traffic’ means fewer vehicles on the road. This is a<br />
different approach than reducing congestion.<br />
‘More mobility’ means providing access to travel and choice<br />
of travel. Travel must be affordable, safe and easy to use so<br />
that people with a range of abilities can get to where they<br />
need to go.<br />
Great North Road, Henderson<br />
14
Section 4: Foundations of the<br />
<strong>Strategy</strong>, Strategic Direction<br />
The foundations of this transport strategy are:<br />
Supply - Investment in transport infrastructure. Significant<br />
investment in passenger transport, walk and cycle ways,<br />
state highways and selected roads is required to provide a<br />
multi-modal transport system for the movement of people,<br />
goods and services.<br />
Demand - Travel demand management. A range of<br />
measures to reduce the need to travel long distances<br />
includes a compact urban form, appropriate land use, more<br />
local employment, promotion of attractive alternatives to<br />
the motor vehicle, a congestion charge in the <strong>Auckland</strong><br />
region, school and workplace travel plans, and alternatives<br />
to travel such as communication through the Internet.<br />
Holistic approach - Links with other strategies and<br />
community outcomes. <strong>Transport</strong> needs to contribute to<br />
outcomes for economic development, energy efficiency,<br />
the natural environment, stormwater management, health<br />
and social connectedness. A contribution to transport<br />
outcomes is also required from other activities such as<br />
housing, education, town centre development, economic<br />
development, land use planning in the District Plan, and<br />
social infrastructure.<br />
Strategic Direction – Way to go!<br />
The strategy to achieve the city’s transport vision and<br />
objectives is to reduce congestion in parts of the network<br />
and to encourage more people to walk, cycle, use<br />
passenger transport and car pool. The flow of goods and<br />
people is vital to the economy and the functioning of the<br />
city. Sustainable solutions are required in order to achieve<br />
the city and lifestyle that people want. The strategy aims to<br />
provide benefits both in the short and long term.<br />
Traffic congestion will be addressed by targeted investment<br />
in transport infrastructure and a range of measures to<br />
manage the demand for travel:<br />
• Increase road connections in town centres and<br />
disconnected neighbourhoods; improve the flow at<br />
selected intersections and at connections to the state<br />
highway network.<br />
• Make significant improvements in passenger transport,<br />
walk and cycle ways and incorporate these elements,<br />
as appropriate, in road improvements.<br />
• Encourage alternatives to single-occupant vehicle use.<br />
• Implement a range of measures to manage the demand<br />
for travel, instead of building more roads or wider roads<br />
to meet projected demand.<br />
New road connections would be done to generate<br />
new business, to improve connectivity in town centres<br />
and to improve the flow of goods and people. An<br />
upgrade of arterial roads is required to enable bus<br />
priority measures, to encourage ride-sharing with<br />
HOV lane, to improve cycle access with cycle lanes<br />
and to increase the traffic efficiency of the network.<br />
Improvements in passenger transport and walk and<br />
cycle ways provide people with better travel choices<br />
and provide improved access for those who don’t<br />
have a car. Sustainable ways to reduce car use include:<br />
• Walking<br />
• Cycling<br />
• Train, bus or ferry<br />
• Car pooling<br />
• Shorter trips<br />
• Fewer trips<br />
• Travel outside peak hours.<br />
15
SECTION 4: Foundations of the <strong>Strategy</strong>, Strategic Direction<br />
A range of travel demand management measures is required<br />
to encourage a significant shift of people away from driving<br />
a car. This requires smart planning of the city form and land<br />
use, more local employment, vital town centres to attract<br />
employment and make passenger transport more efficient,<br />
restrictions on parking, relieving pressure to travel at peak<br />
times (for example, congestion charges, working from<br />
home, school and workplace travel plans, and sustainable<br />
alternatives to driving a car).<br />
The city needs to take advantage of opportunities for cleaner<br />
fuels, renewable energy solutions and environmentally<br />
friendly technologies. This is important to reduce the<br />
harmful impacts of transport on people’s health and the<br />
environment.<br />
This strategic direction is a balanced approach to investment<br />
in roads, passenger transport, walking and cycling, and<br />
travel demand management. The strategic direction is<br />
closely aligned with the <strong>Auckland</strong> Regional Land <strong>Transport</strong><br />
<strong>Strategy</strong> 2005. Therefore, <strong>Waitakere</strong>’s transport programme<br />
has a greater likelihood of receiving funding from Land<br />
<strong>Transport</strong> New Zealand.<br />
The strategic direction requires the transport programme<br />
for <strong>Waitakere</strong> to focus on the following:<br />
• Commitment to the essentials – safety, maintenance of<br />
existing transport assets, existing commitments, and<br />
operation of traffic systems.<br />
• A balance of investment in roads, footpaths, passenger<br />
transport infrastructure, walking and cycling initiatives,<br />
and travel demand management measures.<br />
• A commitment to integration between different modes of<br />
transport, with rail providing the backbone of passenger<br />
transport in <strong>Waitakere</strong>.<br />
• Planning for integration of transport and land use. This<br />
requires growth to be in the right places, with good<br />
urban design and appropriate roads, footpaths, cycle<br />
ways, access to passenger transport and the state<br />
highway network.<br />
• Ensuring that the implementation of transport projects<br />
is smart, cost effective and well planned so that they<br />
directly contribute to the type of city that people want<br />
to live and do business in.<br />
Expected Outcomes<br />
The following expected outcomes are based on the<br />
strategic direction and the budgeted programme:<br />
• The Council (and other large organisations such as<br />
UNITEC and the hospital) would lead the way with<br />
workplace travel plans achieving a 12% reduction in<br />
single-occupancy car trips to and from work.<br />
• More people walking and cycling – A 63% increase in the<br />
three main town centres is expected to be achieved.<br />
• Train services are every ten minutes in the peak<br />
periods.<br />
• Bus priority measures are in place on key arterial roads<br />
which result in faster and more reliable trips and greater<br />
bus patronage.<br />
• A shift to passenger transport (approximately 50%<br />
increase in passenger transport trips to work at peak<br />
times).<br />
• Congestion charging is introduced in the <strong>Auckland</strong><br />
region by 2016, which is aimed at achieving a reduction<br />
in peak period trips by motor vehicle and providing a<br />
revenue source for passenger transport.<br />
• ARTA will provide information on the availability of<br />
different modes of transport which will assist sustainable<br />
travel choices.<br />
• At least 13% of <strong>Waitakere</strong>’s population will be living in<br />
high-density centres and corridors.<br />
• Road injury crashes per 10,000 people are expected to<br />
decline by 6%.<br />
• Crashes, deaths and injuries involving pedestrians and<br />
cyclists decrease.<br />
• A similar number of vehicle kilometres travelled per<br />
resident as in 2005 (4,352 kilometres per resident per<br />
annum in 2005).<br />
• A slight increase in the number of vehicles on the<br />
roading network by 2016.<br />
• A slight reduction in congestion on the arterials,<br />
assuming the shift to sustainable modes of travel.<br />
• Increased efficiency of arterial roads.<br />
These outcomes assume the introduction of congestion<br />
charging which is forecast to reduce congestion by 20-<br />
25% by 2016. If congestion charging is not introduced,<br />
then levels of traffic and congestion can be expected to be<br />
worse than as stated above.<br />
The <strong>Waitakere</strong> <strong>City</strong> Council considers that it is important<br />
to have effective passenger transport alternatives in place<br />
in order to manage a shift in demand, anticipated to arise<br />
from increasing oil prices and congestion charging in the<br />
<strong>Auckland</strong> region.<br />
• Most schools in <strong>Waitakere</strong> implementing travel plans<br />
– A 10% reduction in car trips to school is expected to<br />
be achieved.<br />
16
Section 5: Policies and<br />
<strong>Transport</strong> Programme<br />
This section outlines the Council’s transport policies and<br />
transport programme for <strong>Waitakere</strong>.<br />
<strong>Transport</strong> policies<br />
There are a number of policies in the <strong>Auckland</strong> Regional<br />
Land <strong>Transport</strong> <strong>Strategy</strong> 2005 which apply to local<br />
authorities. These form an important part of transport policy<br />
in <strong>Waitakere</strong> and are outlined in Appendix 3.<br />
<strong>Waitakere</strong> <strong>City</strong> Council policies also reflect its eco city<br />
approach and the local requirements of <strong>Waitakere</strong>,<br />
including:<br />
• The Council’s District Plan.<br />
• The Council’s proposed District Plan changes, including<br />
developments in the northwest of the city and New<br />
Lynn.<br />
• Policies contained in strategic and implementation<br />
documents (refer to Appendix 4).<br />
• Existing and planned transport corridors and modes of<br />
transport (outlined in section 6.)<br />
Specific transport policies for <strong>Waitakere</strong> include:<br />
Compact urban form<br />
The Council supports intensive development around the<br />
main town centres, rail and ferry stations and along transport<br />
corridors. This will help to create vibrant centres, improve<br />
access to key services and support passenger transport.<br />
Community facilities (including schools, health centres,<br />
retail centres, libraries and council offices) and essential<br />
services should be located where there is safe and easy<br />
access by passenger transport, walking and cycling.<br />
New development needs to be appropriate for the location<br />
and use. It is desirable that new development and transport<br />
are integrated. Appropriate provision of transport modes<br />
and mitigation of adverse effects on the transport system<br />
need to be considered in order to achieve sustainable<br />
outcomes for the city.<br />
Supporting economic development<br />
The Council will encourage growth that provides local<br />
jobs, leisure and shopping facilities and concentrates<br />
housing and employment in areas with good passenger<br />
transport and walk and cycle routes. The efficiency of the<br />
existing road network will be improved and some new road<br />
connections will be provided to address congestion which<br />
directly and significantly affects economic development in<br />
<strong>Waitakere</strong>.<br />
It is essential that growth in the local economy can be<br />
supported by the local transport network, with appropriate<br />
routes for trucks and goods vehicles. New developments<br />
that generate substantial freight movements should be<br />
located with access to the state highway network and away<br />
from town centres and residential areas. A civilian airport<br />
at Whenuapai, with appropriate transport connections,<br />
would provide significant local employment and achieves<br />
significant congestion relief.<br />
Working with key stakeholders<br />
The Council will continue to carry out effective consultation<br />
with key stakeholders including the local community and<br />
special interest groups. It will work collaboratively with key<br />
transport agencies including Transit New Zealand, <strong>Auckland</strong><br />
Regional <strong>Transport</strong> Authority, ONTRACK, <strong>Auckland</strong><br />
Regional Council, Land <strong>Transport</strong> New Zealand, transport<br />
providers and neighbouring Territorial Authorities.<br />
Smart development<br />
Smart development of the city means doing it right the<br />
first time. The Council will ensure that it works with utility<br />
17
SECTION 5: Policies and <strong>Transport</strong> Programme<br />
providers to coordinate works in the road corridor and<br />
ensure that disruption to users is minimised.<br />
Reducing adverse environmental effects of transport<br />
The Council is developing a Greenhouse and Energy Action<br />
plan. This identifies that transport accounts for 44% of the<br />
city’s greenhouse gas emissions. The Action Plan identifies<br />
a number of projects to reduce greenhouse gas emissions<br />
that the Council will undertake or advocate for, including<br />
higher standards for vehicle efficiency and environmental<br />
performance and the introduction of carbon neutral fuels.<br />
<strong>Waitakere</strong> <strong>City</strong> Council will advocate for the introduction<br />
of noise emission and vibration standards in the <strong>Auckland</strong><br />
region and support the <strong>Auckland</strong> Regional Council in its<br />
efforts to reduce vehicle emissions. The Council will ensure<br />
that all new roads in <strong>Waitakere</strong> are designed to mitigate<br />
water contamination from the roading network.<br />
Develop quality infrastructure supporting passenger<br />
transport, walking, cycling and carpooling<br />
The Council will work with providers to ensure that station<br />
precincts are designed to meet the needs of users and have<br />
a high standard of safety, access and appropriate facilities<br />
such as lighting, toilets, bike lockers, signage, walkways,<br />
drop-offs and park and rides.<br />
It will continue to plan and develop bus priority measures<br />
with a focus on key strategic corridors. The Council will<br />
upgrade infrastructure at bus stops including signs,<br />
timetable holders, shelters, lighting, and provide highquality<br />
access. High Occupancy Vehicle (HOV) lanes will<br />
be proposed on selected arterial roads.<br />
Support and promote alternatives to single<br />
occupancy car use<br />
The Council will continue to work with ARTA to increase<br />
the promotion and awareness of passenger transport<br />
services, walking and cycling. The Council will encourage<br />
mall operators and other major retail providers to assess<br />
Glen Eden Rail Station and park and ride<br />
options for reducing car dependency such as a dedicated<br />
‘shopper bus’ and parking restrictions. The Council will<br />
assist schools with the implementation of school travel<br />
plans which encourage sustainable travel to school and<br />
reduce traffic congestion at peak times<br />
The Council as a leader<br />
The Council will contribute to the city’s transport objectives<br />
through its own practices. Examples include location of<br />
its offices in Henderson next to a passenger transport<br />
interchange and implementing a workplace travel plan to<br />
encourage sustainable travel by employees and visitors. The<br />
Council will share its learnings with other organisations.<br />
Parking<br />
A range of measures will be required to respond to demand<br />
for parking, particularly in the main town centres. These<br />
include restricted time parking, improved passenger<br />
transport, park and ride facilities, paid parking in the<br />
Council’s off-street car parks and in car park buildings. The<br />
Council is committed to reducing the effects of traffic and<br />
there needs to be a limit on provision of parking to achieve<br />
this. Road users need to bear the costs of travel, including<br />
parking. The Council has direct control over parking on<br />
the roads and Council-owned parking areas. The following<br />
strategies are to be developed over the next 10 years:<br />
• Limit supply – The Council is proposing changes to the<br />
District Plan to help manage parking to better achieve<br />
the Council’s strategic goals: for example, the Council<br />
proposed no minimum requirements for on-site parking<br />
for residential developments at New Lynn.<br />
• Manage on-street parking – Some changes in onstreet<br />
parking may be required through regulatory<br />
measures, to enable bus priority lanes to be introduced<br />
and also to ensure adequate turnover of parking in<br />
busy town centres. Consideration will be given to onstreet<br />
paid parking, but this is not part of the budgeted<br />
programme 2006–2016.<br />
• Off-street parking – The Council intends to extend<br />
charging for off-street parking in Council-owned parking<br />
areas in town centres in order to upgrade the security,<br />
create a market for paid parking and to influence travel<br />
choices.<br />
• Park and ride – Park and ride areas are required near<br />
to selected rail, bus and ferry stations. Park and ride<br />
facilities provide a connection to the passenger transport<br />
system, which is particularly important for those in rural<br />
areas. Park and ride areas should be developed with a<br />
high standard of safety and security.<br />
<strong>Transport</strong> funding, congestion charges and tolls<br />
The Council’s policy is to ensure that development<br />
contributions and financial contributions are obtained and<br />
used to fund the growth requirements of the transport<br />
18
SECTION 5: Policies and <strong>Transport</strong> Programme<br />
system. This is to ensure that development costs are<br />
funded in a manner that is fair and equitable to current and<br />
future residents, while supporting the Council’s eco city<br />
approach.<br />
Congestion charging options in the <strong>Auckland</strong> region can<br />
be an effective tool in reducing congestion and raising<br />
revenue.<br />
The Council recognises that there are a number of issues<br />
relating to congestion charges and tolls. The Council is yet<br />
to adopt a policy position regarding congestion charges but<br />
is encouraging government to consider legislation which<br />
enables congestion charges. The Council would seek to<br />
ensure that congestion charges and tolling:<br />
• Are equitable across <strong>Auckland</strong> and New Zealand.<br />
• Are equitable across all social groups and not<br />
discriminating against those with least choice.<br />
• Provide any surplus revenue to fund passenger transport<br />
and travel demand management as well as physical<br />
infrastructure.<br />
• Manage travel behaviour (to reduce congestion) as well<br />
as provide revenue.<br />
• Are able to favour or discriminate in favour of genuine<br />
goods and business traffic.<br />
• Do not overload local roads (or if they do, use revenue<br />
to fund improvements to local roads).<br />
• Reduce overall road traffic.<br />
• Are offset by a reduction in petrol tax or road user<br />
charges over time.<br />
• Support <strong>Waitakere</strong>’s economic and land use strategies.<br />
A high-quality passenger transport network is a prerequisite<br />
for the introduction of congestion charges.<br />
The Council will continue to advocate for legislation which<br />
taxes vehicle pollution into the air or stormwater system<br />
according to vehicle type – a ‘polluter pays’ system. Road<br />
users need to be aware of, and pay for, the true cost of their<br />
transport decisions.<br />
Safety and accessibility<br />
Well-designed, inclusive and accessible communities<br />
and transport systems not only benefit vulnerable users,<br />
including the eldery, children, disabled people, people with<br />
English as a second language and those with least choice<br />
- they achieve better solutions for everyone. Accessibility<br />
issues need to be integrated into the approach and<br />
working practices of transport policy makers, planners<br />
and infrastructure and service providers. This approach is<br />
reflected in the work <strong>Waitakere</strong> <strong>City</strong> Council has undertaken<br />
investigating safety and access by design. This has three<br />
components which influence access for local residents -<br />
Barrier Free, Universal Design; Crime Prevention through<br />
Environmental Design; and Injury Prevention through<br />
Environmental Design.<br />
Safety and accessibility needs to be considered in the<br />
planning of all transport options and for the whole of the<br />
journey. The accessible journey covers all the steps needed<br />
for a person to get from their home to their destination and<br />
return, including reading information to plan the journey,<br />
and all the different transport modes, interchanges and<br />
streetscapes. If one link is inadequate, the whole journey<br />
may be impossible. For example, a bus that is accessible<br />
to wheel chairs and push chairs, needs to be supported<br />
by quality footpaths and road crossing systems. Passenger<br />
transport stops and access ways should be well lit and<br />
free from ‘tagging’ and vandalism. This will assist with an<br />
improved perception of personal safety.<br />
Responsibility for roading<br />
The Local Government (<strong>Auckland</strong>) Amendment Act 2004<br />
allows territorial authorities to delegate roading functions<br />
to the <strong>Auckland</strong> Regional <strong>Transport</strong> Authority any time after<br />
June 2007. The <strong>Waitakere</strong> <strong>City</strong> Council’s current policy is<br />
that it does not wish to delegate its roading functions.<br />
<strong>Transport</strong> Programme 2006–2016<br />
The Council’s budgeted transport programme for the 10-<br />
year period 2006 – 2016 is attached in Appendix 1. The<br />
ten year programme is reviewed every three years and<br />
the annual programme each year. This identifies the key<br />
infrastructure costs and timing in the Council’s transport<br />
programme. New programmes introduced into the <strong>Transport</strong><br />
Programme 2006 – 2016 include:<br />
• Bus priority measures on selected arterial roads;<br />
• Development of 30% of the cycle way network across<br />
the city by 2016;<br />
• A travel demand management programme which<br />
includes travel plans for schools, workplaces and<br />
promotes sustainable travel choices, particularly at<br />
peak times;<br />
• A park and ride programme in relation to rail, bus and<br />
ferry stations and terminals;<br />
• Integrated transport at new growth areas in the<br />
northwest.<br />
The cost of the 10-year transport capital expenditure<br />
programme (excluding renewals) is $368 million to be funded<br />
out of rates, user charges, development contributions, and<br />
regional and central government funding. The net cost<br />
of the 10-year transport capital expenditure programme<br />
(excluding renewals) after central and regional government<br />
funding is $207 million.<br />
19
SECTION 5: Policies and <strong>Transport</strong> Programme<br />
The increase in the cost of the capital expenditure<br />
programme between the draft and final strategies was<br />
due to the inclusion of all transport related unsubsidised<br />
transport projects and also an adjustment for inflation.<br />
In developing the Council’s <strong>Transport</strong> Programme 2006–<br />
2016, the focus has been on:<br />
• Identifying projects and coordinating the timing of those<br />
projects.<br />
• Setting the size of the programme to an affordable level<br />
and a programme which fits with the Council’s strategic<br />
direction for transport.<br />
• Prioritising projects based on the following order:<br />
1. Maintenance and renewals<br />
2. Safety<br />
3. Travel demand management – land use, integrated<br />
transport projects, working from home, local trips,<br />
travel plans, car pooling, passenger transport,<br />
preparation for congestion charging, traffic<br />
management, promotion and communication of<br />
sustainable travel choices.<br />
4. Walking and cycling<br />
5. Passenger transport<br />
6. Roads – new roads in subdivisions and growth areas,<br />
connectivity, some arterial improvement.<br />
Projects have also been included where there is external<br />
funding in addition to Land <strong>Transport</strong> New Zealand subsidies<br />
(i.e. development contributions, user pays).<br />
Significant Projects<br />
The following are large-expenditure items that significantly<br />
affect the total transport spend:<br />
Whau Crossing bridge – A detailed investigation of the<br />
benefits and feasibility of constructing a crossing of the<br />
Whau River between Rosebank Peninsula and Te Atatu<br />
South/Glendene is proposed to be done jointly with Transit<br />
New Zealand and the <strong>Auckland</strong> <strong>City</strong> Council. It is believed<br />
that the crossing would help to improve flows on the<br />
North Western Motorway, Great North Road and Ash/Rata<br />
Street, and help relieve the Te Atatu motorway interchange<br />
providing better access to business areas in the city,<br />
notably Glen Eden and Henderson. The investigation will<br />
also need to consider alternative sources of funding such<br />
as tolls and private-sector partnerships. Only the cost of the<br />
investigation has been included in the 10-year budgeted<br />
programme.<br />
New Lynn Transit Orientated Design – The double<br />
tracking of the Western Rail line at New Lynn is fundamental<br />
to improve transport and to revitalise the New Lynn town<br />
centre. Placing the rail corridor below street level will allow<br />
the town centre to grow and integrate a range of uses<br />
across the corridor at ground level. The project includes<br />
redevelopment of bus facilities, additional road and<br />
pedestrian connections and some urban redevelopment of<br />
properties near the rail corridor. This will improve the level<br />
of north-south access and also allow pedestrians, buses<br />
and cyclists to get from one side to the other more safely.<br />
Cycle and walk way along rail line - This walk and cycle<br />
way would provide safer, direct access to train stations<br />
and town centres along the rail line. It would also provide<br />
important links to schools, communities and workplaces.<br />
Only a portion of the cost of the walk and cycle way has<br />
been included in the 10-year budgeted programme.<br />
Principles for prioritising transport in<br />
<strong>Waitakere</strong><br />
Assessment criteria is being developed in relation to<br />
new transport projects to reflect the contribution to the<br />
objectives of this transport strategy. Criteria for prioritisation<br />
of a transport project or programme should involve an<br />
assessment of economic, environmental, social and cultural<br />
impacts including, for example:<br />
• How does the project contribute to employment or<br />
economic development within <strong>Waitakere</strong>?<br />
• How does the project contribute to sustainable travel?<br />
For example, does it contribute to a shift away from<br />
single-occupant vehicle travel and long trips?<br />
• How does the project contribute to safety?<br />
• How does the project contribute to social capital and<br />
address social needs?<br />
Prioritisation criteria set by funding agencies will affect the<br />
timing of projects in the 10-year programme.<br />
Footpath improvements, Glen Eden<br />
20
Section 6: Role of <strong>Transport</strong> Modes<br />
and <strong>Transport</strong> Corridors<br />
Roads and State Highways<br />
Making the most of our existing roading network is the main<br />
priority for the Council’s roading investment. The Council<br />
will advocate for, plan, and construct new roads only when<br />
they are essential in order to better integrate the transport<br />
network.<br />
Completion of the State Highway 18 Upper Harbour<br />
motorway and the State Highway 16 extension are vital<br />
to economic development and for local jobs at Westgate<br />
and Hobsonville. The completion of State Highway 18<br />
Upper Harbour motorway is expected to significantly<br />
alleviate congestion on Hobsonville Road and will provide<br />
better access between Westgate and Albany. Surrounding<br />
areas will enjoy a reduced travelling distance to access<br />
employment and facilities, with the added benefit of<br />
reducing traffic volumes elsewhere on the network.<br />
The Council plans to investigate construction of another<br />
crossing of the Whau River between Rosebank Peninsula<br />
and Te Atatu South/Glendene. A second crossing would<br />
help to improve flows on the North Western Motorway,<br />
Great North Road and Ash/ Rata Street, and would help<br />
to alleviate congestion the Te Atatu motorway interchange,<br />
providing better access to business areas in <strong>Waitakere</strong>,<br />
notably Glen Eden and Henderson.<br />
The Council will consider road widening on strategic local<br />
roads to improve the flow of buses and high-occupancy<br />
vehicles or to add a cycle lane. Generally, road widening<br />
that is mainly for improving private vehicular traffic will not<br />
be undertaken. Exceptions to this may be in the context of<br />
safety, town centre development, connectivity, and when<br />
there is a considerable improvement to the entire route, i.e.<br />
more than localised benefits are achieved.<br />
The Council will examine the impact of parking, deliveries,<br />
property access and conflicting movements at intersections.<br />
Solutions that improve general operation and provision for<br />
buses within the road carriageway and reserve will generally<br />
be sought.<br />
Freight Movement <strong>Strategy</strong> and<br />
Business Location <strong>Strategy</strong><br />
The Council will develop and implement a Business<br />
Location <strong>Strategy</strong> and a Freight Movement <strong>Strategy</strong>. Some<br />
of the general principles of these strategies will include:<br />
Lincoln Road off-ramp<br />
• Goods-based businesses are encouraged to locate in<br />
areas with good access to the state highway network<br />
(for access to the port, airport, etc.);<br />
• People-based businesses are encouraged to locate<br />
along the rail line and at locations with good passenger<br />
transport services;<br />
• Preferred routes for freight will be developed in<br />
conjunction with freight operators and local businesses,<br />
21
SECTION 6: Role of <strong>Transport</strong> Modes and <strong>Transport</strong> Corridors<br />
taking into account impacts on residential<br />
neighbour0hoods, congested areas and efficiency<br />
requirements;<br />
•<br />
•<br />
Freight movement is encouraged outside peak hours;<br />
Local freight on rail is not planned in <strong>Waitakere</strong> over the<br />
next 10 years.<br />
Passenger <strong>Transport</strong><br />
The city’s strategy for passenger transport is to further<br />
develop, and increase the patronage of, all modes of<br />
passenger transport. Recently, the Council’s focus has been<br />
the development of the rail network. This focus will continue<br />
to ensure that we complete the planned infrastructure and<br />
services upgrade of the Western Rail Corridor. The Council<br />
is also committed to optimising bus and ferry services<br />
with improvements to infrastructure, priority measures,<br />
service quality and real-time information. There needs to<br />
be better integration of passenger transport services and<br />
modes. People need to be encouraged to use passenger<br />
transport not only in the peak times when there is pressure<br />
on the roading network, but also during the day as part of<br />
everyday travel. This is important for quality of life and the<br />
financial viability of passenger transport services.<br />
Rail<br />
The Council will continue to advocate strongly for upgrade<br />
to services and infrastructure on the Western Rail Corridor.<br />
It is vital that the <strong>Auckland</strong> region achieves the goal of an<br />
excellent rail passenger service and overcomes funding<br />
difficulties to achieve this.<br />
The completion of double tracking of the Western Rail<br />
Corridor remains a high priority. This is fundamental to<br />
increasing frequency, and increased service results in<br />
increased patronage.<br />
New trains will be needed in the future. However, a decision<br />
about whether the <strong>Auckland</strong> region continues with diesel or<br />
switches to electric trains must be made first. The Council<br />
will continue to advocate for electrification of the rail corridor.<br />
The benefits of electrification include reducing long-term<br />
impacts on the environment, supporting intensification<br />
along the rail corridor and around stations, and stimulating<br />
passenger growth.<br />
The major stations and passenger interchanges are<br />
Henderson and New Lynn. Upgrading the stations from<br />
New Lynn to <strong>Waitakere</strong> and the precincts surrounding our<br />
rail stations is a priority. People want access to be easy,<br />
attractive, comfortable and safe.<br />
The Council plans for the New Lynn station include<br />
redeveloping the bus station, lowering the rail line through<br />
New Lynn and removing the roundabout intersection across<br />
the rail line. The Council believes this will provide the best<br />
prospect for the future vitality and sustainability of New<br />
Lynn as a major town centre.<br />
Buses<br />
<strong>Waitakere</strong> <strong>City</strong> Council’s focus is on developing bus-related<br />
infrastructure (bus stops, signs, timetable holders, shelter,<br />
lighting, etc) and working with ARTA to improve services,<br />
service quality and frequency. <strong>Waitakere</strong> <strong>City</strong> Council will<br />
also work with Transit NZ regarding bus or high-occupancy<br />
vehicle lanes along the state highways.<br />
Buses are an integral part of the passenger transport<br />
system. Bus priority measures give special treatment to<br />
buses so that their trips are faster and more reliable.<br />
Bus priority measures include:<br />
Ranui Rail Station<br />
• Bus and high-occupancy vehicle (HOV) lanes during<br />
peak periods of the day.<br />
• Bus advance signals (e.g. traffic lights, ramp signals).<br />
• Bus advance lanes.<br />
• Clearways.<br />
• Traffic improvements that directly benefit buses such as<br />
free left-hand turns.<br />
22
SECTION 6: Role of <strong>Transport</strong> Modes and <strong>Transport</strong> Corridors<br />
Consultation on proposed bus priority measures on<br />
specific routes will be required. Proposed locations of bus<br />
priority measures are along State Highways 16 and 18,<br />
along key arterial roads (Te Atatu, Lincoln, Great North and<br />
Hobsonville Roads) and around interchanges at New Lynn,<br />
Henderson and Westgate.<br />
The benefits of bus priority measures include:<br />
• reliable bus trips at peak times;<br />
• fewer delays and quicker trips for buses at peak times;<br />
• more services and increased patronage;<br />
• fewer single-occupant vehicle trips at peak times;<br />
• a shift to passenger transport, walking and cycling;<br />
• more car pooling on HOV lanes.<br />
Bus Services<br />
ARTA is responsible for contracting services and periodically<br />
reviews bus services. <strong>Waitakere</strong> <strong>City</strong> Council will work with<br />
ARTA to ensure that any review of bus services best takes<br />
account of the needs of the city and its residents. The<br />
Council has identified some key changes required to bus<br />
services:<br />
Long-haul and local trips: Bus services need to service<br />
travel within <strong>Waitakere</strong> (local services) as well as trips<br />
outside the city (express services).<br />
Support town centre development: Bus services need<br />
to improve access to, through and from the key town<br />
centres, growth and employment centres. Interchanges<br />
are proposed to be established at New Lynn, Henderson,<br />
Westgate and Hobsonville Village.<br />
New Lynn and Henderson. This can be achieved by bus<br />
feeder services, adjusting bus schedules to integrate with<br />
rail, and by optimising the use of the upgraded interchanges<br />
to cater for all possible connections between bus and rail.<br />
Bus priority measures: Where bus priority measures are<br />
introduced, increased frequency of services is required to<br />
increase patronage and take advantage of faster and more<br />
reliable trips.<br />
New services: New bus services should be introduced<br />
in conjunction with, rather than after, new residential and<br />
commercial development. As the northern growth areas<br />
develop, new services should be introduced to encourage<br />
passenger transport use. The Western Heights, Central<br />
Park Drive, Massey, Westgate and West Harbour areas<br />
among others, need improved services.<br />
Regional and national issues: The Council supports<br />
regional and national moves to reduce emissions from buses<br />
and use cleaner fuels. Other issues will be supported such<br />
as regional priorities for buses, review of fares, integrated<br />
ticketing, real-time information systems, low floors and<br />
cycle racks on buses.<br />
Ferry<br />
The Council wishes to maximise the potential of ferries<br />
by improving the precinct areas surrounding terminals,<br />
including signage, shelter, lighting, walking access and<br />
park and ride facilities. The Council will work with ARTA<br />
and operators to further develop services at West Harbour<br />
and establish new services at Hobsonville and Te Atatu.<br />
Bus and rail integration: People need to be able to easily<br />
and safely connect between buses and trains, especially at<br />
Lincoln Road bus advance lane<br />
West Harbour ferry service, Westpark Marina<br />
23
SECTION 6: Role of <strong>Transport</strong> Modes and <strong>Transport</strong> Corridors<br />
Walking and Cycling<br />
The <strong>Waitakere</strong> <strong>City</strong> Walking and Cycling <strong>Strategy</strong> was<br />
adopted in 2003. The purpose of this document is to<br />
promote the healthy benefits of walking and cycling and<br />
reduce the negative impacts of motor vehicles by:<br />
1. Increasing the proportion of short trips made by walking<br />
or cycling to major destinations (town centres, schools,<br />
bus and rail stations).<br />
2. Increasing the number of walking and cycling trips made<br />
for leisure.<br />
3. Supporting commuting by walking or cycling trips.<br />
This requires the establishment of a network of routes for<br />
walking and cycling which connect to major destinations.<br />
The footpath network provides an important walking<br />
network. A safer cycle network also needs to be established,<br />
with dedicated cycle ways, cycle lanes and signage.<br />
In order to encourage more walking, town centres need to<br />
be safe and well designed so that there is high amenity<br />
for people to sit and move about. Similarly for cycling, it is<br />
important that conducive cycling conditions are established<br />
throughout <strong>Waitakere</strong> through good design of roads,<br />
management of traffic and provision for cyclists.<br />
In order to further support the passenger transport network<br />
it is important to improve pedestrian access to bus stops,<br />
train stations and ferry berths. Improvement in local<br />
footpaths to local employment, schools, shops and parks<br />
will also assist in encouraging short trips on foot.<br />
• Reduce the need for travel and the distance travelled<br />
through land use intensification at town centres,<br />
transport nodes and along the rail corridor.<br />
• Support the application for extension of the Metropolitan<br />
Urban Limit in the northwest to provide local jobs and to<br />
establish sustainable transport solutions at Westgate,<br />
Hobsonville and Hobsonville Village.<br />
• Continue to advocate vigorously for Whenuapai Airport<br />
to operate with commercial services (i.e. maximise<br />
employment, minimise residential).<br />
• Plan with developers for local services and facilities that<br />
meet needs of local catchment.<br />
•<br />
•<br />
Advocate for quality community facilities in <strong>Waitakere</strong>.<br />
Implement a Business Location and Freight strategy.<br />
• Promote and facilitate Internet and broadband<br />
services.<br />
• Travel plans for schools, tertiary organisations,<br />
workplaces and communities.<br />
•<br />
•<br />
Encourage work from home and flexible work hours.<br />
Implement the policies of the <strong>Waitakere</strong> <strong>City</strong> Walking<br />
and Cycling <strong>Strategy</strong> 2003.<br />
• Advocate for introduction of congestion charges and<br />
pricing controls (parking and road pricing).<br />
• Seek to improve and promote passenger transport as<br />
an alternative to the motor vehicle.<br />
• Encourage formal and informal car pooling arrangements<br />
managed by participants or private sector.<br />
While exact details and timing of some routes have changed<br />
since 2003, the Walking and Cycling strategy’s objectives<br />
remain valid.<br />
Travel Demand Management<br />
Travel Demand Management (TDM) seeks to reduce<br />
people’s need for travel and to influence their choice of<br />
travel mode. TDM provides attractive transport alternatives,<br />
information and appropriate city form and land use. It is<br />
expected that people will minimise long and frequent trips<br />
in single-occupant vehicles.<br />
The Council’s strategy for TDM is to encourage walking and<br />
cycling, car pooling, working from home, travelling outside<br />
peak periods and use of passenger transport. This requires<br />
smart planning of the city form and land use, transport<br />
infrastructure and communicating and promoting more<br />
sustainable travel choices.<br />
TDM measures include:<br />
• A focus on appropriate business location and<br />
complementary land use.<br />
Shared path, Henderson Creek<br />
24
SECTION 6: Role of <strong>Transport</strong> Modes and <strong>Transport</strong> Corridors<br />
• Ensure footpaths are maintained and renewed to quality<br />
standards which encourage use by people with a range<br />
of abilities and for a variety of uses.<br />
• Communicate travel demand management plans to the<br />
public.<br />
Energy Efficiency and Environmentally<br />
Friendly Technologies<br />
<strong>Waitakere</strong> eco city has the opportunity to play an important<br />
role in the support, use and introduction of energy efficient,<br />
clean fuel and environmentally friendly technologies. This<br />
can be at a number of levels including advocacy, information<br />
provision and, where appropriate, trial and introduction<br />
of technologies. Many opportunities are small, low cost<br />
and require an innovative approach. Current examples<br />
include:-<br />
• Promote <strong>Waitakere</strong> for pilot projects that demonstrate<br />
eco commitment (e.g. solar-powered lights, fuel-efficient<br />
vehicles and alternative fuels).<br />
• Advocate regionally and nationally for emission controls,<br />
catalytic converters, fuel standards.<br />
The Council is currently developing a <strong>Waitakere</strong> Greenhouse<br />
and Energy Action Plan which will further detail projects<br />
relating to transport related greenhouse gas reduction.<br />
The Council will investigate and implement as appropriate,<br />
future opportunities to support new technologies and<br />
solutions.<br />
<strong>Transport</strong> Corridors<br />
Rail Corridor – There will be very high train use within<br />
<strong>Waitakere</strong> and connecting with <strong>Auckland</strong>; but it is not<br />
expected that rail will be grade separated (except at<br />
New Lynn) by 2016. The Council expects completion of<br />
the double tracking of the rail line, with electrified new<br />
trains operating every 10 minutes at peak periods. Highdensity<br />
housing and businesses around stations provides<br />
a destination and source for trips by passenger transport,<br />
walking and cycling. Frequent bus services connecting<br />
to train stations are expected. Increases in residential,<br />
retail, commercial and office buildings at New Lynn and<br />
Henderson are expected to result in high rail usage as<br />
these town centres become established as key destination<br />
and employment centres.<br />
Increased train services may result in increased traffic<br />
queues at peak times at level crossings.<br />
State Highway Corridors<br />
State Highway 16 – State Highway 16 will continue to<br />
carry high volumes of traffic including more buses. These<br />
buses (including express services) will increasingly use bus<br />
shoulder lanes at peak times. There will be a new interchange<br />
and connection to State Highway 18 by 2012, and an<br />
extension past Westgate is expected by approximately<br />
2013. The Council anticipates ongoing congestion at<br />
arterial connections and at on-ramps in the morning peak,<br />
and off-ramps in the afternoon peak. <strong>Waitakere</strong> urgently<br />
requires an upgrade of Lincoln Road and Te Atatu Road<br />
interchanges. Ramp signalling at on-ramps should enable<br />
priority to buses and high-occupancy vehicles. A cycle<br />
way alongside State Highway 16 is an important part of the<br />
regional cycle network.<br />
State Highway 18 – State Highway 18 will improve<br />
essential economic linkages with North Shore and Rodney<br />
as well as with economic centres in <strong>Waitakere</strong>. When<br />
State Highway 18 is completed (expected by 2012), high<br />
volumes of traffic will be diverted from Hobsonville Road to<br />
State Highway 18. There will be a walk and cycle way from<br />
Buckley Ave to the Upper Harbour Bridge and from 2016,<br />
more buses (including express sevices) using bus shoulder<br />
lanes. State Highway 18 provides access to Westgate and<br />
to Whenuapai Airport.<br />
Arterial Road Corridors<br />
Modern train, Perth<br />
Like the arteries of the human body, arterial roads are<br />
the lifeblood of the city, enabling people to move about,<br />
business to operate successfully, deliveries to be made<br />
and for the city to prosper. Arterial roads have to cater<br />
for a wide variety of needs such as supporting residential<br />
25
SECTION 6: Role of <strong>Transport</strong> Modes and <strong>Transport</strong> Corridors<br />
and business intensification; providing access to homes,<br />
jobs and shops; and enabling people and goods to move<br />
efficiently across the city and region as well as within the<br />
area. It is the Council’s role to strike the best possible<br />
balance between all of these competing needs, recognising<br />
that many parties including pedestrians, cyclists, bus<br />
passengers, delivery vehicle and truck drivers, private<br />
motorists, and adjoining businesses and homes have a<br />
stake in achieving this balance. Overly favouring one need,<br />
such as speed for through traffic, can upset the delicate<br />
balance in the corridor and prejudice the interests of others<br />
whose stake in the corridor is equally as important.<br />
Therefore, the Council will consider all these needs in<br />
respect of each road corridor to strike the best possible<br />
balance between the multiple competing needs. The Council<br />
will consider Te Atatu Road first, taking into account input<br />
from community and stakeholders. Decisions regarding<br />
this corridor will help guide the Council in relation to its<br />
planning for other road corridors.<br />
Access to State Highway 20 – Significant traffic is<br />
expected to be generated along Clark Street to Wolverton<br />
and Tiverton Roads from the completion of the Mt Roskill<br />
extension to the Maioro Street interchange in 2009 until<br />
completion of State Highway 20 Waterview connection.<br />
Rata Street will continue to experience high volumes<br />
of traffic and provide access to State Highway 20 and<br />
<strong>Auckland</strong> <strong>City</strong>. Planning will need to be coordinated with<br />
<strong>Auckland</strong> <strong>City</strong> Council.<br />
Lincoln Road – Lincoln Road will continue to experience<br />
high volumes of traffic at peak times. Lincoln Road serves<br />
a multitude of needs including motorway access; through<br />
traffic; local traffic and access to adjoining business and<br />
residences. It is identified as a growth corridor for the<br />
city and part of a quality transit route. At present, there is<br />
significant conflict between the local access and throughtraffic<br />
functions of the route which need to be worked on<br />
in order for it to work more effectively for all users. Options<br />
for bus lanes; high-occupancy vehicle lanes; bus priority<br />
measures; as well as for improved access management<br />
and overall corridor management will be investigated.<br />
Hobsonville Road – The Council will seek transfer of<br />
control of Hobsonville Road from Transit NZ. Very high<br />
volumes of traffic need to be reduced after State Highway<br />
18 is operational. Options for bus priority measures will<br />
be investigated, as will an on-road cycle lane. Planning<br />
for neighbourhood centres along Hobsonville Road will<br />
provide density to support increased bus services. Slower<br />
speeds will be required to address safety issues and to<br />
allow controlled access to either side of Hobsonville Road.<br />
Proposed Whenuapai airport – Road access to the<br />
Whenuapai airport needs to be protected to enable high<br />
volumes of traffic to connect with the proposed Whenuapai<br />
regional airport.<br />
Proposed Whau Bridge crossing – A joint study with<br />
<strong>Auckland</strong> <strong>City</strong> Council and Transit NZ is required into the<br />
feasibility of a connection to Rosebank Peninsula from<br />
<strong>Waitakere</strong>. This may provide an alternative connector and<br />
relieve pressure on Rata Street, Te Atatu Road and New<br />
Lynn. Options for bus and cycle routes will be considered.<br />
Funding options including tolls will be explored.<br />
Te Atatu Road – Te Atatu Road will continue to experience<br />
high volumes of traffic at peak times. Options for a bus<br />
and high-occupancy vehicle lane northbound between<br />
Edmonton Road and the Northwestern motorway will be<br />
investigated in 2006/07. This investigation will also include<br />
the ramp signals that Transit NZ proposes to ration access,<br />
provide bus priority and improve pedestrian safety.<br />
Great North Road – Great North Road will continue to<br />
experience high volumes of traffic at peak times. It is also<br />
an identified growth corridor which runs through Henderson<br />
and New Lynn town centres. Options for bus advance lanes<br />
and signal pre-emption will be proposed to improve bus<br />
operation and encourage use of passenger transport.<br />
Swanson Rail Station and park and ride<br />
26
Section 7: Monitoring and Review<br />
Monitoring<br />
The Council and other organisations carry out monitoring<br />
in relation to transport outputs and outcomes. In order to<br />
assess the effectiveness of this strategy, it is important to<br />
monitor progress against the outcomes set out in sections<br />
3 and 4. This will assist in future reviews of the strategy.<br />
The following is a list of indicators to be monitored:<br />
•<br />
•<br />
Incidence of crashes and transport related injury or death.<br />
Percentage of population with access to the passenger<br />
transport system.<br />
• Number of vehicle kilometres travelled within<br />
<strong>Waitakere</strong>.<br />
• Proportion of the work force that works locally.<br />
• Proportion of growth that is located in high-density<br />
centres and corridors.<br />
• Access by residents to employment, town centres and<br />
community facilities.<br />
•<br />
•<br />
Car ownership.<br />
Percentage of population using passenger transport,<br />
walking and cycling or travelling as a passenger in a<br />
vehicle.<br />
•<br />
•<br />
Percentage of population working from home.<br />
Travel times and congestion by different modes of<br />
transport and on arterial roads.<br />
• Average speed for trip to <strong>Auckland</strong> CBD, port and<br />
airport in the morning peak period.<br />
• Integration of transport modes, especially at town<br />
•<br />
centres.<br />
Effectiveness of travel demand management<br />
programmes.<br />
• Residents’ perceptions of safety, accessibility and<br />
affordability of passenger transport.<br />
•<br />
•<br />
•<br />
•<br />
Health statistics related to active living.<br />
Use of non-renewable energy by transport.<br />
Air pollutants from transport.<br />
Discharges to water from transport.<br />
Historical data and progress in relation to these indicators are<br />
available at the Council’s website: www.waitakere.govt.nz<br />
Review of the <strong>Waitakere</strong> <strong>City</strong> <strong>Transport</strong><br />
<strong>Strategy</strong><br />
Henderson Rail Station<br />
The <strong>Waitakere</strong> <strong>City</strong> <strong>Transport</strong> <strong>Strategy</strong> needs to be reviewed<br />
every three years to coincide with the next <strong>Auckland</strong><br />
27
SECTION 7: Monitoring and Review<br />
Regional Land <strong>Transport</strong> <strong>Strategy</strong> and <strong>Waitakere</strong>’s Long<br />
Term Council Community Plan.<br />
By 2009, the following information is expected to be<br />
available:<br />
At the regional level -<br />
• <strong>Auckland</strong> Regional <strong>Transport</strong> <strong>Strategy</strong> 2008<br />
• <strong>Auckland</strong> Regional Growth <strong>Strategy</strong> review<br />
• <strong>Auckland</strong> <strong>Transport</strong> Plan<br />
• <strong>Auckland</strong> region congestion pricing<br />
• Toll arrangements in relation to the Western Ring Route<br />
• Studies into effects of peak oil<br />
At the local level –<br />
• Decision in relation to District Plan changes, particularly<br />
the extension of the metropolitan urban limit.<br />
• Completion of the double tracking of the Western Rail<br />
line and station improvements.<br />
• Road improvements and high-occupancy vehicle lanes<br />
at Te Atatu Road will have been planned and decisions<br />
made with community input.<br />
• Effectiveness of the ramp signalling on the Northwestern<br />
motorway<br />
• Policy development (for example, parking, freight)<br />
This will inform the Council’s decisions in relation to other<br />
road corridors and the next <strong>Waitakere</strong> <strong>City</strong> <strong>Transport</strong><br />
<strong>Strategy</strong>.<br />
Walking School Bus, Woodlands Park School<br />
28
Section 8: Conclusion<br />
<strong>Transport</strong> is a vital issue for people, the environment and<br />
the economy. <strong>Waitakere</strong> needs to focus its investment in<br />
passenger transport, walking and cycling infrastructure.<br />
The strategic approach is to manage demand for travel<br />
rather than continuing to build roads to cope with expected<br />
growth in <strong>Waitakere</strong>.<br />
This strategy is an affordable and sustainable approach that<br />
aims to get the best out of the existing roading network and<br />
encourage greater use of sustainable alternatives – regular<br />
walking and cycling, passenger transport, fuel-efficient<br />
vehicles, car pooling, shorter trips, fewer trips, travelling<br />
outside peak hours and working from home.<br />
The key features of the <strong>Waitakere</strong> <strong>City</strong> <strong>Transport</strong> <strong>Strategy</strong><br />
are:<br />
• A balance of investment in roads, footpaths, passenger<br />
transport infrastructure, walking and cycling initiatives,<br />
and travel demand management measures.<br />
• A commitment to integration between different modes of<br />
transport, with rail providing the backbone of passenger<br />
transport in <strong>Waitakere</strong>.<br />
• Planning for integration of transport and land use. This<br />
requires growth to be in the right places, with good<br />
urban design and appropriate roads, footpaths, cycle<br />
ways, access to passenger transport and the state<br />
highway network.<br />
• Ensuring that the implementation of transport projects<br />
is smart, cost effective and well planned so that they<br />
directly contribute to the type of city that people want<br />
to live and do business in.<br />
• Commitment to the essentials – safety, maintenance of<br />
existing transport assets, existing commitments, and<br />
operation of traffic systems.<br />
29
Appendix 1: Budgeted <strong>Transport</strong><br />
Programme 2006-2016<br />
CAPITAL EXPENDITURE<br />
Details 2006/2007 2007/2008 2008/2009 2009/2010 2010/2011 2011/2012 2012/2013 2013/2014 2014/2015 2015/2016 10 Years<br />
LTCCP LTCCP LTCCP LTCCP LTCCP LTCCP LTCCP LTCCP LTCCP LTCCP LTCCP<br />
RENEWALS<br />
Total Subsidised Renewals 11,687,000 14,802,000 12,802,000 12,952,000 13,235,000 13,632,000 13,834,000 15,302,000 15,436,000 15,694,000 139,376,000<br />
NON-SUBSIDISED RENEWALS 2,298,000 2,797,000 2,407,000 2,495,000 2,338,000 2,681,000 2,644,000 2,562,000 2,712,000 2,733,000 25,667,000<br />
TOTAL RENEWALS 13,985,000 17,599,000 15,209,000 15,447,000 15,573,000 16,313,000 16,478,000 17,864,000 18,148,000 18,427,000 165,043,000<br />
SUBSIDY ON RENEWALS (5,126,000) (6,492,000) (5,615,000) (5,681,000) (5,805,000) (5,979,000) (6,068,000) (6,711,000) (6,770,000) (6,883,000) (61,130,000)<br />
NET RENEWALS 8,859,000 11,107,000 9,594,000 9,766,000 9,768,000 10,334,000 10,410,000 11,153,000 11,378,000 11,544,000 103,913,000<br />
SUBSIDISED CAPITAL EXPENDITURE<br />
Minor Safety<br />
Professional Services: Minor Safety 35,000 36,000 37,000 38,000 38,000 39,000 40,000 40,000 41,000 41,000 385,000<br />
Minor Safety Projects 1,000,000 872,000 893,000 913,000 931,000 949,000 965,000 979,000 992,000 1,005,000 9,499,000<br />
Flush Median Development 0 0 0 0 0 0 0 0 0 0 0<br />
Slow Streets 100,000 103,000 105,000 107,000 110,000 112,000 114,000 115,000 117,000 118,000 1,101,000<br />
Safe Routes to Schools 15,000 15,000 16,000 16,000 16,000 17,000 17,000 17,000 18,000 18,000 165,000<br />
Traffic Safety Works for Schools 0 0 0 0 0 0 0 0 0 0 0<br />
Total 1,150,000 1,026,000 1,051,000 1,074,000 1,095,000 1,117,000 1,136,000 1,151,000 1,168,000 1,182,000 11,150,000<br />
Corridor Projects (Subsidised)<br />
Lincoln Road Widening (Completion) 178,000 0 0 0 0 0 0 0 0 0 178,000<br />
Lincoln Road Widening (Tasman /<br />
Sel Peacock) 780,000 0 0 0 0 0 0 0 0 0 780,000<br />
Scats & CCTV - optimisation 100,000 103,000 315,000 322,000 329,000 335,000 341,000 346,000 350,000 355,000 2,896,000<br />
Secondary Road Street Lighting 100,000 103,000 105,000 107,000 110,000 112,000 114,000 115,000 117,000 118,000 1,101,000<br />
SP & RTPIS - Scats intersections &<br />
bus stops 851,000 0 0 0 0 0 0 0 0 0 851,000<br />
Great North Road Corridor<br />
Great North Road - Titirangi 0 0 0 106,000 105,000 1,457,000 0 0 0 0 1,668,000<br />
Great North Road - West Coast 0 0 0 0 0 0 154,000 933,000 2,106,000 0 3,193,000<br />
Great North Road - Archibald /<br />
Glenview 0 0 0 0 97,000 725,000 1,341,000 0 0 0 2,163,000<br />
Great North Road - Glenview 0 0 0 0 0 0 0 127,000 1,103,000 1,732,000 2,962,000<br />
Great North Road - View 0 0 0 0 0 17,000 232,000 0 0 0 249,000<br />
Great North Road - View /<br />
James Laurie 0 0 0 0 0 36,000 486,000 0 0 0 522,000<br />
31
APPENDIX 1: Budgeted <strong>Transport</strong> Programme 2006-2016<br />
CAPITAL EXPENDITURE continued<br />
Details 2006/2007 2007/2008 2008/2009 2009/2010 2010/2011 2011/2012 2012/2013 2013/2014 2014/2015 2015/2016 10 Years<br />
LTCCP LTCCP LTCCP LTCCP LTCCP LTCCP LTCCP LTCCP LTCCP LTCCP LTCCP<br />
Great North Road - Te Atatu 0 0 0 0 0 0 0 28,000 65,000 379,000 472,000<br />
Great North Road - McLeod 0 0 0 0 0 3,000 42,000 0 0 0 45,000<br />
Great North Road - Edmonton /<br />
Ratanui 590,000 0 0 0 0 0 0 0 0 0 590,000<br />
Great North Road - Railside 353,000 0 0 0 0 0 0 0 0 0 353,000<br />
Great North Road - Henderson Valley 25,000 0 0 0 0 0 0 0 0 0 25,000<br />
Lincoln Road Corridor<br />
SH 16 Interchange 91,000 190,000 0 0 2,006,000 2,044,000 0 0 0 0 4,331,000<br />
Triangle 303,000 630,000 840,000 859,000 1,643,000 1,674,000 0 0 0 0 5,949,000<br />
Universal 2,000,000 2,652,000 0 0 0 0 0 0 0 0 4,652,000<br />
Pomaria 0 0 0 29,000 59,000 142,000 144,000 617,000 625,000 0 1,616,000<br />
Norval 0 0 0 85,000 58,000 59,000 593,000 602,000 0 0 1,397,000<br />
Sel Peacock 0 0 0 81,000 196,000 199,000 566,000 575,000 0 0 1,617,000<br />
Swanson 0 0 0 0 999,000 209,000 213,000 2,304,000 2,334,000 0 6,059,000<br />
Te Atatu Road Corridor<br />
Te Atatu / Edmonton : Layout &<br />
signal 251,000 403,000 1,587,000 0 0 0 0 0 0 0 2,241,000<br />
Te Atatu / Vera : Layout & signal 225,000 392,000 1,007,000 0 0 0 0 0 0 0 1,624,000<br />
Te Atatu / Jaemont bridge 26,000 114,000 207,000 1,094,000 0 0 0 0 0 0 1,441,000<br />
Te Atatu SH16 Ramps 71,000 323,000 597,000 3,051,000 0 0 0 0 0 0 4,042,000<br />
Te Atatu / Gloria Ave : Improvement 0 0 0 0 0 0 16,000 216,000 0 0 232,000<br />
Te Atatu / Gunner / Yeovil : New<br />
Roundabout 0 0 0 0 0 39,000 528,000 0 0 0 567,000<br />
Hobsonville Road Corridor<br />
Buckley M/way Ramps 1,000,000 0 0 0 0 0 0 0 0 0 1,000,000<br />
NORSGA Hobsonville - Roads 0 0 210,000 0 0 0 0 0 0 0 210,000<br />
Titirangi Road Corridor<br />
Titirangi / Margan : Layout & signal 0 0 0 0 0 0 0 147,000 292,000 2,005,000 2,444,000<br />
Titirangi / Rail line widening 193,000 257,000 2,687,000 0 0 0 0 0 0 0 3,137,000<br />
Western Bypass<br />
Ranui Station Road - Marinich<br />
extension. 0 0 0 113,000 53,000 716,000 0 0 0 0 882,000<br />
Swanson / Marinich : New<br />
Roundabout 0 0 0 0 42,000 279,000 581,000 0 0 0 902,000<br />
Glen Road - Waitemata extension<br />
& bridge 0 0 0 0 0 0 0 87,000 350,000 1,180,000 1,617,000<br />
Miscellaneous Corridor Projects.<br />
Central Park Drive - School Road 0 0 0 0 0 0 0 16,000 217,000 0 233,000<br />
Don Buck - Red Hills Roundabout 675,000 0 0 0 0 0 0 0 0 0 675,000<br />
Margan Project - Rankin 0 0 0 0 0 0 0 19,000 22,000 254,000 295,000<br />
Pleasant Road / Atkinson 0 0 0 0 0 0 0 6,000 76,000 0 82,000<br />
Rata / Rimu Streets - New layout<br />
& signals 0 0 0 0 0 0 16,000 214,000 0 0 230,000<br />
Rata / Bested Streets - New layout<br />
& signals 0 0 0 0 0 0 26,000 354,000 0 0 380,000<br />
SH 16 Lincoln/Te Atatu Roads -<br />
contribution to Transit 0 0 105,000 107,000 0 0 0 0 0 0 212,000<br />
Henderson Valley - Border /<br />
Forest Hill 0 0 0 0 0 63,000 198,000 866,000 0 0 1,127,000<br />
Carry Forward 194,000 194,000<br />
Swanson Road - Universal / Don<br />
Buck Roundabout 0 0 0 0 0 0 0 137,000 814,000 1,866,000 2,817,000<br />
Swanson Road - Larnoch Roundabout 0 0 0 0 0 0 41,000 39,000 564,000 0 644,000<br />
Swanson Road - Sturges New layout 0 0 0 0 0 44,000 170,000 607,000 0 0 821,000<br />
Te Pai / Waipareira : Layout & signal 0 0 0 0 0 0 0 0 16,000 220,000 236,000<br />
Triangle / Makora 0 0 0 0 0 0 0 20,000 271,000 0 291,000<br />
32
APPENDIX 1: Budgeted <strong>Transport</strong> Programme 2006-2016<br />
CAPITAL EXPENDITURE continued<br />
Details 2006/2007 2007/2008 2008/2009 2009/2010 2010/2011 2011/2012 2012/2013 2013/2014 2014/2015 2015/2016 10 Years<br />
LTCCP LTCCP LTCCP LTCCP LTCCP LTCCP LTCCP LTCCP LTCCP LTCCP LTCCP<br />
Central Park Drive - extension to<br />
Te Atatu Rd 18,000 137,000 366,000 0 0 0 0 0 0 0 521,000<br />
Central Park Edmonton - Layout 0 153,000 788,000 2,127,000 0 0 0 0 0 0 3,068,000<br />
Westgate Drive / Route Improvement 42,000 573,000 0 0 0 0 0 0 0 0 615,000<br />
Westgate - Bridge south of shopping<br />
complex 0 0 0 0 0 0 318,000 922,000 2,171,000 2,199,000 5,610,000<br />
Titirangi Town Centre<br />
Titirangi Town Centre : Clearway &<br />
speed humps 0 0 0 27,000 27,000 0 0 0 0 0 54,000<br />
Titirangi TC : South Titirangi Rd<br />
Intersec. Layout & signal 0 0 0 38,000 509,000 0 0 0 0 0 547,000<br />
Henderson Town Centre<br />
Henderson Town Centre -<br />
Edmonton/Alderman 2,820,000 0 0 0 0 0 0 0 0 0 2,820,000<br />
Henderson Town Centre -<br />
Trading Place 1,860,000 0 0 0 0 0 0 0 0 0 1,860,000<br />
Henderson Town Centre -<br />
Alderman at Falls 83,000 1,126,000 0 0 0 0 0 0 0 0 1,209,000<br />
Henderson Town Centre -<br />
Sel Peacock/Alderman 151,000 1,302,000 0 0 0 0 0 0 0 0 1,453,000<br />
Henderson TC - Way Finding 353,000 149,000 162,000 0 0 0 0 0 0 0 664,000<br />
Henderson Town Centre -<br />
Alderman/Ratanui 5,000 72,000 0 0 0 0 0 0 0 0 77,000<br />
Henderson Town Centre -<br />
Hickory - Tunnel 0 0 0 0 307,000 4,152,000 0 0 0 0 4,459,000<br />
Henderson Town Centre -<br />
Hickory/Dora or Cranwell link 0 0 0 0 630,000 1,155,000 4,339,000 4,404,000 0 0 10,528,000<br />
Henderson Town Centre -<br />
View / Vitasovitch 0 0 0 0 0 0 201,000 38,000 1,371,000 1,389,000 2,999,000<br />
Henderson Town Centre -<br />
extension to McLeod 0 0 55,000 805,000 764,000 0 0 0 0 0 1,624,000<br />
Henderson Town Centre -<br />
Railway Station 500,000 0 0 0 0 0 0 0 0 0 500,000<br />
New Lynn Town Centre<br />
Memorial extension to Clark 48,000 51,000 666,000 0 0 0 0 0 0 0 765,000<br />
Portage Road Property Access 1,000,000 1,539,000 1,576,000 0 0 0 0 0 0 0 4,115,000<br />
Hetana extension to Crown Lynn 70,000 1,026,000 977,000 0 0 0 0 0 0 0 2,073,000<br />
Clark extension to Gt North 18,000 77,000 248,000 0 0 0 0 0 0 0 343,000<br />
Clark Extension - Bridge over railway 221,000 0 1,539,000 1,573,000 0 0 0 0 0 0 3,333,000<br />
Clark / Rankin 27,000 103,000 373,000 0 0 0 0 0 0 0 503,000<br />
Totara / Rankin 4,000 0 59,000 0 0 0 0 0 0 0 63,000<br />
Clark - Widen Crown Lynn to Rankin 105,000 0 1,466,000 0 0 0 0 0 0 0 1,571,000<br />
Gt North Road / Totara 0 0 0 0 0 0 0 0 0 118,000 118,000<br />
Gt North - Memorial to Veronica -<br />
calming 0 0 0 0 77,000 0 0 1,071,000 0 0 1,148,000<br />
Crown Lynn - extension to Rankin 0 0 0 0 0 0 32,000 115,000 434,000 0 581,000<br />
Portage/Wolverton/Clark/Astley -<br />
enlarge 0 0 0 0 0 0 0 0 0 141,000 141,000<br />
Railway Station - lighting, safety etc 88,000 90,000 1,221,000 1,248,000 0 0 0 0 0 0 2,647,000<br />
Railway Station - contribution to<br />
underground 0 15,390,000 15,759,000 10,737,000 0 0 0 0 0 0 41,886,000<br />
Bus Interchange 518,000 531,000 244,000 250,000 0 0 0 0 0 0 1,543,000<br />
Norsga Westgate Town Centre<br />
Westgate Town Centre - Road<br />
Network 50,000 0 0 0 0 0 0 0 0 0 50,000<br />
Westgate Town Centre -<br />
Hobsonville Road Develop 100,000 346,000 358,000 1,298,000 1,324,000 0 0 0 0 0 3,426,000<br />
33
APPENDIX 1: Budgeted <strong>Transport</strong> Programme 2006-2016<br />
CAPITAL EXPENDITURE continued<br />
Details 2006/2007 2007/2008 2008/2009 2009/2010 2010/2011 2011/2012 2012/2013 2013/2014 2014/2015 2015/2016 10 Years<br />
LTCCP LTCCP LTCCP LTCCP LTCCP LTCCP LTCCP LTCCP LTCCP LTCCP LTCCP<br />
Westgate Town Centre -<br />
Fernhill Extension 0 0 355,000 0 370,000 1,297,000 1,319,000 0 0 0 3,341,000<br />
Westgate Town Centre -<br />
Northside Drive 0 0 355,000 0 370,000 1,297,000 1,319,000 0 0 0 3,341,000<br />
Westgate Town Centre -<br />
Bus Interchange 0 0 281,000 0 293,000 259,000 264,000 0 0 0 1,097,000<br />
Westgate Town Centre -<br />
200 Space Park and Ride 0 0 580,000 0 605,000 778,000 792,000 0 0 0 2,755,000<br />
Norsga Hobsonville Town Centre<br />
Roading Network 100,000 0 0 0 0 0 0 0 0 0 100,000<br />
Bus Interchange - land, signs, shelters 0 0 281,000 0 0 299,000 264,000 268,000 0 0 1,112,000<br />
200 Space Park and Ride 0 0 0 0 0 0 0 596,000 271,000 275,000 1,142,000<br />
Travel Demand Management<br />
Road Pricing Study 10,000 10,000 11,000 11,000 11,000 11,000 11,000 12,000 12,000 12,000 111,000<br />
Charged Car Park Trials 150,000 0 0 0 164,000 0 0 0 0 0 314,000<br />
Community Travel Plans 0 0 0 0 164,000 0 170,000 0 0 0 334,000<br />
Business Travel Plans 100,000 0 0 0 0 0 0 0 0 0 100,000<br />
School Travel Plans 800,000 821,000 840,000 859,000 876,000 893,000 908,000 922,000 934,000 946,000 8,799,000<br />
Bus Priority Works<br />
Henderson Station 450,000 0 0 0 0 0 0 0 0 0 450,000<br />
Great North (Lincoln-Portage) 0 531,000 544,000 3,149,000 3,212,000 0 0 0 0 0 7,436,000<br />
New Lynn Station Entry/Exit 0 0 132,000 135,000 782,000 797,000 0 0 0 0 1,846,000<br />
Clark Street 0 0 99,000 101,000 586,000 598,000 0 0 0 0 1,384,000<br />
Westgate 0 0 0 0 123,000 126,000 724,000 734,000 0 0 1,707,000<br />
Hobsonville Road (Fernlea-Buckley) 0 0 0 0 0 0 258,000 262,000 1,503,000 1,522,000 3,545,000<br />
Edmonton 0 0 0 0 0 0 133,000 135,000 774,000 784,000 1,826,000<br />
Royal Road 0 0 0 0 0 0 92,000 93,000 536,000 543,000 1,264,000<br />
Ferries<br />
West Harbour Ferry 0 0 0 0 0 0 0 0 0 591,000 591,000<br />
Hobsonville Ferry 0 0 0 0 1,095,000 0 0 0 0 0 1,095,000<br />
Double Tracking<br />
Double Tracking - Henderson /<br />
Fruitvale : Bridge 150,000 257,000 0 0 0 0 0 0 0 0 407,000<br />
Railway Station Improvements<br />
Access, lighting etc - <strong>Waitakere</strong> 0 0 0 0 0 670,000 0 0 0 0 670,000<br />
Access, lighting etc - Swanson 100,000 513,000 0 0 0 0 0 0 0 0 613,000<br />
Access, lighting etc - Sturges Road 100,000 513,000 0 0 0 0 0 0 0 0 613,000<br />
Access, lighting etc - Ranui 0 0 630,000 0 0 0 0 0 0 0 630,000<br />
Access, lighting etc - Glen Eden 0 0 0 515,000 0 0 0 0 0 0 515,000<br />
Access, lighting etc - Sunnyvale 0 0 0 526,000 0 0 0 0 0 0 526,000<br />
Miscellaneous Passenger <strong>Transport</strong><br />
Brigham Creek Bus Interchange 0 0 0 0 0 0 0 0 0 591,000 591,000<br />
Bus Shelter Construction 125,000 128,000 131,000 134,000 137,000 140,000 142,000 144,000 146,000 148,000 1,375,000<br />
Bus Stop Improvements 25,000 26,000 26,000 27,000 27,000 28,000 28,000 29,000 29,000 30,000 275,000<br />
Walk <strong>Strategy</strong> Works (Subsidised)<br />
Pedestrian Islands 50,000 51,000 53,000 54,000 55,000 56,000 57,000 58,000 58,000 59,000 551,000<br />
Pedestrian Signals 340,000 349,000 357,000 365,000 372,000 379,000 386,000 392,000 397,000 402,000 3,739,000<br />
Lighting Improvement 120,000 108,000 21,000 21,000 22,000 22,000 23,000 23,000 23,000 24,000 407,000<br />
Cycle <strong>Strategy</strong> Works (Subsidised)<br />
Cycleway North West Extension 158,000 0 0 0 0 0 0 0 0 0 158,000<br />
Cycleway Bus Bike Lanes 0 9,000 409,000 111,000 449,000 664,000 588,000 305,000 501,000 0 3,036,000<br />
Cycleway Committed Projects 3,140,000 0 0 0 0 0 0 0 0 0 3,140,000<br />
Cycleway On Road Cycle Lanes 276,000 1,251,000 1,072,000 932,000 687,000 690,000 641,000 657,000 257,000 0 6,463,000<br />
Cycleway Off-Road Routes 510,000 145,000 455,000 1,093,000 1,163,000 893,000 568,000 115,000 0 0 4,942,000<br />
34
APPENDIX 1: Budgeted <strong>Transport</strong> Programme 2006-2016<br />
CAPITAL EXPENDITURE continued<br />
Details 2006/2007 2007/2008 2008/2009 2009/2010 2010/2011 2011/2012 2012/2013 2013/2014 2014/2015 2015/2016 10 Years<br />
LTCCP LTCCP LTCCP LTCCP LTCCP LTCCP LTCCP LTCCP LTCCP LTCCP LTCCP<br />
Passenger <strong>Transport</strong> Works (Subsidised)<br />
Signal Pre-emption for Buses 1,013,000 0 0 0 0 0 0 0 0 0 1,013,000<br />
New Lynn Transit Exchange 300,000 0 0 0 0 0 0 0 0 0 300,000<br />
Regional Integrated Traffic<br />
Management 276,000 0 0 0 0 0 0 0 0 0 276,000<br />
AIS Study 0 0 158,000 0 0 167,000 0 0 175,000 0 500,000<br />
AIS Safety Physical Works 600,000 616,000 630,000 644,000 657,000 670,000 681,000 691,000 700,000 709,000 6,598,000<br />
Total 24,980,000 33,160,000 40,937,000 32,734,000 21,555,000 24,194,000 20,060,000 20,361,000 19,614,000 18,592,000 256,187,000<br />
Henderson Network (Subsidised)<br />
Alderman Drive Bridge 100,000 0 0 0 0 0 0 0 0 0 100,000<br />
Edmonton / Alderman Roundabout 170,000 0 0 0 0 0 0 0 0 0 170,000<br />
Henderson Transit Exchange 923,000 0 0 0 0 0 0 0 0 0 923,000<br />
Total 1,193,000 0 0 0 0 0 0 0 0 0 1,193,000<br />
Integrated Network Investigations (Subsidised)<br />
Strategic Road<br />
Corridors 416,000 154,000 158,000 161,000 164,000 167,000 170,000 173,000 175,000 177,000 1,915,000<br />
Bus Corridor <strong>Strategy</strong> Studies 270,000 0 0 0 0 0 0 0 0 0 270,000<br />
Whau River 0 0 0 0 429,000 438,000 0 0 0 0 867,000<br />
Carry Forward 545,000 545,000<br />
Total 1,231,000 154,000 158,000 161,000 593,000 605,000 170,000 173,000 175,000 177,000 3,597,000<br />
Flood Damage<br />
Flood Damage Miscellaneous 1,000,000 1,026,000 1,050,000 859,000 876,000 893,000 908,000 922,000 934,000 946,000 9,414,000<br />
Total 1,000,000 1,026,000 1,050,000 859,000 876,000 893,000 908,000 922,000 934,000 946,000 9,414,000<br />
Contributions<br />
Contribution to Subdividers 250,000 257,000 263,000 268,000 274,000 279,000 284,000 288,000 292,000 296,000 2,751,000<br />
Total 250,000 257,000 263,000 268,000 274,000 279,000 284,000 288,000 292,000 296,000 2,751,000<br />
Facilities Upgrade<br />
Rail Crossing 250,000 51,000 0 0 0 0 0 0 0 0 301,000<br />
Utility Relocations - for safety 100,000 103,000 105,000 107,000 110,000 112,000 114,000 115,000 117,000 118,000 1,101,000<br />
Road Drainage Extensions 350,000 359,000 368,000 376,000 383,000 391,000 397,000 403,000 408,000 414,000 3,849,000<br />
Total 700,000 513,000 473,000 483,000 493,000 503,000 511,000 518,000 525,000 532,000 5,251,000<br />
Total Subsidised<br />
Capital Expenditure 30,504,000 36,136,000 43,932,000 35,579,000 24,886,000 27,591,000 23,069,000 23,413,000 22,708,000 21,725,000 289,543,000<br />
UNSUBSIDISED CAPITAL EXPENDITURE<br />
Corridor Projects (Not subsidised)<br />
Harbourview Park Te Atatu Road 220,000 0 0 0 0 0 0 0 0 0 220,000<br />
Don Buck / Red Hills Road Intersection 100,000 0 0 0 0 0 0 0 0 0 100,000<br />
Coronation Bridge 397,000 0 0 0 0 0 0 0 0 0 397,000<br />
Artworks for Paremuka (Munroe) Bridge 380,000 0 0 0 0 0 0 0 0 0 380,000<br />
State Highway 16/18 Artwork 0 103,000 265,000 272,000 0 0 0 0 0 0 640,000<br />
Total 1,097,000 103,000 265,000 272,000 0 0 0 0 0 0 1,737,000<br />
Hobsonville Network (Not subsidised)<br />
Hobsonville Detailed Design 188,000 0 0 0 0 0 0 0 0 0 188,000<br />
Total 188,000 0 0 0 0 0 0 0 0 0 188,000<br />
Henderson Network (Not subsidised)<br />
Streetscape : Great North Road -<br />
Henderson Valley to Edmonton 1,710,000 1,170,000 0 0 0 0 0 0 0 0 2,880,000<br />
Corban Estate Access Road 0 5,145,000 0 0 0 0 0 0 0 0 5,145,000<br />
Corbans Heritage Tram<br />
(detail development design) 0 0 26,000 0 0 0 0 0 0 0 26,000<br />
Corbans Heritage Tram<br />
(Construction and Site Infrastructure) 0 0 0 1,083,000 1,108,000 0 0 0 0 0 2,191,000<br />
35
APPENDIX 1: Budgeted <strong>Transport</strong> Programme 2006-2016<br />
CAPITAL EXPENDITURE continued<br />
Details 2006/2007 2007/2008 2008/2009 2009/2010 2010/2011 2011/2012 2012/2013 2013/2014 2014/2015 2015/2016 10 Years<br />
LTCCP LTCCP LTCCP LTCCP LTCCP LTCCP LTCCP LTCCP LTCCP LTCCP LTCCP<br />
<strong>Waitakere</strong> Central Car Park building<br />
(Detailed Development Design) 0 772,000 0 0 0 0 0 0 0 0 772,000<br />
<strong>Waitakere</strong> Central Car Park building<br />
(Construction and Site Infrastructure) 0 0 15,852,000 0 0 0 0 0 0 0 15,852,000<br />
Henderson Signs & Wayfinding Plan 100,000 0 0 0 0 0 0 0 0 0 100,000<br />
Henderson Carparks, Charge<br />
Carparking Trial 62,000 0 0 0 0 0 0 0 0 0 62,000<br />
Henderson Gateway Entrance 0 0 106,000 0 0 0 0 0 0 0 106,000<br />
Henderson Median 334,000 0 0 0 0 0 0 0 0 0 334,000<br />
Total 2,206,000 7,087,000 15,984,000 1,083,000 1,108,000 0 0 0 0 0 27,468,000<br />
New Lynn Network (Not subsidised)<br />
New Lynn <strong>Transport</strong> Design 100,000 0 0 0 0 0 0 0 0 0 100,000<br />
New Lynn <strong>Transport</strong> Interchange<br />
land purchase and concept 2,750,000 1,029,000 0 0 0 0 0 0 0 0 3,779,000<br />
McNaughton Way Extn (land purchase) 0 1,029,000 0 0 0 0 0 0 0 0 1,029,000<br />
McNaughton Way Extn Urban<br />
Design and Concept Design) 0 0 528,000 0 0 0 0 0 0 0 528,000<br />
New Lynn Way Finding Graphic<br />
Audit and Signange Implementation 0 72,000 21,000 16,000 0 0 0 0 0 0 109,000<br />
Total 2,850,000 2,130,000 549,000 16,000 0 0 0 0 0 0 5,545,000<br />
Urban Villages Networks (Not subsidised)<br />
Titirangi Village Off-road Parking 318,000 0 0 0 0 0 0 0 0 0 318,000<br />
Total 318,000 0 0 0 0 0 0 0 0 0 318,000<br />
Contract Settlements (Not subsidised)<br />
Marinich Drive Financial Contribution 2,000,000 0 0 0 0 0 0 0 0 0 2,000,000<br />
Total 2,000,000 0 0 0 0 0 0 0 0 0 2,000,000<br />
Street Lighting<br />
Fibre Optic Communications 100,000 103,000 105,000 107,000 110,000 112,000 114,000 115,000 117,000 118,000 1,101,000<br />
Solar Lighting 30,000 31,000 32,000 32,000 33,000 33,000 34,000 35,000 35,000 35,000 330,000<br />
Improved Illumination in Local Roads 505,000 518,000 531,000 542,000 553,000 564,000 573,000 582,000 589,000 597,000 5,554,000<br />
Street Light Reliability Improvement 100,000 0 0 0 0 0 0 0 0 0 100,000<br />
New Street Lights 100,000 103,000 105,000 107,000 110,000 112,000 114,000 115,000 117,000 118,000 1,101,000<br />
Energy Efficient Lighting 50,000 51,000 221,000 225,000 230,000 234,000 0 0 0 0 1,011,000<br />
Total 885,000 806,000 994,000 1,013,000 1,036,000 1,055,000 835,000 847,000 858,000 868,000 9,197,000<br />
Land Purchase & Construction<br />
Carry Forward 500,000 500,000<br />
Road Reserves General 40,000 41,000 42,000 43,000 44,000 45,000 46,000 47,000 48,000 48,000 444,000<br />
Total 540,000 41,000 42,000 43,000 44,000 45,000 46,000 47,000 48,000 48,000 944,000<br />
Forward Design<br />
Forward Design for Benefit Cost Ratios 150,000 154,000 158,000 161,000 164,000 167,000 170,000 173,000 175,000 177,000 1,649,000<br />
Forward Design of Capital Works 350,000 359,000 368,000 376,000 383,000 391,000 397,000 403,000 408,000 414,000 3,849,000<br />
Carry Forward 200,000 200,000<br />
Asset Management System Integration<br />
and Optimisation 100,000 103,000 105,000 107,000 110,000 112,000 114,000 115,000 117,000 118,000 1,101,000<br />
Total 800,000 616,000 631,000 644,000 657,000 670,000 681,000 691,000 700,000 709,000 6,799,000<br />
Facility Upgrading (not subsidised)<br />
Facilities for the Disabled 10,000 10,000 11,000 11,000 11,000 11,000 11,000 12,000 12,000 12,000 111,000<br />
Footpath Construction 850,000 513,000 525,000 537,000 548,000 558,000 568,000 576,000 584,000 591,000 5,850,000<br />
Seal Extensions (Non-Subsidised) 300,000 308,000 315,000 322,000 329,000 335,000 341,000 346,000 350,000 355,000 3,301,000<br />
Lifelines 0 51,000 0 54,000 0 56,000 0 58,000 0 59,000 278,000<br />
Total 1,160,000 882,000 851,000 924,000 888,000 960,000 920,000 992,000 946,000 1,017,000 9,540,000<br />
36
APPENDIX 1: Budgeted <strong>Transport</strong> Programme 2006-2016<br />
CAPITAL EXPENDITURE continued<br />
Details 2006/2007 2007/2008 2008/2009 2009/2010 2010/2011 2011/2012 2012/2013 2013/2014 2014/2015 2015/2016 10 Years<br />
LTCCP LTCCP LTCCP LTCCP LTCCP LTCCP LTCCP LTCCP LTCCP LTCCP LTCCP<br />
Carried Forward Passenger <strong>Transport</strong> works<br />
Ranui<br />
<strong>Transport</strong> Amenity 172,000 0 0 0 0 0 0 0 0 0 172,000<br />
Sturges Park and Ride 494,000 0 0 0 0 0 0 0 0 0 494,000<br />
Railway Park and Ride 930,000 0 0 0 0 0 0 0 0 0 930,000<br />
Bus Park and Ride 100,000 0 0 0 0 0 0 0 0 0 100,000<br />
Railway Stations 40,000 164,000 0 0 0 0 0 0 0 0 204,000<br />
Ferry facilities & Park and Ride 100,000 0 0 0 0 0 0 0 0 0 100,000<br />
Henderson Park and Ride 58,000 0 0 0 0 0 0 0 0 0 58,000<br />
Bus Signs Improvements 85,000 0 0 0 0 0 0 0 0 0 85,000<br />
New Lynn Town Centre <strong>Transport</strong><br />
Interchange and Road Development 3,344,000 0 0 0 0 0 0 0 0 0 3,344,000<br />
Travel Demand Management Plans 200,000 0 0 0 0 0 0 0 0 0 200,000<br />
Henderson Railside Avenue/Ratanui<br />
Street to Cromwell Park Pedestrian<br />
Amenity 327,000 0 0 0 0 0 0 0 0 0 327,000<br />
Railway Stations Precinct Fruitvale,<br />
Glen Eden and Sunnyvale 286,000 1,172,000 0 0 0 0 0 0 0 0 1,458,000<br />
School Travel Plans - Implementation 530,000 0 0 0 0 0 0 0 0 0 530,000<br />
Business Travel Plans - Implementation 319,000 0 0 0 0 0 0 0 0 0 319,000<br />
<strong>Waitakere</strong> Central Henderson<br />
<strong>Transport</strong> Interchange 100,000 0 0 0 0 0 0 0 0 0 100,000<br />
Sunnyvale Railway Park and Ride 1,000,000 0 0 0 0 0 0 0 0 0 1,000,000<br />
Westgate Bus Park and Ride 100,000 0 0 0 0 0 0 0 0 0 100,000<br />
Henderson - Great North Road<br />
Amenity Improvements Design 10,000 0 0 0 0 0 0 0 0 0 10,000<br />
Glen Eden Station 63,000 0 0 0 0 0 0 0 0 0 63,000<br />
Total 8,258,000 1,336,000 0 0 0 0 0 0 0 0 9,594,000<br />
Walkways, Streetscape & Station Precinct<br />
Owens Green - 800m Leisure Route 0 0 0 0 0 0 0 0 0 36,000 36,000<br />
Manutewhau to Moire Park Leisure<br />
Route 0 0 0 0 0 0 0 0 0 18,000 18,000<br />
Harbourview Reserve - Leisure<br />
Route 300m 0 0 0 0 0 23,000 449,000 0 0 0 472,000<br />
Harbour View Development -<br />
Boardwalks & Landscaping 0 0 0 0 0 0 0 0 0 54,000 54,000<br />
Green Bay Parking (Barrons Green) 126,000 0 0 0 0 0 0 0 0 0 126,000<br />
Rewarewa Walkway - Upgrade<br />
Existing Pathway Section in New Lynn 60,000 0 0 0 0 0 0 0 0 0 60,000<br />
Te Atatu Peninsula Walkway<br />
Chapman to Taipari Strand 20,000 39,000 605,000 761,000 0 0 0 0 0 0 1,425,000<br />
Tui Glen Stage 2 -Parking pathways<br />
& landscaping 0 725,000 0 0 0 0 0 0 0 0 725,000<br />
Claret Close - Bridge to Opanuku<br />
Walkway 117,000 0 0 0 0 0 0 0 0 0 117,000<br />
New Lynn Town centre streetscape<br />
upgrade 100,000 0 0 0 0 0 0 0 0 0 100,000<br />
<strong>Waitakere</strong> Railway and Town Centre<br />
Duoloo 232,000 0 0 0 0 0 0 0 0 0 232,000<br />
Land purchase <strong>Waitakere</strong> Railway &<br />
precinct 200,000 0 0 0 0 0 0 0 0 0 200,000<br />
Hobsonville Esplanade walkway 0 0 0 0 0 0 0 49,000 433,000 274,000 756,000<br />
Hobsonville Esplanade walkway<br />
Developers land 0 0 0 0 0 0 0 938,000 0 0 938,000<br />
Total 855,000 764,000 605,000 761,000 0 23,000 449,000 987,000 433,000 382,000 5,259,000<br />
Testing Station<br />
Emission Testing Machine 15,000 0 0 0 0 0 0 0 0 0 15,000<br />
Total 15,000 0 0 0 0 0 0 0 0 0 15,000<br />
37
APPENDIX 1: Budgeted <strong>Transport</strong> Programme 2006-2016<br />
CAPITAL EXPENDITURE continued<br />
Details 2006/2007 2007/2008 2008/2009 2009/2010 2010/2011 2011/2012 2012/2013 2013/2014 2014/2015 2015/2016 10 Years<br />
LTCCP LTCCP LTCCP LTCCP LTCCP LTCCP LTCCP LTCCP LTCCP LTCCP LTCCP<br />
TOTAL NON-SUBSIDISED CAPITAL<br />
EXPENDITURE 21,172,000 13,765,000 19,921,000 4,756,000 3,733,000 2,753,000 2,931,000 3,564,000 2,985,000 3,024,000 78,604,000<br />
SUBSIDY ON CAPITAL EXPENDITURE<br />
Land <strong>Transport</strong> NZ Subsidy (16,486,000) (19,178,000) (24,327,000) (20,375,000) (14,131,000) (15,582,000) (12,225,000) (12,684,000) (12,314,000) (11,796,000) (159,098,000)<br />
Infrastructure <strong>Auckland</strong> Subsidy (1,531,000) (577,000) 0 0 0 0 0 0 0 0 (2,108,000)<br />
TOTAL SUBSIDY ON CAPITAL<br />
EXPENDITURE (18,017,000) (19,755,000) (24,327,000) (20,375,000) (14,131,000) (15,582,000) (12,225,000) (12,684,000) (12,314,000) (11,796,000) (161,206,000)<br />
TOTAL NET CAPITAL<br />
EXPENDITURE 33,659,000 30,146,000 39,526,000 19,960,000 14,488,000 14,762,000 13,775,000 14,293,000 13,379,000 12,953,000 206,941,000<br />
TOTAL NET CAPITAL<br />
EXPENDITURE & RENEWALS 42,518,000 41,253,000 49,120,000 29,726,000 24,256,000 25,096,000 24,185,000 25,446,000 24,757,000 24,497,000 310,854,000<br />
TOTAL GROSS CAPITAL<br />
EXPENDITURE & RENEWALS 65,661,000 67,500,000 79,062,000 55,782,000 44,192,000 46,657,000 42,478,000 44,841,000 43,841,000 43,176,000 533,190,000<br />
OPERATING COSTS<br />
Details 2006/2007 2007/2008 2008/2009 2009/2010 2010/2011 2011/2012 2012/2013 2013/2014 2014/2015 2015/2016 10 Years<br />
LTCCP LTCCP LTCCP LTCCP LTCCP LTCCP LTCCP LTCCP LTCCP LTCCP LTCCP<br />
Direct Costs 28,291,000 30,852,000 35,313,000 39,583,000 42,873,000 45,808,000 48,755,000 51,305,000 53,676,000 56,278,000 432,734,000<br />
Revenue (6,970,000) (7,528,000) (7,900,000) (9,848,000) (10,222,000) (10,632,000) (11,174,000) (11,504,000) (11,906,000) (12,443,000) (100,127,000)<br />
Net Operating Costs 21,321,000 23,324,000 27,413,000 29,735,000 32,651,000 35,176,000 37,581,000 39,801,000 41,770,000 43,835,000 332,607,000<br />
Note: <strong>Transport</strong> operating costs include depreciation, interest, maintenance (subsidised and unsubsidised), direct support costs, asset management, road safety, parking operations and<br />
enforcement, paths, streetscape and policy costs.<br />
Budgeted <strong>Transport</strong> Programme 2006-2016 - as at June 2006.<br />
38
APPENDIX 1: Budgeted <strong>Transport</strong> Programme 2006-2016<br />
Map 1: Passenger <strong>Transport</strong> Projects Budgeted 2006-2016<br />
FERRY FACILITIES<br />
2010-2011<br />
$1.1M<br />
HOBSONVILLE RD CORRIDOR<br />
2011-2016<br />
$5.8M<br />
FERRY FACILITIES<br />
PARK ‘N’ RIDE<br />
2006-2016<br />
$0.7M<br />
WESTGATE<br />
PARK ‘N’ RIDE<br />
TRANSPORT<br />
INTERCHANGE<br />
2008-2013<br />
$5.6M<br />
EDMONTON RD CORRIDOR<br />
2013-2016<br />
$1.8M<br />
TE ATATU RD CORRIDOR<br />
2006-2014<br />
$10.1M<br />
GT NORTH RD CORRIDOR<br />
2007-2011<br />
$7.4M<br />
BUS PRIORITY AND REAL<br />
TIME INFORMATION<br />
2006-2007<br />
$0.8M<br />
RAIL STATION<br />
UPGRADES &<br />
PARK ‘N’ RIDE<br />
2006-2012<br />
$8.0M<br />
NEW LYNN TRANSIT<br />
ORIENTED<br />
DEVELOPMENT<br />
2006-2010 $49.4M<br />
39
APPENDIX 1: Budgeted <strong>Transport</strong> Programme 2006-2016<br />
Map 2: Roading <strong>Transport</strong> Projects Budgeted 2006-2016<br />
SH16 EXTENSION<br />
2009-2013<br />
$37M<br />
HOBSONVILLE DEVIATION<br />
2007-2012<br />
$200M<br />
6-LANING SH16 TE ATATU<br />
TO ROYAL RD<br />
2012-2017<br />
$30M<br />
WESTERN<br />
BYPASS<br />
2010-2016<br />
$3.4M<br />
UNIVERSAL DRIVE<br />
EXTENSION<br />
2006-2008<br />
$4.7M<br />
EDMONTON-CENTRAL<br />
PARK INT.<br />
2008-2010<br />
$3.0M<br />
SH16 RAMP SIGNALLING<br />
2007-2008<br />
$12M<br />
TE ATATU INTERCHANGE<br />
OFF RAMP<br />
2012-2014<br />
$6.0M<br />
SWANSON-UNIVERSAL-DON<br />
BUCK ROUNDABOUT<br />
2014-2016<br />
$2.8M<br />
MARINCH DRIVE<br />
EXTENSION<br />
2009-2012<br />
$0.8M<br />
CENTRAL PARK-<br />
TE ATATU EXT.<br />
(DEVELOPS FUNDED 2008)<br />
$2.6M<br />
TAKAPU ST EXT.<br />
2009-2011<br />
$1.6M<br />
WATERVIEW<br />
TO TE ATATU<br />
2012-2015<br />
$73M<br />
WHAU CROSSING<br />
INVESTIGATION<br />
ONLY<br />
LINCOLN RD<br />
WIDENING<br />
2006-2007<br />
$1.0M<br />
HENDERSON<br />
VALLEY<br />
BORDER RD<br />
2012-2013<br />
$1.1M<br />
TITIRANGI RD RAIL<br />
BRIDGE & MARGIN<br />
2008-2016<br />
$5.5M<br />
40
41<br />
Map 3: Cycleway Projects Budgeted 2006-2016<br />
APPENDIX 1: Budgeted <strong>Transport</strong> Programme 2006-2016
APPENDIX 1: Budgeted <strong>Transport</strong> Programme 2006-2016<br />
Map 4: Henderson <strong>Transport</strong> Projects Budgeted 2006-2016<br />
1<br />
3<br />
3<br />
4<br />
2.<br />
Specific projects in<br />
Henderson include:<br />
Bus passenger<br />
amenities improved<br />
Bus priority measures<br />
<strong>Waitakere</strong> Central<br />
<strong>Transport</strong> Interchange<br />
Streetscape upgrade<br />
Proposed road<br />
connections<br />
Cycleways<br />
Rail double tracking<br />
New Roads & roading<br />
projects<br />
1. Corban Estate<br />
development access<br />
2. Edmonton-Trading Rd<br />
extension & bridge<br />
3. Hickory-Dora<br />
underpass<br />
4. Alderman bridge<br />
widening<br />
New traffic interchanges<br />
at:<br />
Sel Peacock-Alderman<br />
signalised interchange<br />
Corban-Henderson<br />
Valley signalised<br />
interchange<br />
Alderman-Ratanui<br />
interchange upgrade.<br />
Edmonton-Alderman<br />
signalised interchange<br />
42
APPENDIX 1: Budgeted <strong>Transport</strong> Programme 2006-2016<br />
Map 5: New Lynn <strong>Transport</strong> Projects Budgeted 2006-2016<br />
1<br />
5<br />
4<br />
2<br />
3<br />
Specific projects planned<br />
for New Lynn include:<br />
Below street-level<br />
railway station<br />
New bus interchange<br />
Bus priority measures<br />
Great North Road and<br />
Clark Street Projects<br />
Proposed road<br />
connections<br />
Rail below surface<br />
Cycleways<br />
Proposed new roads<br />
1. Clark Street extension<br />
2. Memorial Drive<br />
extension<br />
3. Hetana Street extension<br />
4. Crown Lynn Place<br />
extension and closure<br />
5. McNaughton Way<br />
extension<br />
New traffic<br />
interchanges at:<br />
Clark St/ Great North<br />
Road<br />
Totara/Rankin/Clark St<br />
Totara/Great<br />
North Road<br />
Memorial/Clark St<br />
Portage/Wolverton/<br />
Clark<br />
43
APPENDIX 1: Budgeted <strong>Transport</strong> Programme 2006-2016<br />
Map 6: Westgate <strong>Transport</strong> Projects Budgeted 2006-2016<br />
(on Massey North Conceptual Development)<br />
44
Appendix 2: Background to<br />
Strategic Options<br />
The following three strategic options were developed and<br />
consulted on to enable an informed choice to be made<br />
about the level of investment in transport and the balance<br />
of that investment.<br />
Strategic Option 1 – Minimal road investment:<br />
High demand management approach<br />
This option is a more accelerated approach to managing<br />
travel demand than that contemplated in the <strong>Auckland</strong><br />
Regional Land <strong>Transport</strong> <strong>Strategy</strong> 2005. This option<br />
requires a significant shift out of the motor vehicle to use<br />
of passenger transport. This would be actively promoted<br />
to residents.<br />
The aim is to reduce the number of cars on the road and<br />
the number of vehicle kilometres travelled per resident.<br />
Current levels of traffic congestion would be expected to<br />
continue in the long term. This option aims to reduce traffic<br />
on selected arterial roads where high-occupancy vehicle<br />
(HOV) lanes would take up an existing lane of traffic at peak<br />
times.<br />
This option requires a low investment in roading and<br />
a substantial investment in passenger transport. Road<br />
investment would be limited to new connections which<br />
enable new businesses to establish rather than to make<br />
traffic flow better. High-cost projects would be excluded<br />
from the programme, for example: road widening to<br />
increase efficiency, most new road connections, New Lynn<br />
Transit Orientated Design project, Whau Crossing bridge<br />
and half the cycle network.<br />
Strategic Option 2 – Selected road investment:<br />
Medium demand management approach<br />
This option provides less investment in the arterial roads<br />
than contemplated under the <strong>Auckland</strong> Regional Land<br />
<strong>Transport</strong> <strong>Strategy</strong> 2005. The aim is to provide some<br />
road connections, but to use the existing road network to<br />
manage traffic, buses and high-occupancy vehicles.<br />
This option requires a shift to passenger transport for traffic<br />
to flow on the road network at peak times. This option<br />
requires a low investment in roading and a substantial<br />
investment in passenger transport. Road investment<br />
would be focused on town centre connections and<br />
arterial improvements to enable HOV lanes. An existing<br />
lane on selected arterial roads would be used for buses<br />
and high-occupancy vehicles at peak times with limited<br />
improvements at intersections. This approach would not<br />
provide extra capacity on arterial roads.<br />
This option includes the New Lynn Transit Orientated<br />
Design project. Some high-cost projects are excluded<br />
from the programme, for example: road widening and<br />
intersection treatment to increase efficiency, and half the<br />
cycle network.<br />
Strategic Option 3 – Balanced road<br />
investment: Travel choice<br />
This option is the most closely aligned with the <strong>Auckland</strong><br />
Regional Land <strong>Transport</strong> <strong>Strategy</strong> 2005. The aim is to reduce<br />
congestion in parts of the road network and to give people<br />
the choice to use passenger transport. Traffic congestion<br />
will be addressed by increasing road connections in town<br />
centres and disconnected neighbourhoods, addressing<br />
congestion at selected intersections and improving traffic<br />
flow on the arterial road network. This approach requires<br />
the provision of alternative modes of travel. This option<br />
aims to increase the traffic efficiency on arterial roads with<br />
options for bus and HOV lanes and some road widening.<br />
This option includes the New Lynn Transit Orientated<br />
Design project. New road connections would be created<br />
45
APPENDIX 2: Background to Strategic Options<br />
to generate new businesses and to improve traffic flow in<br />
the network. Some road widening on arterial roads would<br />
be done to enable bus priority measures and increase the<br />
traffic efficiency on arterial roads.<br />
This option is expected to provide increased efficiency and<br />
ease congestion at key parts of the roading network. The<br />
arterial roads would be better able to manage the traffic<br />
entering and exiting the state highway network. Measures<br />
such as congestion charges would be required for<br />
significant numbers of people to shift to more sustainable<br />
forms of transport.<br />
This is a balanced programme with travel demand<br />
management and investment in all modes increasing the<br />
efficiency of the road network.<br />
The key distinguishing factors between these strategic<br />
options were:<br />
• The extent to which there is road widening and road<br />
connections in order to address congestion and<br />
efficiency issues.<br />
• The ‘choice’ or ‘push’ to shift from a single-occupant<br />
vehicle to other modes of travel.<br />
• The size of the programme in terms of the Council’s<br />
financial investment.<br />
<strong>Waitakere</strong> <strong>City</strong> Council adopted option 3 as its preferred<br />
option. A number of options were considered prior to the<br />
development of the three strategic options:<br />
a. Carry on as we are.<br />
b. The programme modelled for the <strong>Auckland</strong> Regional<br />
Land <strong>Transport</strong> <strong>Strategy</strong> 2005.<br />
c. A modification of the programme modelled for the<br />
<strong>Auckland</strong> Regional Land <strong>Transport</strong> <strong>Strategy</strong> 2005 to take<br />
into account <strong>Waitakere</strong>’s particular issues, requirements<br />
and ability to pay:<br />
i. <strong>City</strong> form and land use initiatives, such as the<br />
creation of a major town centre at Westgate, civilian<br />
airport at Whenuapai, and new schools in the north<br />
west, which provide significant transport benefits.<br />
ii. Business location and transport of goods and<br />
services.<br />
iii. Preparation for road pricing.<br />
iv. Advocacy positions.<br />
d. Doing more or less than the programme proposed in the<br />
<strong>Auckland</strong> Regional Land <strong>Transport</strong> <strong>Strategy</strong> 2005.<br />
e. Greater emphasis on local economic development.<br />
f. Greater emphasis on a particular mode of transport (for<br />
example, roading - Increase the capacity of the roading<br />
network as a priority to address congestion).<br />
Carry on as we are<br />
The ‘steady as she goes’ approach essentially means that<br />
the Council would carry on with the same focus and priority<br />
as in previous years.<br />
Historically, the vast majority of Council expenditure has<br />
been on road maintenance and new connections, such as<br />
the Munroe Bridge.<br />
Funding on passenger transport infrastructure has typically<br />
been low, although the Council has recently increased<br />
expenditure on bus and rail infrastructure. The Council has<br />
long advocated for development of the rail corridor and<br />
as a result expenditure associated with development of<br />
the rail station precincts is either underway or planned in<br />
conjunction with upgrading of the rail corridor.<br />
Prior to 2006 there had been little or no expenditure on<br />
Travel Demand Management (TDM) schemes although<br />
plans had been laid to commence development of school<br />
and workplace travel plans. The Council adopted a walking<br />
and cycling strategy and proposes to begin implementation<br />
from 2006.<br />
The Council does not believe it can continue the previous<br />
narrow and limited approach to transport investment. This<br />
approach would help keep rates similar to present levels<br />
but would not deliver the outcomes sought by the city and<br />
region.<br />
Focus on roads<br />
An alternative school of thought says that the Council<br />
should simply widen and construct more roads for use by<br />
all traffic given that the vast majority of travel in <strong>Waitakere</strong><br />
is by car or other private vehicle.<br />
Various studies have been undertaken to assess what<br />
such as policy might mean for <strong>Waitakere</strong>. The aim of these<br />
studies has been to identify the scale of improvement works<br />
required just to maintain current operating speeds and<br />
journey times on the local road network and accommodate<br />
growth in population and employment.<br />
The studies have identified that developing the road<br />
network in this way would require substantial capital and<br />
ongoing investment in the roading network which would<br />
be unaffordable to the ratepayers of <strong>Waitakere</strong>. In addition<br />
there would be significant environmental and social impacts<br />
and substantial land and property required to develop the<br />
road network in order to keep up with demand.<br />
Such an approach would also result in increased stormwater<br />
and air pollution, severance, less interaction and tend<br />
to increase urban sprawl. This would conflict with the<br />
46
APPENDIX 2: Background to Strategic Options<br />
<strong>Auckland</strong> Regional Growth <strong>Strategy</strong> 1999, and <strong>Waitakere</strong><br />
<strong>City</strong> Council’s District Plan policies which are aimed at<br />
encouraging intensification at the major town centres.<br />
It would also encourage increased travel by car and would<br />
reduce demand for travel by alternative means such as<br />
passenger transport, walking and cycling and thereby<br />
reduce investment in these more sustainable travel modes.<br />
The outcome would be that some parts of the community<br />
would continue to have little or no choice other than to<br />
travel by car. There would also be less incentive for people<br />
to consider travel options, including the timing of trips or<br />
the need to travel at all.<br />
To sum up, this approach would not be sustainable and<br />
would conflict with council and regional plans and strategies<br />
seeking to develop a more sustainable future. If the Council<br />
were to pursue this option, it would be difficult to obtain<br />
the funding assistance required given the conflict with the<br />
<strong>Auckland</strong> Regional Land <strong>Transport</strong> <strong>Strategy</strong> 2005.<br />
Even with a substantial investment in the roading network,<br />
gains in travel times would be unlikely to be sustained as<br />
the city grows in population and local activity. More roading<br />
investment, beyond the plan period, would be required just<br />
to maintain present operating levels, the consequences of<br />
which would be very considerable.<br />
<strong>Auckland</strong> Regional Land <strong>Transport</strong><br />
<strong>Strategy</strong> 2005 (RLTS)<br />
In contrast, the RLTS is a balanced and sustainable strategy<br />
that aims to get the best out of the existing roading network,<br />
build new links where essential, and get more people using<br />
passenger transport and other non-car modes or choosing<br />
to travel at a different time or not at all.<br />
The RLTS supports compact urban development with<br />
intensification around transport nodes and along transport<br />
corridors. It aims to build a platform for more balanced<br />
investment in transport across modes. It has a strong focus<br />
on passenger transport facilitates and the possible future<br />
introduction of road pricing in the <strong>Auckland</strong> region.<br />
The following are the proposed investment allocations to<br />
each mode in the RLTS over the 10-year period 2006 to<br />
2016:<br />
• $6.810 billion on new roads and state highway infrastructure,<br />
maintenance/renewals, traffic management<br />
and safety (62%);<br />
• $3.80 billion on passenger transport (34%);<br />
• $0.42 billion on Travel Demand Management, including<br />
travel plans, walking and cycling (4%).<br />
The following is a summary of expected outcomes of the<br />
RLTS by 2016 (subject to the effects of increases in oil<br />
prices and the introduction of road pricing):<br />
• Traffic volumes are expected to increase by 22% over<br />
2005 levels (45% increase in traffic volumes between<br />
key business centres).<br />
• Interpeak travel speeds are expected to decrease by<br />
5.6%.<br />
• Average speeds for travel to the port in the morning<br />
peak are expected to decrease by 9%; and 8% to the<br />
airport.<br />
• Excellent information on the availability of different<br />
modes of transport will assist sustainable travel<br />
choices.<br />
• Half the trips into the central city in the morning peak<br />
will be by passenger transport.<br />
• In the peak periods, passenger transport will represent<br />
11% of trips (compared to 7% in 2001) and walking and<br />
cycling will represent 15% of trips (compared to 5% in<br />
2001).<br />
• Driver attitudes towards drink driving, speeding and<br />
general traffic enforcement are expected to improve<br />
over current levels.<br />
• Regional road injury crashes per 10,000 people are<br />
expected to decline by 6%.<br />
• Crashes, deaths and injuries involving pedestrians and<br />
cyclists are expected to decrease.<br />
• Energy used to travel, as measured by fuel use, is<br />
expected to increase by 26%.<br />
• CO 2<br />
emissions are expected to increase by 21%.<br />
• Discharges to water from the transport system are<br />
expected to increase by 20%.<br />
• 13% of the urban population should be living within the<br />
regional growth nodes.<br />
• The number of walking and cycling trips in town centres<br />
is expected to increase by 63%.<br />
• Passenger services on the rail line will not be more than<br />
10 minutes apart in the morning peak.<br />
Whilst this will not solve traffic congestion over the 10-<br />
year period, and travel times are expected to continue to<br />
increase, the RLTS will mean that more people will have<br />
greater travel choice than at present.<br />
Applications for funding will be prioritised to some extent<br />
according to a project’s contribution to the RLTS.<br />
47
Appendix 3: <strong>Auckland</strong> Regional<br />
<strong>Transport</strong> <strong>Strategy</strong> 2005 - Policies<br />
The following are policies in the <strong>Auckland</strong> Regional Land<br />
<strong>Transport</strong> <strong>Strategy</strong> 2005 that apply to Territorial Authorities<br />
in the <strong>Auckland</strong> region and are adopted as part of the<br />
<strong>Waitakere</strong> <strong>City</strong> <strong>Transport</strong> <strong>Strategy</strong> 2006 – 2016. The responsible<br />
agencies are included in brackets and the maps<br />
referred to are in the <strong>Auckland</strong> Regional Land <strong>Transport</strong><br />
<strong>Strategy</strong> 2005.<br />
1 Contribute to an integrated, safe, responsive, and<br />
sustainable transport system<br />
1.1 Ensure that transport decisions take into account<br />
the objectives of the Land <strong>Transport</strong> Management<br />
Act and the Regional Land <strong>Transport</strong> <strong>Strategy</strong>.<br />
1.1.1 Ensure that specific decisions on the development<br />
and funding of land transport activities<br />
in the region take into account the objectives<br />
of the Land <strong>Transport</strong> Management<br />
Act and this Regional Land <strong>Transport</strong> <strong>Strategy</strong>.<br />
(Transit, TAs, ARTA, Land <strong>Transport</strong> NZ,<br />
OnTrack)<br />
1.1.2 Report to the RLTC on a periodic basis<br />
about proposed or completed activities. The<br />
reports will show how these activities take<br />
into account or consider the objectives of<br />
this strategy. (ARTA, Transit, TAs)<br />
1.1.3 Submit annual reports to the RLTC on progress<br />
towards implementing the RLTS. These<br />
will be included in the RLTS Annual Report.<br />
(ARTA, Transit, TAs)<br />
1.2 Encourage organisations with responsibility for<br />
transport and land use decisions to act in an integrated<br />
manner, and fully consider the wider impacts<br />
of their decisions.<br />
1.2.2 Coordinate and integrate the actions of all<br />
organisations responsible for transport and<br />
land use decisions to take into account the<br />
Regional Land <strong>Transport</strong> <strong>Strategy</strong> policies<br />
to achieve the maximum benefit and avoid<br />
unnecessary costs. (Transit, OnTrack, Land<br />
<strong>Transport</strong> NZ, TAs)<br />
1.2.3 Ensure that transport and land use planning<br />
takes account of the needs of, and impacts<br />
on, all users and those with disabilities, especially<br />
commercial traffic, public transport,<br />
pedestrians and cyclists. (ARC, ARTA, TAs,<br />
Transit, OnTrack)<br />
1.2.4 Ensure that the transport and land use implication<br />
of major trip generating activities are<br />
understood and that location decisions promote<br />
walking, cycling and public transport<br />
modes. (TAs, ARTA, ARC)<br />
1.2.6 That land use / rail planning takes steps to<br />
avoid, remedy and mitigate reverse sensitivity<br />
effects of each on the other and work<br />
together to ensure integrated outcomes in<br />
transport and medium/high density corridors<br />
(TAs, OnTrack, ARTA)<br />
1.2.7 That all agencies responsible for implementing<br />
the land transport system in <strong>Auckland</strong><br />
are to act in a manner which is supportive<br />
of the NZTS, the effective integration of land<br />
use and transport, and the Regional Growth<br />
<strong>Strategy</strong>. (ARC, ARTA, TAs, OnTrack, Transit,<br />
Land <strong>Transport</strong> NZ)<br />
1.2.8 Encourage all agencies responsible for the<br />
<strong>Auckland</strong> land transport system to provide<br />
and support adequate training, recruitment<br />
measures and policies to ensure that there<br />
49
APPENDIX 3: <strong>Auckland</strong> Regional Land <strong>Transport</strong> <strong>Strategy</strong> 2005 - Policies<br />
is a sustainable and adequate supply of<br />
well-trained professionals within the transport<br />
and planning industry to assist with the<br />
further development of the <strong>Auckland</strong> land<br />
transport system. (ARC, ARTA, TAs, On-<br />
Track, Transit, Land <strong>Transport</strong> NZ)<br />
1.3 Improve the safety and security of the transport<br />
system for all users.<br />
1.3.2 Include safety and security-related issues<br />
in the development of roading, public transport,<br />
ridesharing, motorcycling, cycling,<br />
walking and other transport projects and<br />
programmes. (Transit, TAs, ARTA)<br />
1.3.3 Ensure at-risk road users and communities<br />
get priority for regional safety initiatives including<br />
engineering and strategies to promote<br />
walking, cycling and public transport.<br />
(Transit, TAs, ARTA, Land <strong>Transport</strong> NZ)<br />
1.3.4 Include the security needs of walkers, cyclists<br />
and public transport users (including<br />
lighting and surveillance requirements) in<br />
the design and assessment of town centre<br />
developments, new subdivisions and major<br />
redevelopment proposals. (TAs)<br />
1.3.6 Where at grade rail crossings are provided<br />
they should be designed in a way that they<br />
maintain safety for both the rail and road<br />
network while adequately providing for pedestrians.<br />
(ARTA, TAs, OnTrack)<br />
1.3.8 Coordinate rail safety initiatives through<br />
support of any national rail safety plan and/<br />
or the consideration and development of a<br />
Regional Rail Safety Plan. (ARTA, TAs, On-<br />
Track, Land <strong>Transport</strong> NZ, Rail providers)<br />
1.4 Involve communities in decisions about transport<br />
that affect them.<br />
1.4.1 Identify who is affected by transport decisions,<br />
and provide early and full opportunities<br />
for them to contribute to the planning<br />
and decision-making process. (Transit, TAs,<br />
ARTA)<br />
1.5 Ensure that transport decisions take into account<br />
the diverse transport needs of all users.<br />
1.5.1 Consider the equity implications of transport<br />
decisions and the distribution of costs<br />
and benefits, paying particular attention to<br />
the impacts on and improving access for<br />
the transport disadvantaged. (Transit, TAs,<br />
ARTA)<br />
1.5.4 Remove barriers to ensure the transport<br />
system is accessible by all people including<br />
those with disabilities. Upgrading of the<br />
transport system to meet international universal<br />
design standards. (ARTA, TAs)<br />
1.5.5 Remove barriers to ensure the transport<br />
system is accessible by all people including<br />
those with sensory disabilities. Upgrading of<br />
the transport system to meet international<br />
universal design standards. (ARTA, TAs)<br />
1.5.6 That the evaluation of public transport contracts<br />
consider operator and driver training<br />
to support the use of the public transport<br />
system for people with disabilities. (ARTA,<br />
TAs)<br />
1.5.7 Ensure that planning and management of<br />
parking facilities in developments recognise<br />
the needs of the special requirements for<br />
people whose disabilities prevent them using<br />
private vehicles or public transport. This<br />
should include the provision of short-term<br />
pick-up / drop-off locations for wheelchair<br />
accessible transport providers. (TAs)<br />
1.5.8 Ensure that the needs of the transport disadvantaged<br />
are considered in the development<br />
of parking policies across the region<br />
and ensure that they are included within the<br />
consultation process. (ARC, TAs)<br />
1.6 Increase the flexibility and resilience of the transport<br />
system to meet changing circumstances and<br />
the needs of future generations.<br />
1.6.1 Undertake multi-modal corridor studies to<br />
establish the future transport and land use<br />
requirements in key transport corridors.<br />
(ARC, Transit, TAs, ARTA, OnTrack)<br />
1.6.2 Take steps to protect strategic roading, rail<br />
and public transport routes identified in<br />
Maps 7.1, 7.2, 7.3 and 7.4, taking into account<br />
the need to preserve flexibility to deal<br />
with changing travel demands over time.<br />
(Transit, TAs, OnTrack)<br />
1.6.3 Support the <strong>Auckland</strong> Lifelines project and<br />
develop emergency management initiatives<br />
aimed at ensuring the ongoing operation of<br />
the network in emergencies. (ARC, Transit,<br />
TAs, ARTA, Environment Waikato, Northland<br />
Regional Council)<br />
1.6.4 Coordinate and manage the actions of road<br />
controlling authorities and utilities to minimise<br />
the disruption caused by construction<br />
and maintenance activities within transport<br />
corridors. (Transit, TAs, ARTA)<br />
1.7 Develop the transport system in a way that minimises<br />
the use of non-renewable resources.<br />
50
APPENDIX 3: <strong>Auckland</strong> Regional Land <strong>Transport</strong> <strong>Strategy</strong> 2005 - Policies<br />
1.7.8 Support the use and development of less<br />
energy intensive transport options to reduce<br />
the need to use vehicles to move people<br />
and goods around the region. (ARC, ARTA,<br />
TAs)<br />
1.7.10 Investigate improvements in traffic flow<br />
management and road network characteristics<br />
to achieve greater energy efficiency<br />
across the network. (ARC, Transit, TAs)<br />
1.7.14 Take steps to minimise the amount of land<br />
consumed for transport purposes through<br />
the efficient use of all transport infrastructure<br />
including corridors, car parking and<br />
park and ride facilities, while having regard<br />
to the need for safe and environmentally<br />
friendly transport infrastructure design. (TAs,<br />
ARTA, Transit, OnTrack)<br />
1.8 Take all reasonable steps to avoid, remedy or mitigate<br />
adverse environmental effects and improve<br />
health outcomes of transport.<br />
1.8.3 Encourage the government to introduce<br />
New Zealand-wide standards for transport<br />
noise and vibration and support initiatives<br />
to achieve the standards. (ARPHS, Transit,<br />
TAs, in consultation with MOT)<br />
1.8.4 Identify and implement processes to improve<br />
water quality and reduce sediment contamination<br />
in freshwater and marine ecosystems<br />
caused by run-off from the transport network.<br />
(ARC, Transit, TAs)<br />
1.8.5 Ensure that transport projects avoid to the<br />
extent reasonable in the circumstances adverse<br />
effects on significant cultural, ecological,<br />
geological and heritage sites in the region,<br />
and where this is not possible, seek<br />
to remedy or mitigate the adverse effects.<br />
(ARTA, TAs, Transit)<br />
1.8.6 Ensure that transport projects incorporate<br />
improvements to enhance the visual amenity<br />
and quality of the regional network.<br />
(ARTA, TAs, Transit, OnTrack)<br />
1.8.7 Promote the recovery and disposal of transport<br />
related wastes and other contaminants,<br />
especially oil and effluent disposal from<br />
campervans, trains, ferries and stock trucks.<br />
(Transit, TAs, ARC)<br />
1.8.12 Ensure that transport projects consider, at<br />
an early stage of the scheme assessment,<br />
options to avoid and/or remedy adverse effects<br />
on human health and the natural and<br />
physical environments. (ARTA, TAs, Transit)<br />
1.8.13 Ensure that appropriate environmental<br />
mitigation techniques are implemented for<br />
transport projects where adverse effects<br />
cannot be avoided or remedied. (Transit,<br />
TAs, ARTA)<br />
1.8.14 Take steps to ensure that environmental mitigation<br />
associated with transport projects is<br />
coordinated with wider environmental improvements<br />
(e.g. stormwater catchment<br />
works) (ARC, ARTA, Transit, TAs)<br />
1.8.15 Work with the road network controlling authorities<br />
to identify and implement improvements<br />
within the existing network to reduce<br />
environmental effects. (ARC, ARTA, TAs and<br />
Transit)<br />
1.8.16 Ensure that monitoring programmes which<br />
track air, water, noise impacts, environmental<br />
health effects and natural and cultural<br />
heritage effects are developed for new<br />
transport projects at the time they are approved.<br />
(ARC, ARTA, TAs, Transit)<br />
1.8.17 Ensure that transport projects avoid or, in<br />
exceptional circumstances, limit the adverse<br />
effects on the region’s volcanic cones.<br />
(ARC, Transit, ARTA, TAs)<br />
2 Make best use of the existing transport system<br />
2.1 Ensure that the region’s transport system is well<br />
maintained.<br />
2.1.1 Ensure that asset management plans are in<br />
place for the transport system. (Transit, TAs,<br />
ARTA, OnTrack)<br />
2.1.2 Develop an integrated approach to asset<br />
management and maintenance standards<br />
between different agencies. (Transit, TAs,<br />
ARTA, OnTrack)<br />
2.1.3 Ensure that land transport assets in the region<br />
are maintained to an acceptable standard,<br />
as determined in asset management<br />
plans. (Transit, TAs, ARTA, OnTrack)<br />
2.2 Implement a road hierarchy for the region.<br />
2.2.1 Adopt the strategic and regional arterial road<br />
networks for the region shown on Maps 7.1<br />
and 7.2. (ARTA, Transit and TAs)<br />
2.2.2 Develop standards or guidelines for how<br />
the strategic and regional arterial networks<br />
should be managed. These standards or<br />
guidelines are likely to address matters such<br />
as geometric standards; provision for heavy<br />
vehicles, public transport, walking and cycling;<br />
property access; provision for parking<br />
51
APPENDIX 3: <strong>Auckland</strong> Regional Land <strong>Transport</strong> <strong>Strategy</strong> 2005 - Policies<br />
and integration with town centres. (ARTA,<br />
Transit and TAs, Environment Waikato,<br />
Northland Regional Council)<br />
2.2.3 Develop, prepare and implement corridor<br />
management plans for developing the strategic<br />
and regional arterial networks and corridors<br />
taking into account the standards or<br />
guidelines developed in 2.2.2. (ARTA, Transit<br />
and TAs)<br />
2.3 Implement network management techniques to<br />
optimise the performance of the transport network,<br />
taking into account the needs of all modes.<br />
2.3.1 Develop traffic management systems that<br />
reflect and reinforce the roading hierarchy<br />
identified in maps 7.1 and 7.2, and implement<br />
management policies for each level of<br />
the hierarchy consistent with the following<br />
principles:<br />
• On strategic roads the movement of people<br />
and goods should predominate and property<br />
access should be allowed only where<br />
the transport function is not compromised<br />
• On regional arterial roads the movement of<br />
people and goods on the road should generally<br />
have priority over the access function<br />
of the road<br />
• On both strategic and regional arterial corridors<br />
provision should be made for pedestrians<br />
and cyclists to move safely and conveniently<br />
• Both strategic and regional arterial roads<br />
should facilitate the movement of heavy motor<br />
vehicles<br />
• Both strategic and regional arterial roads<br />
should be designed to accommodate public<br />
transport and to provide priority for public<br />
transport vehicles where warranted by demand<br />
and traffic conditions<br />
• The design and operation of regional arterial<br />
roads should support the amenity of communities<br />
they pass through<br />
• Where regional arterial roads pass through<br />
high density centres and corridors2, the balance<br />
of travel and land use demands should<br />
be carefully considered to ensure that the<br />
road network supports the growth strategy<br />
in an integrated manner<br />
• Consistent, coherent and high quality signage<br />
(both directional and street) should be<br />
implemented on strategic and regional arterial<br />
roads. (Transit, TAs, ARTA)<br />
2.3.2 Finalise the current strategic and regional<br />
arterial road networks for the region shown<br />
on Map 7.1. (ARTA, ARC, Transit and TAs)<br />
2.3.3 As appropriate, investigate and implement<br />
technologies for improving traffic management<br />
such as ramp metering, incident detection<br />
and traveller information, where<br />
these are feasible and where they can improve<br />
system capacity without compromising<br />
the efficiency of the local road network or<br />
the outcomes sought by the Regional Land<br />
<strong>Transport</strong> <strong>Strategy</strong>. (Transit, TAs, ARTA)<br />
2.3.4 Develop and implement an integrated set<br />
of local traffic management techniques to<br />
complement the integrated traffic management<br />
system, and give effect to these principles.<br />
(TAs)<br />
2.3.5 Ensure that network changes and management<br />
of all levels of the road hierarchy take<br />
into account the needs of all users including<br />
pedestrians, cyclists, public transport and<br />
freight. (Transit, TAs, ARTA)<br />
2.3.6 Provide for the coordinated management of<br />
non-transport uses in road and rail corridors,<br />
including utilities and community activities<br />
and recreation, to minimise disruption while<br />
taking the road’s wider community into consideration.<br />
(OnTrack, Transit, TAs)<br />
2.3.7 Ensure that the needs of pedestrians and<br />
cyclists are considered in the design of traffic<br />
management systems in town centres<br />
and local community areas. (TAs)<br />
2.3.8 Design traffic management systems on<br />
the road network (including strategic and<br />
regional arterials) to give priority to public<br />
transport and high occupancy vehicles,<br />
where appropriate. (Transit, TAs, ARTA)<br />
2.3.9 Investigate the feasibility and cost effectiveness<br />
of traffic management systems to give<br />
priority to commercial traffic. (Transit, TAs)<br />
2.3.10 Ensure that traffic management and priority<br />
systems are adequately enforced. (Transit,<br />
TAs, Police)<br />
2.3.11 At grade rail crossings should be minimized.<br />
Where existing they should be designed in<br />
a way that maintains the efficiency of both<br />
the rail and road network while adequately<br />
providing for pedestrians. (ARTA, OnTrack,<br />
TAs)<br />
2.4 Take steps to facilitate the movement of freight<br />
traffic within the region.<br />
52
APPENDIX 3: <strong>Auckland</strong> Regional Land <strong>Transport</strong> <strong>Strategy</strong> 2005 - Policies<br />
2.4.1 Support investment in the strategic road,<br />
rail and ferry transport network in a way that<br />
provides congestion relief for freight, particularly<br />
for connections to strategic links in<br />
<strong>Auckland</strong>’s logistics chain such as the port<br />
and airport. (ARC, Transit, OnTrack, TAs)<br />
2.4.2 Institute a data collection programme which<br />
provides good information on the movement<br />
of freight around the region. (ARC, Transit,<br />
OnTrack, TAs)<br />
2.4.3 Identify a strategic freight network and prepare<br />
policies for the development, operation<br />
and/or enforcement of that network. (ARC,<br />
Transit, OnTrack, TAs, Environment Waikato,<br />
Northland Regional Council)<br />
2.4.4 Prepare guidelines for the development<br />
of Local Area Freight Management Plans.<br />
(ARC, OnTrack, Transit, TAs)<br />
2.4.5 Establish better communication with freight<br />
stakeholders. (ARC, TAs)<br />
2.4.6 Encourage the effective and efficient intra<br />
and inter regional movement of freight<br />
by rail and by sea (ARC, TAs, Environment<br />
Waikato, Northland Regional Council)<br />
2.4.7 Support and encourage the development<br />
and increased use of inland port terminals<br />
accessed by rail, as well as roads (ARC,<br />
TAs)<br />
3 Manage travel demand<br />
3.1 Ensure that land use development and the transport<br />
system are mutually supportive and recognise<br />
the importance of design for non-vehicular travel.<br />
3.1.1 Give priority to transport investments and<br />
network improvements which give effect to<br />
the <strong>Auckland</strong> Regional Land <strong>Transport</strong> <strong>Strategy</strong><br />
2005 and <strong>Auckland</strong> Regional Council<br />
growth concept of the Regional Growth<br />
<strong>Strategy</strong> and the Regional Policy Statement<br />
as required by the Local Government (<strong>Auckland</strong>)<br />
Amendment Act 2004. (Transit, TAs,<br />
ARTA, OnTrack, Land <strong>Transport</strong> NZ)<br />
3.1.2 Wherever possible, programme transport investment<br />
to fit with the growth sequencing<br />
identified in the Regional Policy Statement.<br />
(Transit, TAs, OnTrack, ARTA)<br />
3.1.3 Support the Regional Growth <strong>Strategy</strong> and<br />
Regional Policy Statement emphasis on focusing<br />
intensification in locations with existing<br />
or potential transport characteristics that<br />
support higher intensity and mixed land use<br />
activities. These include locations where:<br />
• Good connections exist or can be established<br />
within the high density centres and<br />
corridors for all transport modes, including<br />
walking and cycling<br />
• Strong public transport links exist or can be<br />
established with neighbouring high density<br />
centres and corridors, the CBD and key employment<br />
centres<br />
• There is good ‘permeability’ (connections<br />
between high density centres and corridors<br />
and its surrounding area) or where good<br />
permeability can be established<br />
• Good connections exist or can be established<br />
between high density centres and<br />
corridors and other parts of the region. (Regional<br />
Growth Forum, ARC, TAs)<br />
3.1.4 Ensure that the provision of parking in areas<br />
of high parking demand does not outstrip<br />
the ability of the road network to service this<br />
demand. (TAs)<br />
3.1.5 Manage traffic within intensification areas<br />
so that traffic loads are spread rather than<br />
concentrated. (TAs)<br />
3.1.6 Design transport connections within high<br />
density centres and corridors to give priority<br />
to supporting pedestrians, cyclists and<br />
public transport and to enable improved urban<br />
amenity and land use integration, rather<br />
than to provide for the free flow of vehicle<br />
traffic. (ARTA, TAs, Transit NZ, OnTrack)<br />
3.1.7 Ensure that good urban design is included<br />
in the planning and implementation of new<br />
transport projects or redevelopment of existing<br />
transport infrastructure. This should<br />
include consideration of noise / vibration,<br />
the built environment, public space and access<br />
for people with disabilities. (TAs)<br />
3.1.8 In preparing district plans and in considering<br />
development and redevelopment proposals,<br />
consider the documents ‘Public<br />
transport Supportive Land Use Guidelines’<br />
(June 1995); ‘People, Places and Spaces: a<br />
design guide for urban New Zealand’ (Ministry<br />
for the Environment March 2002); the<br />
New Zealand Urban Design Protocol (Ministry<br />
for the Environment 2004); the Urban<br />
Area Intensification and Structure Planning<br />
regional practice guides (both 2000); Crime<br />
Prevention Through Environmental Design;<br />
53
APPENDIX 3: <strong>Auckland</strong> Regional Land <strong>Transport</strong> <strong>Strategy</strong> 2005 - Policies<br />
and relevant local authority urban design<br />
guides and provisions that ensure land use<br />
and transport systems are mutually supportive.<br />
(TAs)<br />
3.1.9 Encourage, through district plans and long<br />
term plans, ‘transit orientated developments’<br />
(TOD), which include a mixture of land uses<br />
which decreases the need for vehicle travel<br />
and increases community benefits, including<br />
removing barriers to working from home.<br />
(TAs)<br />
3.1.10 Encourage the investigation of a regional<br />
land use development agency or agencies<br />
to support ‘transit orientated development’<br />
(TOD) within identified centres and on rapid<br />
transit corridors. (ARC, TAs)<br />
3.1.11 Support the use of regional and local<br />
developer contributions levied from<br />
(re)development for transport improvements<br />
which provide a direct benefit to that development.<br />
(ARC, TAs, ARTA)<br />
3.1.12 Promote commercial and public awareness<br />
of the opportunities of private sector involvement<br />
in public facilities while developing or<br />
redeveloping key sites in transport corridors<br />
and growth nodes. (ARC, TAs, ARTA)<br />
3.2 Provide attractive transport choices for individuals,<br />
communities and businesses.<br />
3.2.1 Improve walking, cycling and public transport<br />
networks through the policies outlined<br />
in sections 4.2, 4.3 and 4.4. (Transit, TAs,<br />
ARTA)<br />
3.2.2 Encourage households and businesses to<br />
take advantage of improvements to communications<br />
technology, by removing barriers<br />
to working from home and supporting<br />
teleworking initiatives. (TAs, ARTA)<br />
3.3 Ensure that resources are made available to understand<br />
and influence travel choices being made in<br />
the region.<br />
3.3.1 Develop and implement a travel planning<br />
programme which ensures that individuals<br />
are aware of and encouraged to use alternatives<br />
to private vehicles. (ARTA, with support<br />
from TAs)<br />
3.3.2 Gain a better understanding of community<br />
needs and current transport choices. (ARTA,<br />
with support from TAs)<br />
3.3.3 Work with schools to develop travel plans<br />
which identify existing travel choices and<br />
opportunities for reducing the level of vehicle<br />
travel for trips to and from school. (ARTA,<br />
with support from TAs)<br />
3.3.4 Work with tertiary institutions, hospitals,<br />
public authorities, businesses and communities<br />
to develop travel plans which identify<br />
existing travel choices and opportunities for<br />
reducing the level of vehicle travel needed,<br />
including for trips to and from those destinations<br />
and provision for teleworking. (ARTA,<br />
with support from TAs)<br />
3.3.5 Ensure that transport services and infrastructure<br />
development support travel planning<br />
initiatives. (ARTA, Transit, TAs)<br />
3.3.6 Support technology improvements which<br />
reduce the need to travel. (TAs, with support<br />
from ARTA)<br />
3.3.7 Support initiatives that encourage ridesharing,<br />
teleworking and flexible work hours.<br />
(ARTA, with support from TAs)<br />
3.4 Ensure that the planning and management of parking<br />
resources in the region supports the region’s<br />
land use and transport outcomes.<br />
3.4.1 Achieve a balance between the provision<br />
of car parking and managing peak period<br />
traffic demands in areas of high parking demand<br />
such as the <strong>Auckland</strong> CBD and other<br />
regional centres. This should include consideration<br />
of parking ceilings in these areas.<br />
(ARC, ARTA and TAs)<br />
3.4.2 Support the development of the region’s<br />
public transport and active mode outcomes<br />
through appropriate parking policies and<br />
measures. This includes parking measures<br />
to influence the travel decisions of commuters<br />
through pricing and the planning and<br />
management of parking supply. (ARC, ARTA<br />
and TAs)<br />
3.4.3 Support the region’s travel demand management<br />
outcomes through appropriate parking<br />
policies and measures. This will include developing<br />
parking management measures,<br />
including parking restraint, to complement<br />
travel demand management initiatives and<br />
improvements to the public transport network.<br />
(ARC, ARTA and TAs)<br />
3.4.4 Support the implementation of the Regional<br />
Growth <strong>Strategy</strong> land use outcomes through<br />
appropriate parking policies and measures.<br />
To facilitate this policy a better understanding<br />
of the dynamics of parking in areas of intensification<br />
and its consequential impacts<br />
is needed. (ARC, ARTA and TAs)<br />
54
APPENDIX 3: <strong>Auckland</strong> Regional Land <strong>Transport</strong> <strong>Strategy</strong> 2005 - Policies<br />
3.4.5 Effectively manage the short-term parking<br />
requirements around the region’s activity /<br />
commercial centres. In areas of high activity<br />
the highest priority should be given to shortstay<br />
non-residential parking. The provision<br />
of long-stay parking should be planned and,<br />
if necessary, appropriately priced in areas of<br />
lower demand or activity. (ARC, ARTA and<br />
TAs)<br />
3.4.6 Develop a Regional Parking <strong>Strategy</strong> to provide<br />
regional policy direction on all parking<br />
issues including a regional policy position<br />
for the provision of park and ride facilities.<br />
(ARC, ARTA, and TAs)<br />
3.5 Evaluate options to establish an efficient road pricing<br />
system.<br />
3.5.1 Work with the government to progress the<br />
<strong>Auckland</strong> road pricing evaluation study.<br />
(ARC, TAs, ARTA)<br />
3.5.6 New roads may only be considered as possible<br />
toll roads in situations where:<br />
• There is a suitable alternative route<br />
• Tolling would only have a minor adverse effect<br />
on the benefits of constructing the road<br />
(particularly safety benefits and relief of traffic<br />
pressures on communities)<br />
• The adoption of tolling does not prevent<br />
other transport or safety improvements in<br />
the network<br />
• There is traffic relief for bypassed communities.<br />
In addition, consideration will be given to the social<br />
and economic impacts on bypassed communities.<br />
(Transit, TAs)<br />
4 Increase the capacity of the transport network<br />
4.1 Improve, upgrade and expand the region’s public<br />
transport infrastructure and services.<br />
4.1.6 Continue development of the Quality Transit<br />
Network in the region. (ARTA, TAs)<br />
4.1.9 Ensure that public transport services are<br />
planned and provided for, to new and<br />
(re)developing areas. (ARTA, TAs)<br />
4.1.10 Ensure that the design and construction of<br />
public transport infrastructure takes into account<br />
the requirements for safety and security<br />
of passengers. (ARTA, TAs)<br />
4.1.11 Plan and protect the ability for additional<br />
Quality Transit Network connections<br />
throughout the region. (ARTA, TAs)<br />
4.1.13 Undertake an investigation into development<br />
of the regional standardisation of transit<br />
and bus lanes. (ARTA, TAs)<br />
4.1.17 Ensure that when changes are made to public<br />
transport services, individuals, communities<br />
and existing passengers are consulted<br />
with in a manner which is appropriate to the<br />
degree of change, and that the outcome of<br />
the consultation is communicated effectively<br />
to existing and potential passengers. (ARTA,<br />
TAs)<br />
4.2 Upgrade and provide additional road infrastructure<br />
to improve network efficiency and effectiveness.<br />
4.2.1 Finalise the future strategic and regional arterial<br />
road networks for the region shown on<br />
Map 7.2. (ARTA, ARC, Transit and TAs)<br />
4.2.2 Undertake a programme to develop the strategic<br />
road network including completion of<br />
strategic connections identified in Maps 7.1<br />
and 7.2, taking into account the preferred<br />
strategic option in the RLTS. (Transit, TAs)<br />
4.2.3 Undertake a programme to develop the local<br />
road network, to give effect to the preferred<br />
strategic option in the RLTS. (ARTA,<br />
TAs)<br />
4.2.5 Coordinate the planning and programming<br />
of state highway and local road improvements<br />
to ensure that the development of the<br />
region’s road network reflects the preferred<br />
strategic option of the RLTS. (ARTA, TAs,<br />
Transit)<br />
4.2.6 Continue work to investigate and protect<br />
the ability to construct roading infrastructure<br />
that may be required beyond the term of the<br />
RLTS. (Transit, ARTA, TAs)<br />
4.2.7 Ensure that priorities for the development<br />
of roading infrastructure reflect the need to<br />
maintain and enhance access to key locations<br />
of economic activity, including strategic<br />
facilities such as the port and airport.<br />
(Transit, ARTA, TAs)<br />
4.3 Upgrade and provide additional rail infrastructure<br />
to improve network efficiency and effectiveness.<br />
4.3.1 Identify and protect the existing and future<br />
strategic rail network. (OnTrack, ARTA, TAs)<br />
4.3.3 Continue work to investigate and protect<br />
the ability to construct rail infrastructure<br />
that may be required beyond the term of the<br />
RLTS. (OnTrack, ARTA, TAs)<br />
4.4 Provide additional infrastructure to improve conditions<br />
for walking.<br />
55
APPENDIX 3: <strong>Auckland</strong> Regional Land <strong>Transport</strong> <strong>Strategy</strong> 2005 - Policies<br />
4.4.1 Incorporate national guidelines and standards<br />
for walking into transport planning,<br />
design and management activities. (Transit,<br />
OnTrack, TAs)<br />
4.4.2 Implement improvements to safety and access<br />
for walkers, and support initiatives to<br />
increase the use of walking. (Transit, On-<br />
Track, TAs)<br />
4.4.3 Introduce traffic calming and enforcement<br />
measures where appropriate on local roads<br />
to improve the environment for walkers and<br />
local communities. (TAs)<br />
4.4.4 Recognise that urban road corridors are<br />
public places and that amenity needs to be<br />
protected through appropriate urban design.<br />
(TAs)<br />
4.4.5 Promote walking in the context of improved<br />
safety through a comprehensive assessment<br />
of safety and security impacts, and the<br />
implementation of appropriate infrastructure<br />
to both encourage walking and ensure the<br />
safety and security of users. (Transit, On-<br />
Track, TAs)<br />
4.4.6 Plan for the needs of walking and pedestrian<br />
amenity in the design and assessment of<br />
new subdivisions and major redevelopment<br />
proposals. (TAs)<br />
4.4.7 Ensure that direct, attractive and safe walking<br />
routes are available to public transport<br />
stops. (TAs, OnTrack, ARTA)<br />
4.4.8 Plan for and protect the ability to provide for<br />
additional pedestrian connections throughout<br />
the region, where required. (ARTA, Transit,<br />
OnTrack, TAs)<br />
4.5 Provide additional infrastructure to improve conditions<br />
for cycling.<br />
4.5.1 Incorporate national guidelines and standards<br />
for cycling into transport planning,<br />
design and management activities. (Transit,<br />
OnTrack, TAs)<br />
4.5.2 Develop and implement a regional cycle<br />
network that is well connected across the<br />
region. (TAs, OnTrack, ARTA)<br />
4.5.3 Implement improvements to safety and access<br />
for cyclists, and support initiatives to<br />
increase the use of cycling. (Transit, On-<br />
Track, TAs)<br />
4.5.4 Introduce traffic calming and enforcement<br />
measures where appropriate on local roads<br />
to improve the environment for cyclists.<br />
(TAs)<br />
4.5.5 Consider the needs of cycling in the design<br />
and assessment of new subdivisions and<br />
major redevelopment proposals. (TAs)<br />
4.5.6 Ensure that direct, attractive and safe cycling<br />
routes are available to major public<br />
transport stops and ferry terminals. (On-<br />
Track, TAs, ARTA)<br />
4.5.7 Plan for and protect the ability to provide<br />
for additional cycling connections throughout<br />
the region. (ARTA, OnTrack, Transit, and<br />
TAs)<br />
4.5.8 Plan for cycling in ways that encompass the<br />
‘whole of journey’ concept including:<br />
• Infrastructure treatments<br />
• Safety at and across intersections<br />
• Secure bike facilities<br />
• Connection to activity centres. (ARTA, On-<br />
Track, Transit, and TAs)<br />
4.5.9 Ensure that needs of different cyclists – including<br />
recreational cyclists, fitness cyclists<br />
and children – are considered in the design<br />
of infrastructure. (TAs)<br />
4.5.10 Plan and provide for safe and effective cycle<br />
facilities in local road corridor. (TAs, ARTA)<br />
5 Allocate the available transport funding to ensure<br />
the Regional Land <strong>Transport</strong> <strong>Strategy</strong>’s policies<br />
are achieved<br />
5.1 Allocate land transport funding to reflect the preferred<br />
strategic option of the RLTS.<br />
5.1.1 Ensure that actions reflect the following<br />
general allocations of funding over the next<br />
10 years:<br />
TRAVEL DEMAND MANAGEMENT 4%<br />
PUBLIC TRANSPORT 34%<br />
• Infrastructure 18%<br />
• Services 16%<br />
ROADS 62%<br />
• Infrastructure 30%<br />
• Safety measures 34%<br />
• Traffic management 42%<br />
• Maintenance & renewals 26%<br />
(Transit, ARTA, TAs, Land <strong>Transport</strong> NZ)<br />
5.2 Promote changes to the land transport funding<br />
systems to enable implementation of the preferred<br />
strategic option.<br />
5.2.1 Work with the Ministry of <strong>Transport</strong>, Land<br />
<strong>Transport</strong> NZ and other appropriate central<br />
56
APPENDIX 3: <strong>Auckland</strong> Regional Land <strong>Transport</strong> <strong>Strategy</strong> 2005 - Policies<br />
government agencies to ensure that funding<br />
arrangements, particularly related to local/<br />
regional shares, do not constrain the implementation<br />
of the preferred strategic option.<br />
(ARC, TAs, ARTA)<br />
5.3 Take steps to mitigate the risks that have been<br />
identified with respect to implementation of the<br />
preferred strategic option.<br />
5.3.2 Collaborate with the government and training<br />
institutions to address skill shortages in<br />
areas of increased demand. (ARC, Transit,<br />
ARTA, TAs)<br />
57
Appendix 4: Supporting and<br />
Technical Papers<br />
National<br />
Environmentally Sustainable <strong>Transport</strong> – OECD<br />
The Kyoto Protocol – UN<br />
New Zealand <strong>Transport</strong> <strong>Strategy</strong> 2002 –<br />
Ministry of <strong>Transport</strong><br />
<strong>Transport</strong> Sector Strategic Directions December 2005<br />
– MOT<br />
State Highway Forecast 2005 – Transit NZ<br />
Sustainable Action of New Zealand Programme for Action<br />
2003<br />
National Rail <strong>Strategy</strong> to 2015 – MOT<br />
National Energy Efficiency and Conservation <strong>Strategy</strong><br />
2002<br />
New Zealand Disabilities <strong>Strategy</strong><br />
Vehicle Fleet Emissions Control <strong>Strategy</strong> 1999 – MOT<br />
Getting there on foot, by cycle – MOT<br />
Road Safety to 2010<br />
Growth and Innovation <strong>Strategy</strong> – Growing an Innovative<br />
NZ<br />
New Zealand Health <strong>Strategy</strong><br />
Reducing Inequalities in Health<br />
National Environmental Standards<br />
The Accessible Journey – Report of the Inquiry into<br />
Accessible Public Land <strong>Transport</strong> – Human Rights<br />
Commission, 2005<br />
Regional<br />
<strong>Auckland</strong> Regional Growth <strong>Strategy</strong> 1999 – ARC<br />
<strong>Auckland</strong> Regional Land <strong>Transport</strong> <strong>Strategy</strong> 2005 – RLTC<br />
Regional Passenger <strong>Transport</strong> Plan 2003 – ARC<br />
<strong>Auckland</strong> Regional Road Safety Plan 2004 – ARC<br />
Draft Regional Ferry <strong>Strategy</strong> – ARC<br />
Draft Business Location <strong>Strategy</strong> 2005 – ARC<br />
Regional Freight <strong>Strategy</strong> 2007 – ARC<br />
Draft <strong>Auckland</strong> <strong>Transport</strong> Plan 2006 – ARTA<br />
State of Public Health in the <strong>Auckland</strong> Region 2006<br />
– <strong>Auckland</strong> District Health Board<br />
Local Effects of the RLTS 2005 Technical Paper 2006<br />
– ARC<br />
<strong>Auckland</strong> Regional Air Land and Water Plan – ARC<br />
Sustainable <strong>Transport</strong> Plan 2006 - ARTA<br />
<strong>Waitakere</strong> <strong>City</strong><br />
The draft Greenprint 1994<br />
The draft <strong>Waitakere</strong> <strong>City</strong> Integrated <strong>Transport</strong> <strong>Strategy</strong><br />
1999<br />
<strong>Transport</strong> principles adopted by Council in March 2002<br />
The transport vision, goals and objectives contained in the<br />
Long Term Council Community Plan 2003 to 2013<br />
<strong>Waitakere</strong> <strong>City</strong> Walking and Cycling <strong>Strategy</strong> 2003<br />
Cycling Feasibility Study 2005<br />
Strategic Road Corridor Studies<br />
<strong>Transport</strong> Activity Plans 2005<br />
Road Asset Management Plan<br />
<strong>Waitakere</strong> <strong>City</strong> Road Safety Plan<br />
Concept plans for the three main town centres and the<br />
growth of the northwest<br />
59
For more information about tranport policies<br />
and projects relating to <strong>Waitakere</strong><br />
Phone <strong>Waitakere</strong> <strong>City</strong> Council on 839 0400 or visit www.waitakere.govt.nz<br />
Other transport agencies which fund or implement<br />
transport projects in <strong>Waitakere</strong> include:<br />
Transit New Zealand - www.transit.govt.nz<br />
<strong>Auckland</strong> Regional <strong>Transport</strong> Authority - www.arta.co.nz<br />
ONTRACK - www.ontrack.govt.nz<br />
<strong>Auckland</strong> Regional Council - www.arc.govt.nz<br />
Land <strong>Transport</strong> New Zealand - www.landtransport.govt.nz
ISBN - 10: 473-11411-9<br />
ISBN - 13: 978-0-473-11411-4