What is Random Vibration Testing? - Sound and Vibration Magazine
What is Random Vibration Testing? - Sound and Vibration Magazine
What is Random Vibration Testing? - Sound and Vibration Magazine

Create successful ePaper yourself
Turn your PDF publications into a flip-book with our unique Google optimized e-Paper software.
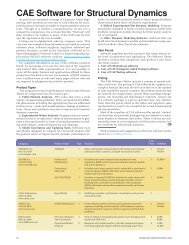
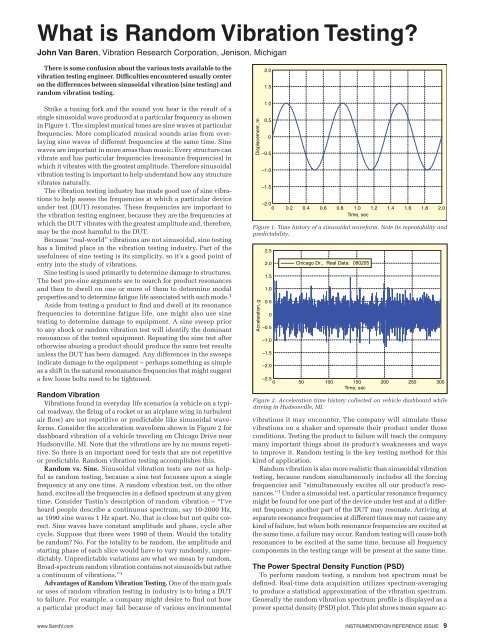
<strong>What</strong> <strong>is</strong> <strong>R<strong>and</strong>om</strong> <strong>Vibration</strong> <strong>Testing</strong>?<br />
John Van Baren, <strong>Vibration</strong> Research Corporation, Jen<strong>is</strong>on, Michigan<br />
There <strong>is</strong> some confusion about the various tests available to the<br />
vibration testing engineer. Difficulties encountered usually center<br />
on the differences between sinusoidal vibration (sine testing) <strong>and</strong><br />
r<strong>and</strong>om vibration testing.<br />
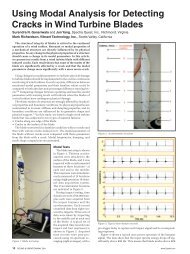
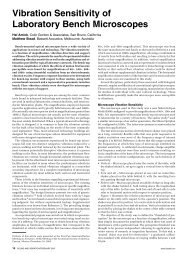
Strike a tuning fork <strong>and</strong> the sound you hear <strong>is</strong> the result of a<br />
single sinusoidal wave produced at a particular frequency as shown<br />
in Figure 1. The simplest musical tones are sine waves at particular<br />
frequencies. More complicated musical sounds ar<strong>is</strong>e from overlaying<br />
sine waves of different frequencies at the same time. Sine<br />
waves are important in more areas than music. Every structure can<br />
vibrate <strong>and</strong> has particular frequencies (resonance frequencies) in<br />
which it vibrates with the greatest amplitude. Therefore sinusoidal<br />
vibration testing <strong>is</strong> important to help underst<strong>and</strong> how any structure<br />
vibrates naturally.<br />
The vibration testing industry has made good use of sine vibrations<br />
to help assess the frequencies at which a particular device<br />
under test (DUT) resonates. These frequencies are important to<br />
the vibration testing engineer, because they are the frequencies at<br />
which the DUT vibrates with the greatest amplitude <strong>and</strong>, therefore,<br />
may be the most harmful to the DUT.<br />
Because “real-world” vibrations are not sinusoidal, sine testing<br />
has a limited place in the vibration testing industry. Part of the<br />
usefulness of sine testing <strong>is</strong> its simplicity, so it’s a good point of<br />
entry into the study of vibrations.<br />
Sine testing <strong>is</strong> used primarily to determine damage to structures.<br />
The best pro-sine arguments are to search for product resonances<br />
<strong>and</strong> then to dwell on one or more of them to determine modal<br />
properties <strong>and</strong> to determine fatigue life associated with each mode. 1<br />
Aside from testing a product to find <strong>and</strong> dwell at its resonance<br />
frequencies to determine fatigue life, one might also use sine<br />
testing to determine damage to equipment. A sine sweep prior<br />
to any shock or r<strong>and</strong>om vibration test will identify the dominant<br />
resonances of the tested equipment. Repeating the sine test after<br />
otherw<strong>is</strong>e abusing a product should produce the same test results<br />
unless the DUT has been damaged. Any differences in the sweeps<br />
indicate damage to the equipment – perhaps something as simple<br />
as a shift in the natural resonanance frequencies that might suggest<br />
a few loose bolts need to be tightened.<br />
<strong>R<strong>and</strong>om</strong> <strong>Vibration</strong><br />
<strong>Vibration</strong>s found in everyday life scenarios (a vehicle on a typical<br />
roadway, the firing of a rocket or an airplane wing in turbulent<br />
air flow) are not repetitive or predictable like sinusoidal waveforms.<br />
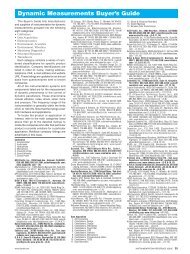
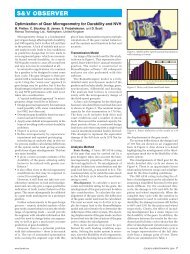
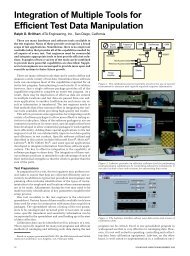
Consider the acceleration waveform shown in Figure 2 for<br />
dashboard vibration of a vehicle traveling on Chicago Drive near<br />
Hudsonville, MI. Note that the vibrations are by no means repetitive.<br />
So there <strong>is</strong> an important need for tests that are not repetitive<br />
or predictable. <strong>R<strong>and</strong>om</strong> vibration testing accompl<strong>is</strong>hes th<strong>is</strong>.<br />
<strong>R<strong>and</strong>om</strong> vs. Sine. Sinusoidal vibration tests are not as helpful<br />
as r<strong>and</strong>om testing, because a sine test focusses upon a single<br />
frequency at any one time. A r<strong>and</strong>om vibration test, on the other<br />
h<strong>and</strong>, excites all the frequencies in a defined spectrum at any given<br />
time. Consider Tustin’s description of r<strong>and</strong>om vibration – “I’ve<br />
heard people describe a continuous spectrum, say 10-2000 Hz,<br />
as 1990 sine waves 1 Hz apart. No, that <strong>is</strong> close but not quite correct.<br />
Sine waves have constant amplitude <strong>and</strong> phase, cycle after<br />
cycle. Suppose that there were 1990 of them. Would the totality<br />
be r<strong>and</strong>om? No. For the totality to be r<strong>and</strong>om, the amplitude <strong>and</strong><br />
starting phase of each slice would have to vary r<strong>and</strong>omly, unpredictably.<br />
Unpredictable variations are what we mean by r<strong>and</strong>om.<br />
Broad-spectrum r<strong>and</strong>om vibration contains not sinusoids but rather<br />
a continuum of vibrations.” 1<br />
Advantages of <strong>R<strong>and</strong>om</strong> <strong>Vibration</strong> <strong>Testing</strong>. One of the main goals<br />
or uses of r<strong>and</strong>om vibration testing in industry <strong>is</strong> to bring a DUT<br />
to failure. For example, a company might desire to find out how<br />
a particular product may fail because of various environmental<br />
D<strong>is</strong>placement, m<br />
2.0<br />
1.5<br />
1.0<br />
0.5<br />
0<br />
–0.5<br />
–1.0<br />
–1.5<br />
–2.0<br />
0 0.2 0.4 0.6 0.8 1.0 1.2 1.4 1.6 1.8 2.0<br />
Time, sec<br />
Figure 1. Time h<strong>is</strong>tory of a sinusoidal waveform. Note its repeatability <strong>and</strong><br />
predictability.<br />
Acceleration, g<br />
2.5<br />
2.0<br />
1.5<br />
1.0<br />
0.5<br />
0<br />
–0.5<br />
–1.0<br />
–1.5<br />
–2.0<br />
–2.5<br />
Chicago Dr., Real Data: 080205<br />
0 50 100 150 200 250 300<br />
Time, sec<br />
Figure 2. Acceleration time h<strong>is</strong>tory collected on vehicle dashboard while<br />
driving in Hudsonville, MI.<br />
vibrations it may encounter. The company will simulate these<br />
vibrations on a shaker <strong>and</strong> opereate their product under those<br />
conditions. <strong>Testing</strong> the product to failure will teach the company<br />
many important things about its product’s weaknesses <strong>and</strong> ways<br />
to improve it. <strong>R<strong>and</strong>om</strong> testing <strong>is</strong> the key testing method for th<strong>is</strong><br />
kind of application.<br />
<strong>R<strong>and</strong>om</strong> vibration <strong>is</strong> also more real<strong>is</strong>tic than sinusoidal vibration<br />
testing, because r<strong>and</strong>om simultaneously includes all the forcing<br />
frequencies <strong>and</strong> “simultaneously excites all our product’s resonances.”<br />
1 Under a sinusoidal test, a particular resonance frequency<br />
might be found for one part of the device under test <strong>and</strong> at a different<br />
frequency another part of the DUT may resonate. Arriving at<br />
separate resonance frequencies at different times may not cause any<br />
kind of failure, but when both resonance frequencies are excited at<br />
the same time, a failure may occur. <strong>R<strong>and</strong>om</strong> testing will cause both<br />
resonances to be excited at the same time, because all frequency<br />
components in the testing range will be present at the same time.<br />
The Power Spectral Density Function (PSD)<br />
To perform r<strong>and</strong>om testing, a r<strong>and</strong>om test spectrum must be<br />
defined. Real-time data acqu<strong>is</strong>ition utilizes spectrum-averaging<br />
to produce a stat<strong>is</strong>tical approximation of the vibration spectrum.<br />
Generally the r<strong>and</strong>om vibration spectrum profile <strong>is</strong> d<strong>is</strong>played as a<br />
power spectal density (PSD) plot. Th<strong>is</strong> plot shows mean square ac-<br />
www.S<strong>and</strong>V.com iNSTRUMENTATION REFERENCE ISSUE 9
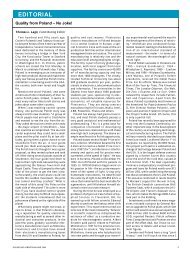
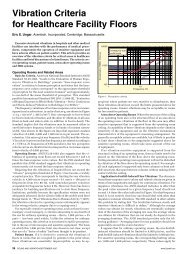
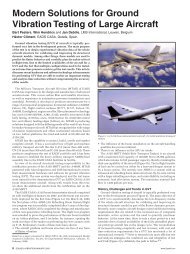
Figure 3. Typical power spectral density vibration testing specification (mean<br />
squared acceleration per unit frequency).<br />
celeration per unit b<strong>and</strong>width (acceleration squared per Hz versus<br />
frequency as shown in Figure 3). The shape of a PSD plot defines<br />
the average acceleration of the r<strong>and</strong>om signal at any frequency. The<br />
area under th<strong>is</strong> curve <strong>is</strong> called the signal’s mean square (g 2 ) <strong>and</strong> its<br />
square root <strong>is</strong> equal to the acceleration’s overall root-mean-square<br />
(RMS) value often abbreviated s.<br />
A r<strong>and</strong>om test <strong>is</strong> conducted by using closed-loop feedback to<br />
cause the r<strong>and</strong>om vibration of a single location (typically the shaker<br />
table) to exhibit a desired PSD. The PSD demonstrates how hard the<br />
shaker <strong>is</strong> working, but itdoesn’t give any direct information about<br />
the forces experienced by the DUT. The g 2 /Hz PSD <strong>is</strong> a stat<strong>is</strong>tical<br />
measurement of the motion experienced at the Control point on<br />
the test object – th<strong>is</strong> <strong>is</strong> important to remember. Since the PSD <strong>is</strong><br />
the result of an averaging process, an infinite number of different<br />
time waveforms could have generated such a PSD. The idea<br />
that an infinite number of real-time waveforms could generate a<br />
particular PSD can be seen from the graphs shown in Figures 4-7<br />
produced from data collected at <strong>Vibration</strong> Research Corporation,<br />
June 28 <strong>and</strong> 30, 2005. Note that the PSD curves (Figures 6 <strong>and</strong> 7)<br />
are virtually identical although they were generated from entirely<br />
different waveforms.<br />
The Probability Density Function (PDF)<br />
An examination of the acceleration waveforms of Figures 4 <strong>and</strong><br />
5 will indicate that much of the r<strong>and</strong>om vibration acceleration<br />
values are nearly the same (±5 g). However, some of the acceleration<br />
values are quite large compared to the most common values.<br />
To help illustrate the range of acceleration values, another stat<strong>is</strong>tic,<br />
the probability density function (PDF) <strong>is</strong> required. A PDF <strong>is</strong> an<br />
amplitude h<strong>is</strong>togram with specific amplitude scaling. Each point<br />
in the h<strong>is</strong>togram <strong>is</strong> a count of the number of times the measured<br />
signal sample was found to be within a corresponding small range<br />
(an amplitude “bin”) of amplitude.<br />
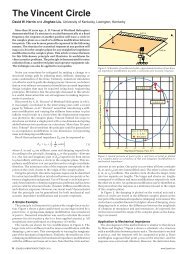
The PDF shown in Figure 8 conveys the probability of the signal<br />
being at a particular g-value at any instant in time. It’s vertical units<br />
are 1/g <strong>and</strong> the area under th<strong>is</strong> curve <strong>is</strong> exactly 1. Thus, the area<br />
under the PDF between any two (horizontal ax<strong>is</strong>) g values <strong>is</strong> the<br />
probability of the measured signal being within that amplitude<br />
range. Note that Figure 8 <strong>is</strong> drawn using a logarithmic vertical<br />
ax<strong>is</strong>. Th<strong>is</strong> serves to make the extreme-value “tails” more readable.<br />
Various weighted integrals (moments) of th<strong>is</strong> function are determined<br />
by the signal’s properties. For example, the first moment <strong>is</strong><br />
the signal’s mean (μ), the averaged or most probable value; th<strong>is</strong> <strong>is</strong><br />
necessarily equal to zero for a r<strong>and</strong>om shaker Control signal. The<br />
second moment <strong>is</strong> the signal’s mean square (s 2 ) <strong>and</strong> it <strong>is</strong> equal to<br />
the area under the previously d<strong>is</strong>cussed PSD. The third moment <strong>is</strong><br />
the signal’s skew, an indication of bias towards larger positive or<br />
negative values; th<strong>is</strong> <strong>is</strong> always equal to zero for a r<strong>and</strong>om Control<br />
signal. The fourth moment <strong>is</strong> called the Kurtos<strong>is</strong> <strong>and</strong> it measures<br />
the high-g content of the signal.<br />
The horizontal ax<strong>is</strong> of an acceleration PDF has units of g peak (not<br />
Figure 4. Sample acceleration time h<strong>is</strong>tory of excitation applied to Lightbulb-4<br />
test, #1330.<br />
Figure 5. Sample acceleration time h<strong>is</strong>tory of excitation applied to Lightbulb-4<br />
test, #1110.<br />
RMS). Th<strong>is</strong> ax<strong>is</strong> <strong>is</strong> often normalized by dividing the g values by<br />
the signal’s RMS value s. Many signals will exhibit a symmetrical<br />
“bell-shaped” PDF with 68.27% of the curve’s area bounded by ±s<br />
<strong>and</strong> 99.73% within ±3s. Such signals are said to be “normal” or<br />
Gaussian. A Gaussian signal has a Kurtos<strong>is</strong> of 3 <strong>and</strong> the probability<br />
of its instantaneous amplitude being within ±3s at any time <strong>is</strong> very<br />
nearly 100% (actually 99.73%).<br />
There are actually many “real-life” situations where there are<br />
more high acceleration values than a Gaussian d<strong>is</strong>tribution would<br />
indicate. Unfortunately, most modern r<strong>and</strong>om control techniques<br />
assume the Control signal should be Gaussian with the majority of<br />
the instantaneous acceleration values within the ±3s range. Th<strong>is</strong><br />
assumption removes the most damaging high peak accelerations<br />
from the test’s simulation of the product’s environment <strong>and</strong> “under<br />
testing” results. In fact, a Gaussian waveform will instantaneously<br />
exceed three times the RMS level only 0.27% of the time.<br />
When measuring field data, the situation can be considerably<br />
different, with amplitudes exceeding three times the RMS level<br />
as much as 1.5% of the time. Th<strong>is</strong> difference can be significant,<br />
since it has also been reported that most fatigue damage <strong>is</strong> generated<br />
by accelerations in the range of two to four times the RMS<br />
level. 2 Significantly reducing the amount of time spent near these<br />
peak values by using a Gaussian d<strong>is</strong>tribution can therefore result<br />
in significantly reducing the amount of fatigue damage caused by<br />
the test relative to what the product will experience in the real<br />
world. So Gaussian d<strong>is</strong>tribution <strong>is</strong> not very real<strong>is</strong>tic.<br />
Hence, present-day methods of r<strong>and</strong>om testing may be unreal<strong>is</strong>tic<br />
for some simulations, because they fail to account for the enviornment’s<br />
most damaging content. Furthermore, r<strong>and</strong>om testing with<br />
Gaussian d<strong>is</strong>tribution will result in a longer time-to-failure, because<br />
10 SOUND & VIBRATION/FEBRUARY 2012<br />
www.S<strong>and</strong>V.com
10 0<br />
10 –1<br />
Probability Density<br />
10 –2<br />
10 –3<br />
10 –41<br />
Figure 6. PSD spectrum for trial #1330.<br />
2005 Jun 30 – 1117k3<br />
10 –5<br />
–5 –4 –3 –2 –1 0 1 2 3 4 5<br />
Sigma<br />
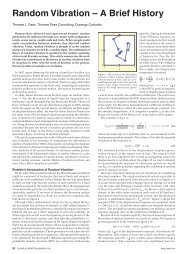
Figure 8. Probability density function for a lightbulb test using Gaussian<br />
d<strong>is</strong>tribution (k = 3).<br />
10 0<br />
10 –1<br />
Probability Density<br />
10 –2<br />
10 –3<br />
10 –4<br />
Figure 7. PSD spectrum for trial #1110.<br />
the higher accelerations responsible for failure have been omitted.<br />
Therefore, Gaussian r<strong>and</strong>om testing, for all its advantages over traditional<br />
sine testing, has its own d<strong>is</strong>advantages, <strong>and</strong> a better method<br />
of testing products <strong>is</strong> called for. <strong>Vibration</strong> Research Corporation<br />
has developed such a method. 3 It <strong>is</strong> called Kurtosion. Kurtosian<br />
allows a r<strong>and</strong>om vibration test to be run with a user-specified kurtos<strong>is</strong><br />
of 3 or greater. Th<strong>is</strong> amounts to using feedback to force the<br />
Control signal’s PDF to have broader “tails.” That <strong>is</strong>, more intense<br />
peak accelerations are included more often than using a Gaussian<br />
controller. Th<strong>is</strong> method permits the adjustment of the kurtos<strong>is</strong><br />
level while maintaining the same testing profile <strong>and</strong> spectrum<br />
attributes. With th<strong>is</strong> new technique, a r<strong>and</strong>om vibration test <strong>is</strong><br />
best described by a PSD <strong>and</strong> an RMS versus time schedule <strong>and</strong> an<br />
additional kurtos<strong>is</strong> value. The required kurtos<strong>is</strong> parameter can be<br />
easily measured from field data. Th<strong>is</strong> <strong>is</strong> similar to current r<strong>and</strong>om<br />
tests but <strong>is</strong> one step closer to the vibrations measured in the field.<br />
In Figure 8, the data set has a kurtos<strong>is</strong> value of three (Gaussian<br />
d<strong>is</strong>tribution) <strong>and</strong> <strong>is</strong> a smooth d<strong>is</strong>tribution with few large amplitude<br />
outliers. However, Figure 9 shows a data set with a kurtos<strong>is</strong> value<br />
of five. Note how the “tails” extend further from the mean, indicating<br />
a large number of outlier data points. The contrast between the<br />
PDFs of a Gaussian d<strong>is</strong>tribution <strong>and</strong> a higher kurtos<strong>is</strong> d<strong>is</strong>tribution<br />
<strong>is</strong> clearly seen in Figure 10.<br />
Therefore, the fundamental difference between a Gaussian <strong>and</strong><br />
controlled-kurtos<strong>is</strong> d<strong>is</strong>tribution <strong>is</strong> that, although the two data sets<br />
may have the same mean, st<strong>and</strong>ard deviation <strong>and</strong> other properties,<br />
the Gaussian data set has its data points closely centered on the<br />
mean, while the controlled-kurtos<strong>is</strong> d<strong>is</strong>tribution has larger “tails”<br />
further from the mean.<br />
2005 Jun 30 – 1320k5<br />
10 –5<br />
–8 –6 –4 –2 0 2 4 6 8<br />
Sigma<br />
Figure 9. Probability density function for lightbulb test using Kurtos<strong>is</strong><br />
Control (k = 5).<br />
Some Other <strong>Testing</strong> Options<br />
Modern test <strong>and</strong> measurement systems are blessed with inexpensive<br />
memory. In recent years, it has become feasible to record<br />
a long time h<strong>is</strong>tory <strong>and</strong> then play it back as a shake-test Control<br />
reference. <strong>Vibration</strong> Research pioneered such Field Data Replication<br />
(FDR) testing several years ago <strong>and</strong> just recently introduced<br />
their VR Observer, a highly portable four-channel recorder in<br />
support of th<strong>is</strong> <strong>and</strong> other testing purposes. While FDR <strong>is</strong> the preferred<br />
solution for many cases, it <strong>is</strong> not a replacement for r<strong>and</strong>om<br />
vibration testing. FDR provides an exact simulation of one instance<br />
of the environment. <strong>R<strong>and</strong>om</strong> provides a stat<strong>is</strong>tical average of that<br />
environment. Where FDR might exactly capture what one driver<br />
experiences while driving a prescribed route, r<strong>and</strong>om represents<br />
the average of thous<strong>and</strong>s of different drivers trying to follow the<br />
same course. While an FDR recording uses massive amounts of<br />
memory, a r<strong>and</strong>om reference requires very little.<br />
Certain mixed signal testing can also provide r<strong>and</strong>om signals<br />
with high kurtos<strong>is</strong>, but they are in no way competitive with Kurtosion.<br />
Sine-on-r<strong>and</strong>om tests may prove useful to simulate a specific<br />
environment with r<strong>and</strong>om <strong>and</strong> tonal components, such as an aircraft<br />
package-shelf experiencing both r<strong>and</strong>om airloads <strong>and</strong> engine<br />
harmonics. <strong>R<strong>and</strong>om</strong>-on-r<strong>and</strong>om tests superimpose narrow-b<strong>and</strong><br />
r<strong>and</strong>om no<strong>is</strong>e on broadb<strong>and</strong> r<strong>and</strong>om no<strong>is</strong>e. Such tests are claimed<br />
useful to simulate aircraft gunfire reactions. Both types of tests are<br />
designed to model a very specific class of environment <strong>and</strong> both<br />
are “tricky” to set up.<br />
Conclusions<br />
Overall, r<strong>and</strong>om vibration testing <strong>is</strong> an excellent general purpose<br />
tool for environmental vibration simulation. It <strong>is</strong> more efficient,<br />
www.S<strong>and</strong>V.com iNSTRUMENTATION REFERENCE ISSUE 11
more prec<strong>is</strong>e, <strong>and</strong> more real<strong>is</strong>tic for th<strong>is</strong> purpose than sine testing.<br />
Although r<strong>and</strong>om vibration testing <strong>is</strong> not perfect, the testing<br />
industry should use the techniques extensively in their screening<br />
<strong>and</strong> qualification procedures.<br />
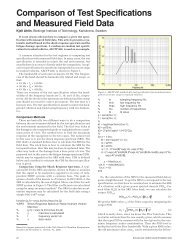
10 0<br />
10 –1<br />
Kurtos<strong>is</strong> = 7<br />
Kurtos<strong>is</strong> = 3<br />
References<br />
1. Tustin, Wayne, <strong>R<strong>and</strong>om</strong> <strong>Vibration</strong> & Shock <strong>Testing</strong>, Equipment Reliability<br />
Institute, Santa Barbara, CA, 2005.<br />
2. Connon, W. H., “Comments on Kurtos<strong>is</strong> of Military Vehicle <strong>Vibration</strong><br />
Data,” Journal of the Institute of Environmental Sciences, September/<br />
October 1991, pp. 38-41.<br />
3. Van Baren, Philip D., System <strong>and</strong> Method for Simultaneously Controlling<br />
Spectrum <strong>and</strong> Kurtos<strong>is</strong> of a <strong>R<strong>and</strong>om</strong> <strong>Vibration</strong>, US Patent Office<br />
#7,426,426 B2.<br />
Probability Density<br />
10 –2<br />
10 –3<br />
The author can be reached at: jvb@vibrationresearch.com.<br />
10 –4<br />
10 –5<br />
–8 –6 –4 –2 0 2 4 6 8<br />
Multiple of Sigma<br />
Figure 10. A compar<strong>is</strong>on of kurtos<strong>is</strong> values 3 <strong>and</strong> 7. Note how the higher<br />
kurtos<strong>is</strong> value includes higher peak accelerations.<br />
12 SOUND & VIBRATION/FEBRUARY 2012<br />
www.S<strong>and</strong>V.com