VARTRA: A Comparable Corpus for Analysis of Translation Variation
VARTRA: A Comparable Corpus for Analysis of Translation Variation
VARTRA: A Comparable Corpus for Analysis of Translation Variation

Create successful ePaper yourself
Turn your PDF publications into a flip-book with our unique Google optimized e-Paper software.
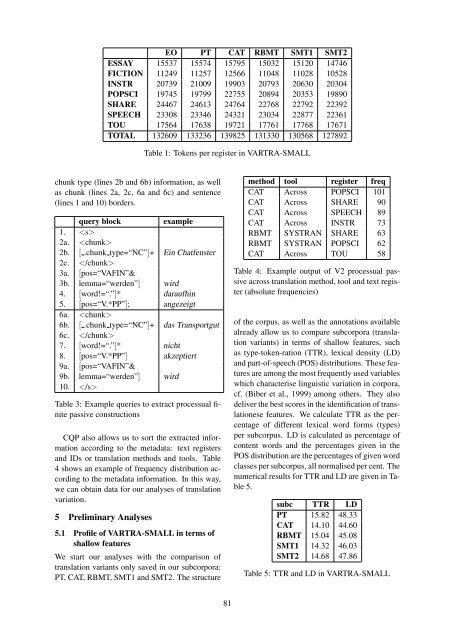
EO PT CAT RBMT SMT1 SMT2<br />
ESSAY 15537 15574 15795 15032 15120 14746<br />
FICTION 11249 11257 12566 11048 11028 10528<br />
INSTR 20739 21009 19903 20793 20630 20304<br />
POPSCI 19745 19799 22755 20894 20353 19890<br />
SHARE 24467 24613 24764 22768 22792 22392<br />
SPEECH 23308 23346 24321 23034 22877 22361<br />
TOU 17564 17638 19721 17761 17768 17671<br />
TOTAL 132609 133236 139825 131330 130568 127892<br />
Table 1: Tokens per register in <strong>VARTRA</strong>-SMALL<br />
chunk type (lines 2b and 6b) in<strong>for</strong>mation, as well<br />
as chunk (lines 2a, 2c, 6a and 6c) and sentence<br />
(lines 1 and 10) borders.<br />
query block<br />
example<br />
1. <br />
2a. <br />
2b. [ .chunk type=“NC”]+ Ein Chatfenster<br />
2c. <br />
3a. [pos=“VAFIN”&<br />
3b. lemma=“werden”] wird<br />
4. [word!=“.”]* daraufhin<br />
5. [pos=“V.*PP”]; angezeigt<br />
6a. <br />
6b. [ .chunk type=“NC”]+ das Transportgut<br />
6c. <br />
7. [word!=“.”]* nicht<br />
8. [pos=“V.*PP”] akzeptiert<br />
9a. [pos=“VAFIN”&<br />
9b. lemma=“werden”] wird<br />
10. <br />
Table 3: Example queries to extract processual finite<br />
passive constructions<br />
CQP also allows us to sort the extracted in<strong>for</strong>mation<br />
according to the metadata: text registers<br />
and IDs or translation methods and tools. Table<br />
4 shows an example <strong>of</strong> frequency distribution according<br />
to the metadata in<strong>for</strong>mation. In this way,<br />
we can obtain data <strong>for</strong> our analyses <strong>of</strong> translation<br />
variation.<br />
5 Preliminary Analyses<br />
5.1 Pr<strong>of</strong>ile <strong>of</strong> <strong>VARTRA</strong>-SMALL in terms <strong>of</strong><br />
shallow features<br />
We start our analyses with the comparison <strong>of</strong><br />
translation variants only saved in our subcorpora:<br />
PT, CAT, RBMT, SMT1 and SMT2. The structure<br />
method tool register freq<br />
CAT Across POPSCI 101<br />
CAT Across SHARE 90<br />
CAT Across SPEECH 89<br />
CAT Across INSTR 73<br />
RBMT SYSTRAN SHARE 63<br />
RBMT SYSTRAN POPSCI 62<br />
CAT Across TOU 58<br />
Table 4: Example output <strong>of</strong> V2 processual passive<br />
across translation method, tool and text register<br />
(absolute frequencies)<br />
<strong>of</strong> the corpus, as well as the annotations available<br />
already allow us to compare subcorpora (translation<br />
variants) in terms <strong>of</strong> shallow features, such<br />
as type-token-ration (TTR), lexical density (LD)<br />
and part-<strong>of</strong>-speech (POS) distributions. These features<br />
are among the most frequently used variables<br />
which characterise linguistic variation in corpora,<br />
cf. (Biber et al., 1999) among others. They also<br />
deliver the best scores in the identification <strong>of</strong> translationese<br />
features. We calculate TTR as the percentage<br />
<strong>of</strong> different lexical word <strong>for</strong>ms (types)<br />
per subcorpus. LD is calculated as percentage <strong>of</strong><br />
content words and the percentages given in the<br />
POS distribution are the percentages <strong>of</strong> given word<br />
classes per subcorpus, all normalised per cent. The<br />
numerical results <strong>for</strong> TTR and LD are given in Table<br />
5.<br />
subc TTR LD<br />
PT 15.82 48.33<br />
CAT 14.10 44.60<br />
RBMT 15.04 45.08<br />
SMT1 14.32 46.03<br />
SMT2 14.68 47.86<br />
Table 5: TTR and LD in <strong>VARTRA</strong>-SMALL<br />
81