23_237-252.pdf
23_237-252.pdf
23_237-252.pdf

You also want an ePaper? Increase the reach of your titles
YUMPU automatically turns print PDFs into web optimized ePapers that Google loves.
<strong>23</strong>8 THE LICHENOLOGIST Vol. <strong>23</strong><br />
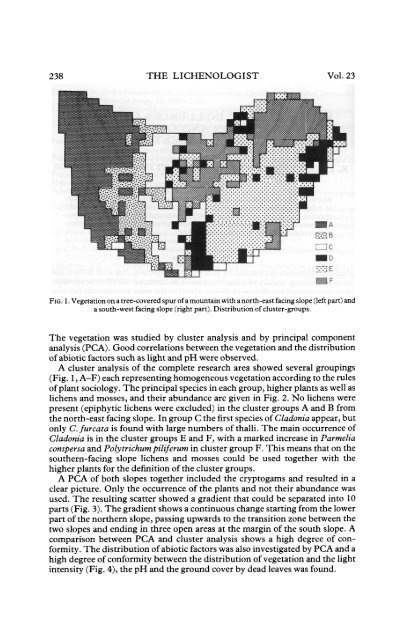
FIG. 1. Vegetation on a tree-covered spur of a mountain with a north-east facing slope (left part) and<br />
a south-west facing slope (right part). Distribution of cluster-groups.<br />
The vegetation was studied by cluster analysis and by principal component<br />
analysis (PCA). Good correlations between the vegetation and the distribution<br />
of abiotic factors such as light and pH were observed.<br />
A cluster analysis of the complete research area showed several groupings<br />
(Fig. 1, A-F) each representing homogeneous vegetation according to the rules<br />
of plant sociology. The principal species in each group, higher plants as well as<br />
lichens and mosses, and their abundance are given in Fig. 2. No lichens were<br />
present (epiphytic lichens were excluded) in the cluster groups A and B from<br />
the north-east facing slope. In group C the first species of Cladonia appear, but<br />
only C.furcata is found with large numbers of thalli. The main occurrence of<br />
Cladonia is in the cluster groups E and F, with a marked increase in Parmelia<br />
conspersa and Polytrichum piliferum in cluster group F. This means that on the<br />
southern-facing slope lichens and mosses could be used together with the<br />
higher plants for the definition of the cluster groups.<br />
A PCA of both slopes together included the cryptogams and resulted in a<br />
clear picture. Only the occurrence of the plants and not their abundance was<br />
used. The resulting scatter showed a gradient that could be separated into 10<br />
parts (Fig. 3). The gradient shows a continuous change starting from the lower<br />
part of the northern slope, passing upwards to the transition zone between the<br />
two slopes and ending in three open areas at the margin of the south slope. A<br />
comparison between PCA and cluster analysis shows a high degree of conformity.<br />
The distribution of abiotic factors was also investigated by PCA and a<br />
high degree of conformity between the distribution of vegetation and the light<br />
intensity (Fig. 4), the pH and the ground cover by dead leaves was found.