PDF (Author's version) - OATAO (Open Archive Toulouse Archive ...
PDF (Author's version) - OATAO (Open Archive Toulouse Archive ...
PDF (Author's version) - OATAO (Open Archive Toulouse Archive ...

You also want an ePaper? Increase the reach of your titles
YUMPU automatically turns print PDFs into web optimized ePapers that Google loves.
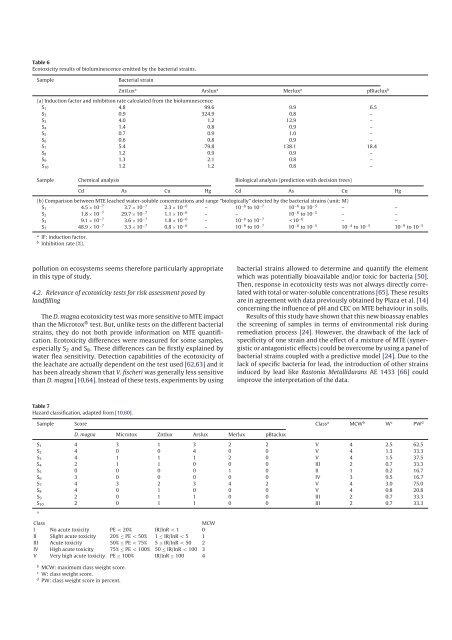
Table 6<br />
Ecotoxicity results of bioluminescence emitted by the bacterial strains.<br />
Sample Bacterial strain<br />
ZntLux a Arslux a Merlux a pBtaclux b<br />
(a) Induction factor and inhibition rate calculated from the bioluminescence<br />
S 1 4.8 99.6 9.9 6.5<br />
S 2 0.9 324.9 0.8 –<br />
S 3 4.0 1.2 12.9 –<br />
S 4 1.4 0.8 0.9 –<br />
S 5 0.7 0.9 1.0 –<br />
S 6 0.6 0.8 0.9 –<br />
S 7 5.4 79.8 138.1 18.4<br />
S 8 1.2 0.9 0.9 –<br />
S 9 1.3 2.1 0.8 –<br />
S 10 1.2 1.2 0.8 –<br />
Sample Chemical analysis Biological analysis (prediction with decision trees)<br />
Cd As Cu Hg Cd As Cu Hg<br />
(b) Comparison between MTE leached watersoluble concentrations and range “biologically” detected by the bacterial strains (unit: M)<br />
S 1 4.5 × 10 −7 3.7 × 10 −7 2.3 × 10 −6 – 10 −8 to 10 −7 10 −6 to 10 −5 – –<br />
S 2 1.8 × 10 −7 29.7 × 10 −7 1.1 × 10 −6 – – 10 −6 to 10 −5 – –<br />
S 3 9.1 × 10 −7 3.6 × 10 −7 1.8 × 10 −6 – 10 −8 to 10 −7 < 10 −6 – –<br />
S 7 48.9 × 10 −7 3.3 × 10 −7 0.8 × 10 −6 – 10 −8 to 10 −7 10 −6 to 10 −5 10 −4 to 10 −5 10 −9 to 10 −5<br />
a IF: induction factor.<br />
b Inhibition rate (%).<br />
pollution on ecosystems seems therefore particularly appropriate<br />
in this type of study.<br />
4.2. Relevance of ecotoxicity tests for risk assessment posed by<br />
landfilling<br />
The D. magna ecotoxicity test was more sensitive to MTE impact<br />
than the Microtox ® test. But, unlike tests on the different bacterial<br />
strains, they do not both provide information on MTE quantification.<br />
Ecotoxicity differences were measured for some samples,<br />
especially S 2 and S 8 . These differences can be firstly explained by<br />
water flea sensitivity. Detection capabilities of the ecotoxicity of<br />
the leachate are actually dependent on the test used [62,63] and it<br />
has been already shown that V. fischeri was generally less sensitive<br />
than D. magna [10,64]. Instead of these tests, experiments by using<br />
bacterial strains allowed to determine and quantify the element<br />
which was potentially bioavailable and/or toxic for bacteria [50].<br />
Then, response in ecotoxicity tests was not always directly correlated<br />
with total or watersoluble concentrations [65]. These results<br />
are in agreement with data previously obtained by Plaza et al. [14]<br />
concerning the influence of pH and CEC on MTE behaviour in soils.<br />
Results of this study have shown that this new bioassay enables<br />
the screening of samples in terms of environmental risk during<br />
remediation process [24]. However, the drawback of the lack of<br />
specificity of one strain and the effect of a mixture of MTE (synergistic<br />
or antagonistic effects) could be overcome by using a panel of<br />
bacterial strains coupled with a predictive model [24]. Due to the<br />
lack of specific bacteria for lead, the introduction of other strains<br />
induced by lead like Rastonia Metallidurans AE 1433 [66] could<br />
improve the interpretation of the data.<br />
Table 7<br />
Hazard classification, adapted from [10,60].<br />
Sample Score Class a MCW b W c PW d<br />
D. magna Microtox Zntlux Arslux Merlux pBtaclux<br />
S 1 4 3 1 3 2 2 V 4 2.5 62.5<br />
S 2 4 0 0 4 0 0 V 4 1.3 33.3<br />
S 3 4 1 1 1 2 0 V 4 1.5 37.5<br />
S 4 2 1 1 0 0 0 III 2 0.7 33.3<br />
S 5 0 0 0 0 1 0 II 1 0.2 16.7<br />
S 6 3 0 0 0 0 0 IV 3 0.5 16.7<br />
S 7 4 3 2 3 4 2 V 4 3.0 75.0<br />
S 8 4 0 1 0 0 0 V 4 0.8 20.8<br />
S 9 2 0 1 1 0 0 III 2 0.7 33.3<br />
S 10 2 0 1 1 0 0 III 2 0.7 33.3<br />
a<br />
Class<br />
MCW<br />
I No acute toxicity PE < 20% IR/InR < 1 0<br />
II Slight acute toxicity 20% ≤ PE < 50% 1 ≤ IR/InR < 5 1<br />
III Acute toxicity 50% ≤ PE < 75% 5 ≤ IR/InR < 50 2<br />
IV High acute toxicity 75% ≤ PE < 100% 50 ≤ IR/InR < 100 3<br />
V Very high acute toxicity PE ≥ 100% IR/InR ≥ 100 4<br />
b MCW: maximum class weight score.<br />
c W: class weight score.<br />
d PW: class weight score in percent.