

Understanding the Electric Vehicle Landscape to 2020 - IEA
Understanding the Electric Vehicle Landscape to 2020 - IEA
Understanding the Electric Vehicle Landscape to 2020 - IEA

Create successful ePaper yourself
Turn your PDF publications into a flip-book with our unique Google optimized e-Paper software.
Global EV Outlook DATA & ANALYSIS 15<br />
EVSE DEPLOYMENT TARGETS & PROGRESS [ continued ]<br />
EVSE TO EV RATIOS<br />
The absolute number of chargers is not <strong>the</strong> sole driver of EV<br />
development, of course. More EVSE is not necessarily better.<br />
Figure 10 shows EVI ratios of EVSE/EV, which appear <strong>to</strong> be<br />
declining or stabilizing as vehicle deployment increases and<br />
countries take s<strong>to</strong>ck of <strong>the</strong>ir existing EVSE capabilities.<br />
Figure 10. Non-Residential EVSE/EV Ratio<br />
[ EVI Countries ]<br />
Source: EVI.<br />
Slow Charger/EV Ratio<br />
0.35<br />
0.30<br />
0.25<br />
0.20<br />
0.15<br />
0.10<br />
0.05<br />
0.00<br />
FAST CHARGER/<br />
EV RATIO<br />
SLOW CHARGER/<br />
EV RATIO<br />
2008 2010 2012<br />
0.025<br />
0.020<br />
0.015<br />
0.010<br />
0.005<br />
0.000<br />
Fast Charger/EV Ratio<br />
DIFFERENT APPROACHES FOR DIFFERENT COUNTRIES<br />
The three EVI members selected in Figure 11 show how<br />
countries are approaching non-residential EVSE<br />
deployment in very different ways. Japan has already<br />
installed 1,381 fast chargers, which is <strong>the</strong> highest amount<br />
for any country worldwide, but has placed less emphasis<br />
on slow chargers <strong>to</strong> date. In <strong>the</strong> United States, conversely,<br />
<strong>the</strong> emphasis appears <strong>to</strong> be on slow charging, perhaps due<br />
<strong>to</strong> more reliance on home charging and <strong>the</strong> prevalence of<br />
PHEVs. Finally, in <strong>the</strong> Ne<strong>the</strong>rlands a mix of slow and fast<br />
chargers is being employed, resulting in <strong>the</strong> most EVSE<br />
per capita worldwide. There is no one correct path, ra<strong>the</strong>r<br />
different EVSE networks based on local needs.<br />
Figure 11. Different EVSE Deployment Profiles, 2012<br />
[ Select EVI Members ]<br />
Source: EVI.<br />
0.035<br />
0.6<br />
0.030<br />
0.5<br />
Early estimates of adequate non-residential EVSE/EV<br />
ratios range from 0.08 <strong>to</strong> 0.3. 6 Figure 10 shows that EVI<br />
countries currently fall within this range for slow charging.<br />
Fast Charger/EV Ratio<br />
0.025<br />
0.020<br />
0.015<br />
0.010<br />
0.4<br />
0.3<br />
0.2<br />
Slow Charger/EV Ratio<br />
While fast charging ratios are much lower, it is also possible<br />
0.005<br />
0.1<br />
that fast chargers are not as widely needed as previously<br />
thought. Preliminary research suggests, in fact, that a<br />
0.000<br />
Japan Ne<strong>the</strong>rlands United States<br />
0.0<br />
well-designed system would only need a few fast charging<br />
Fast Charger/EV Ratio Slow Charger/EV Ratio<br />
stations instead of blanketing a wide area. In one U.S. study,<br />
100-200 fast charging locations were deemed sufficient<br />
for good initial geographic coverage for <strong>the</strong> majority of<br />
drivers in California. 7 Fur<strong>the</strong>r research is needed <strong>to</strong> better<br />
understand <strong>the</strong> EVSE mix best suited <strong>to</strong> a given region’s<br />
EV fleet. China, for example, is aiming for a 1.25 EVSE/EV<br />
ratio by <strong>2020</strong> for slow chargers, but is waiting for market<br />
developments <strong>to</strong> determine <strong>the</strong> best fast charger ratio.<br />
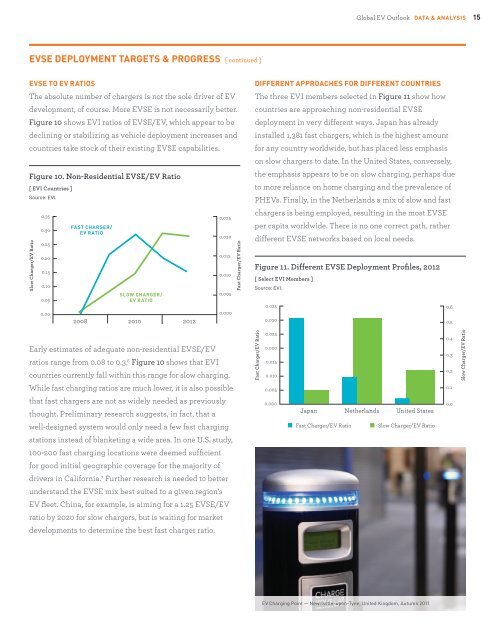
EV Charging Point — Newcastle-upon-Tyne, United Kingdom, Autumn 2011


