

Understanding the Electric Vehicle Landscape to 2020 - IEA
Understanding the Electric Vehicle Landscape to 2020 - IEA
Understanding the Electric Vehicle Landscape to 2020 - IEA

You also want an ePaper? Increase the reach of your titles
YUMPU automatically turns print PDFs into web optimized ePapers that Google loves.
Global EV Outlook DATA & ANALYSIS 16<br />
RESEARCH, DEVELOPMENT & DEMONSTRATION (RD&D)<br />
Research, development & demonstration (RD&D) are<br />
key activities for countries seeking <strong>to</strong> help technological<br />
innovation reach full market potential. The <strong>IEA</strong> tracks public<br />
sec<strong>to</strong>r energy RD&D among its 28 member countries. As seen<br />
in Figure 12, <strong>the</strong>re is a decreasing relative share of global<br />
RD&D spending since tracking began in 1981, though an<br />
increasing trend in absolute figures since <strong>the</strong> mid-1990s.<br />
There is a spike in funding in 2009 due <strong>to</strong> <strong>the</strong> U.S. economic<br />
stimulus, though several o<strong>the</strong>r countries, such as Germany<br />
and Japan, also increased RD&D in order <strong>to</strong> boost <strong>the</strong>ir<br />
au<strong>to</strong>motive sec<strong>to</strong>rs and overall economies. The ripple effects<br />
of <strong>the</strong> 2009 stimulus spending will likely continue for some<br />
time, especially given <strong>the</strong> substantial investments made in<br />
battery research and development.<br />
Figure 12. Public Sec<strong>to</strong>r Energy RD&D in <strong>IEA</strong> Countries<br />
Source: <strong>IEA</strong> databases, 2012 cycle.<br />
USD Billion (2011 Prices and PPP)<br />
25<br />
20<br />
15<br />
10<br />
5<br />
Energy Efficiency<br />
Fossil Fuels<br />
Renewable Energy Sources<br />
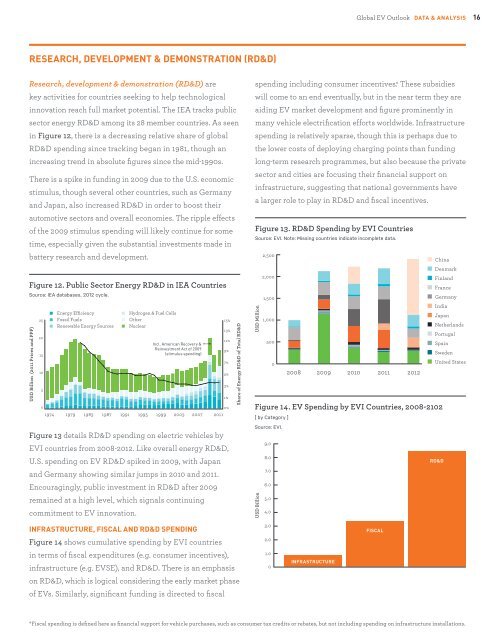
Figure 13 details RD&D spending on electric vehicles by<br />
EVI countries from 2008-2012. Like overall energy RD&D,<br />
U.S. spending on EV RD&D spiked in 2009, with Japan<br />
and Germany showing similar jumps in 2010 and 2011.<br />
Encouragingly, public investment in RD&D after 2009<br />
remained at a high level, which signals continuing<br />
commitment <strong>to</strong> EV innovation.<br />
Hydrogen & Fuel Cells<br />
O<strong>the</strong>r<br />
Nuclear<br />
Incl. American Recovery &<br />
Reinvestment Act of 2009<br />
(stimulus spending)<br />
0<br />
0%<br />
1974 1979 1983 1987 1991 1995 1999 2003 2007 2011<br />
15%<br />
13%<br />
11%<br />
9%<br />
7%<br />
5%<br />
3%<br />
1%<br />
Share of Energy RD&D of Total RD&D<br />
spending including consumer incentives.* These subsidies<br />
will come <strong>to</strong> an end eventually, but in <strong>the</strong> near term <strong>the</strong>y are<br />
aiding EV market development and figure prominently in<br />
many vehicle electrification efforts worldwide. Infrastructure<br />
spending is relatively sparse, though this is perhaps due <strong>to</strong><br />
<strong>the</strong> lower costs of deploying charging points than funding<br />
long-term research programmes, but also because <strong>the</strong> private<br />
sec<strong>to</strong>r and cities are focusing <strong>the</strong>ir financial support on<br />
infrastructure, suggesting that national governments have<br />
a larger role <strong>to</strong> play in RD&D and fiscal incentives.<br />
Figure 13. RD&D Spending by EVI Countries<br />
Source: EVI. Note: Missing countries indicate incomplete data.<br />
2,500<br />
China<br />
Denmark<br />
USD Million<br />
Figure 14. EV Spending by EVI Countries, 2008-2102<br />
[ by Category ]<br />
Source: EVI.<br />
9.0<br />
8.0<br />
RD&D<br />
7.0<br />
6.0<br />
USD Billion<br />
2,000<br />
Finland<br />
France<br />
1,500<br />
Germany<br />
India<br />
Japan<br />
1,000<br />
Ne<strong>the</strong>rlands<br />
Portugal<br />
500<br />
Spain<br />
Sweden<br />
0<br />
United States<br />
2008 2009 2010 2011 2012<br />
5.0<br />
4.0<br />
INFRASTRUCTURE, FISCAL AND RD&D SPENDING<br />
Figure 14 shows cumulative spending by EVI countries<br />
in terms of fiscal expenditures (e.g. consumer incentives),<br />
infrastructure (e.g. EVSE), and RD&D. There is an emphasis<br />
on RD&D, which is logical considering <strong>the</strong> early market phase<br />
of EVs. Similarly, significant funding is directed <strong>to</strong> fiscal<br />
3.0<br />
2.0<br />
1.0<br />
0<br />
INFRASTRUCTURE<br />
FISCAL<br />
*Fiscal spending is defined here as financial support for vehicle purchases, such as consumer tax credits or rebates, but not including spending on infrastructure installations.


