operational analysis of a select spinning mill - International ...
operational analysis of a select spinning mill - International ...
operational analysis of a select spinning mill - International ...

Create successful ePaper yourself
Turn your PDF publications into a flip-book with our unique Google optimized e-Paper software.
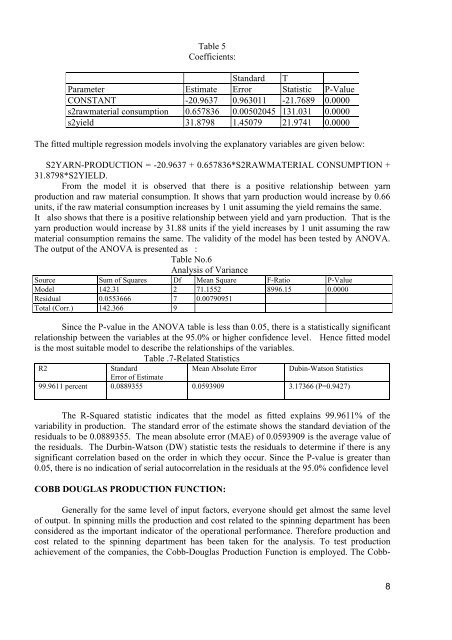
Table 5<br />
Coefficients:<br />
Standard T<br />
Parameter Estimate Error Statistic P-Value<br />
CONSTANT -20.9637 0.963011 -21.7689 0.0000<br />
s2rawmaterial consumption 0.657836 0.00502045 131.031 0.0000<br />
s2yield 31.8798 1.45079 21.9741 0.0000<br />
The fitted multiple regression models involving the explanatory variables are given below:<br />
S2YARN-PRODUCTION = -20.9637 + 0.657836*S2RAWMATERIAL CONSUMPTION +<br />
31.8798*S2YIELD.<br />
From the model it is observed that there is a positive relationship between yarn<br />
production and raw material consumption. It shows that yarn production would increase by 0.66<br />
units, if the raw material consumption increases by 1 unit assuming the yield remains the same.<br />
It also shows that there is a positive relationship between yield and yarn production. That is the<br />
yarn production would increase by 31.88 units if the yield increases by 1 unit assuming the raw<br />
material consumption remains the same. The validity <strong>of</strong> the model has been tested by ANOVA.<br />
The output <strong>of</strong> the ANOVA is presented as :<br />
Table No.6<br />
Analysis <strong>of</strong> Variance<br />
Source Sum <strong>of</strong> Squares Df Mean Square F-Ratio P-Value<br />
Model 142.31 2 71.1552 8996.15 0.0000<br />
Residual 0.0553666 7 0.00790951<br />
Total (Corr.) 142.366 9<br />
Since the P-value in the ANOVA table is less than 0.05, there is a statistically significant<br />
relationship between the variables at the 95.0% or higher confidence level. Hence fitted model<br />
is the most suitable model to describe the relationships <strong>of</strong> the variables.<br />
Table .7-Related Statistics<br />
R2<br />
Standard<br />
Mean Absolute Error Dubin-Watson Statistics<br />
Error <strong>of</strong> Estimate<br />
99.9611 percent 0.0889355 0.0593909 3.17366 (P=0.9427)<br />
The R-Squared statistic indicates that the model as fitted explains 99.9611% <strong>of</strong> the<br />
variability in production. The standard error <strong>of</strong> the estimate shows the standard deviation <strong>of</strong> the<br />
residuals to be 0.0889355. The mean absolute error (MAE) <strong>of</strong> 0.0593909 is the average value <strong>of</strong><br />
the residuals. The Durbin-Watson (DW) statistic tests the residuals to determine if there is any<br />
significant correlation based on the order in which they occur. Since the P-value is greater than<br />
0.05, there is no indication <strong>of</strong> serial autocorrelation in the residuals at the 95.0% confidence level<br />
COBB DOUGLAS PRODUCTION FUNCTION:<br />
Generally for the same level <strong>of</strong> input factors, everyone should get almost the same level<br />
<strong>of</strong> output. In <strong>spinning</strong> <strong>mill</strong>s the production and cost related to the <strong>spinning</strong> department has been<br />
considered as the important indicator <strong>of</strong> the <strong>operational</strong> performance. Therefore production and<br />
cost related to the <strong>spinning</strong> department has been taken for the <strong>analysis</strong>. To test production<br />
achievement <strong>of</strong> the companies, the Cobb-Douglas Production Function is employed. The Cobb-<br />
8