The estimation of the public investment multiplier in Romania - ipedr
The estimation of the public investment multiplier in Romania - ipedr
The estimation of the public investment multiplier in Romania - ipedr

You also want an ePaper? Increase the reach of your titles
YUMPU automatically turns print PDFs into web optimized ePapers that Google loves.
2010 International Conference on Bus<strong>in</strong>ess and Economics<br />
Research<br />
vol.1 (2011) © (2011) IACSIT Press, Kuala Lumpur, Malaysia<br />
<strong>The</strong> <strong>estimation</strong> <strong>of</strong> <strong>the</strong> <strong>public</strong> <strong><strong>in</strong>vestment</strong> <strong>multiplier</strong> <strong>in</strong> <strong>Romania</strong><br />
Socol Cristian<br />
Affiliation: Academy <strong>of</strong> Economic Studies, Department <strong>of</strong><br />
Economics<br />
Bucharest, <strong>Romania</strong><br />
email: socol.cristian@gmail.com<br />
Mar<strong>in</strong>aş Marius-Corneliu<br />
Affiliation: Academy <strong>of</strong> Economic Studies, Department <strong>of</strong><br />
Economics<br />
Bucharest, <strong>Romania</strong><br />
email: mar<strong>in</strong>asmarius@yahoo.fr<br />
Socol Aura-Gabriela<br />
Affiliation: Academy <strong>of</strong> Economic Studies, Department <strong>of</strong><br />
Economics<br />
Bucharest, <strong>Romania</strong><br />
email: auragabriela.socol@gmail.com<br />
Măntescu Dor<strong>in</strong><br />
Affiliation: Department <strong>of</strong> State Budget, M<strong>in</strong>istry <strong>of</strong><br />
F<strong>in</strong>ance,<br />
Bucharest, <strong>Romania</strong><br />
email: dor<strong>in</strong>.mantescu@mf<strong>in</strong>ante.ro<br />
Abstract— This study has been <strong>in</strong>cluded <strong>in</strong> <strong>the</strong> larger <strong>the</strong>me<br />
referr<strong>in</strong>g to effectiveness <strong>of</strong> <strong>the</strong> fiscal policy tools for<br />
stimulat<strong>in</strong>g an economy which is affected by <strong>the</strong> economic<br />
crisis. <strong>The</strong> objective has been to settle <strong>the</strong> importance degree <strong>of</strong><br />
<strong>the</strong> state’s capital spend<strong>in</strong>g <strong>in</strong> stimulat<strong>in</strong>g <strong>the</strong> <strong>Romania</strong>n<br />
economic activity, under <strong>the</strong> terms <strong>in</strong> which <strong>the</strong> exit from<br />
recession is hardly anticipated for <strong>the</strong> end <strong>of</strong> 2011. <strong>The</strong> results<br />
obta<strong>in</strong>ed with<strong>in</strong> an OLS regression are <strong>in</strong> compliance with<br />
those which have been calculated by OECD for <strong>the</strong> emerg<strong>in</strong>g<br />
countries from <strong>the</strong> Eastern and Central Europe. <strong>The</strong> <strong>multiplier</strong><br />
<strong>of</strong> <strong>the</strong> <strong>public</strong> <strong><strong>in</strong>vestment</strong>s estimated for <strong>the</strong> period 2000:1-<br />
2010:1 has been 0.7, so that under <strong>the</strong> terms <strong>of</strong> <strong>in</strong>creas<strong>in</strong>g <strong>the</strong><br />
state’s capital spend<strong>in</strong>g by 1 Euro, <strong>the</strong> GDP has only <strong>in</strong>creased<br />
by 0.7 Euro.<br />
Key words: fiscal policy; <strong>public</strong> <strong><strong>in</strong>vestment</strong>; OLS regression;<br />
<strong>multiplier</strong><br />
I. INTRODUCTION<br />
<strong>The</strong> current economic crisis has reopened <strong>the</strong> debate on<br />
<strong>the</strong> opportunity <strong>of</strong> us<strong>in</strong>g <strong>the</strong> <strong>public</strong> spend<strong>in</strong>g as an <strong>in</strong>strument<br />
for economic recovery and for <strong>the</strong> employment <strong>in</strong>crease. <strong>The</strong><br />
<strong>in</strong>terest <strong>in</strong> identify<strong>in</strong>g <strong>of</strong> <strong>the</strong> most efficient fiscal stimuli for<br />
re-launch<strong>in</strong>g <strong>the</strong> economies <strong>in</strong> crisis has <strong>in</strong>creased, especially<br />
under <strong>the</strong> terms <strong>in</strong> which <strong>the</strong> expansionary monetary policy<br />
implemented by most <strong>of</strong> <strong>the</strong> central banks has not generated<br />
an <strong>in</strong>crease <strong>of</strong> <strong>the</strong> private economic agents’ confidence, and,<br />
consequently, an <strong>in</strong>crease <strong>in</strong> consumption and <strong>in</strong> <strong>the</strong> private<br />
<strong><strong>in</strong>vestment</strong>s. In <strong>the</strong> Keynesian economic <strong>the</strong>ory, <strong>the</strong> <strong>public</strong><br />
spend<strong>in</strong>g have a higher impact upon <strong>the</strong> GDP, if compared to<br />
<strong>the</strong> transfers or to <strong>the</strong> level <strong>of</strong> taxes, as <strong>the</strong> latter ones do not<br />
generate a direct <strong>in</strong>fluence upon output, but <strong>the</strong>y <strong>in</strong>itially<br />
<strong>in</strong>fluence <strong>the</strong> available <strong>in</strong>come and afterwards <strong>the</strong> level <strong>of</strong><br />
<strong>the</strong> private consumption, to a lower extent [5]. Accord<strong>in</strong>g to<br />
this approach, <strong>the</strong> <strong>multiplier</strong> <strong>of</strong> <strong>the</strong> government spend<strong>in</strong>g is<br />
greater than 1, be<strong>in</strong>g higher for <strong>the</strong> countries which record a<br />
lower tendency towards import and for those which have a<br />
fixed rate <strong>of</strong> exchange. O<strong>the</strong>r economic ma<strong>in</strong>streams (such<br />
as those <strong>of</strong> rational anticipations, <strong>the</strong> real bus<strong>in</strong>ess cycle, and<br />
<strong>the</strong> economic <strong>in</strong>stitutionalism) deny <strong>the</strong> importance <strong>of</strong> <strong>the</strong><br />
<strong>in</strong>crease <strong>of</strong> <strong>the</strong> <strong>public</strong> spend<strong>in</strong>g <strong>in</strong> stimulat<strong>in</strong>g economy, as<br />
<strong>the</strong> <strong>multiplier</strong> is lower than 1 and it tends to zero as <strong>the</strong> time<br />
passes. Accord<strong>in</strong>g to <strong>the</strong>se ma<strong>in</strong>streams, <strong>the</strong> <strong>in</strong>dividuals<br />
anticipate <strong>the</strong> future <strong>in</strong>crease <strong>of</strong> taxes so that <strong>the</strong> budget<br />
deficits generated by <strong>the</strong> <strong>in</strong>crease <strong>of</strong> <strong>the</strong> <strong>public</strong> spend<strong>in</strong>g<br />
could be covered, and thus a change <strong>in</strong> <strong>the</strong> liv<strong>in</strong>g standard<br />
will not occur.<br />
II. HOW GREAT IS THE IMPACT OF THE PUBLIC<br />
INVESTMENTS UPON ECONOMY?<br />
<strong>The</strong>oretically, <strong>the</strong> <strong>public</strong> <strong><strong>in</strong>vestment</strong>s have a great shortterm<br />
multiply<strong>in</strong>g effect upon <strong>the</strong> aggregate demand and a<br />
long-term multiply<strong>in</strong>g effect upon <strong>the</strong> aggregate <strong>of</strong>fer,<br />
especially when <strong>the</strong>y determ<strong>in</strong>e <strong>the</strong> decrease <strong>of</strong> <strong>the</strong><br />
transaction costs. However, <strong>the</strong>re are also o<strong>the</strong>r conditions<br />
which may <strong>in</strong>fluence <strong>the</strong> greatness <strong>of</strong> <strong>the</strong>se spend<strong>in</strong>g’ impact<br />
upon economy, <strong>in</strong> <strong>the</strong>ir absence <strong>the</strong> <strong>multiplier</strong> <strong>of</strong> <strong>the</strong> <strong>public</strong><br />
<strong><strong>in</strong>vestment</strong>s be<strong>in</strong>g <strong>in</strong>significant. Firstly, <strong>the</strong> government<br />
should make sure that will allocate sufficient f<strong>in</strong>ancial<br />
resources for achiev<strong>in</strong>g <strong>the</strong> settled <strong><strong>in</strong>vestment</strong> projects.<br />
Moreover, <strong>the</strong> local authorities should benefit from <strong>the</strong><br />
central government’s support whenever certa<strong>in</strong> local projects<br />
may cease due to <strong>the</strong> lack <strong>of</strong> funds. Any cessation / blockage<br />
<strong>of</strong> <strong>the</strong> projects which are f<strong>in</strong>anced from <strong>the</strong> state budget<br />
would only generate temporary effects upon output, and <strong>the</strong><br />
long-term <strong>multiplier</strong> will tend to zero or it will even become<br />
negative. <strong>The</strong>refore, <strong>the</strong> economies which are characterized<br />
by a lack <strong>of</strong> multi-annual schedules for <strong>the</strong> <strong><strong>in</strong>vestment</strong><br />
spend<strong>in</strong>g or by radically chang<strong>in</strong>g <strong>the</strong> dest<strong>in</strong>ation <strong>of</strong> <strong>the</strong><br />
<strong>public</strong> funds depend<strong>in</strong>g on <strong>the</strong> election cycles will record a<br />
limited multiply<strong>in</strong>g effect. State <strong><strong>in</strong>vestment</strong>s will not have a<br />
<strong>multiplier</strong> effect on economy and will be considered as a<br />
waste by <strong>the</strong> private economic agents. <strong>The</strong>y will not desire to<br />
<strong>in</strong>crease <strong>the</strong> taxes contribution level for <strong>the</strong>ir future projects,<br />
and any decision to <strong>in</strong>crease taxation will result <strong>in</strong> <strong>the</strong><br />
<strong>in</strong>crease <strong>of</strong> tax evasion. Secondly, <strong>the</strong> <strong>public</strong> <strong><strong>in</strong>vestment</strong><br />
20
projects should be transparent when referr<strong>in</strong>g to <strong>the</strong> spend<strong>in</strong>g<br />
and <strong>the</strong>y should not be affected by <strong>the</strong> corruption spectrum.<br />
Its perception will result <strong>in</strong> los<strong>in</strong>g <strong>the</strong> <strong>in</strong>ternal support for<br />
achiev<strong>in</strong>g any project <strong>of</strong> <strong>the</strong> state, but it will also block <strong>the</strong><br />
achievement <strong>of</strong> efficient <strong>public</strong>-private partnerships for great<br />
projects.<br />
<strong>The</strong> <strong>multiplier</strong> <strong>of</strong> <strong>the</strong> capital <strong>public</strong> spend<strong>in</strong>g is<br />
considered to be lower on a short term as a result <strong>of</strong> <strong>the</strong><br />
temporal lags <strong>in</strong>duced by <strong>the</strong> approval and <strong>the</strong><br />
implementation <strong>of</strong> <strong>the</strong> new <strong><strong>in</strong>vestment</strong> projects and its is<br />
considered higher on a long term as a result <strong>of</strong> <strong>the</strong> <strong>in</strong>crease <strong>of</strong><br />
capital stock and <strong>of</strong> <strong>the</strong> <strong>in</strong>crease <strong>of</strong> <strong>the</strong> potential GDP [2].<br />
Accord<strong>in</strong>g to Romp and DeHaan [7], <strong>the</strong> impact <strong>of</strong> <strong>the</strong> <strong>public</strong><br />
<strong><strong>in</strong>vestment</strong>s is not l<strong>in</strong>ear, be<strong>in</strong>g generally lower <strong>in</strong> <strong>the</strong><br />
developed economies and higher <strong>in</strong> <strong>the</strong> develop<strong>in</strong>g<br />
economies. Accord<strong>in</strong>g to <strong>the</strong> estimates made <strong>in</strong> a OECD<br />
study [6], based on <strong>the</strong> DSGE model (2009), <strong>the</strong> <strong>multiplier</strong> <strong>of</strong><br />
<strong>the</strong> <strong>public</strong> <strong><strong>in</strong>vestment</strong>s is less than one on a short term <strong>in</strong><br />
most <strong>of</strong> <strong>the</strong> analyzed countries (0.7 <strong>in</strong> Belgium, <strong>the</strong><br />
Ne<strong>the</strong>rlands and Ireland, 0.8 <strong>in</strong> Germany, France, Italy and<br />
Great Brita<strong>in</strong>, 0.9 <strong>in</strong> USA) and approximately equal to one<br />
on a medium term <strong>in</strong> Germany, France, Italy, Spa<strong>in</strong> and<br />
Great Brita<strong>in</strong>. <strong>The</strong> <strong>multiplier</strong> <strong>of</strong> <strong>the</strong> <strong>public</strong> <strong><strong>in</strong>vestment</strong>s <strong>in</strong> <strong>the</strong><br />
Eastern and Central Europe (Czech Re<strong>public</strong>, Hungary,<br />
Slovakia and Poland) is 0.7 dur<strong>in</strong>g <strong>the</strong> year when <strong>the</strong><br />
<strong><strong>in</strong>vestment</strong> takes place. Although on a short time it is lower<br />
than 1 with<strong>in</strong> all OECD countries, <strong>the</strong> <strong>multiplier</strong> <strong>of</strong> <strong>the</strong><br />
<strong><strong>in</strong>vestment</strong>s is <strong>the</strong> highest among <strong>the</strong> fiscal <strong>multiplier</strong>s.<br />
III. THE RELEVANCE OF THIS STUDY FOR ROMANIA<br />
In this study we expla<strong>in</strong>ed to what extent <strong>the</strong> <strong>in</strong>crease <strong>of</strong><br />
<strong>the</strong> <strong>public</strong> spend<strong>in</strong>g may constitute an anti-crisis measure <strong>in</strong><br />
<strong>Romania</strong>, under <strong>the</strong> terms <strong>in</strong> which <strong>the</strong> economy should cope<br />
with two major challenges. <strong>The</strong> first one refers to <strong>the</strong> deep<br />
recession that affected <strong>the</strong> <strong>Romania</strong>n economy start<strong>in</strong>g with<br />
quarter IV <strong>of</strong> 2008, which determ<strong>in</strong>ed <strong>the</strong> GDP contraction<br />
by 7.1% <strong>in</strong> 2009 and by approximately 2.6% dur<strong>in</strong>g <strong>the</strong> first<br />
quarter <strong>of</strong> 2010. Accord<strong>in</strong>g to <strong>the</strong> latest forecasts, <strong>Romania</strong><br />
will be <strong>the</strong> only Eastern and Central European country which<br />
has not exited <strong>the</strong> recession and it would record a 2%<br />
decrease dur<strong>in</strong>g this year, as <strong>the</strong> decrease <strong>of</strong> consumption<br />
and <strong>of</strong> <strong>the</strong> private <strong><strong>in</strong>vestment</strong>s have neutralized <strong>the</strong> benefic<br />
<strong>in</strong>fluence generated by <strong>the</strong> <strong>in</strong>crease <strong>of</strong> <strong>the</strong> <strong>Romania</strong>n exports<br />
along with <strong>the</strong> return <strong>of</strong> <strong>the</strong> economy with<strong>in</strong> <strong>the</strong> Euro zone.<br />
<strong>The</strong> second challenge refers to <strong>the</strong> achievement <strong>of</strong> <strong>the</strong> fiscal<br />
consolidation process assumed by <strong>the</strong> government authorities<br />
along with <strong>the</strong> conclusion <strong>of</strong> <strong>the</strong> agreement with IMF <strong>in</strong><br />
March 2009. Accord<strong>in</strong>g to this agreement, <strong>Romania</strong><br />
committed to decrease <strong>the</strong> level <strong>of</strong> <strong>the</strong> budget deficit from<br />
8.3% <strong>in</strong> 2009 to 6.8% <strong>in</strong> 2010 and to 4.4% <strong>in</strong> 2011.<br />
On <strong>the</strong> one hand, <strong>the</strong> implementation <strong>of</strong> a restrictive<br />
fiscal policy may be considered to be totally <strong>in</strong>applicable<br />
dur<strong>in</strong>g this period <strong>of</strong> decrease <strong>of</strong> economic activity, as it will<br />
delay <strong>the</strong> economic recovery. On <strong>the</strong> o<strong>the</strong>r hand,<br />
implement<strong>in</strong>g such a fiscal policy is necessary due to <strong>the</strong><br />
errors made dur<strong>in</strong>g <strong>the</strong> strong economic expansion years<br />
(2005 – 2008), such as <strong>the</strong> <strong>in</strong>crease <strong>of</strong> pensions <strong>in</strong> a higher<br />
rhythm than to <strong>the</strong> wages <strong>in</strong>crease, <strong>the</strong> <strong>in</strong>crease <strong>in</strong> <strong>the</strong><br />
number <strong>of</strong> employees <strong>in</strong> <strong>the</strong> <strong>public</strong> sector, <strong>the</strong> <strong>in</strong>crease <strong>of</strong><br />
social assistance dur<strong>in</strong>g <strong>the</strong> election years, which have<br />
generated an accumulation <strong>of</strong> higher and higher budget<br />
deficits. In order to implement a restrictive fiscal policy, <strong>the</strong><br />
government has two major options: <strong>the</strong> <strong>in</strong>crease <strong>of</strong> taxation<br />
and <strong>the</strong> decrease <strong>of</strong> <strong>the</strong> <strong>public</strong> spend<strong>in</strong>g. <strong>The</strong> <strong>in</strong>crease <strong>of</strong><br />
taxation might not generate additional revenues to <strong>the</strong> state<br />
budget due to <strong>the</strong> tax evasion and to <strong>the</strong> economic agents’<br />
tendency to re-locate <strong>in</strong> countries which have a lower<br />
taxation, so that <strong>the</strong> decrease <strong>of</strong> <strong>the</strong> state’s spend<strong>in</strong>g seems to<br />
be <strong>the</strong> only valid choice to decrease <strong>the</strong> budget deficit on a<br />
long term. However, what type <strong>of</strong> spend<strong>in</strong>g should <strong>the</strong><br />
government reduce so that it would not generate <strong>the</strong><br />
medium-term extension <strong>of</strong> <strong>the</strong> recession? Consider<strong>in</strong>g <strong>the</strong><br />
economic <strong>the</strong>ory, <strong>the</strong> social transfers generate a lower impact<br />
upon economy, if compared to o<strong>the</strong>r types <strong>of</strong> spend<strong>in</strong>g, such<br />
as <strong>the</strong> procurement <strong>of</strong> goods and services by <strong>the</strong> state and <strong>the</strong><br />
<strong>public</strong> <strong><strong>in</strong>vestment</strong>s, so that <strong>the</strong> decrease <strong>in</strong> <strong>the</strong> case <strong>of</strong> <strong>the</strong><br />
firstly mentioned category could constitute a variant chosen<br />
by <strong>the</strong> <strong>Romania</strong>n authorities.<br />
However, <strong>the</strong> economic reality may contradict <strong>the</strong> above<br />
conclusion, especially with<strong>in</strong> <strong>the</strong> economies which are<br />
characterized by a high corruption <strong>in</strong> <strong>the</strong> case <strong>of</strong> <strong>the</strong> projects<br />
which are f<strong>in</strong>anced by <strong>the</strong> state (such as <strong>in</strong> <strong>Romania</strong>) or <strong>in</strong><br />
<strong>the</strong> economies <strong>in</strong> which <strong>the</strong> absence <strong>of</strong> multi-annual budget<br />
programs may result <strong>in</strong> <strong>the</strong> def<strong>in</strong>itive block<strong>in</strong>g <strong>of</strong> some<br />
<strong><strong>in</strong>vestment</strong> projects, as <strong>in</strong> <strong>the</strong> case <strong>of</strong> <strong>Romania</strong>. That is <strong>the</strong><br />
reason why, this study will make estimates on <strong>the</strong> impact <strong>of</strong><br />
<strong>public</strong> <strong><strong>in</strong>vestment</strong>s upon output (GDP) <strong>in</strong> order to check to<br />
what extent <strong>the</strong> obta<strong>in</strong>ed results are <strong>in</strong> compliance with <strong>the</strong><br />
<strong>the</strong>oretical approaches.<br />
Accord<strong>in</strong>g to <strong>the</strong> 2010 State Budget Law, a percentage <strong>of</strong><br />
6.5% <strong>of</strong> <strong>the</strong> GDP was settled for <strong>the</strong> <strong>public</strong> <strong><strong>in</strong>vestment</strong>s, 60%<br />
<strong>of</strong> <strong>the</strong>ir sources be<strong>in</strong>g represented by <strong>the</strong> <strong>in</strong>ternal resources<br />
<strong>in</strong>cluded <strong>in</strong> <strong>the</strong> budget, and <strong>the</strong> rest <strong>of</strong> 40% be<strong>in</strong>g represented<br />
by <strong>the</strong> pre-adhesion funds, <strong>the</strong> post-adhesion funds and <strong>the</strong><br />
external credits. <strong>The</strong> objective <strong>of</strong> <strong>the</strong> f<strong>in</strong>ancial allocation was<br />
to limit <strong>the</strong> rhythm <strong>of</strong> economic recession and to partially<br />
compensate <strong>the</strong> decrease recorded <strong>in</strong> <strong>the</strong> private sector<br />
activity.<br />
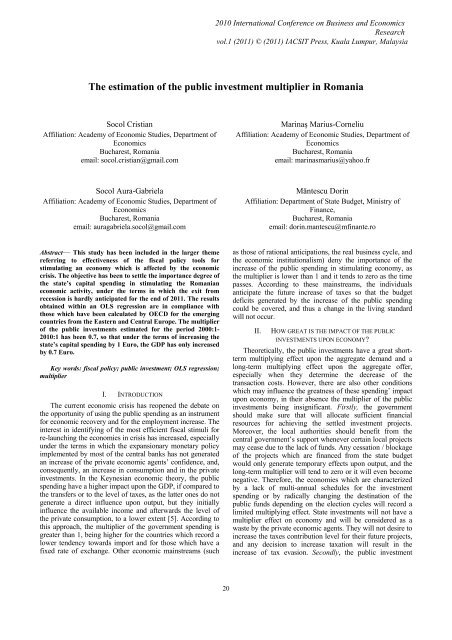
5000<br />
©<br />
4000<br />
3000<br />
2000<br />
1000<br />
0<br />
00 01 02 03 04 05 06 07 08 09<br />
GFCF<br />
GFCF_SA<br />
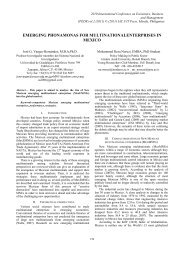
Figure 1. <strong>The</strong> evolutions <strong>of</strong> GFCF and GFCF seasonal adjustment<br />
IV. DESCRIPTION OF THE METHODOLOGY USED<br />
In order to identify <strong>the</strong> multiply<strong>in</strong>g effect <strong>of</strong> <strong>the</strong> state’s<br />
capital spend<strong>in</strong>g, we have used series <strong>of</strong> quarterly data for<br />
<strong>the</strong> GDP and for <strong>the</strong> state’s gross fixed capital formation<br />
(GFCF) dur<strong>in</strong>g <strong>the</strong> period between 2000:1 and 2010:1, <strong>the</strong><br />
data source be<strong>in</strong>g Eurostat. <strong>The</strong> dependent variable <strong>of</strong> <strong>the</strong><br />
21
OLS regression is <strong>the</strong> GDP and <strong>the</strong> exogenous variables are<br />
<strong>the</strong> lagged values <strong>of</strong> <strong>the</strong> GDP (outl<strong>in</strong><strong>in</strong>g <strong>the</strong> autoregressive<br />
characteristic <strong>of</strong> this series <strong>of</strong> data), <strong>the</strong> lagged values <strong>of</strong> <strong>the</strong><br />
state’s capital formation (outl<strong>in</strong><strong>in</strong>g <strong>the</strong> lag <strong>of</strong> transmitt<strong>in</strong>g <strong>the</strong><br />
<strong>in</strong>fluences upon output) and a dummy variable for <strong>the</strong><br />
purpose <strong>of</strong> outl<strong>in</strong><strong>in</strong>g <strong>the</strong> structural breaks <strong>of</strong> <strong>the</strong> endogenous<br />
variable.<br />
<strong>The</strong> presence <strong>of</strong> seasonality is obvious <strong>in</strong> <strong>the</strong> case <strong>of</strong> <strong>the</strong><br />
spend<strong>in</strong>g for <strong><strong>in</strong>vestment</strong>s, under <strong>the</strong> terms <strong>of</strong> <strong>the</strong> absence <strong>of</strong> a<br />
multi-annual budget schedule (GFCF series <strong>in</strong> Fig. 1). <strong>The</strong><br />
amounts which have not been spent dur<strong>in</strong>g <strong>the</strong> first quarters<br />
(due to <strong>the</strong> delays <strong>in</strong> <strong>the</strong> development <strong>of</strong> certa<strong>in</strong> <strong><strong>in</strong>vestment</strong><br />
projects) have been used dur<strong>in</strong>g <strong>the</strong> 4 th quarter <strong>of</strong> <strong>the</strong> year,<br />
mostly with o<strong>the</strong>r dest<strong>in</strong>ations than those mentioned <strong>in</strong> <strong>the</strong><br />
<strong>in</strong>itial budget schedule. This phenomenon accentuated<br />
beg<strong>in</strong>n<strong>in</strong>g with 2005, along with <strong>the</strong> <strong>in</strong>crease <strong>of</strong> <strong>the</strong> budget<br />
resources granted for <strong><strong>in</strong>vestment</strong>s. For example, <strong>in</strong> 2006 and<br />
2007, dur<strong>in</strong>g <strong>the</strong> 4 th quarter, <strong>the</strong> spend<strong>in</strong>g were 50% higher<br />
than dur<strong>in</strong>g <strong>the</strong> previous quarters, and <strong>the</strong> amounts exceeded<br />
10% <strong>of</strong> <strong>the</strong> GDP correspond<strong>in</strong>g to <strong>the</strong> 4 th quarter. To remove<br />
<strong>the</strong> <strong>in</strong>fluence <strong>of</strong> seasonality, we have used <strong>the</strong> Tramo/Seats<br />
econometric procedure (GFCF_SA series <strong>in</strong> Fig. 1), GFCF<br />
be<strong>in</strong>g expressed <strong>in</strong> millions <strong>of</strong> Euro, and <strong>in</strong> <strong>the</strong> prices <strong>of</strong> <strong>the</strong><br />
previous year. As a result, <strong>the</strong> <strong>in</strong>crease <strong>of</strong> <strong>the</strong> budget<br />
resources for <strong><strong>in</strong>vestment</strong>s have not also guaranteed <strong>the</strong><br />
<strong>in</strong>crease <strong>of</strong> efficiency <strong>in</strong> us<strong>in</strong>g <strong>the</strong>m and, or, consequently,<br />
<strong>the</strong> <strong>in</strong>crease <strong>of</strong> <strong>the</strong> impact upon <strong>the</strong> real economy.<br />
<strong>The</strong> data series <strong>of</strong> <strong>the</strong> GDP is seasonal adjustment, be<strong>in</strong>g<br />
expressed under <strong>the</strong> form <strong>of</strong> annualized rhythms, compared<br />
to <strong>the</strong> same quarter dur<strong>in</strong>g <strong>the</strong> previous year, <strong>the</strong> result be<strong>in</strong>g<br />
a number <strong>of</strong> 41 observations. In order to get <strong>the</strong> two data<br />
series <strong>in</strong> l<strong>in</strong>e, we have also expressed <strong>the</strong> seasonal<br />
adjustment series <strong>of</strong> <strong>the</strong> gross capital formation under <strong>the</strong><br />
form <strong>of</strong> annualized percentage changes. As a result, <strong>the</strong><br />
coefficient <strong>of</strong> <strong>the</strong> regression between <strong>the</strong> two variables will<br />
represent <strong>the</strong> GDP elasticity related to <strong>the</strong> <strong>public</strong><br />
<strong><strong>in</strong>vestment</strong>s. <strong>The</strong> annual variation <strong>of</strong> <strong>the</strong> gross capital<br />
formation is much higher than <strong>the</strong> annual change <strong>of</strong> <strong>the</strong><br />
GDP, as a result <strong>of</strong> <strong>the</strong> <strong>in</strong>crease by approximately six times<br />
<strong>of</strong> <strong>the</strong> amounts granted for <strong><strong>in</strong>vestment</strong>s dur<strong>in</strong>g those ten<br />
years. Thus, <strong>the</strong> average rate <strong>of</strong> <strong>in</strong>crease <strong>in</strong> spend<strong>in</strong>g for<br />
<strong><strong>in</strong>vestment</strong>s was 35%, compared to an average <strong>of</strong> 4.2% <strong>of</strong><br />
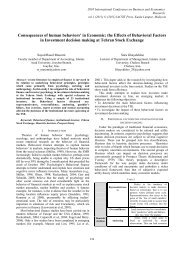
GDP <strong>in</strong>crease. As for <strong>the</strong> GDP, <strong>the</strong> highest annualized<br />
<strong>in</strong>creas<strong>in</strong>g rhythm was recorded dur<strong>in</strong>g <strong>the</strong> 1 st quarter <strong>of</strong><br />
2000 (11.6%), and <strong>the</strong> highest decrease was recorded dur<strong>in</strong>g<br />
<strong>the</strong> second quarter <strong>of</strong> 2009 (-8.7%). Moreover, dur<strong>in</strong>g <strong>the</strong><br />
last 5 quarters <strong>in</strong>cluded <strong>in</strong> <strong>the</strong> estimate, <strong>Romania</strong> recorded<br />
decreases <strong>of</strong> <strong>the</strong> GDP (Fig 2). <strong>The</strong> most quarterly budget<br />
resources for <strong><strong>in</strong>vestment</strong>s were granted dur<strong>in</strong>g <strong>the</strong> period<br />
2007:4-2008:3, when <strong>the</strong> economy was still <strong>in</strong> an economic<br />
expansion. <strong>The</strong> actual recession was not counter-balanced by<br />
<strong>in</strong>creas<strong>in</strong>g <strong>the</strong> spend<strong>in</strong>g for <strong><strong>in</strong>vestment</strong>s, and thus <strong>the</strong>y<br />
decreased by 20% dur<strong>in</strong>g <strong>the</strong> 3 rd quarter <strong>of</strong> 2009, compared<br />
to <strong>the</strong> similar quarter <strong>of</strong> <strong>the</strong> previous year.<br />
Previously to test<strong>in</strong>g <strong>the</strong> OLS regression, we have<br />
estimated <strong>the</strong> stationarity <strong>of</strong> <strong>the</strong> data series <strong>in</strong> order to<br />
identify <strong>the</strong> <strong>in</strong>tegration order for <strong>the</strong> used variables. <strong>The</strong><br />
stationarity <strong>of</strong> a data series supposes that its stochastic<br />
features, respectively <strong>the</strong> average, <strong>the</strong> dispersion, <strong>the</strong> covariation,<br />
should be constant and <strong>the</strong>y should not vary<br />
depend<strong>in</strong>g on time. Moreover, a stationary series tends to<br />
return to <strong>the</strong> average value and to fluctuate around it (it has a<br />
f<strong>in</strong>ite variation). On <strong>the</strong> contrary, a non-stationary series<br />
recorded a different average <strong>in</strong> various moments.<br />
.12<br />
.08<br />
.04<br />
.00<br />
-.04<br />
-.08<br />
-.12<br />
2.5<br />
2.0<br />
1.5<br />
1.0<br />
0.5<br />
0.0<br />
-0.5<br />
Figure 2. <strong>The</strong> annualized percentage change <strong>of</strong> GDP and GFCF_SA<br />
Critical<br />
values<br />
t-<br />
statistic<br />
00 01 02 03 04 05 06 07 08 09<br />
TABLE I.<br />
GFCF<br />
ADF(0)<br />
-4.545785<br />
GDP<br />
00 01 02 03 04 05 06 07 08 09<br />
GFCF_SA<br />
STATIONARITY TESTS<br />
GFCF<br />
PP(0)<br />
-2.978697<br />
GDP<br />
ADF(0)<br />
-3.750680<br />
GDP<br />
PP(0)<br />
-2.370746<br />
1% -3.615588 -2.624057 -3.610453 -2.624057*<br />
5% -2.941145 -1.949319 -2.938987 -1.949319<br />
10% -2.609066 -1.611711 -2.607932 -1.611711<br />
Table footnote: *) non-stationary at <strong>the</strong> 1% significance thresholds, but<br />
stationary at 5% and 10<br />
Mak<strong>in</strong>g an analysis accord<strong>in</strong>g to <strong>the</strong> ADF and Phillips-<br />
Perron (PP) tests for <strong>the</strong> stationarity hypo<strong>the</strong>sis for <strong>the</strong> two<br />
series, we may notice a presence <strong>of</strong> a stationarity <strong>of</strong> <strong>the</strong> two<br />
variables, thus allow<strong>in</strong>g <strong>the</strong>ir use at <strong>the</strong> <strong>in</strong>itial level (TABLE<br />
I).<br />
For <strong>the</strong> purpose <strong>of</strong> consider<strong>in</strong>g <strong>the</strong> structural breaks <strong>of</strong><br />
<strong>the</strong> GDP (<strong>the</strong> dependent variable with<strong>in</strong> <strong>the</strong> model), we have<br />
created a dummy variable correspond<strong>in</strong>g to <strong>the</strong> 1 st quarter <strong>of</strong><br />
2009, marked as dummy 2009:1 , which corresponds to revers<strong>in</strong>g<br />
<strong>the</strong> GDP evolution trend, mark<strong>in</strong>g its decrease by 6.2%<br />
subsequently to a period <strong>of</strong> cont<strong>in</strong>uous <strong>in</strong>crease beg<strong>in</strong>n<strong>in</strong>g<br />
with <strong>the</strong> 1 st quarter <strong>of</strong> 2001.<br />
V. THE RESULTS OF ESTIMATIONS<br />
Initially, we analyzed <strong>the</strong> GDP reaction to <strong>the</strong> change <strong>of</strong><br />
<strong>the</strong> state’s gross fixed capital formation by means <strong>of</strong> an OLS<br />
regression with <strong>the</strong> follow<strong>in</strong>g form:<br />
22
gdp = α + β ⋅ gdp( −n)<br />
+ δ ⋅ gfcf ( −n)<br />
+ φ ⋅dummy20091:<br />
+ ε (1)<br />
Where,<br />
gdp – <strong>the</strong> annual economic growth rate;<br />
gfcf – <strong>the</strong> annual percentage change <strong>of</strong> <strong>the</strong> state’s gross<br />
fixed capital formation;<br />
n –<strong>the</strong> number <strong>of</strong> <strong>the</strong> quarters with which gdp and gfcf are<br />
lagged, outl<strong>in</strong><strong>in</strong>g <strong>the</strong> impact upon <strong>the</strong> current gdp; ε –<br />
residual <strong>of</strong> OLS regression;<br />
α – regression constant; β – autoregressive coefficient <strong>of</strong> <strong>the</strong><br />
GDP; δ – <strong>the</strong> GDP elasticity depend<strong>in</strong>g on <strong>the</strong> GFCF;<br />
ϕ –coefficient which outl<strong>in</strong>es <strong>the</strong> dummy variable’s<br />
<strong>in</strong>fluence dur<strong>in</strong>g <strong>the</strong> 1 st quarter <strong>of</strong> 2009 upon <strong>the</strong> GDP.<br />
For <strong>the</strong> purpose <strong>of</strong> estimat<strong>in</strong>g <strong>the</strong> regression coefficients,<br />
we have used <strong>the</strong> Eviews 6 s<strong>of</strong>tware, <strong>the</strong> obta<strong>in</strong>ed results<br />
be<strong>in</strong>g <strong>in</strong>cluded <strong>in</strong> TABLE II.<br />
<strong>The</strong> results outl<strong>in</strong>e <strong>the</strong> existence <strong>of</strong> an autoregressive<br />
model <strong>of</strong> order 1, <strong>the</strong> β coefficient be<strong>in</strong>g 0.82, and this<br />
corresponds to a high dependence <strong>of</strong> <strong>the</strong> rate <strong>of</strong> economic<br />
growth dur<strong>in</strong>g <strong>the</strong> n quarter on <strong>the</strong> rate <strong>of</strong> <strong>in</strong>crease which was<br />
recorded dur<strong>in</strong>g n-1 quarter. <strong>The</strong> dummy variable <strong>in</strong>cluded <strong>in</strong><br />
<strong>the</strong> regression determ<strong>in</strong>ed a decrease by approximately 9.6%<br />
<strong>of</strong> <strong>the</strong> GDP dur<strong>in</strong>g <strong>the</strong> analyzed period.<br />
TABLE II.<br />
THE RESULTS OF THE OLS REGRESSION<br />
Dependent Variable: gdp; Sample (adjusted): 2000Q4 2010Q1<br />
Included observations: 38 after adjustments<br />
Variable Coefficient Std. Error t-Statistic Prob.<br />
gfcf(-3) 0.016344 0.006345 2.575885 0.0145<br />
gdp(-1) 0.824125 0.066810 12.33539 0.0000<br />
dummy 2009:1 -0.096317 0.020503 -4.697712 0.0000<br />
C 0.004367 0.005192 0.841076 0.4062<br />
R-squared 0.842149 Mean dependent var 0.043079<br />
Adjusted R-<br />
squared<br />
0.828221 S.D. dependent var 0.048734<br />
S.E. <strong>of</strong> regression 0.020199 Akaike <strong>in</strong>fo criterion -4.867106<br />
Sum squared resid 0.013871 Schwarz criterion -4.694728<br />
Log likelihood 96.47501 F-statistic 60.46429<br />
Durb<strong>in</strong>-Watson<br />
2.015431 Prob(F-statistic) 0.000000<br />
stat<br />
<strong>The</strong> <strong>public</strong> <strong><strong>in</strong>vestment</strong>s do not have an immediate impact<br />
upon <strong>the</strong> rate <strong>of</strong> economic growth, as <strong>the</strong> <strong>in</strong>fluence is<br />
transmitted with three quarters lags, and this is expla<strong>in</strong>ed by<br />
<strong>the</strong> existence <strong>of</strong> a temporal lags between <strong>the</strong> actual spend<strong>in</strong>g<br />
<strong>of</strong> that money and <strong>the</strong> development <strong>of</strong> <strong>the</strong> state’s <strong><strong>in</strong>vestment</strong><br />
projects. <strong>The</strong> GFCF elasticity <strong>of</strong> GDP is 0.016, namely <strong>the</strong><br />
1% <strong>in</strong>crease <strong>of</strong> <strong>the</strong> spend<strong>in</strong>g for <strong><strong>in</strong>vestment</strong>s determ<strong>in</strong>es an<br />
additional economic growth by 0.016% with<strong>in</strong><br />
approximately n<strong>in</strong>e months. <strong>The</strong> selection <strong>of</strong> <strong>the</strong> third lag is<br />
also confirmed by <strong>the</strong> Granger causality test which outl<strong>in</strong>es<br />
<strong>the</strong> extent to which <strong>the</strong> forecast <strong>of</strong> a variable can be<br />
improved by <strong>in</strong>clud<strong>in</strong>g ano<strong>the</strong>r variable. Accord<strong>in</strong>g to <strong>the</strong><br />
results <strong>of</strong> this test, which have been <strong>in</strong>cluded <strong>in</strong> TABLE III,<br />
GDP can be <strong>the</strong> best forecasted by <strong>in</strong>clud<strong>in</strong>g <strong>the</strong> gfcf variable<br />
which is lagged by three lags, <strong>the</strong> probability related to thus<br />
test record<strong>in</strong>g a value which is even lower than <strong>the</strong> 1%<br />
rejection threshold related to hypo<strong>the</strong>sis H0. Moreover, <strong>in</strong><br />
<strong>the</strong> case <strong>of</strong> a very low probability (6.27%), <strong>the</strong> economic<br />
growth process also represents an <strong>in</strong>strument for <strong>the</strong> gfcf<br />
forecast with<strong>in</strong> three quarters.<br />
TABLE III.<br />
Granger test<br />
assumptions<br />
THE RESULTS OF THE GRANGER TEST<br />
Lags: 3 – 38<br />
observations<br />
Lags: 4 – 37<br />
observations<br />
F- Probability F- Probability<br />
Statistic<br />
Statistic<br />
5.31416 0.00451 3.73340 0.01478<br />
gfcf does not<br />
cause Granger<br />
gdp<br />
gdp does not 2.69730 0.06287 2.40221 0.07357<br />
cause Granger<br />
gfcf<br />
Based on <strong>the</strong> elasticity coefficient, we calculated <strong>the</strong><br />
<strong>multiplier</strong> <strong>of</strong> <strong>the</strong> <strong>public</strong> <strong><strong>in</strong>vestment</strong> (ΔGDP/ΔGFCF),<br />
accord<strong>in</strong>g to below relation:<br />
gdp ΔGDP<br />
GFCF<br />
0<br />
δ = = ⋅<br />
(2)<br />
gfcf ΔGFCF<br />
GDP<br />
0<br />
Under <strong>the</strong> terms <strong>in</strong> which <strong>the</strong> state’s gross fixed capital<br />
formation percentage <strong>of</strong> <strong>the</strong> GDP, correspond<strong>in</strong>g to <strong>the</strong><br />
<strong>in</strong>itial period (1 st quarter <strong>of</strong> 2000) was 2.26%, <strong>the</strong>n <strong>the</strong> extent<br />
<strong>of</strong> <strong>the</strong> <strong>multiplier</strong> was 0.7 (= 0.016/0.0226). Thus, <strong>the</strong> <strong>in</strong>crease<br />
by 1 Euro <strong>of</strong> <strong>the</strong> spend<strong>in</strong>g for <strong><strong>in</strong>vestment</strong>s determ<strong>in</strong>ed <strong>the</strong><br />
<strong>in</strong>crease <strong>of</strong> <strong>the</strong> GDP by only 0.7 Euro after three quarters,<br />
and this constituted a pro<strong>of</strong> for <strong>the</strong> absence <strong>of</strong> <strong><strong>in</strong>vestment</strong>s’<br />
entail<strong>in</strong>g effects recorded dur<strong>in</strong>g <strong>the</strong> analyzed period and for<br />
<strong>the</strong> waste <strong>of</strong> <strong>the</strong> <strong>public</strong> money.<br />
<strong>The</strong> estimated model meets all <strong>the</strong> conditions which<br />
provide its validity:<br />
• 82% <strong>of</strong> <strong>the</strong> change <strong>of</strong> economic growth rate is<br />
expla<strong>in</strong>ed by <strong>the</strong> exogenous variables <strong>in</strong>cluded <strong>in</strong><br />
<strong>the</strong> regression, and all <strong>the</strong> regression coefficients<br />
(except <strong>the</strong> constant) are significantly different<br />
from 0;<br />
• <strong>the</strong> probability related to <strong>the</strong> Jarque-Bera test is<br />
0.34, be<strong>in</strong>g higher than <strong>the</strong> 5% threshold, and thus<br />
hypo<strong>the</strong>sis H0 <strong>of</strong> <strong>the</strong> normality <strong>in</strong> residual<br />
distribution is accepted;<br />
• <strong>the</strong> probability related to <strong>the</strong> Breusch-Godfrey test<br />
is 0.58, and this corresponds to accept<strong>in</strong>g <strong>the</strong><br />
hypo<strong>the</strong>sis H0 <strong>of</strong> absence <strong>of</strong> correlation <strong>in</strong> <strong>the</strong><br />
regression errors; moreover, <strong>the</strong> same absence <strong>of</strong><br />
autocorrelation is outl<strong>in</strong>ed <strong>in</strong> Table 2 by <strong>the</strong> value<br />
<strong>of</strong> <strong>the</strong> Durb<strong>in</strong>-Watson test;<br />
• White Heteroskedasticity test has a probability <strong>of</strong><br />
0.30, which is higher than <strong>the</strong> acceptance threshold<br />
for hypo<strong>the</strong>sis H0 referr<strong>in</strong>g to <strong>the</strong> regression<br />
homoskedasticity, thus confirm<strong>in</strong>g <strong>the</strong> absence <strong>of</strong><br />
residual regression’s dependence on <strong>the</strong> model’s<br />
<strong>in</strong>dependent variables.<br />
23
VI. CONCLUSIONS<br />
Subsequently to perform<strong>in</strong>g this study, we believe that<br />
<strong>the</strong> ma<strong>in</strong> reasons for a subunit <strong>multiplier</strong> <strong>of</strong> <strong>the</strong> <strong>public</strong><br />
<strong><strong>in</strong>vestment</strong>s <strong>in</strong> <strong>Romania</strong> are <strong>the</strong> follows:<br />
• <strong>the</strong> absence <strong>of</strong> a multi-annual budget schedule which<br />
blocks <strong>the</strong> achievement <strong>of</strong> great projects or <strong>the</strong><br />
completion <strong>of</strong> <strong>the</strong> projects which have already been<br />
started;<br />
• <strong>the</strong> dependence <strong>of</strong> <strong>the</strong> projects’ objectives on <strong>the</strong><br />
election cycle, as it generates a “new” prioritiz<strong>in</strong>g <strong>of</strong><br />
<strong>the</strong> <strong><strong>in</strong>vestment</strong>s;<br />
• <strong>the</strong> money which has not been spent for <strong><strong>in</strong>vestment</strong>s<br />
accord<strong>in</strong>g to <strong>the</strong> budget grant<strong>in</strong>g settled at <strong>the</strong><br />
beg<strong>in</strong>n<strong>in</strong>g <strong>of</strong> each year; most <strong>of</strong> <strong>the</strong> amounts have<br />
been wasted by us<strong>in</strong>g <strong>the</strong>m dur<strong>in</strong>g <strong>the</strong> last quarter <strong>of</strong><br />
each year dur<strong>in</strong>g <strong>the</strong> period 2005-2008;<br />
• <strong>the</strong> absence <strong>of</strong> medium- and long-term entail<strong>in</strong>g<br />
effects upon <strong>the</strong> real economy; normally, <strong>the</strong>se<br />
spend<strong>in</strong>g are mostly important for <strong>the</strong>ir long-term<br />
role upon <strong>the</strong> potential GDP;<br />
• <strong>the</strong> absence <strong>of</strong> transparency <strong>in</strong> <strong>the</strong> case <strong>of</strong> <strong>the</strong> <strong>public</strong><br />
money, this fact determ<strong>in</strong><strong>in</strong>g budget allocations<br />
which are higher than <strong>the</strong> actual spend<strong>in</strong>g for <strong>the</strong><br />
achievement <strong>of</strong> <strong>the</strong> projects.<br />
ACKNOWLEDGMENT<br />
This paper represents a partial dissem<strong>in</strong>ation <strong>of</strong> <strong>the</strong><br />
exploratory research projects IDEAS, Substantiat<strong>in</strong>g and<br />
Implement<strong>in</strong>g an Econometric Model <strong>of</strong> Growth <strong>in</strong> <strong>the</strong><br />
Efficiency <strong>of</strong> <strong>the</strong> Fiscal Policy with reference to <strong>Romania</strong>’s<br />
Adheration to <strong>the</strong> Eurozone, research contract no.<br />
1766/2008, PNCD II, Program Ideas/ Explor<strong>in</strong>g Research<br />
Projects program, 3 years, 3 stages, Project Manager Socol<br />
Cristian.<br />
REFERENCES<br />
[1] W. Easterly, I. Thomas, and L. Serven, “Walk<strong>in</strong>g up <strong>the</strong> down<br />
escalator: Public <strong><strong>in</strong>vestment</strong> and fiscal stability”, <strong>The</strong> World Bank<br />
Research Observer, 23(1), 2008, pp 37–56, Wash<strong>in</strong>gton, DC<br />
[2] G. Giudice, A. Turr<strong>in</strong>i, and J. <strong>in</strong>´t Veld, “Can Fiscal Consolidations<br />
be Expansionary <strong>in</strong> <strong>the</strong> EU? Ex-post Evidence and Ex-ante Analysis,”<br />
European Economy, Economic Papers, No. 195, 2003 (Brussels:<br />
European Commission)<br />
[3] R. Hemm<strong>in</strong>g., M. Kell and S. Mahfouz, “<strong>The</strong> effectiveness <strong>of</strong> fiscal<br />
policy <strong>in</strong> stimulat<strong>in</strong>g <strong>the</strong> economic activity - A review <strong>of</strong> <strong>the</strong><br />
literature”, IMF Work<strong>in</strong>g Paper WP/02/208, 2002<br />
[4] T. H. Hoon, and E. S. Phelps, “Future fiscal and budgetary shocks”,<br />
Journal <strong>of</strong> Economic <strong>The</strong>ory, No. 143, 2008, pp.499-518<br />
[5] J. M. Keynes, <strong>The</strong> General <strong>The</strong>ory <strong>of</strong> Income, Employment and<br />
Money, London, Macmillan, 1936<br />
[6] OECD, "<strong>The</strong> Effectiveness and Scope <strong>of</strong> Fiscal Stimulus," OECD<br />
Economic Outlook Interim Report, March 2009, Chapter 3, pp. 105-<br />
150<br />
[7] W. Romp, and J. de Haan, “Public Capital and Economic Growth: A<br />
Critical Survey”, <strong>The</strong> European Investment Bank Papers, 10(1), 2005,<br />
pp. 40-71<br />
[8] Eurostat database, European Commission, august 2010<br />
24