The Mysteries (Myths) of Nutrient Use Efficiency
The Mysteries (Myths) of Nutrient Use Efficiency
The Mysteries (Myths) of Nutrient Use Efficiency

Create successful ePaper yourself
Turn your PDF publications into a flip-book with our unique Google optimized e-Paper software.
<strong>The</strong> <strong>Mysteries</strong> (<strong>Myths</strong>) <strong>of</strong><br />
<strong>Nutrient</strong> <strong>Use</strong> <strong>Efficiency</strong><br />
By David W. Dibb<br />
<strong>Nutrient</strong> use efficiency (NUE) is <strong>of</strong>ten<br />
misunderstood...or misrepresented...if<br />
it is discussed as an isolated issue and<br />
not in the context <strong>of</strong> the efficiency <strong>of</strong> the total<br />
crop production system. It is important to<br />
remember that efficiency and economic viability<br />
<strong>of</strong> the total food production<br />
system are objectives<br />
within which the various<br />
components need to be optimized<br />
to achieve overall<br />
goals.<br />
Where nutrients are purchased<br />
inputs, land is most <strong>of</strong>ten the primary<br />
limiting resource in terms <strong>of</strong> its availability.<br />
<strong>The</strong>re are areas where more land could be<br />
brought into production, but most <strong>of</strong>ten those<br />
are marginal lands in terms <strong>of</strong> their production<br />
potential. <strong>The</strong>ir exploitation would likely<br />
result in significantly increased costs in terms<br />
<strong>of</strong> pollution, loss <strong>of</strong> wildlife habitat, reduction<br />
<strong>of</strong> recreational areas, or elimination <strong>of</strong> other<br />
publicly perceived value. In other words, the<br />
most productive land is already being used.<br />
Thus, the most effective way <strong>of</strong> improving the<br />
system’s efficiency is through continuous<br />
increases in yields. This will improve the efficiency<br />
<strong>of</strong> the system as a whole because the<br />
primary limiting resource (land) is more productive<br />
in terms <strong>of</strong> yield per unit farmed.<br />
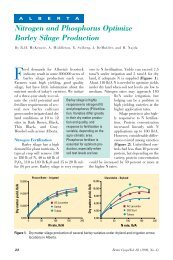
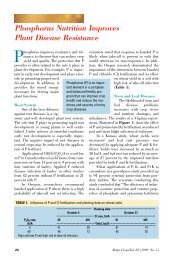
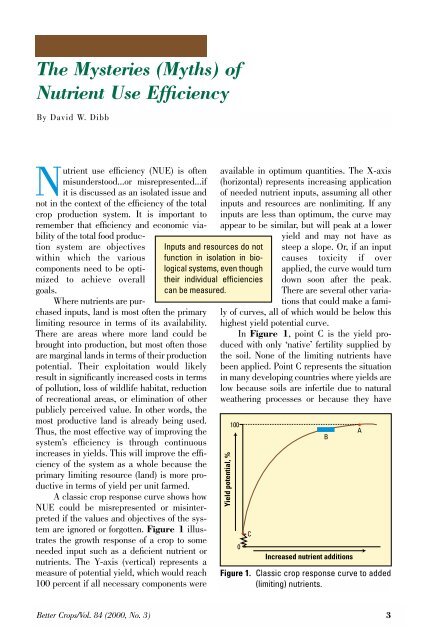
A classic crop response curve shows how<br />
NUE could be misrepresented or misinterpreted<br />
if the values and objectives <strong>of</strong> the system<br />
are ignored or forgotten. Figure 1 illustrates<br />
the growth response <strong>of</strong> a crop to some<br />
needed input such as a deficient nutrient or<br />
nutrients. <strong>The</strong> Y-axis (vertical) represents a<br />
measure <strong>of</strong> potential yield, which would reach<br />
100 percent if all necessary components were<br />
Inputs and resources do not<br />
function in isolation in biological<br />
systems, even though<br />
their individual efficiencies<br />
can be measured.<br />
available in optimum quantities. <strong>The</strong> X-axis<br />
(horizontal) represents increasing application<br />
<strong>of</strong> needed nutrient inputs, assuming all other<br />
inputs and resources are nonlimiting. If any<br />
inputs are less than optimum, the curve may<br />
appear to be similar, but will peak at a lower<br />
yield and may not have as<br />
steep a slope. Or, if an input<br />
causes toxicity if over<br />
applied, the curve would turn<br />
down soon after the peak.<br />
<strong>The</strong>re are several other variations<br />
that could make a family<br />
<strong>of</strong> curves, all <strong>of</strong> which would be below this<br />
highest yield potential curve.<br />
In Figure 1, point C is the yield produced<br />
with only ‘native’ fertility supplied by<br />
the soil. None <strong>of</strong> the limiting nutrients have<br />
been applied. Point C represents the situation<br />
in many developing countries where yields are<br />
low because soils are infertile due to natural<br />
weathering processes or because they have<br />
Yield potential, %<br />
100<br />
0<br />
C<br />
Increased nutrient additions<br />
Figure 1. Classic crop response curve to added<br />
(limiting) nutrients.<br />
B<br />
A<br />
Better Crops/Vol. 84 (2000, No. 3) 3
een cropped for many years without replacing<br />
removed nutrients. Point A is the maximum<br />
yield potential at a given production site<br />
assuming all inputs are optimum. Point B is<br />
actually a range that depends on variables <strong>of</strong><br />
cost and value which define the ‘target’ <strong>of</strong> the<br />
production system. This ‘target’ is where land<br />
use efficiency (LUE) is highest and where all<br />
other inputs and resources are interacting at<br />
their optimum level. It is just below the maximum<br />
yield potential. Within this range is also<br />
the economic optimum, where the greatest net<br />
return to inputs is achieved by the particular<br />
cropping system.<br />
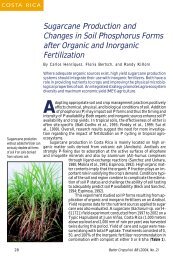
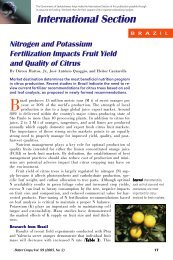
If we arbitrarily divide the response curve<br />
into four areas, we can discuss some general<br />
aspects <strong>of</strong> NUE and LUE and compare them<br />
for both developed and developing agriculture<br />
and see how some misconceptions may occur.<br />
We will label these areas I, II, III, and IV, from<br />
the bottom to the top <strong>of</strong> the response curve,<br />
illustrated in Figure 2.<br />
Area I is at the bottom <strong>of</strong> the<br />
response curve. It is characterized by very<br />
low yields. Few nutrients are available or<br />
applied. Often the only nutrient application is<br />
through incorporation <strong>of</strong> limited crop residues<br />
or animal and human waste materials that may<br />
be available but not sufficient to move very far<br />
up the yield curve. Any addition <strong>of</strong> a limiting<br />
nutrient gives a relatively large response, as<br />
indicated by the steepness <strong>of</strong> the curve.<br />
Because yields are very low, LUE is very low.<br />
Environmental concerns are significant, since<br />
Yield potential, %<br />
100<br />
75<br />
50<br />
25<br />
0<br />
C<br />
Area I<br />
Area II<br />
Area III<br />
Area IV<br />
Increased nutrient additions<br />
Figure 2. <strong>Nutrient</strong> use efficiency (NUE) and land<br />
use efficiency (LUE) are compatible.<br />
B<br />
A<br />
crops grow poorly and slowly, exposing the<br />
land for long periods to severe water and wind<br />
erosion losses. Paradoxically, NUE can be<br />
very high, because any small amount <strong>of</strong> nutrient<br />
applied could give a large yield response.<br />
Thus, if NUE is the only goal, it could be<br />
achieved here, but people will continue to<br />
starve because <strong>of</strong> the low total production.<br />
Many countries can be characterized as being<br />
on this part <strong>of</strong> the curve. Sub-Saharan Africa<br />
is a good example. Dr. Norman Borlaug has<br />
described the situation where a modest<br />
increase <strong>of</strong> 20 to 30 lb/A more nutrients along<br />
with improved varieties has increased yields<br />
by two, three, or four times. Yet, these higher<br />
yields are relatively low. <strong>The</strong>y are still on the<br />
steepest part <strong>of</strong> the yield curve.<br />
Area II is a little higher on the yield<br />
curve, where agriculture begins to modernize,<br />
with new, higher yielding varieties<br />
that respond efficiently to nutrient<br />
inputs. Often there is an imbalance towards<br />
the use <strong>of</strong> nitrogen (N) to the exclusion or<br />
deficit <strong>of</strong> other nutrients...phosphorus (P) and<br />
potassium (K)...that could give additional<br />
response. While the yield curve has flattened<br />
a little, NUE may still be quite high for an<br />
individual added nutrient such as N, while<br />
other nutrients [P, K, sulfur (S), etc.] are being<br />
depleted from the soil. However, paradoxically,<br />
NUE can be lower than in Area I.<br />
Environmentally speaking, crop growth is not<br />
as vigorous as it could be; thus, wind and<br />
water erosion losses continue to be a big concern,<br />
and because N is used without proper<br />
balance with P and K, N loss potential can be<br />
large. LUE is not very good, because yields<br />
are well below the full potential that exists.<br />
India, which produces relatively low average<br />
yields versus the potential, might be in Area<br />
II. <strong>Nutrient</strong> use levels are only moderate, and<br />
there is considerable nutrient imbalance<br />
because <strong>of</strong> government policy decisions and<br />
economic availability. Many states from the<br />
former Soviet Union are falling back into this<br />
same area as they deplete their soils from lack<br />
<strong>of</strong> application <strong>of</strong> adequate nutrients, which<br />
has slipped to about 30 percent <strong>of</strong> former levels.<br />
Measured strictly by response to the meager<br />
levels <strong>of</strong> inputs now applied, the NUE may<br />
be quite high, but yields are declining, and<br />
4 Better Crops/Vol. 84 (2000, No. 3)
future productivity is being robbed while LUE<br />
is dropping.<br />
Area III is the part <strong>of</strong> the curve<br />
where there is still good response to<br />
added inputs. Yields are increasing, but the<br />
slope is less steep. In order to achieve these<br />
yields, improved balance in nutrient inputs<br />
must be observed, including additions <strong>of</strong><br />
secondary [calcium (Ca), magnesium (Mg),<br />
and S] and micronutrients where deficient.<br />
Positive interactions among nutrients begin to<br />
take effect, and NUE improves. Plant growth<br />
is more vigorous, reducing potential wind and<br />
water erosion losses. More organic residue is<br />
produced, and with good management, erosion<br />
losses can be reduced even further. Because<br />
there is still some imbalance towards N, there<br />
is less than desirable efficiency <strong>of</strong> N use.<br />
China is a good example <strong>of</strong> a country that has<br />
moved in the last 10 to 15 years from Area II<br />
into Area III. <strong>The</strong>y have worked hard to balance<br />
N-P-K ratios appropriately, including<br />
attention to secondary and micronutrients,<br />
and have seen yields increase accordingly.<br />
China has additional unrealized yield potential,<br />
is clearly moving up the yield curve, and<br />
will move further as nutrient input balance<br />
continues to improve. <strong>Nutrient</strong> use efficiency<br />
can be improved, but they have dramatically<br />
improved their LUE...and the economic return<br />
to the system from purchased inputs.<br />
Interestingly, some production areas that<br />
were blessed with highly fertile soils started<br />
out in this Area III as their agriculture began<br />
to develop. Examples would be the Pampas <strong>of</strong><br />
Argentina and the U.S. Midwest. In both<br />
places, crops were grown for many years without<br />
replacing nutrients that were being exported<br />
in harvested crops. Without attention to<br />
nutrient replacement, production will start to<br />
slip back from Area III to Area II. <strong>The</strong> U.S.<br />
started to pay attention to these deficits in the<br />
early 1950s as nutrient deficiencies began to<br />
be observed and corrected. Argentina is just<br />
beginning to go through this same transition,<br />
and nutrient applications are increasing.<br />
Area IV is at the top <strong>of</strong> the yield<br />
curve. With attention to nutrient balance,<br />
NUE can be quite high while at the very top <strong>of</strong><br />
the yield curve. LUE has reached its highest<br />
level. Crops grow vigorously and help protect<br />
the soil from wind and water erosion. Large<br />
amounts <strong>of</strong> crop residue are produced and,<br />
with proper management, can help to minimize<br />
or even eliminate erosion losses. If yields<br />
are moved into ‘range’ B, the economic optimum<br />
is also achieved, helping assure the sustainability<br />
<strong>of</strong> the system.<br />
One might conclude that developed agricultures<br />
<strong>of</strong> North America and <strong>of</strong> Western<br />
Europe fall into this category...and they probably<br />
do. However, they still struggle with environmental<br />
concerns such as erosion losses<br />
and N and P in surface and ground waters, as<br />
well as economic viability. Why is this? In<br />
part, because most farmers are at the top <strong>of</strong><br />
Area III or bottom <strong>of</strong> Area IV, and improvements<br />
can still be made. Whether through better<br />
nutrient balance and timing <strong>of</strong> application<br />
to improve NUE, or better management <strong>of</strong><br />
crop residues to reduce erosion losses, or use<br />
<strong>of</strong> buffer strips to intercept potential nutrient<br />
losses, or myriad other decisions to increase<br />
yield and improve efficiency, farmers are trying<br />
to make improvements.<br />
Few farmers achieve much higher than<br />
75 or 80 percent <strong>of</strong> yield potential...even in<br />
the developed world. <strong>The</strong>y are starting to use<br />
new tools, which have been referred to as part<br />
<strong>of</strong> ‘precision agriculture’ or, more accurately,<br />
‘site-specific management’. All <strong>of</strong> these<br />
changes improve NUE to acceptable levels for<br />
a sustainable production agriculture that provides<br />
adequate food, fiber, feed, and fuel for<br />
all parts <strong>of</strong> the world. This is true NUE which<br />
resides in Area IV, not Areas I, II, or III, on the<br />
yield curve. NUE is optimized as a part <strong>of</strong> the<br />
total production system which maximizes LUE<br />
and economic return to all inputs...while protecting<br />
the environment. <strong>The</strong>se components<br />
will define and determine sustainability now<br />
and for the future.<br />
Dr. Dibb is President <strong>of</strong> PPI, located at Norcross,<br />
Georgia. E-mail: ddibb@ppi-far.org.<br />
Better Crops/Vol. 84 (2000, No. 3) 5