

Accomplishments - IRIS
Accomplishments - IRIS
Accomplishments - IRIS

You also want an ePaper? Increase the reach of your titles
YUMPU automatically turns print PDFs into web optimized ePapers that Google loves.
The Lithosphere-Asthenosphere Boundary<br />
James Gaherty (Lamont-Doherty Earth Observatory)<br />
The lithosphere-asthenosphere boundary (LAB) represents one of the most dynamically important boundaries in the Earth.<br />
Essentially all surface deformation– earthquakes, volcanic activity, slow tectonic deformation – results from forces associated<br />
with mantle convection in the asthenosphere; the transmittal of these forces (and related melting products) through the nearly<br />
rigid lithosphere depends on the nature of the LAB. In particular, the viscosity contrast across the LAB is a key but largely<br />
unknown element of plate tectonics. This contrast almost certainly has a thermal component related to the cooling of the lithosphere,<br />
but investigators have long speculated that layering of composition and/or melt content may strongly modulate or control<br />
the rheological transition across the LAB.<br />
Over the last decade, the nature of the LAB has crystallized into a “grand challenge” within the seismological community,<br />
fuelled by advances in laboratory observations of deformation mechanisms and the elastic properties of mantle rocks combined<br />
with improved seismological imaging techniques for shallow mantle structure. The new laboratory data provide the means to<br />
accurately account for the effect of temperature, volatiles, and grain size on seismic wavespeed, and these studies suggest that<br />
the seismic velocity transition observed across the LAB in both continental and ocean regions is too sharp, and too large, to be<br />
purely thermal [e.g., Faul and Jackson, 2006]. The question of whether this discrepancy implies a wet and/or partially molten<br />
asthenosphere, a change in grain size, or something else entirely, remains unanswered.<br />
The <strong>IRIS</strong> community is rallying to address this question. The past five years have seen a surge of activity utilizing <strong>IRIS</strong> data to<br />
provide better seismological constraints on the LAB, as documented in the accompanying research accomplishments. A number<br />
of groups are utilizing P-to-S and S-to-P conversions to explore the discontinuity structure of the shallow mantle. Historically<br />
these analyses have exploited single-station P-to-S conversions that are relatively insensitive to structure within the upper 200<br />
km of the mantle due to noise associated with crustal reverberations. Advanced P-to-S imaging techniques, and adaption of<br />
the analysis to S-to-P conversions, are providing relatively robust images of discontinuities within this depth interval (Figure<br />
1). Regional surface-wave analyses, in particular using large-aperture (e.g., PASSCAL) arrays, are yielding high-resolution estimates<br />
of absolute velocity and attenuation across the lithosphere-asthenosphere transition that can be directly compared to the<br />
laboratory-based predictions. Finally, estimates of variations in the layering of seismic anisotropy provide an alternative means<br />
to map the LAB.<br />
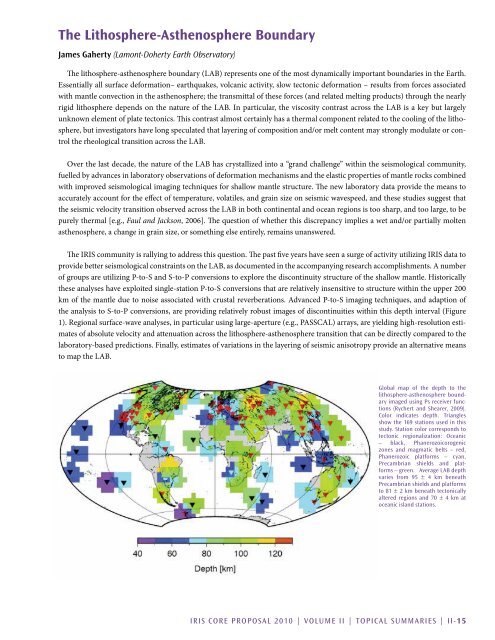
Global map of the depth to the<br />
lithosphere-asthenosphere boundary<br />
imaged using Ps receiver functions<br />
(Rychert and Shearer, 2009).<br />
Color indicates depth. Triangles<br />
show the 169 stations used in this<br />
study. Station color corresponds to<br />
tectonic regionalization: Oceanic<br />
– black, Phanerozoicorogenic<br />
zones and magmatic belts – red,<br />
Phanerozoic platforms – cyan,<br />
Precambrian shields and platforms<br />
– green. Average LAB depth<br />
varies from 95 ± 4 km beneath<br />
Precambrian shields and platforms<br />
to 81 ± 2 km beneath tectonically<br />
altered regions and 70 ± 4 km at<br />
oceanic island stations.<br />
<strong>IRIS</strong> Core Proposal 2010 | Volume II | Topical Summaries | II-15


