

Accomplishments - IRIS
Accomplishments - IRIS
Accomplishments - IRIS

You also want an ePaper? Increase the reach of your titles
YUMPU automatically turns print PDFs into web optimized ePapers that Google loves.
Analysis of Spatial and Temporal Seismicity Patterns within<br />
Arizona During the Deployment of the EarthScope USArray<br />
Transportable Array (March 2006 - April 2009)<br />
Jeffrey Lockridge (Arizona State University), Matthew Fouch (Arizona State University), J. Ramon Arrowsmith (Arizona<br />
State University)<br />
Monitoring earthquake activity across the state of<br />
Arizona has historically been restricted by a paucity of<br />
regional seismic stations. Prior to 2006, earthquakes<br />
within Arizona were located at a rate of less than 30<br />
events per year, presenting significant challenges for studies<br />
linking seismic activity and lithospheric strain accommodation.<br />
In this study, we utilize broadband seismic<br />
data recorded within Arizona by the EarthScope USArray<br />
Transportable Array (TA) (http://earthscope.org) to<br />
improve the characterization of the sources of tectonic<br />
strain accumulation and the mechanisms by which it is<br />
released. We built a Google Earth KMZ of global event<br />
data using EarthScope ANF monthly event archives to<br />
examine the spatial and temporal distribution of seismicity<br />
within Arizona during the deployment of the USArray<br />
TA. To date, we have identified 12 areas of seismicity<br />
within Arizona that exhibit event swarms with clear spatial<br />
and temporal correlations. We analyzed waveform<br />
data using the Antelope Environmental Data Collection<br />
Software package. We examined data from 8 TA stations<br />
nearest to each of 3 case studies and hand-picked P and<br />
S arrivals to generate a catalog of events for each swarm.<br />
We used a 1-5 Hz bandpass filter to detect events and a 0.3<br />
Hz high-pass filter or no filter to pick arrivals. We present<br />
preliminary swarm characterization for these three case<br />
studies, which were chosen due to their distinctly different<br />
tectonic settings. (1) The linear-trending (NNE-SSW)<br />
Roosevelt Swarm is located within the Arizona Transition<br />
Zone and is adjacent to Roosevelt Lake, a ~35 km long<br />
reservoir on the Salt River with a maximum depth of<br />
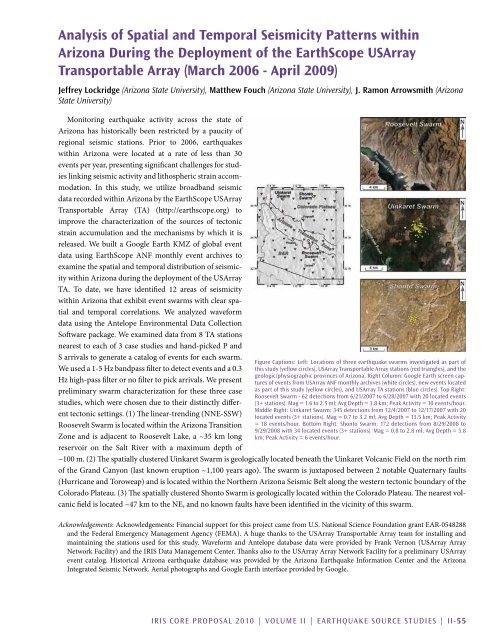
Figure Captions: Left: Locations of three earthquake swarms investigated as part of<br />
this study (yellow circles), USArray Transportable Array stations (red triangles), and the<br />
geologic/physiographic provinces of Arizona. Right Column: Google Earth screen captures<br />
of events from USArray ANF monthly archives (white circles), new events located<br />
as part of this study (yellow circles), and USArray TA stations (blue circles). Top Right:<br />
Roosevelt Swarm - 62 detections from 6/21/2007 to 6/28/2007 with 20 located events<br />
(3+ stations). Mag = 1.6 to 2.5 ml; Avg Depth = 3.8 km; Peak Activity = 10 events/hour.<br />
Middle Right: Uinkaret Swarm: 345 detections from 12/4/2007 to 12/17/2007 with 20<br />
located events (3+ stations). Mag = 0.7 to 3.2 ml; Avg Depth = 13.5 km; Peak Activity<br />
= 18 events/hour. Bottom Right: Shonto Swarm: 172 detections from 8/29/2008 to<br />
9/29/2008 with 34 located events (3+ stations). Mag = 0.8 to 2.8 ml; Avg Depth = 5.8<br />
km; Peak Activity = 6 events/hour.<br />
~100 m. (2) The spatially clustered Uinkaret Swarm is geologically located beneath the Uinkaret Volcanic Field on the north rim<br />
of the Grand Canyon (last known eruption ~1,100 years ago). The swarm is juxtaposed between 2 notable Quaternary faults<br />
(Hurricane and Toroweap) and is located within the Northern Arizona Seismic Belt along the western tectonic boundary of the<br />
Colorado Plateau. (3) The spatially clustered Shonto Swarm is geologically located within the Colorado Plateau. The nearest volcanic<br />
field is located ~47 km to the NE, and no known faults have been identified in the vicinity of this swarm.<br />
Acknowledgements: Acknowledgements: Financial support for this project came from U.S. National Science Foundation grant EAR-0548288<br />
and the Federal Emergency Management Agency (FEMA). A huge thanks to the USArray Transportable Array team for installing and<br />
maintaining the stations used for this study. Waveform and Antelope database data were provided by Frank Vernon (USArray Array<br />
Network Facility) and the <strong>IRIS</strong> Data Management Center. Thanks also to the USArray Array Network Facility for a preliminary USArray<br />
event catalog. Historical Arizona earthquake database was provided by the Arizona Earthquake Information Center and the Arizona<br />
Integrated Seismic Network. Aerial photographs and Google Earth interface provided by Google.<br />
<strong>IRIS</strong> Core Proposal 2010 | Volume II | Earthquake Source Studies | II-55


