Efficiency Calibration of HPGe Gamma Spectrometry of LAN system
Efficiency Calibration of HPGe Gamma Spectrometry of LAN system
Efficiency Calibration of HPGe Gamma Spectrometry of LAN system

You also want an ePaper? Increase the reach of your titles
YUMPU automatically turns print PDFs into web optimized ePapers that Google loves.
P-4a-264<br />
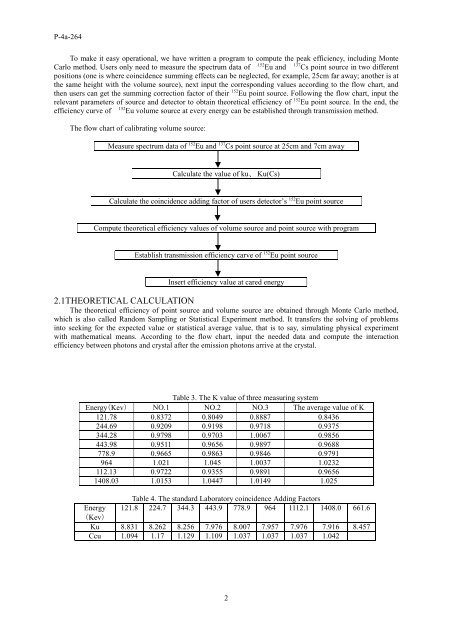
To make it easy operational, we have written a program to compute the peak efficiency, including Monte<br />
Carlo method. Users only need to measure the spectrum data <strong>of</strong><br />
152 Eu and<br />
137 Cs point source in two different<br />
positions (one is where coincidence summing effects can be neglected, for example, 25cm far away; another is at<br />
the same height with the volume source), next input the corresponding values according to the flow chart, and<br />
then users can get the summing correction factor <strong>of</strong> their 152 Eu point source. Following the flow chart, input the<br />
relevant parameters <strong>of</strong> source and detector to obtain theoretical efficiency <strong>of</strong> 152 Eu point source. In the end, the<br />
efficiency curve <strong>of</strong><br />
152 Eu volume source at every energy can be established through transmission method.<br />
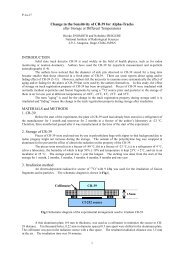
The flow chart <strong>of</strong> calibrating volume source:<br />
Measure spectrum data <strong>of</strong> 152 Eu and 137 Cs point source at 25cm and 7cm away<br />
Calculate the value <strong>of</strong> ku、 Ku(Cs)<br />
Calculate the coincidence adding factor <strong>of</strong> users detector’s 152 Eu point source<br />
Compute theoretical efficiency values <strong>of</strong> volume source and point source with program<br />
Establish transmission efficiency carve <strong>of</strong> 152 Eu point source<br />
Insert efficiency value at cared energy<br />
2.1THEORETICAL CALCULATION<br />
The theoretical efficiency <strong>of</strong> point source and volume source are obtained through Monte Carlo method,<br />
which is also called Random Sampling or Statistical Experiment method. It transfers the solving <strong>of</strong> problems<br />
into seeking for the expected value or statistical average value, that is to say, simulating physical experiment<br />
with mathematical means. According to the flow chart, input the needed data and compute the interaction<br />
efficiency between photons and crystal after the emission photons arrive at the crystal.<br />
Table 3. The K value <strong>of</strong> three measuring <strong>system</strong><br />
Energy(Kev) NO.1 NO.2 NO.3 The average value <strong>of</strong> K<br />
121.78 0.8372 0.8049 0.8887 0.8436<br />
244.69 0.9209 0.9198 0.9718 0.9375<br />
344.28 0.9798 0.9703 1.0067 0.9856<br />
443.98 0.9511 0.9656 0.9897 0.9688<br />
778.9 0.9665 0.9863 0.9846 0.9791<br />
964 1.021 1.045 1.0037 1.0232<br />
112.13 0.9722 0.9355 0.9891 0.9656<br />
1408.03 1.0153 1.0447 1.0149 1.025<br />
Table 4. The standard Laboratory coincidence Adding Factors<br />
Energy 121.8 224.7 344.3 443.9 778.9 964 1112.1 1408.0 661.6<br />
(Kev)<br />
Ku 8.831 8.262 8.256 7.976 8.007 7.957 7.976 7.916 8.457<br />
Ccu 1.094 1.17 1.129 1.109 1.037 1.037 1.037 1.042<br />
2