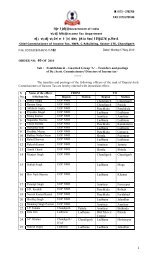
Evaluation of Transfer/Placement Guidelines (IRS) :2010 CBDT Full ...
Evaluation of Transfer/Placement Guidelines (IRS) :2010 CBDT Full ...
Evaluation of Transfer/Placement Guidelines (IRS) :2010 CBDT Full ...

You also want an ePaper? Increase the reach of your titles
YUMPU automatically turns print PDFs into web optimized ePapers that Google loves.
Page # 1 <strong>of</strong> 5<br />
Data Base Cell, Central Board <strong>of</strong> Direct Taxes<br />
E-2, Mezzanine Floor, A.R.A. Centre, Jhandewalan Extension, New Delhi-110055<br />
Tel No. : 011-23593256, Fax No.: 011-23593359, Email: dbc.cbdt@incometaxindia.gov.in<br />
<strong>Evaluation</strong> <strong>of</strong> <strong>Transfer</strong>/<strong>Placement</strong> <strong>Guidelines</strong> (<strong>IRS</strong>) :<strong>2010</strong><br />
<strong>CBDT</strong> <strong>Full</strong> Board meeting on 21.12.2011<br />
Explanatory Note<br />
(to the Power Point Presentation made by Data Base Cell on this subject)<br />
The twin objectives <strong>of</strong> a <strong>Transfer</strong> Policy are<br />
i) To achieve organizational requirements such as optimum deployment<br />
and equitable distribution <strong>of</strong> manpower and promote All-Round<br />
Development <strong>of</strong> Officers<br />
ii) To fulfill individual Officer’s preferences in postings.<br />
For effective functioning <strong>of</strong> an organization, these two objectives are to be<br />
balanced judiciously during implementation <strong>of</strong> the <strong>Transfer</strong> policy.<br />
2. The <strong>Transfer</strong>/<strong>Placement</strong> <strong>Guidelines</strong> (<strong>IRS</strong>):<strong>2010</strong> is in operation since Feb<br />
<strong>2010</strong>. The Data Base Cell (DBC) <strong>of</strong> <strong>CBDT</strong> made an attempt to evaluate this policy in<br />
order to ascertain as to how well this policy serves the Department to achieve its<br />
objectives.<br />
Cadre Management System (CMS) data, as maintained by the Vendor, related<br />
to Annual General <strong>Transfer</strong> (AGT) <strong>2010</strong> and 2011 were used for this empirical<br />
study. Even though DBC collected Options for <strong>Transfer</strong> from all the Officers<br />
(whether they are due for transfer or not), the <strong>Transfer</strong> Requests received from<br />
Officers who had specifically requested for transfer (TR mentioned as YES in the<br />
On-line option form) are only considered in this study. It is seen generally that
Page # 2 <strong>of</strong> 5<br />
<strong>Transfer</strong> Requests from Promotee Officers are for the parent CCA Regions from<br />
where they were promoted and transferred out. Hence, for this analysis, the<br />
<strong>Transfer</strong> Requests from Promottee Officers were kept aside as the pattern <strong>of</strong><br />
<strong>Transfer</strong> Requests from Promotee Officers is dependent on the number <strong>of</strong> <strong>of</strong>ficers<br />
promoted from particular CCA Regions and this issue needs to be addressed<br />
separately. Due list for transfer is as per calculation <strong>of</strong> CMS. The vacancy<br />
positions have been extracted from the data maintained in CMS.<br />
3. The findings <strong>of</strong> this study are presented in the PPP (Power Point<br />
Presentation) slides attached herewith.<br />
4. Few key findings are briefly presented, on a sample basis, as under:-<br />
4.1 PPP Slide #3 & 4:<br />
The pie-chart in PPP slide #3 shows that out <strong>of</strong> 471 <strong>Transfer</strong> requests<br />
received for AGT <strong>2010</strong> from Direct Recruit <strong>of</strong>ficers, substantial number <strong>of</strong> <strong>Transfer</strong><br />
Requests were for cities like Delhi (29%) and Mumbai (27%). In order <strong>of</strong> demand,<br />
the next popular stations were Bangalore, Hyderabad, Ahmadabad (incl. Surat<br />
and Baroda), Pune and Chandigarh. All these stations alone put together made<br />
up for 83% <strong>of</strong> <strong>Transfer</strong> Requests.<br />
Details <strong>of</strong> <strong>Transfer</strong> Requests, as per CCA Preference wise, for AGT <strong>2010</strong> are<br />
presented in PPP slide # 4.<br />
4.2 PPP Slide #5 & 6:<br />
The pie-chart in slide #5 shows that out <strong>of</strong> 329 <strong>Transfer</strong> requests received for<br />
AGT 2011 from Direct Recruit Officers, substantial numbers <strong>of</strong> <strong>Transfer</strong> Requests<br />
were for cities like Mumbai (32%) and Delhi (31%). In order <strong>of</strong> demand, the next<br />
popular stations are Pune, Chandigarh, Ahmadabad (incl. Surat and Baroda),<br />
Hyderabad, Jaipur and Bangalore. All these stations alone put together made up<br />
for 88% <strong>of</strong> <strong>Transfer</strong> Requests.<br />
Details <strong>of</strong> <strong>Transfer</strong> Requests, as per CCA Preference wise, are presented for<br />
AGT 2011 in PPP slide #6.
Page # 3 <strong>of</strong> 5<br />
4.3 PPP Slide #7 & 8:<br />
<strong>Transfer</strong> Requests presented in PPP slide #4 and 6 were further<br />
deconstructed into Rank wise (A/DCIT, Addl.CIT/JCIT and CITs) and presented PPP<br />
slides # 7 and 8 for AGT <strong>2010</strong> and AGT 2011 respectively.<br />
As could be seen, majority <strong>of</strong> <strong>Transfer</strong> Requests were from CITs (273 out <strong>of</strong><br />
471 in AGT <strong>2010</strong> and 151 out <strong>of</strong> 321 in AGT 2011). Further, substantial numbers<br />
<strong>of</strong> <strong>Transfer</strong> Requests <strong>of</strong> CITs were for cities like Mumbai and Delhi.<br />
4.4 PPP Slide #9 & 10:<br />
In PPP slides #9 and 10, the ‘<strong>Transfer</strong> Requests’ vis-à-vis ‘<strong>Transfer</strong> Due’<br />
were mapped and the same was cross tabulated ‘CCA Preference’ wise and ‘Rank<br />
wise’ for AGT <strong>2010</strong> and AGT 2011 respectively.<br />
As could be seen, against substantial number <strong>of</strong> <strong>Transfer</strong> Requests, the<br />
number <strong>of</strong> <strong>Transfer</strong> Due were 0 across all the CCAs in respect <strong>of</strong> A/DCIT and<br />
Addl./JCITs. It shows that there was no scope for fulfilling <strong>Transfer</strong> Requests <strong>of</strong><br />
these Officers.<br />
In the case <strong>of</strong> CITs too, the gap between <strong>Transfer</strong> Request and <strong>Transfer</strong> Due<br />
was very substantial. i.e (276 vs. 38 for AGT <strong>2010</strong> and 153 vs. 33 for AGT 2011).<br />
This gap became further wide in the cases <strong>of</strong> Delhi and Mumbai.<br />
Importantly, as has been highlighted in green color cells, in the rank <strong>of</strong> CITs,<br />
the number <strong>of</strong> ‘<strong>Transfer</strong> Due’ out <strong>of</strong> the deficient Regions (such as Kerala, NER<br />
and TN) were more than the number <strong>of</strong> ‘<strong>Transfer</strong> Requests’ to these Regions. As a<br />
result, even the scanty manpower in these deficient regions was likely to be<br />
depleted further.<br />
4.5 PPP Slide #11 & 12<br />
In the PPP slide #11, a time-series <strong>of</strong> vacancy position (as % <strong>of</strong> Sanctioned<br />
Strength) as on July <strong>2010</strong> and Sep 2011 for the rank <strong>of</strong> A/DCIT is given for select<br />
CCAs.
Page # 4 <strong>of</strong> 5<br />
In A/DCIT rank, the All India vacancy level increased from 31% to 34% during<br />
this period. However, the vacancy position, during this period, rose steeply in the<br />
cases <strong>of</strong> Kerala (from 41% to 56%), NER (from 42% to 48%), Bihar (from 37% to<br />
45%) and Gujarat (from 19% to 39%). At the same time, the vacancy fell sharply<br />
in the cases <strong>of</strong> MP (from 45% to 32%) and UP-E (from 41% to 29%).<br />
Details <strong>of</strong> Sanctioned Strength, vacancy in absolute numbers and also as % <strong>of</strong><br />
Sanctioned Strength for the rank <strong>of</strong> A/DCIT in respect <strong>of</strong> all the CCAs as on July<br />
<strong>2010</strong> and Sep 2011 are presented in PPP slide #12.<br />
4.6 PPP Slide #13 & 14<br />
In the PPP slide #13, a time-series <strong>of</strong> vacancy position (as % <strong>of</strong> Sanctioned<br />
Strength) as on July <strong>2010</strong> and Sep 2011 for the rank <strong>of</strong> Addl/JCIT is given for select<br />
CCAs.<br />
In Addl./JCIT rank, the All India vacancy level fell from 42% to 31% during this<br />
period. However, the vacancy position, during this period, increased steeply in the<br />
cases <strong>of</strong> Orissa (from 60% to 75%). Vacancy position remained constant at high<br />
level in the cases <strong>of</strong> TN at 71% and Bihar at 51%. However, the vacancy position<br />
fell sharply in the cases <strong>of</strong> WB (from 70% to 52%), MP (from 61% to 45%), UP-W<br />
(from 42% to 9%). On contrast, in the case <strong>of</strong> Delhi, excess <strong>of</strong> Addl./JCITs<br />
increased from 5% to 12%.<br />
Details <strong>of</strong> Sanctioned Strength, vacancy in absolute numbers and also as % <strong>of</strong><br />
Sanctioned Strength for the rank <strong>of</strong> Addl./JCIT in respect <strong>of</strong> all the CCAs as on July<br />
<strong>2010</strong> and Sep 2011 are presented in PPP slide #14.<br />
4.7 PPP Slide #15 & 16<br />
In the PPP slide #15, a time-series <strong>of</strong> vacancy position (as % <strong>of</strong> Sanctioned<br />
Strength) as on July <strong>2010</strong> and Sep 2011 for the rank <strong>of</strong> CITs is given for select<br />
CCAs.<br />
In CIT rank, the All India vacancy fell from 13% to 9% during this period.<br />
However, the vacancy position, during this period, rose steeply in the cases <strong>of</strong><br />
Kerala (from 25% to 60%), NER (from 18% to 36%), WB (from 18 to 25%)..
Page # 5 <strong>of</strong> 5<br />
Vacancy position remained constant in the cases <strong>of</strong> Bihar at 30%. However, the<br />
vacancy position fell sharply in the cases <strong>of</strong> UP-E (from 25% to 8%), NWR (from<br />
15% to 5%), and Pune (from 12% to 4%). On contrast, in the case <strong>of</strong> Mumbai, the<br />
vacancy/deficit <strong>of</strong> 9% became excess <strong>of</strong> 2% during this period.<br />
Details <strong>of</strong> Sanctioned Strength, vacancy in absolute numbers and also as % <strong>of</strong><br />
Sanctioned Strength for the rank <strong>of</strong> CIT in respect <strong>of</strong> all the CCAs as on July <strong>2010</strong><br />
and Sep 2011 are presented in PPP slide #14.<br />
5. Conclusion:<br />
The above empirical evidence demonstrates that<br />
i) The wide gap between <strong>Transfer</strong> 'Request’ vs. ‘Due’ leaves very less (or no)<br />
scope for fulfillment <strong>of</strong> <strong>Transfer</strong> Request <strong>of</strong> large number <strong>of</strong> Officers.<br />
ii) Manpower shortage in deficient Regions is getting further aggravated.<br />
--oOo--