Paper Template for Speech Prosody 2002 - ISCA!
Paper Template for Speech Prosody 2002 - ISCA!
Paper Template for Speech Prosody 2002 - ISCA!

You also want an ePaper? Increase the reach of your titles
YUMPU automatically turns print PDFs into web optimized ePapers that Google loves.
<strong>ISCA</strong> Archive<br />
http://www.isca-speech.org/archive<br />
<strong>Speech</strong> <strong>Prosody</strong> 2004<br />
Nara, Japan<br />
March 23-26, 2004<br />
<strong>Speech</strong> Rate and <strong>Prosody</strong> Units: Evidence of Interaction from Mandarin<br />
Chinese<br />
Chiu-yu Tseng and Yeh-lin Lee<br />
Institute of Linguistics, Academia Sinica<br />
Taipei, Taiwan ROC<br />
cytling@sinica.edu.tw<br />
Abstract<br />
This paper discusses evidence of interaction found between<br />
speech rate and prosody units in Mandarin Chinese speech.<br />
Mandarin speech data of 2 different speech rates that had been<br />
previously labeled <strong>for</strong> perceived boundaries and prosody units<br />
were further analyzed <strong>for</strong> duration patterns at each prosodic<br />
level. Each prosody level demonstrated patterns of duration<br />
adjustment <strong>for</strong> both speech rates that could be accounted <strong>for</strong><br />
by the model used. These patterns of duration adjustments are<br />
clearly systematic, suggesting how each prosody levels may<br />
interact and to an extent govern the temporal distribution of<br />
units within. Our findings demonstrate that though speech rate<br />
may appear to be a global phenomenon across speech flow on<br />
the surface, it in fact is very much an in integrated part of<br />
prosody organization constrained by each prosody level. To<br />
put simply, duration adjustment is being made systematically<br />
at each prosody level during speech production instead of just<br />
an across-the-board phenomenon. As a result, interactions<br />
between prosody units and temporal distribution are<br />
predictable. We believe these findings are a step <strong>for</strong>ward in<br />
understanding temporal organization and distribution of<br />
speech flow as well as speech prosody in general, and should<br />
be directly applicable to predicting speech prosody of<br />
unlimited TTS in particular.<br />
1. Introduction<br />
How to predict prosody from text and improve output<br />
naturalness remains a major bottleneck <strong>for</strong> unlimited TTS after<br />
decades of research ef<strong>for</strong>ts. The naturalness issues boils down<br />
to insufficient understanding and consequently still somewhat<br />
crude implementation of prosodic properties to synthetic<br />
speech output. More knowledge of prosody organization with<br />
respect to units, boundaries and domain is still lacking in<br />
general; more understanding of speech rate with respect to<br />
temporal distribution still unclear in particular. Previous<br />
researches have examined duration characteristics <strong>for</strong> both<br />
syllable-timing and stress-timing languages [1] [2] [3] [4],<br />
making it a necessary distinction in investigating timing<br />
related issues. Mandarin Chinese is a syllable-time language<br />
whereas temporal variations of the syllable level require more<br />
explicit understanding. From the phonetic perspective,<br />
segmental durations in connected speech need to be examined<br />
with respect to syllables first be<strong>for</strong>e moving on to higher<br />
and/or larger phonetic, phonological or prosodic units. In this<br />
study, we analyzed durational modifications of two speech<br />
rates at each prosody level, namely, prosodic words, prosodic<br />
phrase, and breath group to see if systematic patterns of<br />
temporal adjustment could be found, especially with regard to<br />
final lengthening.. A modified multi-layer linear regression<br />
model of Keller and Zellner [1] was used to clarify possible<br />
influences from the prosodic hierarchy [5] [6], and to test<br />
variation tendencies on syllable durations with respect to<br />
speech rate. However, other prosodic phenomena such as<br />
stress patterns, and phrasal prominence are not included <strong>for</strong><br />
the time being.<br />
2.1. <strong>Speech</strong> Data<br />
2. Methodology<br />
<strong>Speech</strong> corpora of two different reading rates were used, i.e.,<br />
slower vs. faster speech. The slower speech is from 1 male<br />
untrained subject (hence SMS <strong>for</strong> Slower Male <strong>Speech</strong>)<br />
reading 595 paragraphs ranging from 2 to 180 syllables; the<br />
faster speech from 1 female radio announcer’s relative faster<br />
reading (hence FFS <strong>for</strong> Faster Female <strong>Speech</strong>) of 26 long<br />
paragraphs ranging from 85 to 981 syllables. A total of 22350<br />
syllables of SMS and 11592 syllables of FFS were analyzed.<br />
Average syllable duration is 304.7ms <strong>for</strong> SMS and 199.75ms<br />
<strong>for</strong> FFS. We per<strong>for</strong>med analyses to (1.) compare duration<br />
variations with respect to different speech rate, and (2.) look<br />
<strong>for</strong> how speech rate may interact with prosody units. Both sets<br />
of speech data were first labeled automatically using the HTK<br />
toolkit and SAMPA-T notations [6]; then labeled <strong>for</strong> perceived<br />
prosodic boundaries by 3 trained transcribers. The HTK<br />
labeling was manually spot-checked; the manual perceptual<br />
labeling cross checked <strong>for</strong> intra-transcriber consistency. An inhouse<br />
ToBI-based system developed <strong>for</strong> Mandarin [5] [6] was<br />
used <strong>for</strong> prosodic units and boundaries, with emphases on the<br />
phrase-grouping characteristic of Mandarin Chinese speech<br />
2.2 Basic Features of Analyses<br />
Using a step-wise regression technique, a linear model with<br />
four layers [1] was modified and developed to predict<br />
speakers’ timing behavior with respect to different speech rate.<br />
A hierarchical and hence layered organization of prosody on<br />
the basis of boundaries and units was used to classify prosody<br />
units at levels of the syllable, prosodic word, prosodic phrase,<br />
breath group and prosody group [6]. Moving from the syllable<br />
layer in the prosody hierarchy upward to each of the higher<br />
prosodic unit and level, we examined each higher layer<br />
independently to see if residuals can be explained, and if so, at<br />
which level. All of the data was analyzed using DataDesk<br />
from Data Description, INC. Two benchmark values were<br />
used in this study to evaluate the closeness of the predicted<br />
value and the original speech data, namely, residual error (R.E.)<br />
and correlation coefficient (r). The residual error was defined<br />
as the percentage of the sum squared residue (difference<br />
between prediction and original value) over the sum squared<br />
original value.
3.1. The Syllable Layer<br />
3. Results and Analyses<br />
At this layer, we examined how segmental duration may<br />
influence syllable duration, how influences contributed by<br />
preceding and following syllables may affect segmental<br />
duration, and whether tones may interact with duration as well.<br />
Factors considered included 21 consonants, 39 vowels<br />
(including diphthongs), and 5 tones (including 4 lexical tones<br />
and 1 neutral tone). Classifications of segments were<br />
established to help simplify analyses of the speech data. The<br />
classifications <strong>for</strong> the two speech rates varied. Such<br />
classification should be useful <strong>for</strong> future analyses. Tables 1<br />
and 2 showed the results of analyses of FFS.<br />
Type Consonants Mean(ms) Coef Var Count<br />
C1 d,g,b 20.1065 0.41 2132<br />
C2 l,dz`,f 48.354 0.41 1533<br />
C3 Z`,n,dz,dj,m 66.5804 0.30 2147<br />
C4 t,p,k,h 87.2127 0.31 1420<br />
C5 s`,ts`,sj 106.524 0.23 1864<br />
C6 s,ts,tj 116.968 0.23 830<br />
C7 Zero Initial 0 0 1663<br />
Table1. Types of Consonants of FFS<br />
Type Vowels Mean(ms) CoefVar Count<br />
V1 @,U`,U 99.5293 0.43 1990<br />
V2 o,u 124.498 0.36 780<br />
V3 i,a 129.767 0.37 1467<br />
V4 yE,ei,y,@n,in,uo,iE 142.158 0.34 1904<br />
V5 ai,ou,uei,@N,oN,iN 149.889 0.30 2253<br />
V6 an,au,yn,iau,aN 157.925 0.27 1323<br />
V7 ia,iou,u@n,@`,iEn,ua 169.913 0.30 1172<br />
V8 uan,yEn,iaN 54.3786 0.30 513<br />
V9 uaN,uai,yoN 58.124 0.30 187<br />
Table2. Types of Vowels of FFS<br />
A Syllable-Layer Model was subsequently postulated as<br />
follows:<br />
Dur (ms) =<br />
constant + CTy +VTy + Ton<br />
+ PCt + PVt + PrT + FCt + FVt + FlT<br />
+ 2-way factors of each factors above<br />
+ 3-way factors of each syllable +<br />
+ Delta 1<br />
CTy, VTy and Ton represent consonant type, vowel type and<br />
tone respectively. Prefix of P and F represent the<br />
corresponding factors of the preceding and following syllable.<br />
A total of 49 factors were considered. A linear model <strong>for</strong><br />
discrete data was built using Data Desk with partial sums of<br />
squares (type 3). Factors with p-value smaller than 0.5 were<br />
excluded from consideration.<br />
Table 3 shows benchmark values of the Syllable-Layer Model<br />
found in the two different speech rates. The residue error was<br />
48.9% in SMS and 40.1% in FFS. In other words, the Model<br />
explained 51.1% of syllable duration of SMS and 59.6% of<br />
FFS at the syllable layer. The residue that cannot be explained<br />
at this layer was termed as Delta 1 and will be dealt with at the<br />
immediate higher layers.<br />
Test SMS FFS<br />
R.E. 48.9% 40.1%<br />
r 0.715 0.768<br />
Table3. Evaluation of Syllable Layer Predictions<br />
3.2. Prosodic-Word (PW) Layer<br />
In this layer immediately above the syllable layer, our aim was<br />
to see whether possible effect caused by PW structure on<br />
syllable duration could be found. Our hypothesis was that<br />
syllable duration is affected by its position within a PW.<br />
There<strong>for</strong>e, the PW Layer Model can thus be written as follows:<br />
Delta 1 = f(PW length, PW sequence) + Delta 2<br />
Each syllable was labeled with a set of vector value, <strong>for</strong><br />
example (3, 2) denotes the unit under consideration is the<br />
second syllable in a 3-syllable PW. Using identical linear<br />
regression techniques as of the preceding layer, the coefficient<br />
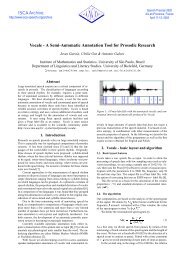
of each entry was calculated. Figures 1 and 2 illustrate the<br />
coefficients of different PW durations. PWs over 5 syllables<br />
were not considered due to scarcity of samples.<br />
Coef<br />
50<br />
40<br />
30<br />
20<br />
10<br />
0<br />
-10<br />
-20<br />
1 2 3 4<br />
Syllable<br />
Figure1. Coefficients of SMS from the PW Model. The horizontal axis<br />
represents the position of each syllable within a PW; the vertical axis<br />
the coefficient values.<br />
Coef<br />
50<br />
40<br />
30<br />
20<br />
10<br />
0<br />
-10<br />
-20<br />
1 2 3 4<br />
Syllable<br />
Figure2. Coefficients of FFS from the PW Model<br />
Positive coefficients represent lengthened syllable durations at<br />
the PW layer; negative ones shortened syllable durations.<br />
Coefficients of p-value smaller than 0.1 were marked with the<br />
‘X’ label in Figures 1 and 2. Note that several interesting<br />
phenomena could be observed: (1.) both speakers exhibit a<br />
pattern of PW-final syllable lengthening relative to other<br />
syllables considered; (2.) the longer the PW is the greater the<br />
duration of the final syllable becomes, and (3.) different<br />
speech rate contributed to different degrees of syllable<br />
variation. At the PW Layer, SMS showed within-layer syllable<br />
shortening but final-syllable lengthening in comparison with<br />
lengthening predictions made at the Syllable Layer. However,<br />
FFS showed the opposite: That is, while syllables of a PW<br />
were shortened as well, the final syllable maintained its<br />
prediction of the immediate lower layer. Table 4 shows<br />
benchmark values of the PW Model.<br />
Test SMS FFS<br />
R.E. 93.3% 96.45%<br />
T.R.E 45.6% 38.76%<br />
r 0.737 0.778<br />
Table4. Evaluation of PW Layer Predictions<br />
The PW Layer model explained 6.7% of Delta 1 of SMS and<br />
3.55% of FFS. The overall prediction can be obtained by<br />
adding up the predicted value of both the syllable and PW<br />
layers. The Total Residual Error (TRE) is the percentage of<br />
sum squared residue over the sum square syllable duration.<br />
This result indicates that the residual error ratio cannot be
explained by either layers discussed so far, which we will deal<br />
with at the following higher layer(s).<br />
3.3. Prosodic –Phrase (PPh) Layer<br />
The same rationale was applied to this layer. The linear<br />
regression model is thus <strong>for</strong>mulated as follows.<br />
Delta 2 = f(PP length, PP sequence) + Delta 3<br />
Figures 3 and 4 illustrate the derived coefficients. Only<br />
prosodic phrases with over 60 occurrences were considered <strong>for</strong><br />
statistical validity. Each line represents a PPh with different<br />
durations.<br />
30<br />
20<br />
10<br />
Coef<br />
0<br />
-10<br />
-20<br />
-30<br />
Coef<br />
50<br />
40<br />
30<br />
20<br />
10<br />
0<br />
-10<br />
-20<br />
1 2 3 4 5 6 7 8 9 10<br />
Syllable<br />
Figure3. Coefficients of SMS from the PPh Model.<br />
1 2 3 4 5 6 7 8 9 10<br />
Syllable<br />
Figure4. Coefficients of FFS from the PPh Model<br />
Figures 3 and 4 showed the following results: (1.) A clear<br />
cadence like phenomenon of PPh. (2.) Not only lengthening of<br />
the PPh-final syllable was found; shortening was also found at<br />
the third syllable counting backward. (3.) Final syllable<br />
lengthening at the PPh layer was found to be twice as long <strong>for</strong><br />
FFS, demonstrating once again the contribution from speech<br />
rate and consequently a different pattern of rhythm. (4.) A<br />
complementary effect of final syllable lengthening was found<br />
between the PW Layer and the current PPh Layer. In other<br />
words, whenever the final syllable of a PW is lengthened, the<br />
same degree of final syllable lengthening could NOT be found<br />
at PPh level. Table 5 shows the evaluation of predictions at the<br />
PPh Layer.<br />
Test SMS FFS<br />
R.E. 93.0 % 86.5 %<br />
T.R.E 42.4% 33.5%<br />
r 0.760 0.814<br />
Table5. Evaluation of Prosodic Phrase Layer Prediction.<br />
Delta 2 of FFS could be explained only by 13.5% of the data<br />
at the current PPh layer, and the correlation coefficient r is<br />
0.814. The remaining residue that cannot be explained is<br />
termed as Delta 3, and will be dealt with in the next higher<br />
layer.<br />
3.4. Breath-Group (BG) Layer<br />
In order to find how the syllable duration was affected by a<br />
BG effect due to breathing and hence longer pause, we further<br />
studied the residue from the PPh Layer, i.e., Delta 3 at the BG<br />
Layer. It was found that the difference occurred more often at<br />
the initial and the final portions of a PPh, while the influences<br />
on the initial, middle and final prosodic phrase within a breath<br />
group are also different. We postulate that BG poses duration<br />
effects on the initial and final portions of each PPh within, but<br />
not on the middle portion. Table 6 shows the results of our<br />
evaluations.<br />
At the BG layer, delta 3 could be explained by 2.2% in SMS<br />
and 5.2% in FFS. The overall prediction correlates with the<br />
original corpus at the correlation coefficient r = 0.766 in SMS<br />
and 0.825 in FFS, which is an encouraging outcome to the<br />
current investigations.<br />
Test SMS FFS<br />
R.E. 97.8 % 94.8%<br />
T.R.E 41.52% 31.7%<br />
r 0.766 0.825<br />
Table6. Evaluation of Breath-Group Layer Predictions<br />
The effect from the BG Layer on the immediate lower layer<br />
(the PPh) within is shown in Figures 5 and 6. Each figure<br />
illustrates the influences on the duration of the PPh under 6<br />
syllables. Influences on the first and the last 3 syllables of PPh<br />
over 6 syllables were calculated and shown in purple. Both<br />
Figures 5 and 6 show lengthening by 10 to 20ms on the first<br />
and last syllable.<br />
coef<br />
40<br />
30<br />
20<br />
10<br />
0<br />
-10<br />
-20<br />
1 2 3 4 5 6 7<br />
Syllable<br />
Figure5. Coefficients of SMS from Initial PPh of BG layer Model<br />
Coef<br />
40<br />
30<br />
20<br />
10<br />
0<br />
-10<br />
-20<br />
1 2 3 4 5 6 7<br />
Syllable<br />
Figure6. Coefficients of FFS from Initial PPh of BG layer Model<br />
20<br />
10<br />
Coef<br />
0<br />
-10<br />
-20<br />
1 2 3 4 5 6 7<br />
Syllable<br />
Figure7. Coefficients of SMS from Middle PPh of BG layer Model<br />
Figure 7 and 8 show effects of the BG layer on PPhs that<br />
occurred in the middle of a BG. The first syllable was
shortened while the final one is lengthened <strong>for</strong> BG-middle<br />
PPhs considered; the influence is more pronounced in FFS<br />
than in SMS.<br />
Coef<br />
20<br />
10<br />
0<br />
-10<br />
-20<br />
1 2 3 4 5 6 7<br />
Syllable<br />
Figure8. Coefficients of FFS from Middle PPh of BG layer Model<br />
Figures 9 and 10 illustrate the coefficients of final PPhs.<br />
Contrary to the initial PPhs, the final syllable of the final PPh<br />
is shortened. Note that the overall effect of final-syllable<br />
lengthening at the BG Layer is still found. The negative<br />
coefficients reflect a clear distinction between BG-initial and<br />
BG-final prosodic phrases. The observed temporal allocations<br />
provide evidence of prosody units and layers as constraints in<br />
speech flow.<br />
4. Discussion<br />
A hierarchical prosody organization was postulated on the<br />
basis of prosody units, boundaries and domains with<br />
emphases on characterizing phrase-grouping as part of a topdown<br />
process. Analyses of speech rate were per<strong>for</strong>med in a<br />
bottom-up fashion from syllables upward to various prosodic<br />
units to show correlations could be found. Duration<br />
adjustments that could not be explained at a lower prosody<br />
layer could find answers at higher layers, offering evidences<br />
in the following sense: (1.) temporal distributions should be<br />
viewed with respect to prosody organizations, (2.)different<br />
speech rate may interact with prosody differently, thereby<br />
characterizing what speech rate could mean in the physical<br />
sense, (3.) trade-off effects were found between prosody<br />
levels, and (4.) a hierarchical organization does function<br />
during speech production, indicating that a possible<br />
optimization schema may very well be in operation during<br />
speech production.<br />
30<br />
Coef<br />
10<br />
-10<br />
1 2 3 4 5 6 7<br />
-30<br />
-50<br />
Syllable<br />
Figure9. Coefficients of SMS from Final PPh of BG layer Model<br />
Coef<br />
40<br />
20<br />
0<br />
-20<br />
-40<br />
-60<br />
1 2 3 4 5 6 7<br />
Syllable<br />
Figure10. Coefficients of FFSS from Final PPh of BG layer Model<br />
To illustrate that the postulated models could predict temporal<br />
arrangement with respect to speech rate, we compared the<br />
prediction from each prosody layer to a BG of 31 syllables of<br />
FFS. Figure 11 show clear interactions of duration variation<br />
between prosodic layers; Table 7 evaluation of prediction at<br />
each proposed layer.<br />
Layer<br />
Syllable PW PP BG<br />
Test SMS FFS SMS FFS SMS FFS SMS FFS<br />
R.E (%) 48.9 40.1 93.3 96.45 93.0 86.5 97.8 94.8<br />
T.R.E(%) N/A N/A 45.6 38.8 42.4 33.5 41.5 31.7<br />
r 0.715 0.768 0.737 0.778 0.760 0.814 0.766 0.825<br />
Table7 Evaluation on Prediction of Each Layer<br />
Figure 11.Comparision between speech data and predictions<br />
5. Conclusion<br />
We believe that examining speech rate in relation to prosody<br />
units is a significant first step to understanding temporal<br />
organization of speech flow, and fundamental to<br />
understanding of prosody of speech flow, especially with<br />
respect to phrase grouping in connected speech, a linguistic<br />
fact that is most prominent in Mandarin speech. Evidences<br />
found in the studies above offer possible explanations to<br />
prosodic constraints on temporal arrangement, which should<br />
also offer some insights to other syllable-based languages as<br />
well. Furthermore, we believe our results at this stage are<br />
already directly applicable to unlimited TTS of Mandarin<br />
Chinese, and should significantly improve output naturalness.<br />
6. References<br />
[1] Keller, E., Zellner Keller, B. “A Timing model <strong>for</strong> Fast French”,<br />
York <strong>Paper</strong>s in Linguistics, 17, University of York. 53-75. (1996)<br />
[2] W. N. Campbell, “<strong>Speech</strong>-Rate Variation and the Prediction of<br />
Duration”, Coling 88’, Vol1. (1988)<br />
[3] Zellner Keller B, Keller E., “Representing <strong>Speech</strong> Rhythm”<br />
Improvements in <strong>Speech</strong> Synthesis. (pp. 154-164). Chichester: John<br />
Wiley. (2001)<br />
[4] Chu, M. and Feng, Y., “Study on Factors Influencing Durations of<br />
Syllable in Mandarin”, Proc. Eurospeech 2001, Scandinavia.(2001)<br />
[5] Tseng, C., “Prosodic Group: Suprasegmental Characteristics of<br />
Mandarin Connected <strong>Speech</strong> from a <strong>Speech</strong> Data Base”, ICCL-6,<br />
Leiden, the Netherlands (1997)<br />
[6] Tseng, C. and F. Chou, “Machine Readable Phonetic Transcription<br />
System <strong>for</strong> Chinese Dialects Spoken in Taiwan”, JASJp, (E) 20.3.<br />
(1999)