Ground-water investigation at Mount Carmel, Illinois. Champaign, IL ...
Ground-water investigation at Mount Carmel, Illinois. Champaign, IL ...
Ground-water investigation at Mount Carmel, Illinois. Champaign, IL ...

You also want an ePaper? Increase the reach of your titles
YUMPU automatically turns print PDFs into web optimized ePapers that Google loves.
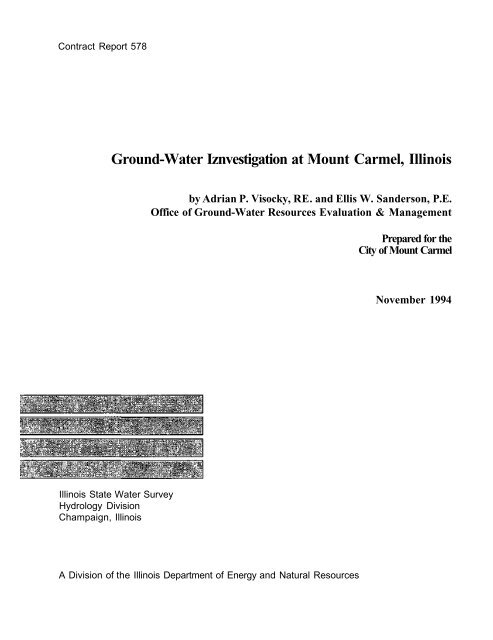
Contract Report 578<br />
<strong>Ground</strong>-W<strong>at</strong>er Iznvestig<strong>at</strong>ion <strong>at</strong> <strong>Mount</strong> <strong>Carmel</strong>, <strong>Illinois</strong><br />
by Adrian P. Visocky, RE. and Ellis W. Sanderson, P.E.<br />
Office of <strong>Ground</strong>-W<strong>at</strong>er Resources Evalu<strong>at</strong>ion & Management<br />
Prepared for the<br />
City of <strong>Mount</strong> <strong>Carmel</strong><br />
November 1994<br />
<strong>Illinois</strong> St<strong>at</strong>e W<strong>at</strong>er Survey<br />
Hydrology Division<br />
<strong>Champaign</strong>, <strong>Illinois</strong><br />
A Division of the <strong>Illinois</strong> Department of Energy and N<strong>at</strong>ural Resources
GROUND-WATER INVESTIGATION<br />
AT<br />
MOUNT CARMEL, <strong>IL</strong>LINOIS<br />
by<br />
Adrian P. Visocky, P.E.<br />
Ellis W. Sanderson, P.E.<br />
<strong>Illinois</strong> St<strong>at</strong>e W<strong>at</strong>er Survey<br />
2204 Griffith Drive<br />
<strong>Champaign</strong>, <strong>IL</strong> 61820<br />
Prepared for the City of <strong>Mount</strong> <strong>Carmel</strong><br />
November 1994
This report was printed on recycled and recyclable papers.
CONTENTS<br />
INTRODUCTION 1<br />
ACKNOWLEDGEMENTS 1<br />
INVESTIGATIVE METHODS AND PROCEDURES 2<br />
Conduct of Testing Program 2<br />
Objective 2<br />
Description of Site 2<br />
Design of Tests 4<br />
Conduct of Tests 4<br />
Step Test 5<br />
Setup and Conduct 5<br />
Well Loss 6<br />
Methodology for Determining Well Loss 7<br />
Step-Test Procedure 8<br />
Aquifer Tests 11<br />
Setup and Conduct 11<br />
Analysis 11<br />
Type-Curve Method 12<br />
Jacob Straight-Line Method 15<br />
W<strong>at</strong>er-Table Conditions 16<br />
WELL AND AQUIFER TEST RESULTS 17<br />
Step-Test Results 17<br />
24-Hour Aquifer Test (October 1992) 17<br />
First Long-Term Aquifer Test (November 1992) 18<br />
Preliminary Model Analysis 19<br />
Second Long-Term Aquifer Test (June-July 1993) 22<br />
Third Long-Term Aquifer Test (August 1993) 24<br />
Page<br />
CONCLUSIONS 26<br />
Model Aquifer 26<br />
Well Field Yield 28<br />
RECOMMENDATIONS FOR PRODUCTION WELL DESIGN 28<br />
SELECTED REFERENCES 30<br />
iii
CONTENTS (Concluded)<br />
APPENDICES<br />
Appendix A. Pumped test well and observ<strong>at</strong>ion well inform<strong>at</strong>ion 31<br />
Appendix B. Step-test: <strong>w<strong>at</strong>er</strong>-level measurements 39<br />
Appendix C. 24-hour aquifer test: <strong>w<strong>at</strong>er</strong>-level measurements<br />
(October 1992) 45<br />
Appendix D. First long-term aquifer test: <strong>w<strong>at</strong>er</strong>-level measurements<br />
(November 1992) 57<br />
Appendix E. Second long-term aquifer test: <strong>w<strong>at</strong>er</strong>-level measurements<br />
(June-July 1993) 71<br />
Appendix F. Third long-term aquifer test: <strong>w<strong>at</strong>er</strong>-level measurements<br />
(August-September 1993) 91<br />
Appendix G. Elev<strong>at</strong>ions of ground-<strong>w<strong>at</strong>er</strong> levels and the Wabash River ... 103<br />
Appendix H. Correspondence of preliminary results 153<br />
Appendix I. Chemical analyses of <strong>w<strong>at</strong>er</strong> samples 163<br />
Appendix J. Sieve d<strong>at</strong>a for aquifer samples from Test Well 2 171<br />
Appendix K. Driller's logs of test borings <strong>at</strong> production well sites 175<br />
Appendix L. Sieve d<strong>at</strong>a for aquifer samples collected from test<br />
borings <strong>at</strong> production well sites 179<br />
Page<br />
iv
GROUND-WATER INVESTIGATION<br />
<strong>at</strong><br />
MOUNT CARMEL, <strong>IL</strong>LINOIS<br />
by<br />
Adrian P. Visocky, P.E., Senior Hydrologist<br />
Ellis W. Sanderson, P.E., Senior Engineer<br />
INTRODUCTION<br />
The city of <strong>Mount</strong> <strong>Carmel</strong> presently withdraws <strong>w<strong>at</strong>er</strong> from the Wabash River for<br />
its public <strong>w<strong>at</strong>er</strong> supply system. The <strong>w<strong>at</strong>er</strong> use is about 1.4 million gallons per day<br />
(mgd). City officials have long been interested in loc<strong>at</strong>ing and developing a ground-<strong>w<strong>at</strong>er</strong><br />
supply source for their system to help reduce their <strong>w<strong>at</strong>er</strong> tre<strong>at</strong>ment costs. A ground<strong>w<strong>at</strong>er</strong><br />
supply would be more consistent in quality and require less chemicals to tre<strong>at</strong> to a<br />
comparable finished quality as th<strong>at</strong> furnished to their consumers now. Previously the city<br />
had contracted with Speth Plumbing, Inc., to drill test holes <strong>at</strong> a number of loc<strong>at</strong>ions<br />
south of the city in the sand and gravel aquifer system associ<strong>at</strong>ed with the bottomland<br />
area along the Wabash River. When a small area was found where the sand and gravel<br />
aquifer was thicker and more permeable than <strong>at</strong> other loc<strong>at</strong>ions, an aquifer testing<br />
program was undertaken to determine whether a supply of about 3 mgd could be<br />
developed from a reasonable number of wells.<br />
The 17 test holes drilled in the SEW, Section 29 and the N½, NE¼, Section 32,<br />
T.1 S.,R.12W., Wabash County, <strong>Illinois</strong>, showed the sand and gravel aquifer associ<strong>at</strong>ed<br />
with the Wabash River valley and bottomlands to range from about 26 to 66 feet in<br />
thickness. In a small part of the area adjacent to the river, the sand and gravel deposits<br />
were found to be about 10 to 20 feet thicker than in other areas of the Wabash River<br />
bottomland. This site appeared to have some potential for the development of the desired<br />
3-mgd supply. Test Well 2, loc<strong>at</strong>ed approxim<strong>at</strong>ely 4,200 feet west and 625 feet south of<br />
the NW corner, Section 32, T. 1 S., R. 12 W., and four observ<strong>at</strong>ion wells were drilled <strong>at</strong><br />
this site to conduct aquifer tests to evalu<strong>at</strong>e the yield of the sand and gravel aquifer and to<br />
design a well field.<br />
Previous test drilling had focused on areas farther south in the bottomland, and in<br />
1991 Test Well 1, loc<strong>at</strong>ed in the NW¼, SW¼, NW¼, Section 5, T.2 S., R.12 W.,<br />
drilling was completed <strong>at</strong> a depth of 39 feet. An aquifer test <strong>at</strong> this site, about 1¼ mile<br />
south of Test Well 2, conducted on July 16-17, 1991, showed th<strong>at</strong> the desired well field<br />
yield of about 3 mgd could not be <strong>at</strong>tained.<br />
ACKNOWLEDGEMENTS<br />
Special thanks to Scott C. Meyer, Assistant Hydrologist, and Robert D. Olson,<br />
Associ<strong>at</strong>e Hydrologist, for their assistance with the field work during the step test and the<br />
aquifer tests. Their competence enabled the d<strong>at</strong>a collection efforts to be accomplished in
spite of oper<strong>at</strong>ional difficulties with the equipment apparently caused by nearby lightning<br />
strikes. Mark A. Anliker, Assistant Hydrologist, and Erik Schuchmann, a summer<br />
employee, also assisted with the field work. W<strong>at</strong>er samples collected by W<strong>at</strong>er Survey<br />
staff during the tests were analyzed by Lauren Sievers, Brian Kaiser, Dan Webb, and<br />
Loretta Skowron of the Survey's Analytical & W<strong>at</strong>er Tre<strong>at</strong>ment Services labor<strong>at</strong>ory.<br />
Thanks also to Mark Weirich, W<strong>at</strong>er Superintendent, and the W<strong>at</strong>er Department staff<br />
who recorded the pumping r<strong>at</strong>es from the test well during the long-term aquifer tests.<br />
We also appreci<strong>at</strong>e and thank Mark Bader, City Administr<strong>at</strong>or, city of <strong>Mount</strong><br />
<strong>Carmel</strong>, and Jim Speth, Speth Plumbing. Inc., Allendale, for their efforts in coordin<strong>at</strong>ing<br />
the field work and for their professional approach in investig<strong>at</strong>ing this <strong>w<strong>at</strong>er</strong>-supply<br />
altern<strong>at</strong>ive. Initially, Michael Gill, Lamac Engineering, Inc., <strong>Mount</strong> <strong>Carmel</strong>, provided<br />
an essential communic<strong>at</strong>ion link between the city and the W<strong>at</strong>er Survey th<strong>at</strong> facilit<strong>at</strong>ed<br />
this cooper<strong>at</strong>ive <strong>investig<strong>at</strong>ion</strong>.<br />
Word processing of the camera-ready copy of this report was done by Pamela<br />
Lovett. The graphics were prepared by Linda Hascall and David C. Cox, and editing<br />
was done by Sarah Hibbeler.<br />
INVESTIGATIVE METHODS AND PROCEDURES<br />
Conduct of Testing Program<br />
Objective<br />
The principal objective of the study was to estim<strong>at</strong>e the potential for developing<br />
about 3 million gallons per day (gpd) of ground <strong>w<strong>at</strong>er</strong> to replace the existing Wabash<br />
River source. The target area for this <strong>investig<strong>at</strong>ion</strong> was in the vicinity of SE¼, Section<br />
29 and the NV2, NE¼, Section 32, T.1 S., R.12 W., Wabash County, <strong>Illinois</strong>. A pumping<br />
test well and four observ<strong>at</strong>ion wells were drilled <strong>at</strong> this site to conduct aquifer tests to<br />
evalu<strong>at</strong>e the yield of the sand and gravel aquifer and to design a well field (see figure 1).<br />
Description of Site<br />
Seventeen test holes had been drilled in the SE¼, Section 29 and the N½, NE¼,<br />
Section 32, T.1 S., R.12 W., Wabash County, <strong>Illinois</strong>, th<strong>at</strong> showed the sand and gravel<br />
aquifer associ<strong>at</strong>ed with the Wabash River valley and bottomlands to range from about 26<br />
to 66 feet in thickness. Test Holes 1, 2, 3, 4, 5, 6, 7, 12, and 15, loc<strong>at</strong>ed in a small<br />
area just north of Gre<strong>at</strong>house Creek, showed the aquifer to have a gre<strong>at</strong>er thickness than<br />
found in previous test drilling episodes in areas farther south in the river bottomlands.<br />
The logs of these holes reported from about 48 to 66 feet of <strong>w<strong>at</strong>er</strong>-bearing m<strong>at</strong>erial.<br />
This site appeared to have some potential for the development of the desired<br />
3-mgd supply. The <strong>investig<strong>at</strong>ion</strong> required the city to construct Test Well 2 and four<br />
observ<strong>at</strong>ion wells loc<strong>at</strong>ed <strong>at</strong> appropri<strong>at</strong>e distances from the test well. Test Well 2 was<br />
2
Figure 1. Aquifer test site<br />
3
loc<strong>at</strong>ed approxim<strong>at</strong>ely 4,200 feet west and 625 feet south of the NW corner, Section 32,<br />
T.1 S.,R.12 W.<br />
Speth Plumbing, Inc., Allendale, was contracted by the city for this work. The<br />
pumping test well, Test Well 2, was drilled to a depth of about 68 feet using a bucket<br />
boring rig. The bore hole was 36 inches in diameter and the casing and well screen were<br />
16 inches in diameter. The 40-foot long well screen was placed between depths of 28 to<br />
68 feet. A gravel pack known as "grit" from the Rogers Group, Inc., Vincennes,<br />
Indiana, was placed in the annulus between the casing-screen assembly and the bore hole.<br />
The nearest observ<strong>at</strong>ion well was drilled first to be used as a supply well for drilling the<br />
high-capacity test well and was finished with 6-inch plastic casing and well screen. The<br />
other three observ<strong>at</strong>ion wells were finished with 2-inch plastic casing and well screen.<br />
Design of Tests<br />
To achieve its objective, the study focused on conducting two aquifer tests. The .<br />
dur<strong>at</strong>ion of the first test was about 24 hours and the second test was about 7 days. The<br />
aquifer tests consisted of pumping the test well <strong>at</strong> a constant, uninterrupted r<strong>at</strong>e for the<br />
test period while observing ground-<strong>w<strong>at</strong>er</strong> levels in the pumping test well and in three or<br />
four observ<strong>at</strong>ion wells loc<strong>at</strong>ed <strong>at</strong> appropri<strong>at</strong>e distances from the pumping test well.<br />
Prior to the aquifer tests, a step test was conducted on the pumping test well to<br />
determine an appropri<strong>at</strong>e pumping r<strong>at</strong>e for the 24-hour aquifer test and to estim<strong>at</strong>e the<br />
hydraulic efficiency of the well. The step test consisted of pumping the test well <strong>at</strong><br />
increasing increments of the full r<strong>at</strong>e for about 30 minutes <strong>at</strong> each r<strong>at</strong>e. During the test,<br />
ground-<strong>w<strong>at</strong>er</strong> levels were observed in the pumping test well and in one observ<strong>at</strong>ion well.<br />
Seven steps were conducted <strong>at</strong> r<strong>at</strong>es ranging from 750 to 1,050 gallons per minute (gpm).<br />
Conduct of Tests<br />
Field work was conducted by the authors, Scott C. Meyer, Robert D. Olson, and<br />
Mark A. Anliker of the <strong>Illinois</strong> St<strong>at</strong>e W<strong>at</strong>er Survey, and assisted by Jim Speth and Danny<br />
Speth of Speth Plumbing, Inc., the drilling contractor, and by Mark Weirich, W<strong>at</strong>er<br />
Superintendent, city of <strong>Mount</strong> <strong>Carmel</strong>, and his staff. Speth Plumbing, Inc., furnished<br />
and installed pumping equipment in the test well and discharge piping. Discharge r<strong>at</strong>e<br />
measuring equipment, <strong>w<strong>at</strong>er</strong>-level measuring equipment, and d<strong>at</strong>a logging equipment in<br />
the test well and in the observ<strong>at</strong>ion wells was furnished and installed by the W<strong>at</strong>er<br />
Survey. The river stage is monitored by a U.S. Geological Survey (USGS) gage loc<strong>at</strong>ed<br />
near the railroad bridge about 4,500 feet north-northeast of the Test Well 2 site.<br />
The step test was conducted on October 20, 1992, the 24-hour aquifer test was<br />
conducted on October 22-23, 1992, and an initial 7-day aquifer test was conducted on<br />
November 9-16, 1992. Due to rising stages of the Wabash River during the 7-day test,<br />
the collected test d<strong>at</strong>a were severely compromised, preventing a conclusive analysis.<br />
Rainfall/runoff events during the winter and spring months prevented a subsequent<br />
<strong>at</strong>tempt to conduct the 7-day test. Also, the results of the long-term test had indic<strong>at</strong>ed the<br />
4
apparent hydraulic connection between the sand and gravel aquifer and the Wabash River<br />
and a need to establish a rel<strong>at</strong>ionship with which to make adjustments to d<strong>at</strong>a collected<br />
during future long-term aquifer tests. A d<strong>at</strong>a logger and pressure transmitter were<br />
installed on Observ<strong>at</strong>ion Well (OW) 2 on December 22, 1992, to begin collection of d<strong>at</strong>a<br />
for this purpose. Vandalism to the equipment occurred on March 30, 1993, but sufficient<br />
d<strong>at</strong>a were collected to establish a rel<strong>at</strong>ionship. A second <strong>at</strong>tempt to conduct the long-term<br />
aquifer test was made during June 28-July 7, 1993. Once again, rising river stages<br />
compromised the d<strong>at</strong>a collected. At the completion of this test, the d<strong>at</strong>a logger and<br />
pressure transmitters were left in place in all of the wells to collect additional d<strong>at</strong>a to<br />
evalu<strong>at</strong>e the aquifer-river rel<strong>at</strong>ionship. Approxim<strong>at</strong>ely 11 days of d<strong>at</strong>a were collected<br />
before the equipment malfunctioned, apparently due to a nearby lightning strike.<br />
A third <strong>at</strong>tempt to conduct the long-term test was made during the period August<br />
24-September 8, 1993. During this period about 13,000 minutes of d<strong>at</strong>a were collected<br />
prior to equipment malfunction on September 2, 1993, and rising river stages. Pumping<br />
equipment and all ground-<strong>w<strong>at</strong>er</strong>-level measurement equipment remained the same for all<br />
tests. Pumped ground <strong>w<strong>at</strong>er</strong> was conducted from the well head into the Wabash River<br />
through about 40 feet of 6-inch-diameter plastic pipe to a 10-foot length of 8-inchdiameter<br />
plastic pipe and the W<strong>at</strong>er Survey's 8-inch-diameter orifice tube, and discharged<br />
down the river bank via a trough made of metal sheeting. A 6-inch butterfly valve <strong>at</strong> the<br />
well head was used to control the pumping r<strong>at</strong>es.<br />
The W<strong>at</strong>er Survey's 8-inch orifice tube used to measure the flow r<strong>at</strong>es had been<br />
previously calibr<strong>at</strong>ed and is used regularly for well production and aquifer tests. <strong>Ground</strong><strong>w<strong>at</strong>er</strong>-level<br />
measuring equipment included the W<strong>at</strong>er Survey's Microcomputer D<strong>at</strong>a<br />
Acquisition System (McDAS), Omnid<strong>at</strong>a logging equipment, and pressure transmitters in<br />
each well. The McDAS system was used during the step test and during the first few<br />
hours and recovery period of the 24-hour test and the long-term tests, except for the last<br />
long-term test which was conducted beginning August 24, 1993. Each test was begun<br />
using the McDAS system to log the ground-<strong>w<strong>at</strong>er</strong>-level d<strong>at</strong>a. After the first few hours of<br />
each test, the pressure transmitters were connected to the Omnid<strong>at</strong>a system, which logged<br />
the ground-<strong>w<strong>at</strong>er</strong>-level d<strong>at</strong>a until near the end of the tests when the McDAS system was<br />
reconnected to the transmitters. This procedure was employed because very frequent<br />
(every few seconds) determin<strong>at</strong>ions of ground-<strong>w<strong>at</strong>er</strong> levels during the early and recovery<br />
test portions were important for the analysis methodology. While the McDAS system has<br />
this capability, the best frequency achieved by the Omnid<strong>at</strong>a system is once a minute.<br />
During the last long-term test, only the Omnid<strong>at</strong>a logging equipment with the pressure<br />
transmitters was used because the earlier test <strong>at</strong>tempts had successfully collected the<br />
<strong>w<strong>at</strong>er</strong>-level d<strong>at</strong>a during the beginning portion of the test.<br />
Step Test<br />
Setup and Conduct<br />
The equipment for the step test did not devi<strong>at</strong>e from th<strong>at</strong> described earlier. The<br />
submersible test pump was set <strong>at</strong> a depth of about 40 feet. After field discussion with<br />
5
Jim Speth, Speth Plumbing, Inc., regarding the development of the pumping test well and<br />
the capability of the test pump, it was decided th<strong>at</strong> the step test would begin <strong>at</strong> a r<strong>at</strong>e of<br />
about 750 gpm and then increase in 50-gpm increments until the full r<strong>at</strong>e of the pump<br />
was reached or <strong>w<strong>at</strong>er</strong> levels reached critical depths. A minimum of three steps is<br />
necessary for analysis, and five steps are desirable. Seven 30-minute steps were<br />
conducted before the maximum capacity of the installed test pump was reached <strong>at</strong> a r<strong>at</strong>e<br />
of slightly more than 1,050 gpm.<br />
For this <strong>investig<strong>at</strong>ion</strong> the primary purpose of the step test was to observe the<br />
response (ground-<strong>w<strong>at</strong>er</strong> levels) of the pumped well and the aquifer system to pumping.<br />
The response would determine a pumping r<strong>at</strong>e th<strong>at</strong> could be sustained for the desired 24-<br />
hour and 7-day long-term constant-r<strong>at</strong>e aquifer tests, but <strong>at</strong> the same time stress the<br />
aquifer system sufficiently to provide meaningful d<strong>at</strong>a for analysis. It also would be<br />
necessary during the long-term test to establish the degree of hydraulic connection<br />
between the sand and gravel aquifer system and the Wabash River.<br />
A second purpose of the step test was to determine the well-loss coefficient of the<br />
well to enable calcul<strong>at</strong>ion of the portion of observed drawdown <strong>at</strong>tributable to well<br />
inefficiencies. Well loss, described in more detail below, is an additional component of<br />
observed drawdown in pumping wells th<strong>at</strong> can significantly reduce sustainable yields.<br />
Well Loss<br />
When a well is pumped, <strong>w<strong>at</strong>er</strong> is removed from the aquifer surrounding the well,<br />
and the <strong>w<strong>at</strong>er</strong> levels are lowered. Drawdown is the distance th<strong>at</strong> the <strong>w<strong>at</strong>er</strong> level is<br />
lowered, whether within the well or in the surrounding aquifer. Under ideal conditions,<br />
drawdown is a function of pumping r<strong>at</strong>e, time, and the aquifer's hydraulic properties.<br />
Specific capacity, pumping r<strong>at</strong>e divided by the <strong>w<strong>at</strong>er</strong>-level drawdown in the pumped well<br />
following an established pumping period, is often used to describe well performance.<br />
However, because other nonideal geohydrologic and hydraulic factors can affect the<br />
observed drawdown (particularly within the pumped well), the specific capacity may not<br />
provide the full well-performance picture, especially when pumping r<strong>at</strong>es change.<br />
Aquifer boundaries, sp<strong>at</strong>ial vari<strong>at</strong>ion in aquifer thickness or hydraulic properties,<br />
interference from nearby wells, partial-penetr<strong>at</strong>ion conditions, and well losses all can<br />
affect observed drawdowns. Well losses, usually associ<strong>at</strong>ed only with the pumped well,<br />
are a reflection of the hydraulic efficiency of the well components (well screen and gravel<br />
pack) and are the only nonideal condition addressed here.<br />
The observed drawdown in a pumped well is usually gre<strong>at</strong>er than th<strong>at</strong> in the<br />
aquifer form<strong>at</strong>ion outside the borehole because of the well losses caused by the <strong>w<strong>at</strong>er</strong><br />
moving from the fully penetr<strong>at</strong>ed aquifer into the well. The amount of well loss depends<br />
on the m<strong>at</strong>erials used and the job done in constructing the well. A limited amount of<br />
well loss is n<strong>at</strong>ural because of the physical blocking of the aquifer interstices caused by<br />
the well screen and the disturbance of aquifer m<strong>at</strong>erial around the borehole during<br />
construction. However, an improperly designed well and/or ineffective well construction<br />
and development techniques can result in unacceptable well losses. In addition, well<br />
6
losses often reflect a deterior<strong>at</strong>ion in the condition of an existing well, especially if they<br />
are observed to increase with time.<br />
Well losses are rel<strong>at</strong>ed to pumping r<strong>at</strong>e and ideally are not a function of time.<br />
These losses are associ<strong>at</strong>ed with changes in flow velocity in the immedi<strong>at</strong>e vicinity of the<br />
well, resistance to flow through the well screen, and changes in flow p<strong>at</strong>h and velocity<br />
inside the well. In some cases, well loss occurs entirely under conditions of laminar<br />
flow; however, velocities may become sufficiently large th<strong>at</strong> a change from laminar to<br />
turbulent flow occurs. Under these conditions, the well-loss component of drawdown can<br />
rapidly become excessive, increasing in a nonlinear manner with increases in pumping<br />
r<strong>at</strong>e.<br />
Thus, under near-ideal conditions, the observed drawdown (s o ) in a pumping well<br />
is made up of two components: the form<strong>at</strong>ion loss (s a , resulting from laminar (and<br />
sometimes turbulent) flow head loss within the aquifer; and well loss (s w , resulting from<br />
the turbulent (and sometimes laminar) flow of <strong>w<strong>at</strong>er</strong> into and inside the well, as shown in<br />
equ<strong>at</strong>ion 1.<br />
Jacob (1947) devised a technique for separ<strong>at</strong>ing the well losses from the form<strong>at</strong>ion<br />
losses, assuming th<strong>at</strong> all form<strong>at</strong>ion losses are laminar and all well losses are turbulent.<br />
These components of theoretical drawdown, s, in the pumped well are then expressed as<br />
being proportional to pumping r<strong>at</strong>e, Q, in the following manner:<br />
where B is the form<strong>at</strong>ion-loss coefficient <strong>at</strong> the well-aquifer interface per unit discharge,<br />
and C is the well-loss coefficient. For convenience, s is expressed in feet and Q in<br />
ft 3 /sec. Thus, the well-loss coefficient C has the units sec 2 /ft 5 . Rorabaugh (1953)<br />
suggested th<strong>at</strong> the well-loss component be expressed as CQ n , where n is a constant<br />
gre<strong>at</strong>er than 1. He thus expressed the drawdown as:<br />
To evalu<strong>at</strong>e the well-loss component of the total drawdown, one must know the<br />
well-loss coefficient (if using equ<strong>at</strong>ion 2) or both the coefficient and the exponent (if<br />
using equ<strong>at</strong>ion 3). This analysis requires a controlled pumping test, called a step<br />
drawdown test, in which total drawdown is system<strong>at</strong>ically measured while pumping r<strong>at</strong>es<br />
are varied in a stepwise manner.<br />
Methodology for Determining Well Loss<br />
If Jacob's equ<strong>at</strong>ion is used to express drawdown, then the coefficients B and C<br />
must be determined. A graphical procedure can be employed after first modifying<br />
equ<strong>at</strong>ion 2 as:<br />
7
After this modific<strong>at</strong>ion, a plot of s o /Q versus Q can be prepared on arithmetic graph<br />
paper from d<strong>at</strong>a collected during a step drawdown test, with the observed drawdown, s o ,<br />
substituted for s. The slope of a line fitted to these d<strong>at</strong>a is equal to C, while the y-<br />
intercept is equal to B, as shown in figure 2. If the d<strong>at</strong>a do not fall on a straight line, but<br />
instead curve concavely upward, then another method of analysis described by Rorabaugh<br />
usually is suggested. The curv<strong>at</strong>ure of the plotted d<strong>at</strong>a indic<strong>at</strong>es th<strong>at</strong> the second order<br />
rel<strong>at</strong>ionship between Q and s o is not valid.<br />
Occasionally the d<strong>at</strong>a plot may yield a line with zero slope or a neg<strong>at</strong>ive slope, or<br />
be too random to provide a reasonable fit to one line. In these instances, the coefficients<br />
are immeasurable. Possible causes of this are: 1) turbulent well loss is negligible over<br />
the pumping r<strong>at</strong>es tested; 2) inadequ<strong>at</strong>e d<strong>at</strong>a collection or test methods were employed<br />
during the test; 3) the hydraulic condition of the well is unstable, such as happens during<br />
well development; and 4) the contribution of <strong>w<strong>at</strong>er</strong> from the entire length of well screen<br />
over the range of test pumping r<strong>at</strong>es is unequal, as might occur due to vertical<br />
heterogeneity of the aquifer m<strong>at</strong>erials.<br />
Step-Test Procedure<br />
The primary objective of a step drawdown test (or step test) is determin<strong>at</strong>ion of<br />
the well-loss coefficient (and exponent, if Rorabaugh's method is used). With this<br />
inform<strong>at</strong>ion, the turbulent well-loss portion of drawdown for any pumping r<strong>at</strong>e of interest<br />
can be estim<strong>at</strong>ed. During the test, the well is pumped successively <strong>at</strong> a number of<br />
pumping r<strong>at</strong>es. Equally spaced pumping r<strong>at</strong>es are selected to facilit<strong>at</strong>e the d<strong>at</strong>a analysis.<br />
Each pumping period <strong>at</strong> a given r<strong>at</strong>e is called a step, and all steps are of equal dur<strong>at</strong>ion.<br />
Generally, the pumping r<strong>at</strong>es increase from step to step, but the test also can be<br />
conducted by decreasing the pumping r<strong>at</strong>es.<br />
During each step, pumpage is held constant. If d<strong>at</strong>a are collected manually,<br />
<strong>w<strong>at</strong>er</strong>-level measurements are made every minute for the first six minutes, every two<br />
minutes for the next ten minutes, and then every four to five minutes thereafter until the<br />
end of the step. For the step test in this study, the W<strong>at</strong>er Survey's McDAS was used to<br />
collect the d<strong>at</strong>a. It can be set to read the d<strong>at</strong>a either <strong>at</strong> a selected frequency or<br />
logarithmically as conditions dict<strong>at</strong>e. For this test, the <strong>w<strong>at</strong>er</strong>-level readings were taken<br />
every 0.2 minutes for the dur<strong>at</strong>ion of each step. At the end of each 30-minute step<br />
interval, the pumping r<strong>at</strong>e was immedi<strong>at</strong>ely changed until eventually the well had been<br />
tested under a wide range of pumping r<strong>at</strong>es within the capacity of the pump.<br />
Schem<strong>at</strong>ically, the rel<strong>at</strong>ionship between time and <strong>w<strong>at</strong>er</strong> level resembles th<strong>at</strong> shown<br />
for a five-step test in figure 3. Drawdowns for each step (shown as ∆s i ) are measured as<br />
the distance between the extrapol<strong>at</strong>ed <strong>w<strong>at</strong>er</strong> levels from the previous step and the final<br />
<strong>w<strong>at</strong>er</strong> level of the current step. For step 1, the nonpumping <strong>w<strong>at</strong>er</strong>-level trend prior to the<br />
start of the test is extrapol<strong>at</strong>ed, and ∆s 1 is measured from this d<strong>at</strong>um. All d<strong>at</strong>a<br />
extrapol<strong>at</strong>ions should be performed on semilog graph paper for the most accur<strong>at</strong>e results.<br />
8
Figure 2. Graphical solution of Jacob's equ<strong>at</strong>ion<br />
for well-loss coefficient, C<br />
9
Figure 3. Rel<strong>at</strong>ionship between time and <strong>w<strong>at</strong>er</strong> level<br />
during a five-step drawdown test<br />
10
For the purpose of plotting s o /Q versus Q, values of observed drawdown s o are equal to<br />
the sum of ∆s i for a given step. Thus, for step 3, s o = ∆s 1 + ∆s 2 + ∆s 3 .<br />
Aquifer Tests<br />
As described earlier, the <strong>investig<strong>at</strong>ion</strong> plan included the conduct of one 24-hour<br />
aquifer test and a subsequent long-term (7-day) aquifer test. The 24-hour test was<br />
conducted with three observ<strong>at</strong>ion wells and d<strong>at</strong>a collected for a preliminary analysis of<br />
the hydraulic properties of the sand and gravel aquifer. This test also allowed<br />
verific<strong>at</strong>ion of an acceptable pumping r<strong>at</strong>e and a decision on the number of observ<strong>at</strong>ion<br />
wells needed for the 7-day aquifer test.<br />
Setup and Conduct<br />
The test equipment for the aquifer tests did not devi<strong>at</strong>e from th<strong>at</strong> described earlier.<br />
Based on the response of the aquifer during the step test, it was concluded th<strong>at</strong> a pumping<br />
r<strong>at</strong>e of about 800 to 900 gpm could be maintained as a constant r<strong>at</strong>e during the aquifer<br />
tests. The <strong>w<strong>at</strong>er</strong>-table conditions <strong>at</strong> the site made it desirable to start the test with the<br />
discharge valve preset to the target r<strong>at</strong>e. This made it possible to collect ground-<strong>w<strong>at</strong>er</strong><br />
levels during the earliest part of the test without having to correct for pumping-r<strong>at</strong>e<br />
adjustments. The effect was to extend the amount of usable d<strong>at</strong>a for analysis.<br />
Early-time ground-<strong>w<strong>at</strong>er</strong>-level d<strong>at</strong>a were collected as described above during each<br />
of the aquifer tests except for the last one, which concluded in September 1993. The<br />
previous d<strong>at</strong>a analysis indic<strong>at</strong>ed th<strong>at</strong> this early d<strong>at</strong>a collection effort was no longer<br />
needed, so only the Omnid<strong>at</strong>a logging system collecting ground-<strong>w<strong>at</strong>er</strong>-level d<strong>at</strong>a <strong>at</strong><br />
1-minute intervals was used for this last long-term aquifer test.<br />
Analysis<br />
The capacity of a form<strong>at</strong>ion to transmit ground <strong>w<strong>at</strong>er</strong> is expressed by the<br />
transmissivity, which is the r<strong>at</strong>e of flow of <strong>w<strong>at</strong>er</strong>, in gpd, through a 1-foot-wide vertical<br />
strip of the aquifer extending the full s<strong>at</strong>ur<strong>at</strong>ed thickness under a hydraulic gradient of<br />
100 percent (one foot per foot) <strong>at</strong> the prevailing <strong>w<strong>at</strong>er</strong> temper<strong>at</strong>ure. Transmissivity is the<br />
product of the s<strong>at</strong>ur<strong>at</strong>ed thickness of the aquifer and the hydraulic conductivity, which is<br />
the r<strong>at</strong>e of flow of <strong>w<strong>at</strong>er</strong>, in gpd, through a cross-sectional area of one square foot of the<br />
aquifer under a hydraulic gradient of 100 percent <strong>at</strong> the prevailing <strong>w<strong>at</strong>er</strong> temper<strong>at</strong>ure.<br />
The storage properties of an aquifer are expressed by the storage coefficient, the volume<br />
of <strong>w<strong>at</strong>er</strong> released from storage per unit surface area of the aquifer per unit change in the<br />
<strong>w<strong>at</strong>er</strong> level. This parameter is dimensionless.<br />
The hydraulic properties of an aquifer may be determined by means of an aquifer<br />
test, where the effect of pumping a well <strong>at</strong> a known constant r<strong>at</strong>e is measured in the<br />
pumped well and <strong>at</strong> observ<strong>at</strong>ion wells th<strong>at</strong> penetr<strong>at</strong>e the aquifer <strong>at</strong> various distances from<br />
the pumped well. Graphs of drawdown (the lowering of <strong>w<strong>at</strong>er</strong> levels in the wells) versus<br />
time after pumping starts and/or drawdown versus distance from the pumped well are<br />
11
used to solve equ<strong>at</strong>ions th<strong>at</strong> express the rel<strong>at</strong>ion between the transmissivity, storage<br />
coefficient, pumping r<strong>at</strong>e, and drawdown. Where appropri<strong>at</strong>e, drawdown d<strong>at</strong>a must be<br />
adjusted to account for conditions th<strong>at</strong> affect the observed r<strong>at</strong>e of drawdown, such as<br />
vari<strong>at</strong>ions in pumping r<strong>at</strong>e, barometric pressure fluctu<strong>at</strong>ions, pumping in nearby wells,<br />
aquifer boundaries, significant de<strong>w<strong>at</strong>er</strong>ing (see l<strong>at</strong>er discussion of <strong>w<strong>at</strong>er</strong>-table conditions),<br />
or a partially penetr<strong>at</strong>ing pumped well. The two most common methods of analysis for<br />
field d<strong>at</strong>a under artesian conditions—the type-curve method and the Jacob straight-line<br />
method—are described below.<br />
Type-Curve Method<br />
Theis (1935) introduced an analogy between the nonsteady flow of ground <strong>w<strong>at</strong>er</strong><br />
and he<strong>at</strong> conduction. The nonequilibrium formula—popularly known as the Theis<br />
equ<strong>at</strong>ion—describes radial flow toward a well pumping from an artesian aquifer as:<br />
s = drawdown <strong>at</strong> distance r from the pumped well, in feet<br />
Q = well discharge, in gpm<br />
T = transmissivity, in gpd/foot (ft)<br />
r = distance from pumped well to observ<strong>at</strong>ion point, in feet<br />
S = storage coefficient, decimal fraction<br />
t = time since pumping began, in minutes<br />
12
W(u), referred to as the well function for nonleaky artesian aquifers,<br />
extensively tabul<strong>at</strong>ed.<br />
has been<br />
Theis devised a graphical procedure using superposition to solve for the aquifer<br />
properties, T and S. Recall equ<strong>at</strong>ions 6 and 8, inverting equ<strong>at</strong>ion 8:<br />
Take the logarithm of both sides of these equ<strong>at</strong>ions and expand:<br />
In equ<strong>at</strong>ion 11 the term log [114.6Q/T] is a constant for a given pumping r<strong>at</strong>e (hence, the<br />
need for a constant pumping r<strong>at</strong>e during tests), so log s is directly rel<strong>at</strong>ed to log W(u).<br />
Also, in equ<strong>at</strong>ion 12 the term log [T/2693r 2 S] is a constant for a given distance r (a<br />
selected observ<strong>at</strong>ion well), so log 1/u is directly rel<strong>at</strong>ed to log t. Thus,<br />
From these rel<strong>at</strong>ionships, one can construct a plot of the well function W(u)<br />
versus 1/u on log-log graph paper (figure 4). Such a plot of a m<strong>at</strong>hem<strong>at</strong>ical function is<br />
called a type curve. Likewise, one can plot on identical log-log paper a plot of<br />
drawdown s versus time t from the d<strong>at</strong>a collected <strong>at</strong> each observ<strong>at</strong>ion well.<br />
The type curve is then superposed over the field-d<strong>at</strong>a plot, keeping the<br />
corresponding ordin<strong>at</strong>e and abscissa axes parallel, until a best fit is obtained. A<br />
convenient m<strong>at</strong>ch point is chosen on the two graphs (usually one th<strong>at</strong> includes the<br />
convenient type-curve m<strong>at</strong>ch point of W(u) = 1 and 1/u = 10). The corresponding<br />
13
Figure 4. Nonleaky artesian type curve<br />
14
coordin<strong>at</strong>es of W(u), 1/u, s, and t are then substituted into equ<strong>at</strong>ions 6 and 8 to solve for<br />
T and S.<br />
In the same manner, one could make a type curve of W(u) versus u, noting the<br />
rel<strong>at</strong>ionship between s versus W(u) and between u and r 2 . For an aquifer test in which<br />
several observ<strong>at</strong>ion wells were used, one could fit the new type curve to a field-d<strong>at</strong>a plot<br />
of s versus r 2 for a given time, and follow the same procedure of fitting the type curve to<br />
the field-d<strong>at</strong>a plot and selecting a m<strong>at</strong>ch point.<br />
Jacob Straight-Line Method<br />
A popular graphical method derived from the Theis method by Cooper and Jacob<br />
(1946) is referred to as the modified nonleaky artesian formula, or simply the Jacob<br />
straight-line method. The method is based on the fact th<strong>at</strong> when values of u are small<br />
(less than, say, 0.01), the sum of the series terms in equ<strong>at</strong>ion 7 beyond ln u becomes<br />
insignificant. An examin<strong>at</strong>ion of the terms in equ<strong>at</strong>ion 8 shows th<strong>at</strong> u becomes small<br />
when r becomes small (close-in observ<strong>at</strong>ion wells) or t becomes large (long pumping<br />
periods).<br />
When u < 0.01, field-d<strong>at</strong>a plots of drawdown versus log time on semilog paper<br />
will yield a straight line. The straight-line portion of the s versus t plot is extrapol<strong>at</strong>ed to<br />
its intersection with the zero-drawdown axis. The slope of the straight line (drawdown<br />
per log cycle) is used to solve for the transmissivity, and the zero-drawdown intercept is<br />
used to solve for the storage coefficient. Expressions for these comput<strong>at</strong>ions, derived by<br />
Cooper and Jacob (1946) are:<br />
where:<br />
T = transmissivity, in gpd/ft<br />
S = storage coefficient<br />
Q = well discharge, in gpm<br />
AS = drawdown difference per log cycle, in feet<br />
r = distance from pumped well to observ<strong>at</strong>ion point, in feet<br />
t 0 = intersection of straight-line slope with zero-drawdown<br />
axis, in minutes<br />
15
The method can be extended also to plots of drawdown versus distance for given<br />
time values. Field-d<strong>at</strong>a plots of drawdown versus log distance on semilog paper will<br />
yield a straight line in the region where u ≤0.01. The straight-line portion of the graph<br />
is extrapol<strong>at</strong>ed to its intersection with the zero-drawdown axis. The slope of the straight<br />
line is used to solve for T, and the zero-drawdown intercept is used to solve for S, using<br />
the following expressions:<br />
where:<br />
r 0 = intersection of straight-line slope with zero-drawdown axis, in feet<br />
and all other terms are as defined above.<br />
The Jacob straight-line method is popular because of its simplicity; however, its<br />
use is restricted to field d<strong>at</strong>a th<strong>at</strong> s<strong>at</strong>isfy the "u-criterion" of u ≤ 0.01. Devi<strong>at</strong>ion from a<br />
straight line becomes appreciable when u exceeds about 0.02 (Walton, 1962). The<br />
method should be used to supplement, r<strong>at</strong>her than supercede, the type-curve method.<br />
W<strong>at</strong>er-Table Conditions<br />
The methods described in the previous section pertain to artesian aquifer<br />
conditions; however, the formulas can also be applied to the results of aquifer tests made<br />
under <strong>w<strong>at</strong>er</strong>-table (unconfmed) conditions. These formulas were developed in part based<br />
on the assumptions th<strong>at</strong> the coefficient of storage is constant and th<strong>at</strong> <strong>w<strong>at</strong>er</strong> is released<br />
from storage instantaneously with a decline in <strong>w<strong>at</strong>er</strong> levels. Under <strong>w<strong>at</strong>er</strong>-table<br />
conditions, <strong>w<strong>at</strong>er</strong> is derived largely from storage by the gravity drainage of the interstices<br />
in the portion of the aquifer de<strong>w<strong>at</strong>er</strong>ed by the pumping. The gravity drainage of <strong>w<strong>at</strong>er</strong><br />
through str<strong>at</strong>ified sediments is not immedi<strong>at</strong>e, and the nonsteady flow of <strong>w<strong>at</strong>er</strong> towards a<br />
well in an unconfmed aquifer is characterized by slow drainage in interstices.<br />
Gravity drainage of interstices decreases the s<strong>at</strong>ur<strong>at</strong>ed thickness and, therefore, the<br />
transmissivity of the aquifer. Under <strong>w<strong>at</strong>er</strong>-table conditions, observed values of<br />
drawdown must be compens<strong>at</strong>ed for by the decrease in s<strong>at</strong>ur<strong>at</strong>ed thickness before the d<strong>at</strong>a<br />
can be used to determine the hydraulic properties of the aquifer. The following equ<strong>at</strong>ion<br />
derived by Jacob (1944) is used to adjust drawdown d<strong>at</strong>a for decreases in transmissivity:<br />
16
where:<br />
s' = drawdown th<strong>at</strong> would occur in an equivalent artesian aquifer<br />
s = observed drawdown under <strong>w<strong>at</strong>er</strong>-table conditions<br />
m = initial s<strong>at</strong>ur<strong>at</strong>ed thickness of aquifer<br />
WELL AND AQUIFER TEST RESULTS<br />
Step-Test Results<br />
The d<strong>at</strong>a collected during the step test conducted on October 20, 1992, were<br />
analyzed using the Jacob methodology described earlier. The results of the analysis<br />
indic<strong>at</strong>e th<strong>at</strong> Test Well 2 had a rel<strong>at</strong>ively low well-loss coefficient of approxim<strong>at</strong>ely 0.57<br />
sec 2 /ft 5 . Although this value is low, since drawdown due to well loss is proportional to<br />
the square of the pumping r<strong>at</strong>e, and rel<strong>at</strong>ively high pumping r<strong>at</strong>es (860 to 940 gpm) were<br />
used during the subsequent aquifer tests, about 20 to 25 percent of the observed<br />
drawdown in the well was due to well loss. At a pumping r<strong>at</strong>e of about 500 gpm, the<br />
well loss in Test Well 2 would be about 12 percent.<br />
24-Hour Aquifer Test (October 1992)<br />
The 24-hour aquifer test was conducted on October 22-23, 1992, to obtain<br />
preliminary values of aquifer hydraulic properties and to determine the need for<br />
additional observ<strong>at</strong>ion wells in the long-term aquifer test. Pumping <strong>at</strong> Test Well 2<br />
commenced <strong>at</strong> 10:40 a.m. on October 22 and ended <strong>at</strong> 10:00 a.m. on October 23, for a<br />
pumping period of 1,400 minutes. The pumping r<strong>at</strong>e was adjusted periodically<br />
throughout the test, and an average discharge r<strong>at</strong>e of 935 gpm was maintained. At the<br />
completion of pumping, <strong>w<strong>at</strong>er</strong>-level recovery was measured for 190 minutes. W<strong>at</strong>er-level<br />
measurements were made throughout the test in the pumping well and in OWs 1,2,<br />
and 3 (OW 4 had not as yet been constructed), loc<strong>at</strong>ed 80 feet, 147 feet, and 247 feet,<br />
respectively, north of Test Well 2.<br />
Because available inform<strong>at</strong>ion indic<strong>at</strong>ed th<strong>at</strong> the aquifer was under <strong>w<strong>at</strong>er</strong>-table<br />
(unconfined) conditions <strong>at</strong> the time of the test, drawdown d<strong>at</strong>a were corrected for<br />
de<strong>w<strong>at</strong>er</strong>ing. Time-drawdown graphs of the corrected d<strong>at</strong>a were then constructed and<br />
analyzed, using the Type-Curve and Straight-Line methodologies described earlier. The<br />
graphs showed th<strong>at</strong> slow gravity drainage was still taking place <strong>at</strong> the end of the test,<br />
making graphical interpret<strong>at</strong>ions difficult. Preliminary d<strong>at</strong>a analysis suggested th<strong>at</strong> the<br />
aquifer transmissivity ranged between about 226,500 gpd/ft <strong>at</strong> the pumped well and about<br />
290,400 gpd/ft <strong>at</strong> OW 2 and averaged about 261,400 gpd/ft. Hydraulic conductivity<br />
varied from about 4,530 gpd/ft 2 <strong>at</strong> Test Well 2 to about 6,180 gpd/ft 2 <strong>at</strong> OW 2 and<br />
averaged about 5,530 gpd/ft 2 . Storage coefficients ranged from 0.0058 <strong>at</strong> OW 1 to 0.12<br />
<strong>at</strong> OW 3 and averaged 0.05.<br />
17
Insights gained from the analysis of the long-term aquifer test in August 1993<br />
(described l<strong>at</strong>er in this report), were used to reexamine the d<strong>at</strong>a from the 24-hour test.<br />
This revised analysis indic<strong>at</strong>ed th<strong>at</strong> the d<strong>at</strong>a could easily be interpreted in a manner<br />
entirely consistent with the results from the August 1993 aquifer test. The results are<br />
presented in table 1. Transmissivity values ranged from 226,400 gpd/ft <strong>at</strong> the pumped<br />
well to 249,300 gpd/ft <strong>at</strong> OW 1 and averaged 234,600 gpd/ft, while hydraulic<br />
conductivity values had a range from 4,530 gpd/ft 2 <strong>at</strong> the pumped well to 5,365 gpd/ft 2 <strong>at</strong><br />
OW 3 and averaged 4,954 gpd/ft 2 . Storage coefficients varied from 0.009 <strong>at</strong> OW 1 to<br />
0.17 <strong>at</strong> OW 3 and averaged 0.071.<br />
Table 1. Results of 24-hour test<br />
Straight-line method<br />
Type-curve method<br />
T K T K<br />
Well (gpd/ft) (gpd/ft 2 ) S (gpd/ft) (gpd/ft 2 ) S<br />
TW 2 226,460 4,530 - - - -<br />
OW 1 249,300 4,987 0.009 249,200 4,984 0.01<br />
OW2 231,800 4,932 0.053 232,900 4,955 0.056<br />
OW3 230,700 5,365 0.13 230,400 5,358 0.17<br />
TW = Test Well<br />
T = transmissivity<br />
K = hydraulic conductivity<br />
S = storage coefficient<br />
In addition to their use in deriving estim<strong>at</strong>es of the aquifer hydraulic properties,<br />
the results of the 24-hour test were also used to recommend th<strong>at</strong> a fourth observ<strong>at</strong>ion well<br />
be drilled for use during the scheduled long-term aquifer test. The fourth observ<strong>at</strong>ion<br />
well was to be constructed to the west (landward) of the pumped well, on a line<br />
perpendicular to the river. The purpose of this was to position a well farther from the<br />
influence of the river, in order to better monitor the influence of any barrier boundaries<br />
th<strong>at</strong> might manifest themselves during the long-term test. Prior to conducting the longterm<br />
aquifer test, a fourth observ<strong>at</strong>ion well (OW 4) was constructed <strong>at</strong> a site 120 feet<br />
west of Test Well 2.<br />
First Long-Term Aquifer Test (November 1992)<br />
The initial long-term aquifer test <strong>at</strong> Test Well 2 began <strong>at</strong> 1:20 p.m. on November<br />
9, 1992, and concluded seven days l<strong>at</strong>er <strong>at</strong> 1:20 p.m. on November 16. Although the<br />
pumping r<strong>at</strong>e ranged from 868 gpm to 970 gpm, it remained between 868 gpm and 890<br />
gpm for the majority of the test, averaging 875 gpm. W<strong>at</strong>er levels were monitored in<br />
Test Well 2 and in all four observ<strong>at</strong>ion wells.<br />
Approxim<strong>at</strong>ely 40 hours after the test began, <strong>w<strong>at</strong>er</strong> levels in all five wells began to<br />
rise in response to a rise in stage in the Wabash River. The river continued to rise<br />
throughout the test, so th<strong>at</strong> by the end of the test, on November 16, <strong>w<strong>at</strong>er</strong> levels had<br />
risen about 10 feet in the pumped well and about 4½ to 5 feet in the observ<strong>at</strong>ion wells.<br />
18
This large rise in ground-<strong>w<strong>at</strong>er</strong> levels totally masked the rel<strong>at</strong>ively small changes in<br />
drawdown th<strong>at</strong> were occurring by th<strong>at</strong> time in the test. Since no d<strong>at</strong>a existed <strong>at</strong> the time<br />
th<strong>at</strong> could be used to correl<strong>at</strong>e ground-<strong>w<strong>at</strong>er</strong> levels with river stages, corrections to the<br />
drawdown d<strong>at</strong>a were impossible, and the l<strong>at</strong>e d<strong>at</strong>a (after about 40 hours of test pumping)<br />
were rendered useless for analysis purposes.<br />
W<strong>at</strong>er-level d<strong>at</strong>a collected during the early part of the test (prior to the rise in<br />
<strong>w<strong>at</strong>er</strong> levels) could not generally be reconciled with results from the 24-hour test,<br />
especially in the d<strong>at</strong>a from OW 1. L<strong>at</strong>er <strong>at</strong>tempts to apply the results from the August<br />
1993 test to d<strong>at</strong>a from OW 2, OW 3, and OW 4 were only marginally successful, and<br />
they were unsuccessful with d<strong>at</strong>a from OW 1. The shapes of the time-drawdown curves<br />
suggested th<strong>at</strong> the drainage phenomenon associ<strong>at</strong>ed with <strong>w<strong>at</strong>er</strong>-table conditions was of a<br />
different n<strong>at</strong>ure during this test than during the August 1993 test. It is possible th<strong>at</strong> the<br />
unusual n<strong>at</strong>ure of the curves was caused by river effects. Th<strong>at</strong> is, the river may have<br />
superposed an influence on the ground-<strong>w<strong>at</strong>er</strong> levels <strong>at</strong> a time when slow gravity drainage<br />
would normally be taking place, resulting in a distorted time-drawdown curve.<br />
The intractable n<strong>at</strong>ure of the <strong>w<strong>at</strong>er</strong>-level d<strong>at</strong>a from the November 1992 test<br />
demonstr<strong>at</strong>ed the apparent hydraulic connection between the aquifer and the Wabash<br />
River and the need to correct for the effects of potentially large river fluctu<strong>at</strong>ions. To<br />
th<strong>at</strong> end, a pressure transmitter and d<strong>at</strong>a logger were installed December 22, 1992, on<br />
OW 2 and left through the winter to monitor ground-<strong>w<strong>at</strong>er</strong> levels. D<strong>at</strong>a-logger b<strong>at</strong>tery<br />
power limit<strong>at</strong>ions and a prior commitment of equipment precluded the long-term<br />
monitoring of additional wells.<br />
Vandalism to the equipment occurred on March 30, 1993, so the period of useable<br />
d<strong>at</strong>a was between December 22, 1992, and March 29, 1993. Hourly Wabash River stage<br />
d<strong>at</strong>a were obtained from the USGS, Indianapolis, Indiana. Hydrographs of the <strong>w<strong>at</strong>er</strong><br />
levels in OW 2 and the Wabash River are shown in figure 5, and the difference in stage<br />
between OW 2 and the Wabash River is shown in figure 6. Linear regression was<br />
performed on the rel<strong>at</strong>ionship between ground-<strong>w<strong>at</strong>er</strong>-level elev<strong>at</strong>ions from OW 2 and<br />
river stage elev<strong>at</strong>ions. The analysis indic<strong>at</strong>ed th<strong>at</strong> a high degree of correl<strong>at</strong>ion<br />
(correl<strong>at</strong>ion coefficient = 0.98846) existed between the two variables. The linear<br />
rel<strong>at</strong>ionship was determined to be<br />
GW = 8.54324 + 0.97889R,<br />
where GW is ground-<strong>w<strong>at</strong>er</strong>-level elev<strong>at</strong>ion, in feet, and R is river stage elev<strong>at</strong>ion, in feet.<br />
Preliminary Model Analysis<br />
While the d<strong>at</strong>a from the November 1992 test indic<strong>at</strong>ed an apparent hydraulic<br />
connection between the Wabash River and the aquifer, a preliminary assessment of<br />
aquifer conditions was made, using a model aquifer th<strong>at</strong> did not include such a<br />
connection. The r<strong>at</strong>ionale for hypothesizing such a model was to test the potential for<br />
19
Figure 5. Hydrograph of <strong>w<strong>at</strong>er</strong> levels in Observ<strong>at</strong>ion Well 2<br />
and the Wabash River, Winter 1992-93<br />
20
Figure 6. Stage difference between Observ<strong>at</strong>ion Well 2<br />
and the Wabash River, Winter 1992-93<br />
21
ground-<strong>w<strong>at</strong>er</strong> development without reliance on induced infiltr<strong>at</strong>ion from the river, thereby<br />
assessing how critical the river would be to the project.<br />
The results of the 24-hour test were used, along with projected aquifer thickness<br />
values under extreme low-flow conditions, to calcul<strong>at</strong>e an average transmissivity of<br />
231,000 gpd/ft. A <strong>w<strong>at</strong>er</strong>-table storage coefficient of 0.1 was initially assumed, along<br />
with a total pumping r<strong>at</strong>e of 2,100 gpm. The model aquifer was in the shape of a 90°<br />
wedge, th<strong>at</strong> is, an aquifer bounded only on two adjacent (north and west) sides. The<br />
initial calcul<strong>at</strong>ions of pumpage effects assumed the well field to be equidistant from the<br />
boundaries <strong>at</strong> a distance of 1,000 feet. Available drawdown was determined by allowing<br />
de<strong>w<strong>at</strong>er</strong>ing of up to 50 percent of the s<strong>at</strong>ur<strong>at</strong>ed thickness (42 feet) under low-flow<br />
conditions.<br />
Image wells associ<strong>at</strong>ed with the assumed boundaries were determined by use of<br />
image-well theory for multiple-boundary aquifers (Knowles, 1955). Interference effects<br />
from the image wells were calcul<strong>at</strong>ed by scaling off image well distances from a plot and<br />
finding the corresponding drawdowns on a theoretical distance-drawdown curve<br />
constructed for the given aquifer properties and pumping r<strong>at</strong>e. Interference between<br />
wells in the well field was calcul<strong>at</strong>ed for a well spacing of 500 feet.<br />
Initial results indic<strong>at</strong>ed th<strong>at</strong>, under the above assumptions, approxim<strong>at</strong>ely 1.95<br />
mgd could be developed <strong>at</strong> the site. The model was then slightly modified so th<strong>at</strong> the<br />
storage coefficient was increased to 0.15. The results were an increase in aquifer yield to<br />
nearly 2.2 mgd. Finally, the first model was again used, but with a distance to the<br />
boundaries of 750 feet. The results of this model indic<strong>at</strong>ed a yield of just over 1.8 mgd.<br />
Preliminary modeling efforts thus suggested th<strong>at</strong> approxim<strong>at</strong>ely two-thirds of the desired<br />
3 mgd yield might be feasible from the aquifer, even if the hydraulic connection of the<br />
aquifer with the Wabash River was insignificant.<br />
Second Long-Term Aquifer Test (June-July 1993)<br />
A second long-term aquifer test was conducted for seven days, beginning <strong>at</strong> 11:30<br />
a.m., June 28, and ending <strong>at</strong> 11:20 a.m., July 7, 1993. Pumping r<strong>at</strong>es varied from 887<br />
gpm to 902 gpm and averaged 895 gpm. W<strong>at</strong>er levels were again monitored in Test<br />
Well 2 and in all four observ<strong>at</strong>ion wells.<br />
Approxim<strong>at</strong>ely 12 hours into the test, ground-<strong>w<strong>at</strong>er</strong> levels, which had been<br />
declining in response to pumping, leveled off briefly and then began to rise, despite the<br />
continued pumping. As in the first long-term test, a rise in the Wabash River occurred<br />
and caused ground-<strong>w<strong>at</strong>er</strong> levels in the aquifer to rise as well. This phenomenon<br />
continued for the remainder of the test so th<strong>at</strong>, by the end of the pumping period, <strong>w<strong>at</strong>er</strong><br />
levels had risen about 6 feet in both the pumped well and OW 1 and from 4 to 5½ feet in<br />
the remaining observ<strong>at</strong>ion wells. Once again, the time-drawdown d<strong>at</strong>a were totally<br />
overwhelmed by the river-induced changes. Adjustments were made in the d<strong>at</strong>a <strong>at</strong> each<br />
well by using the rel<strong>at</strong>ionship between river stages and <strong>w<strong>at</strong>er</strong> levels in OW 2 (described<br />
22
earlier) to substract out the rise in <strong>w<strong>at</strong>er</strong> levels caused by the river. Time-drawdown d<strong>at</strong>a<br />
<strong>at</strong> the pumped well were also corrected for aquifer de<strong>w<strong>at</strong>er</strong>ing.<br />
Initially, even with the adjustments to the d<strong>at</strong>a, time-drawdown graphs could not<br />
be analyzed with any degree of confidence. However, as noted in the discussion of the<br />
24-hour test, insights gained l<strong>at</strong>er in the analysis of the August 1993 test facilit<strong>at</strong>ed<br />
reanalysis of the corrected d<strong>at</strong>a. The results from the reanalysis are presented in table 2.<br />
Allowing for differences in s<strong>at</strong>ur<strong>at</strong>ed thickness between tests, the aquifer properties<br />
derived in this manner were quite consistent with those determined from the 24-hour test<br />
conducted in October 1992. Transmissivity values ranged from about 250,200 gpd/ft to<br />
293,000 gpd/ft and averaged about 273,000 gpd/ft, while storage coefficients were<br />
between 0.006 and 0.09 and averaged 0.04. Hydraulic conductivity values ranged<br />
between 5,100 gpd/ft 2 and 5,800 gpd/ft 2 and averaged about 5,300 gpd/ft 2 .<br />
Table 2. Results of aquifer test, June-July 1993<br />
Straieht-line method<br />
Type-curve method<br />
T K T K<br />
Well (gpd/ft) (gpd/fi 2 ) s (gpd/ft) (gpd/ft 2 ) S<br />
TW 2 274,700 5,200 - - - -<br />
OW 1 281,300 5,400 0.007 281,000 5,400 0.006<br />
OW 2 251,400 5,100 0.03 250,200 5,100 0.056<br />
OW 3 - - - 266,900 5,800 0.09<br />
OW 4 291,700 5,200 0.027 293,000 . 5,200 0.03<br />
TW = Test Well<br />
T = transmissivity<br />
K = hydraulic conductivity<br />
S = storage coefficient<br />
Because both of the long-term aquifer tests were severely impacted by large rises<br />
in the Wabash River, it was decided to <strong>at</strong>tempt a third test when the river would be in a<br />
more stable condition or <strong>at</strong> least in a receding condition. The r<strong>at</strong>ionale for conducting<br />
the third test was twofold. First, rising <strong>w<strong>at</strong>er</strong> levels had caused distortions in the gravity<br />
drainage portion of the <strong>w<strong>at</strong>er</strong>-table drawdowns <strong>at</strong> the observ<strong>at</strong>ion wells and had<br />
compromised the accuracy of determining the <strong>w<strong>at</strong>er</strong> table storage coefficient. In addition,<br />
the l<strong>at</strong>e portion of the <strong>w<strong>at</strong>er</strong>-level d<strong>at</strong>a collected during the first two tests suggested th<strong>at</strong><br />
boundary effects from both river and aquifer boundaries were beginning to occur. The<br />
rising <strong>w<strong>at</strong>er</strong> levels had, of course, also interfered with the ability to assess the effective<br />
distances to these boundaries.<br />
At the completion of the June-July test, the pressure transmitters were left in place<br />
in all of the wells and left connected to the d<strong>at</strong>a logger, in order to collect nonpumping<br />
<strong>w<strong>at</strong>er</strong> levels in all the wells for an extended period. W<strong>at</strong>er levels were monitored<br />
between 1:24 p.m. on July 7 and 10:54 p.m. on July 18, <strong>at</strong> which time logging ceased in<br />
all wells due to an electrical malfunction believed to be caused by a close-proximity<br />
23
lightning strike. Useable d<strong>at</strong>a, however, were retrieved from the d<strong>at</strong>a logger covering a<br />
period of 273 hours. Linear regression was performed on river stages and <strong>w<strong>at</strong>er</strong> levels <strong>at</strong><br />
each well. The results are summarized below, where R is river-stage elev<strong>at</strong>ion, in feet,<br />
and PW and OW 1-4 are <strong>w<strong>at</strong>er</strong>-level elev<strong>at</strong>ions, in feet, in the various wells.<br />
Pumped Well<br />
Regression equ<strong>at</strong>ion: PW = 118.231 + 0.70339R<br />
Correl<strong>at</strong>ion coefficient: 0.93573<br />
Observ<strong>at</strong>ion Well 1<br />
Regression equ<strong>at</strong>ion: OW 1 = 122.944 + 0.73079R<br />
Correl<strong>at</strong>ion coefficient: 0.94539<br />
Observ<strong>at</strong>ion Well 2<br />
Regression equ<strong>at</strong>ion: OW2 = 138.145 + 0.69495R<br />
Correl<strong>at</strong>ion coefficient: 0.93068<br />
Observ<strong>at</strong>ion Well 3<br />
Regression equ<strong>at</strong>ion: OW 3 = 168.614 + 0.62246R<br />
Correl<strong>at</strong>ion coefficient: 0.92504<br />
Observ<strong>at</strong>ion Well 4<br />
Regression equ<strong>at</strong>ion: OW 4 = 189.560 + .53292R<br />
Correl<strong>at</strong>ion coefficient: 0.77380<br />
Third Long-Term Aquifer Test (August 1993)<br />
The third long-term aquifer test commenced <strong>at</strong> 1:55 p.m. on August 24, 1993, and<br />
concluded <strong>at</strong> 6:31 p.m. on September 2, a pumping period of 9 days, 4½ hours (13,236<br />
minutes). Pumping r<strong>at</strong>es were maintained between 887 gpm and 904 gpm during the test<br />
and averaged 899 gpm. The Wabash River was in a recession period and fell<br />
approxim<strong>at</strong>ely 6 feet for the first 11,176 minutes of the test, then rose only 0.1 foot for<br />
the remainder of the test.<br />
W<strong>at</strong>er levels in each well were adjusted for falling river stages, and the calcul<strong>at</strong>ed<br />
drawdowns in the pumped well were further corrected for <strong>w<strong>at</strong>er</strong>-table de<strong>w<strong>at</strong>er</strong>ing.<br />
Graphical analysis was performed on each d<strong>at</strong>a set to verify the aquifer hydraulic<br />
properties th<strong>at</strong> had been estim<strong>at</strong>ed in the earlier tests and to determine the effective<br />
distances to the barrier and river boundaries associ<strong>at</strong>ed with the aquifer. An example of<br />
the graphical analysis for OW 2 is shown in figure 7. Based on the results of the<br />
analysis, given in table 3, d<strong>at</strong>a from the earlier tests were reexamined, as described<br />
above, and revised values of hydraulic properties were derived.<br />
Transmissivity values ranged from about 249,800 gpd/ft <strong>at</strong> Test Well 2 to about<br />
286,200 gpd/ft <strong>at</strong> OW 4 and averaged about 263,000 gpd/ft. Hydraulic conductivity<br />
values had a range of 4,542 gpd/ft 2 to 5,367 gpd/ft 2 and averaged about 4,955 gpd/ft 2 .<br />
24
Figure 7. Type-curve analysis of Observ<strong>at</strong>ion Well 2 adjusted d<strong>at</strong>a
Storage coefficients ranged between 0.035 and 0.107, averaging 0.076, which is closer to<br />
the lower end of typical <strong>w<strong>at</strong>er</strong>-table values.<br />
Table 3. Results of aquifer test, August-September 1993<br />
Straisht-line method Tvpe-curve method<br />
T K T K<br />
Well (gpd/ft) (gpd/ft 2 ) S (gpd/ft) (gpd/ft 2 ) S<br />
TW2 249,800 4,542 .<br />
OW 1 269,700 4,994 - 271,000 5,018 0.107<br />
OW 2 - - - 251,300 4,927 0.065<br />
OW 3 - - - 257,600 5,367 0.096<br />
OW 4 - - - 286,200 4,934 0.035<br />
TW = Test Well<br />
T = transmissivity<br />
K = hydraulic conductivity<br />
S = storage coefficient t<br />
Estim<strong>at</strong>ion of the distances to effective hydraulic boundaries associ<strong>at</strong>ed with both<br />
the river and the aquifer was hampered by the time it took gravity drainage to dissip<strong>at</strong>e in<br />
the aquifer. Nevertheless, with the help of image well theory, reasonable estim<strong>at</strong>es were<br />
achieved th<strong>at</strong> appeared to be consistent with the physical conditions. Distances from Test<br />
Well 2 to the effective river boundary ranged from about 320 feet to over 600 feet and<br />
averaged about 400 feet. Unlike barrier boundaries, which are rel<strong>at</strong>ed to the areal extent<br />
of an aquifer and are fixed, a river boundary is rel<strong>at</strong>ed to the degree of hydraulic<br />
connection between the river and the aquifer <strong>at</strong> the time of measurement. Since it is<br />
dependent upon river bottom m<strong>at</strong>erial, suspended sediment, and scouring, this connection<br />
is dynamic as is, therefore, the effective distance to a river boundary. Various d<strong>at</strong>a sets<br />
suggested th<strong>at</strong> the barrier boundaries were between about 2,400 feet and 4,200 feet from<br />
Test Well 2, averaging about 2,600 feet. By way of comparison, preliminary estim<strong>at</strong>es<br />
of aquifer yield, performed after the November 1992 test, had considered inform<strong>at</strong>ion<br />
from various test borings in the area as well as the physical layout of the river valley in<br />
rel<strong>at</strong>ion to the well site. Based on th<strong>at</strong> inform<strong>at</strong>ion, two barrier boundaries had been<br />
assumed <strong>at</strong> approxim<strong>at</strong>e right angles and <strong>at</strong> distances of 1,000 feet from Test Well 2.<br />
The results of the third aquifer test suggest th<strong>at</strong> the barrier boundary distances assumed<br />
earlier had been conserv<strong>at</strong>ive.<br />
CONCLUSIONS<br />
Model Aquifer<br />
In order to estim<strong>at</strong>e the effects of a proposed 2,100-gpm (3-mgd) well field <strong>at</strong> the<br />
field site, a conceptual flow-model of the aquifer was hypothesized. The model included<br />
an aquifer under <strong>w<strong>at</strong>er</strong>-table conditions, bounded on two sides by barrier boundaries, on<br />
26
the third side by a river (recharge) boundary, and extending indefinitely in the fourth<br />
direction. An idealized m<strong>at</strong>hem<strong>at</strong>ical model of the aquifer was then formul<strong>at</strong>ed to allow<br />
the applic<strong>at</strong>ion of appropri<strong>at</strong>e ground-<strong>w<strong>at</strong>er</strong> formulas. The model was designed to take<br />
into account worst-case conditions for the aquifer, th<strong>at</strong> is, low-flow conditions in the<br />
Wabash River. Low-flow conditions would affect the aquifer in two ways: by reducing<br />
the s<strong>at</strong>ur<strong>at</strong>ed thickness (and, therefore, transmissivity) of the aquifer and by reducing the<br />
hydraulic connection between the river and the aquifer and increasing the effective<br />
distance to the river recharge boundary.<br />
The hydraulic connection between the aquifer and the river established during the<br />
third long-term aquifer test (August 1993) and the excellent correl<strong>at</strong>ion between ground<strong>w<strong>at</strong>er</strong><br />
levels and river stages established during the winter of 1992-1993 (see figure 5)<br />
enabled an estim<strong>at</strong>ion of the probable reduction in s<strong>at</strong>ur<strong>at</strong>ed thickness of the aquifer<br />
during worst-case (drought) conditions. For the purpose of establishing a worst-case<br />
elev<strong>at</strong>ion of the ground-<strong>w<strong>at</strong>er</strong> level, it was assumed th<strong>at</strong> the elev<strong>at</strong>ion would approxim<strong>at</strong>e<br />
the Wabash River stage. Cursory examin<strong>at</strong>ion of available d<strong>at</strong>a (Scott Morlock, telefax<br />
communic<strong>at</strong>ion, November 19, 1992; H. Vernon Knapp, personal communic<strong>at</strong>ion,<br />
February, 1994) indic<strong>at</strong>ed th<strong>at</strong> a river stage of about 2 feet, or near an elev<strong>at</strong>ion of 371.5<br />
feet NGVD (N<strong>at</strong>ional Geodetic Vertical D<strong>at</strong>um), usually approxim<strong>at</strong>ed the river stage<br />
during drought periods and surely occurred less frequently than once every 5 years. This<br />
elev<strong>at</strong>ion was then used to estim<strong>at</strong>e a s<strong>at</strong>ur<strong>at</strong>ed thickness for the sand and gravel aquifer<br />
during worst-case conditions.<br />
For the above conditions, the model aquifer consisted of the following elements:<br />
1) The average hydraulic conductivity from the test (4,955 gpd/ft 2 ) was multiplied by an<br />
estim<strong>at</strong>ed average thickness for the aquifer under low-flow conditions (42 feet) to<br />
determine transmissivity, giving a value of about 208,000 gpd/ft. 2) The long-term<br />
<strong>w<strong>at</strong>er</strong>-table storage coefficient was assumed to be 0.1. 3) Barrier boundaries in a rightangle<br />
configur<strong>at</strong>ion and <strong>at</strong> distances of 1,000 feet were maintained, so as both to be<br />
conserv<strong>at</strong>ive and to allow comparison with the preliminary calcul<strong>at</strong>ions made after the<br />
November 1992 test. 4) The effective distance to the river boundary was doubled to 800<br />
feet for the anticip<strong>at</strong>ed drought condition, putting th<strong>at</strong> boundary <strong>at</strong> approxim<strong>at</strong>ely the<br />
opposite bank of the river.<br />
Using the hydraulic properties of the model aquifer, a theoretical distancedrawdown<br />
graph was constructed for a pumping r<strong>at</strong>e of 2,100 gpm and a pumping period<br />
of 180 days. Th<strong>at</strong> length of time was assumed, in order to take into account the longest<br />
likely period during which precipit<strong>at</strong>ion recharge would be insignificant (worst-case<br />
conditions). Barrier and river boundaries were scaled off on a map, and appropri<strong>at</strong>e<br />
image wells were loc<strong>at</strong>ed, using image-well theory for multiple-boundary systems<br />
(Knowles, 1955). The distance to each image well was measured, and the corresponding<br />
amount of interference was determined from the distance-drawdown graph. The total<br />
drawdown interference effect of all image wells on the planned production wells was then<br />
determined by summ<strong>at</strong>ion.<br />
27
Drawdowns <strong>at</strong> individual production wells in a well field were determined by<br />
summing the effects of pumping from each well, mutual interference between wells,<br />
image wells, and de<strong>w<strong>at</strong>er</strong>ing. Individual well drawdowns were calcul<strong>at</strong>ed with the Theis<br />
formula <strong>at</strong> various pumping r<strong>at</strong>es, while interference effects were calul<strong>at</strong>ed for wells in a<br />
line <strong>at</strong> various spacings from one another. Allowance was made for de<strong>w<strong>at</strong>er</strong>ing up to 50<br />
percent of the s<strong>at</strong>ur<strong>at</strong>ed thickness of the aquifer by adjusting drawdowns for the decrease<br />
in transmissivity.<br />
Well Field Yield<br />
Based on the assumptions incorpor<strong>at</strong>ed into the conceptual flow system, the<br />
idealized m<strong>at</strong>hem<strong>at</strong>ical model, and the calcul<strong>at</strong>ions of drawdown and interference effects,<br />
it appears th<strong>at</strong> the desired 3-mgd supply is feasible from a well field in the vicinity of<br />
Test Well 2 and the earlier test borings. The well field would consist of four wells,<br />
spaced <strong>at</strong> approxim<strong>at</strong>ely 400 feet, along with a standby well. Pumpage <strong>at</strong> each well<br />
would be about 525 gpm.<br />
RECOMMENDATIONS FOR PRODUCTION WELL DESIGN<br />
The results of the analysis of the aquifer test d<strong>at</strong>a collected during the August-<br />
September 1993 period were reported in a letter d<strong>at</strong>ed October 23, 1993 (see Appendix<br />
H). Subsequent to this letter, questions had arisen regarding an appropri<strong>at</strong>e well design<br />
for the production wells in the recommended well field. It was suggested th<strong>at</strong> a test<br />
boring be made <strong>at</strong> each proposed well loc<strong>at</strong>ion to ensure the presence of sufficient aquifer<br />
m<strong>at</strong>erial <strong>at</strong> each site and to collect samples of the aquifer m<strong>at</strong>erial for sieve analysis.<br />
Results of the sieve analysis and the driller's log of the m<strong>at</strong>erials penetr<strong>at</strong>ed would<br />
facilit<strong>at</strong>e the design of the production wells.<br />
The city contracted with Speth Plumbing, Inc., for these test borings, which were<br />
accomplished on November 5 and 8, 1993. The samples were sieved by the consultant,<br />
Lamac Engineering Company, Inc., and the driller's logs and sieving results furnished to<br />
the W<strong>at</strong>er Survey. The logs of the test borings show the bedrock surface <strong>at</strong> depths of 60<br />
to 64 feet and <strong>at</strong> an elev<strong>at</strong>ion comparable to th<strong>at</strong> <strong>at</strong> the site of Test Well 2. The sand and<br />
gravel aquifer is about 40 feet in thickness below about 18 to 20 feet of brown clay.<br />
The design of the well field allowed for extreme drought conditions and ground-<strong>w<strong>at</strong>er</strong><br />
levels <strong>at</strong> elev<strong>at</strong>ions much lower than experienced during the aquifer tests. Probable well<br />
screen lengths of about 20 feet were assumed in the well-field-yield analysis.<br />
The sieve d<strong>at</strong>a showed th<strong>at</strong> the sand and gravel aquifer has a coarse to very coarse<br />
texture. According to W<strong>at</strong>er Survey well-design criteria (Smith, 1954), production wells<br />
<strong>at</strong> two of the sites could be of tubular construction. However, the other two sites do<br />
require a gravel-packed well for maximum yield and long service life. To facilit<strong>at</strong>e<br />
specific<strong>at</strong>ions and efficient field construction processes it is recommended th<strong>at</strong> all<br />
production wells be of gravel-packed construction. The reverse-rotary drilling method is<br />
28
also recommended to facilit<strong>at</strong>e well-development processes and promote hydraulically<br />
efficient production wells.<br />
For the production well <strong>at</strong> the site of test boring 1 (proposed Production Well 2)<br />
W<strong>at</strong>er Survey well-design criteria indic<strong>at</strong>e th<strong>at</strong> the ideal gravel pack would be about 1.8<br />
millimeters (mm) to 3.0 mm in grain size. If m<strong>at</strong>erial from Northern Gravel Company,<br />
Musc<strong>at</strong>ine, Iowa, is used, their No. 2 well-pack m<strong>at</strong>erial, which is about 1.7 to 3.0 mm,<br />
would be s<strong>at</strong>isfactory. A continuous-slot well screen with 0.080-inch slots (80 slot) can<br />
be used with this No. 2 gravel-pack m<strong>at</strong>erial. Based on the driller's log of this test<br />
boring, the well screen would be placed between depths of 44 and 64 feet.<br />
For the production well <strong>at</strong> the site of test boring 2 (proposed Production Well 3)<br />
W<strong>at</strong>er Survey well-design criteria indic<strong>at</strong>e th<strong>at</strong> the ideal gravel pack would be about 2.6<br />
mm to 4.2 mm in grain size. If m<strong>at</strong>erial from Northern Gravel Company is used, their<br />
No. 3 well-pack m<strong>at</strong>erial, which is about 2.2 to 4.2 mm, would be s<strong>at</strong>isfactory. A<br />
continuous-slot well screen with 0.100-inch slots (100 slot) can be used with this No. 3<br />
gravel-pack m<strong>at</strong>erial. Based on the driller's log of this test boring, the well screen would<br />
be placed between depths of 43.5 and 63.5 feet.<br />
For the production wells <strong>at</strong> the sites of test borings 3 and 4 (proposed Production<br />
Wells 4 and 5), W<strong>at</strong>er Survey well-design criteria indic<strong>at</strong>e th<strong>at</strong> the ideal gravel pack<br />
would be about 6.6 mm to 11.5 mm in grain size. If m<strong>at</strong>erial from Northern Gravel<br />
Company is used, their 1/4 × 1/8-inch well-pack m<strong>at</strong>erial, which is about 3.4 to 6.3 mm,<br />
would be s<strong>at</strong>isfactory. A continuous-slot well screen with 0.150-inch slots (150 slot) can<br />
be used with this 1/4 × 1/8-inch gravel-pack m<strong>at</strong>erial. Based on the driller's log of these<br />
test borings, the well screen would be placed between depths of 40 and 60 feet.<br />
For the design production r<strong>at</strong>e of 500 gpm, the well screen in each production<br />
well can be 12 inches in diameter and 20 feet long. The minimum bore-hole diameter for<br />
this well screen is 24 inches. Well pump intakes should be set no lower than the top of<br />
the well screen in each production well.<br />
29
SELECTED REFERENCES<br />
Cooper, H.H., Jr., and C.E. Jacob. 1946. A generalized graphical method for<br />
evalu<strong>at</strong>ing form<strong>at</strong>ion constants and summarizing well field history. Transactions,<br />
American Geophysical Union, v. 27(4).<br />
Jacob, C.E. 1944. Notes on determining permeability by pumping tests under <strong>w<strong>at</strong>er</strong>table<br />
conditions. U.S. Geological Survey. Mimeo.<br />
Jacob, C.E. 1947. Drawdown tests to determine effective radius of artesian well.<br />
Transactions, American Society of Civil Engineers, v. 72.<br />
Knowles, D.B. 1955. <strong>Ground</strong>-<strong>w<strong>at</strong>er</strong> hydraulics. U.S. Geological Survey <strong>Ground</strong> W<strong>at</strong>er<br />
Notes, Hydraulics, No. 28, open-file report.<br />
Rorabaugh, M.I. 1953. Graphical and theoretical analysis of step-drawdown test of<br />
artesian wells. Proceedings, American Society of Civil Engineers, v. 79(362).<br />
Smith, H.F. 1954. Gravel packing <strong>w<strong>at</strong>er</strong> wells. <strong>Illinois</strong> St<strong>at</strong>e W<strong>at</strong>er Survey<br />
Circular 44.<br />
Theis, C.V. 1935. The rel<strong>at</strong>ion between the lowering of piezometric surface and the<br />
r<strong>at</strong>e and dur<strong>at</strong>ion of discharge of a well using ground-<strong>w<strong>at</strong>er</strong> storage.<br />
Transactions, American Geophysical Union, 16th Annual Meeting, pt. 2.<br />
Walton, W.C. 1962. Selected analytical methods for well and aquifer evalu<strong>at</strong>ion.<br />
<strong>Illinois</strong> St<strong>at</strong>e W<strong>at</strong>er Survey Bulletin 49.<br />
30
Appendix A.<br />
Pumped Test Well and Observ<strong>at</strong>ion Well Inform<strong>at</strong>ion
Appendix A. Pumped Test Well and Observ<strong>at</strong>ion Well Inform<strong>at</strong>ion<br />
PRODUCTION TEST WELL 2<br />
CITY OF MOUNT CARMEL<br />
WABASH COUNTY, <strong>IL</strong>LINOIS<br />
Well Owner:<br />
City of <strong>Mount</strong> <strong>Carmel</strong>, <strong>Illinois</strong><br />
Consulting Engineers:<br />
Lamac Engineering, Inc.<br />
Well Loc<strong>at</strong>ion:<br />
Approx. 4200 ft. E and 625 ft. S of NW/c,<br />
Section 32, T1S, R12W, Wabash County<br />
D<strong>at</strong>e Well Completed: October 13, 1992<br />
D<strong>at</strong>e of Production Test:<br />
October 1992, June-July 1993, August-<br />
September 1993<br />
No. of Observ<strong>at</strong>ion Wells:<br />
Four<br />
Aquifer:<br />
Sand and gravel<br />
PUMPED WELL DATA<br />
Well No.: Test Well 2<br />
Depth:<br />
68 feet<br />
Drilling Contractor:<br />
Speth Plumbing, Inc., Allendale<br />
Drill Cuttings:<br />
to ISGS<br />
Drilling Method:<br />
Bucket rig<br />
Hole Record:<br />
36-in., 0-68 ft.<br />
Casing Record:<br />
16-in. black steel, +1.2-28 ft.<br />
Screen Record:<br />
16-in. 50 slot Cook carbon steel, 28-68 ft.<br />
Annulus and<br />
Gravel Pack Record: "Grit" (Vincennes, IN), 20-68 ft., Benseal, 10-<br />
20 ft.<br />
<strong>Ground</strong> Elev<strong>at</strong>ion <strong>at</strong> Well:<br />
393.20 ft. msl<br />
Measuring Point:<br />
Top edge of casing, 394.41 ft. msl<br />
Measuring Equipment:<br />
SWS 8-in. orifice tube, McDAS and Omnid<strong>at</strong>a<br />
loggers with pressure transmitters, steel tape,<br />
electric dropline<br />
Test Pump and Power:<br />
Test submersible<br />
Test Pump Setting:<br />
40 ft.<br />
DR<strong>IL</strong>LER'S LOG<br />
Form<strong>at</strong>ion From To<br />
Sandy clay, topsoil 0 10 ft.<br />
Brown quicksand 10 12<br />
Brown clay, mud 12 14<br />
Coarse sand and gravel mix 14 68<br />
Blue mud 68 69<br />
33
Appendix A. (Continued)<br />
OBSERVATION WELL DATA<br />
Observ<strong>at</strong>ion Well No.: 1<br />
Depth:<br />
69 ft.<br />
D<strong>at</strong>e Drilled: October 7, 1992<br />
Hole Record:<br />
Casing Record:<br />
6-in. PVC, +1.8-39 ft.<br />
Screen Record:<br />
6-in. PVC, 15 slot, 39-69 ft.<br />
<strong>Ground</strong> Elev<strong>at</strong>ion:<br />
394.60 ft. msl<br />
Measuring Point:<br />
TOC, 396.44 ft. msl<br />
Distance and Direction<br />
from Pumped Well:<br />
80 ft. NNE, approx. 4250 ft. E and 560 ft. S of NW/c,<br />
Section 32<br />
DR<strong>IL</strong>LER'S LOG<br />
Form<strong>at</strong>ion From To<br />
Sandy clay, topsoil 0 10<br />
Brown quicksand 10 12<br />
Brown clay, mud 12 16<br />
Coarse sand and gravel mix 16 69<br />
Blue mud 69 69 ½<br />
34
Appendix A. (Continued)<br />
OBSERVATION WELL DATA<br />
Observ<strong>at</strong>ion Well No.: 2<br />
Depth:<br />
67 ft.<br />
D<strong>at</strong>e Drilled: October 7, 1992<br />
Hole Record:<br />
Casing Record:<br />
2-in. PVC, +1.8-37 ft.<br />
Screen Record:<br />
2-in. PVC, 10 slot, 37-67 ft.<br />
<strong>Ground</strong> Elev<strong>at</strong>ion:<br />
395.90 ft. msl<br />
Measuring Point:<br />
TOC, 397.74 ft. msl<br />
Distance and Direction<br />
from Pumped Well:<br />
147 ft. NNE, approx. 4290 ft. E and 505 ft. S of NW/c,<br />
Section 32<br />
DR<strong>IL</strong>LER'S LOG<br />
Form<strong>at</strong>ion From To<br />
Sandy clay, topsoil 0 10<br />
Brown quicksand 10 12<br />
Brown clay, mud 12 17<br />
Coarse sand and gravel mix 17 67<br />
Blue mud 67 67 ½<br />
35
Appendix A. (Continued)<br />
OBSERVATION WELL DATA<br />
Observ<strong>at</strong>ion Well No.: 3<br />
Depth:<br />
63 ½ ft.<br />
D<strong>at</strong>e Drilled: October 8, 1992<br />
Hole Record:<br />
Casing Record:<br />
2-in. PVC +1.8-33½ ft.<br />
Screen Record:<br />
2-in. PVC, 10 slot, 33½-63½ ft.<br />
<strong>Ground</strong> Elev<strong>at</strong>ion:<br />
395.50 ft. msl<br />
Measuring Point:<br />
TOC, 397.31 ft. msl<br />
Distance and Direction<br />
from Pumped Well:<br />
247 ft. NNE, approx. 4350 ft. E and 425 ft. S of NW/c,<br />
Section 32<br />
DR<strong>IL</strong>LER'S LOG<br />
Form<strong>at</strong>ion From To<br />
Sandy clay, topsoil 0 11<br />
Brown quicksand 11 13<br />
Brown clay, mud 13 17<br />
Coarse sand and gravel mix 17 63<br />
Blue mud 63 63½<br />
36
Appendix A. (Concluded)<br />
OBSERVATION WELL DATA<br />
Observ<strong>at</strong>ion Well No.: 4<br />
Depth:<br />
68 ft.<br />
D<strong>at</strong>e Drilled: November, 1992<br />
Hole Record:<br />
Casing Record:<br />
2-in. PVC, +2.9-38 ft.<br />
Screen Record:<br />
2-in. PVC, 10 slot, 38-68 ft.<br />
<strong>Ground</strong> Elev<strong>at</strong>ion:<br />
389.50 ft. msl<br />
Measuring Point:<br />
TOC, 392.36 ft. msl<br />
Distance and Direction<br />
from Pumped Well:<br />
120 ft. WNW, approx. 4120 ft. E and 565 ft. S of NW/c,<br />
Section 32<br />
DR<strong>IL</strong>LER'S LOG<br />
Form<strong>at</strong>ion From To<br />
Dark topsoil 0 9<br />
Brown sand 9 17<br />
Coarse sand and fine gravel 17 26<br />
Coarse sand and gravel mix 26 68<br />
Shale 68 69<br />
37
Appendix B.<br />
Step Test: W<strong>at</strong>er-Level Measurements
<strong>Ground</strong>—W<strong>at</strong>er Investig<strong>at</strong>ion <strong>at</strong> <strong>Mount</strong> <strong>Carmel</strong><br />
Step Test—Test Well 2<br />
October 20,1992<br />
Elapsed Depth Piez Pumping<br />
Hour time to <strong>w<strong>at</strong>er</strong> head r<strong>at</strong>e<br />
(min) (ft) (ft) (gpm) Remarks<br />
10/20/92<br />
08:31 AM 0.0 1936 McDAS started<br />
1.1 19.35 W<strong>at</strong>er level trend<br />
2.1 1935 Transmitter 16 in TW 2<br />
3.1 1935<br />
4.1 19.34 Measured depth<br />
5.0 1934 to <strong>w<strong>at</strong>er</strong><br />
6.0 19.34<br />
7.0 19.34<br />
8.0 19.34<br />
9.0 19.34<br />
08:41 AM 10.0 1934<br />
12.0 19.34<br />
14.0 1933<br />
16.0 1933<br />
18.0 1934<br />
08:51 AM 20.0 1933<br />
22.0 19.34<br />
24.0 1934<br />
26.0 19.33<br />
28.1 1933<br />
09:01 AM 30.0 19.32<br />
32.0 19.32<br />
34.0 19.31<br />
36.0 19.30<br />
38.0 19.30<br />
09:11 AM 40.0 19.30<br />
42.0 19.30<br />
44.0 19.30<br />
46.0 1929<br />
48.0 1928<br />
09:21 AM 50.0 19.27<br />
52.0 19.27<br />
54.0 1926<br />
56.0 19.25<br />
58.0 19.23<br />
09:31 AM 60.0 1922<br />
62.0 19.22<br />
64.0 1921<br />
66.0 19.21<br />
68.0 19.21<br />
68.6 19.18<br />
09:40 AM 0.0 Pump On<br />
09:41AM 1.0 25.79 Step 1<br />
1.4 25.69 1.% 760<br />
2.0 25.82<br />
3.0 25.% 1.94 758<br />
4.0 26.00<br />
5.0 26.02 1.94 758<br />
6.0 26.09<br />
7.0 26.14 1.92 755<br />
8.1 26.21 1.92 755<br />
09:50 AM 10.1 26.34 1.92 755<br />
12.1 26.43<br />
14.1 26.50 1.92 755<br />
16.1 26.57 1.92 755<br />
18.1 26.60 1.92 755<br />
10:00 AM 20.1 26.63 1.92 755<br />
22.1 26.68<br />
24.1 26.73<br />
25.0 26.74 1.92 755<br />
41
<strong>Ground</strong>-W<strong>at</strong>er Investig<strong>at</strong>ion <strong>at</strong> <strong>Mount</strong> Cannel<br />
Step Test—Test Well 2 (Continued)<br />
October 20,1992<br />
Elapsed Depth Piez Pumping<br />
Hour time to <strong>w<strong>at</strong>er</strong> head r<strong>at</strong>e<br />
(min) (ft) (ft) (gpm) Remarks<br />
26.0 26.76<br />
27.0 26.78 1.92 755<br />
28.0 26.80<br />
29.0 26.81 1.92 755<br />
29.6 26.81<br />
10:10 AM 30.0 increase r<strong>at</strong>e<br />
10:11 AM 1.0 27.15 2.14 798 Step 2<br />
2.0 27.22 2.12 796<br />
3.0 2723<br />
4.0 2725 2.12 796<br />
5.0 2728<br />
52 2730 2.16 800<br />
6.0 2731<br />
8.1 2732 2.12 796<br />
1020 AM 10.1 27.42 2.16 800<br />
12.1 27.45 2.16 800<br />
14.1 27.49 2.16 800<br />
16.1 27.50 2.16 800<br />
18.1 27.53<br />
10:30 AM 20.1 27.56 2.16 800<br />
22.1 27.58<br />
23.9 27.60 2.16 800<br />
25.0 27.62<br />
26.0 27.61<br />
27.0 27.63<br />
28.0 27.63 2.16 800<br />
29.0 27.64 2.16 800<br />
29.6 27.65<br />
30.8 27.67<br />
10:41 AM 31.0 Increase r<strong>at</strong>e<br />
10:42 AM 1.0 28.10 Step 3<br />
2.0 28.11 2.44 850<br />
3.0 28.13<br />
4.0 28.14 2.44 850<br />
5.0 28.15<br />
6.0 28.17 2.44 850<br />
8.1 28.20 2.44 850<br />
10:51AM 10.1 28.21 2.44 850<br />
12.1 28.23 2.44 850<br />
14.1 2825 2.44 850<br />
16.1 2829<br />
18.1 28.30 2.44 850<br />
11:01 AM 20.1 28.30<br />
22.1 2832 2.44 850<br />
24.0 28.32<br />
25.0 28.33<br />
26.0 28.34 2.44 850<br />
27.0 28.34<br />
28.0 28.34 2.44 850<br />
29.0 28.36 2.44 850<br />
29.8 28.38<br />
11:11AM 30.0 Increase r<strong>at</strong>e<br />
11:12 AM 1.0 28.88 2.68 Step 4<br />
2.0 28.90 2.74 900<br />
3.0 28.90<br />
4.0 28.91 2.74 900<br />
5.0 28.92<br />
6.0 28.94 2.74 900<br />
42
<strong>Ground</strong>-W<strong>at</strong>er Investig<strong>at</strong>ion <strong>at</strong> <strong>Mount</strong> <strong>Carmel</strong><br />
Step Test—Test Well 2 (Continued)<br />
October 20,1992<br />
Elapsed Depth Piez Pumping<br />
Hour time to <strong>w<strong>at</strong>er</strong> head r<strong>at</strong>e<br />
(min) (ft) (ft) (gpm) Remarks<br />
8.1 28.96 2.74 900<br />
1121 AM 10.1 28.98<br />
12.1 29.00<br />
14.1 29.01 2.74 900<br />
16.1 29.03<br />
18.1 29.05 2.74 900<br />
1131 AM 20.1 29.11<br />
22.1 29.12 2.74 900<br />
24.1 29.20<br />
25.1 2921<br />
26.0 29.19<br />
27.0 29.19<br />
28.0 2920 2.74 900<br />
29.0 2920 2.74 900<br />
29.8 2923<br />
11:41 AM 30.0 Increase r<strong>at</strong>e<br />
11:42 AM 1.0 29.76 3.06 950 Step 5<br />
2.0 29.79 3.06 950<br />
3.0 29.81<br />
4.0 29.81<br />
5.0 29.83<br />
6.0 29.84 3.06 950<br />
8.1 29.92<br />
11:51 AM 10.1 29.93 3.06 950<br />
12.1 29.94<br />
14.1 29.97 3.06 950<br />
16.1 29.99<br />
18.1 30.01 3.06 950<br />
12:01 PM 20.1 30.01<br />
22.1 30.03 3.06 950<br />
23.9 30.05<br />
25.0 30.06<br />
26.0 30.07 3.06 950<br />
27.0 30.08<br />
28.0 30.08 3.06 950<br />
29.0 30.07 3.06 950<br />
29.6 30.09<br />
12:11 PM 30.0 Increase r<strong>at</strong>e<br />
12:12 PM 1.0 30.68 Step 6<br />
2.0 30.69 3.42 1000<br />
3.0 30.70<br />
4.0 30.71 3.42 1000<br />
5.0 30.73<br />
6.0 30.73 3.42 1000<br />
8.1 30.72<br />
12:21 PM 10.1 30.77 3.42 1000<br />
12.1 30.77<br />
14.1 30.79<br />
16.1 30.79<br />
18.1 30.80 3.42 1000<br />
12:31 PM 20.1 30.83<br />
22.1 30.85 3.42 1000<br />
24.1 30.85 3.40 1000<br />
25.1 30.84<br />
26.0 30.85 3.40 1000<br />
27.0 30.86<br />
28.0 30.87 3.40 1000<br />
29.0 30.87 3.40 1000<br />
29.6 30.87<br />
12:41 PM 30.0 Increase r<strong>at</strong>e<br />
43
<strong>Ground</strong>—W<strong>at</strong>er Investig<strong>at</strong>ion <strong>at</strong> <strong>Mount</strong> <strong>Carmel</strong><br />
Step Test—Test Well 2 (Concluded)<br />
October 20,1992<br />
Elapsed Depth Piez Pumping<br />
Hour time to <strong>w<strong>at</strong>er</strong> head r<strong>at</strong>e<br />
(min) (ft) (ft) (gpm) Remarks<br />
12:42 PM 1.0 31.47 3.78 1050 Step 7<br />
2.0 31.48 3.78 1050<br />
3.0 31.49<br />
4.0 31.51 3.78 1050<br />
5.0 31.53<br />
6.0 31.53 3.78 1050<br />
8.1 31.54 3.78 1050<br />
12:51 PM 10.1 31.56 3.78 1050<br />
12.1 31.58<br />
14.1 31.61 3.78 1050<br />
16.1 31.61<br />
18.1 31.63 3.78 1050<br />
01:01 PM 20.1 31.63<br />
22.1 31.65 3.78 1050<br />
23.9 31.64<br />
25.0 31.68<br />
26.0 31.67 3.78 1050<br />
27.0 31.66<br />
28.0 31.67 3.78 1050<br />
29.0 31.66<br />
01:11 PM 30.0 31.67 3.78 1050 End of Step Test<br />
44
Appendix C.<br />
24-Hour Aquifer Test: W<strong>at</strong>er-Level Measurements<br />
(October 1992)
<strong>Ground</strong>—W<strong>at</strong>er Investig<strong>at</strong>ion <strong>at</strong> <strong>Mount</strong> <strong>Carmel</strong><br />
24-Hour Test—Test Well 2<br />
October 22-23,1992<br />
Pumped Test Well 2 Observ<strong>at</strong>ion Well 1 Observ<strong>at</strong>ion Well 2 Observ<strong>at</strong>ion Well 3<br />
D<strong>at</strong>e/ Elapsed Depth to Drawdown Depth to Drawdown Depth to Drawdown Depth to Drawdown Piez<br />
Hour time W<strong>at</strong>er Obs Corr* W<strong>at</strong>er Obs Corr* W<strong>at</strong>er Obs Corr* W<strong>at</strong>er Obs Corr* Head R<strong>at</strong>e Remarks<br />
(min) (ft) (ft) (ft) (ft) (ft) (ft) (ft) (ft) (ft) (ft) (ft) (ft) (ft) (gpm)<br />
10/22/92<br />
09:45 AM 0.0<br />
1.0<br />
2.0<br />
3.0<br />
3.8<br />
4.0<br />
5.0<br />
6.0<br />
7.0<br />
8.0<br />
9.0<br />
09:55 AM 10.0<br />
12.0<br />
14.0<br />
16.0<br />
18.0<br />
10:05 AM 20.0<br />
22.0<br />
24.0<br />
26.0<br />
28.0<br />
10:15 AM 30.0<br />
32.0<br />
34.0<br />
36.0<br />
38.0<br />
10:25 AM 40.0<br />
41.1<br />
42.0<br />
43.0<br />
44.0<br />
45.0<br />
46.0<br />
47.0<br />
48.0<br />
49.0<br />
10:35 AM 50.0<br />
51.1<br />
18.33<br />
18.31<br />
18.30<br />
18.32<br />
18.33<br />
18.34<br />
18.36<br />
18.35<br />
18.34<br />
18.34<br />
18.34<br />
18.33<br />
18.32<br />
18.32<br />
18.32<br />
18.32<br />
18.30<br />
18.30<br />
18.30<br />
18.31<br />
18.32<br />
18.31<br />
18.30<br />
18.50<br />
18.51<br />
18.52<br />
18.52<br />
18.52<br />
18.52<br />
18.52<br />
18.51<br />
18.51<br />
18.51<br />
18.51<br />
18.51<br />
18.49<br />
18.50<br />
18.50<br />
20.36<br />
20.44<br />
20.44<br />
20.44 21.80<br />
20.45<br />
20.44<br />
20.44<br />
20.44<br />
20.44<br />
20.44<br />
20.44<br />
20.44<br />
20.44<br />
20.43<br />
20.43<br />
20.43<br />
20.43<br />
21.80<br />
21.80<br />
21.80<br />
21.80<br />
21.79<br />
21.80<br />
21.80<br />
21.80<br />
21.80<br />
21.79<br />
21.79<br />
21.79<br />
21.79<br />
21.36<br />
21.36<br />
21.36<br />
21.36<br />
21.35<br />
21.36<br />
21.36<br />
21.36<br />
21.36<br />
21.36<br />
21.36<br />
21.36<br />
21.36<br />
McDAS started<br />
Transmitter 16 in TW 2<br />
Transmitter 4 in OW 1<br />
Transmitter 3 in OW 2<br />
Transmitter 6 in OW 3<br />
PW measured d/w<br />
OW 1 measured d/w<br />
OW 2 measured d/w<br />
OW 3 measured d/w<br />
52.0 18.50<br />
10:38 AM 53.0 18.50 20.43 21.79 21.36<br />
10:39 AM 54.0 18.48 20.42 21.79 21.35<br />
10:40 AM 0.000 20.42 0.00 0.000 21.79 21.35 Pump On<br />
0.014 21.38 2.88 2.798 20.45 0.03 0.030 21.80 0.01 0.010 21.36 0.00 0.000<br />
0.019 20.91 2.41 2.352 20.45 0.03 0.030 21.81 0.02 0.020 21.36 0.00 0.000<br />
0.025 20.21 1.71 1.681 20.44 0.02 0.020 21.80 0.01 0.010 21.36 0.00 0.000<br />
0.030 20.23 1.73 1.700 20.44 0.02 0.020 21.80 0.01 0.010 21.36 0.00 0.000
<strong>Ground</strong>-W<strong>at</strong>er Investig<strong>at</strong>ion <strong>at</strong> <strong>Mount</strong> <strong>Carmel</strong><br />
24-Hour Test—Test Well 2 (Continued)<br />
October 22-23,1992<br />
Pumped Test Well 2 Observ<strong>at</strong>ion Well 1 Observ<strong>at</strong>ion Well 2 Observ<strong>at</strong>ion Well 3<br />
D<strong>at</strong>e/ Elapsed Depth to Drawdown Depth to Drawdown Depth to Drawdown Depth to Drawdown Piez<br />
Hour time W<strong>at</strong>er Obs Corr* W<strong>at</strong>er Obs Corr* W<strong>at</strong>er Obs Corr* W<strong>at</strong>er Obs Corr* Head R<strong>at</strong>e Remarks<br />
(min) (ft) (ft) (ft) (ft) (ft) (ft) (ft) (ft) (ft) (ft) (ft) (ft) (ft) (gpm)<br />
0.035 20.20 1.70 1.671 20.45 0.03 0.030 21.80 0.01 0.010 21.36 0.00 0.000<br />
0.041 21.13 2.63 2.562 20.45 0.03 0.030 21.80 0.01 0.010 21.36 0.00 0.000<br />
0.046 21.80 3.30 3.192 20.45 0.03 0.030 21.80 0.01 0.010 21.36 0.00 0.000<br />
0.052 22.19 3.69 3.555 20.46 0.04 0.040 21.80 0.01 0.010 21.36 0.00 0.000<br />
0.058 22.46 3.96 3.805 20.47 0.05 0.050 21.81 0.02 0.020 21.36 0.00 0.000<br />
0.064 22.61 4.11 3.943 20.48 0.06 0.060 21.81 0.02 0.020 21.36 0.00 0.000<br />
0.070 22.82 4.32 4.135 20.48 0.06 0.060 21.80 0.01 0.010 21.36 0.00 0.000<br />
0.076 23.07 4.57 4.363 20.48 0.06 0.060 21.80 0.01 0.010 21.36 0.00 0.000<br />
0.083 23.18 4.68 4.463 20.50 0.08 0.080 21.81 0.02 0.020 21.36 0.00 0.000<br />
0.089 23.35 4.85 4.617 20.51 0.09 0.090 21.81 0.02 0.020 21.36 0.00 0.000<br />
0.096 23.58 5.08 4.824 20.52 0.10 0.100 21.81 0.02 0.020 21.36 0.00 0.000<br />
0.103 23.69 5.19 4.923 20.54 0.12 0.120 21.82 0.03 0.030 21.36 0.00 0.000 2.60 880<br />
0.110 23.92 5.42 5.129 20.54 0.12 0.120 21.81 0.02 0.020 21.36 0.00 0.000<br />
0.117 24.08 5.58 5.272 20.55 0.13 0.130 21.81 0.02 0.020 21.36 0.00 0.000<br />
0.124 24.10 5.60 5.290 20.57 0.15 0.150 21.82 0.03 0.030 21.36 0.00 0.000<br />
0.132 24.15 5.65 5.334 20.57 0.15 0.150 21.82 0.03 0.030 21.36 0.00 0.000<br />
0.139 24.25 5.75 5.423 20.59 0.17 0.170 21.83 0.04 0.040 21.36 0.00 0.000<br />
0.147 24.43 5.93 5.582 20.61 0.19 0.190 21.82 0.03 0.030 21.36 0.00 0.000<br />
0.155 24.49 5.99 5.635 20.61 0.19 0.190 21.82 0.03 0.030 21.36 0.00 0.000<br />
0.164 24.61 6.11 5.740 20.62 0.20 0.200 21.83 0.04 0.040 21.36 0.00 0.000<br />
0.172 24.61 6.11 5.740 20.64 0.22 0.220 21.83 0.04 0.040 21.36 0.00 0.000<br />
0.181 24.75 6.25 5.863 20.65 0.23 0.229 21.83 0.04 0.040 21.36 0.00 0.000<br />
0.190 24.80 6.30 5.907 20.66 0.24 0.239 21.84 0.05 0.050 21.36 0.00 0.000<br />
0.199 24.86 6.36 5.960 20.68 0.26 0.259 21.84 0.05 0.050 21.36 0.00 0.000<br />
0.208 24.99 6.49 6.073 20.69 0.27 0.269 21.84 0.05 0.050 21.36 0.00 0.000 2.70 890<br />
0.247 25.11 6.61 6.177 20.74 0.32 0.319 21.86 0.07 0.070 21.36 0.00 0.000<br />
0.302 25.36 6.86 6.394 20.81 0.39 0.388 21.88 0.09 0.090 21.36 0.00 0.000<br />
0.350 25.61 7.11 6.609 20.85 0.43 0.428 21.89 0.10 0.100 21.37 0.01 0.010<br />
0.403 25.74 7.24 6.721 20.89 0.47 0.468 21.90 0.11 0.110 21.37 0.01 0.010<br />
0.508 25.86 7.36 6.824 20.97 0.55 0.547 21.93 0.14 0.140 21.37 0.01 0.010 3.00 940<br />
0.597 26.04 7.54 6.977 21.01 0.59 0.587 21.94 0.15 0.150 21.38 0.02 0.020<br />
0.694 26.15 7.65 7.071 21.06 0.64 0.636 21.96 0.17 0.170 21.38 0.02 0.020<br />
0.802 26.25 7.75 7.155 21.11 0.69 0.685 21.98 0.19 0.190 21.38 0.02 0.020<br />
0.909 26.36 7.86 7.248 21.16 0.74 0.735 22.00 0.21 0.210 21.39 0.03 0.030<br />
0.988 26.44 7.94 7.316 21.19 0.77 0.764 22.01 0.22 0.219 21.39 0.03 0.030<br />
10:41 AM 1.02 26.45 7.95 7.324 21.21 0.79 0.784 22.01 0.22 0.219 21.39 0.03 0.030<br />
1.04 26.45 7.95 7.324 21.21 0.79 0.784 22.02 0.23 0.229 21.39 0.03 0.030<br />
1.07 26.49 7.99 7.358 21.22 0.80 0.794 22.02 0.23 0.229 21.39 0.03 0.030<br />
1.10 26.51 8.01 7.375 21.24 0.82 0.813 22.03 0.24 0.239 21.40 0.04 0.040<br />
1.13 26.55 8.05 7.408 21.25 0.83 0.823 22.04 0.25 0.249 21.40 0.04 0.040<br />
1.16 26.56 8.06 7.417 21.26 0.84 0.833 22.04 0.25 0.249 21.40 0.04 0.040<br />
1.20 26.57 8.07 7.425 21.27 0.85 0.843 22.05 0.26 0.259 21.40 0.04 0.040 3.00 940<br />
1.23 26.60 8.10 7.450 21.28 0.86 0.853 22.05 0.26 0.259 21.40 0.04 0.040<br />
1.26 26.59 8.09 7.442 21.29 0.87 0.862 22.05 0.26 0.259 21.40 0.04 0.040<br />
1.30 26.64 8.14 7.484 21.30 0.88 0.872 22.06 0.27 0.269 21.40 0.04 0.040<br />
1.33 26.65 8.15 7.492 21.31 0.89 0.882 22.06 0.27 0.269 21.40 0.04 0.040<br />
1.37 26.66 8.16 7.501 21.32 0.90 0.892 22.07 0.28 0.279 21.40 0.04 0.040<br />
* Corrected drawdowns result from correction for de<strong>w<strong>at</strong>er</strong>ing (see text)
<strong>Ground</strong>-W<strong>at</strong>er Investig<strong>at</strong>ion <strong>at</strong> <strong>Mount</strong> <strong>Carmel</strong><br />
24-Hour Test—Test Well 2 (Continued)<br />
October 22-23,1992<br />
Pumped Test Well 2 Observ<strong>at</strong>ion Well 1 Observ<strong>at</strong>ion Well 2 Observ<strong>at</strong>ion Well 3<br />
D<strong>at</strong>e/ Elapsed Depth to Drawdown Depth to Drawdown Depth to Drawdown Depth to Drawdown Piez<br />
Hour time W<strong>at</strong>er Obs Corr* W<strong>at</strong>er Obs Corr* W<strong>at</strong>er Obs Corr* W<strong>at</strong>er Obs Corr* Head R<strong>at</strong>e Remarks<br />
(min) (ft) (ft) (ft) (ft) (ft) (ft) (ft) (ft) (ft) (ft) (ft) (ft) (ft) (gpm)<br />
1.40 26.67 8.17 7.509 21.33 0.91 0.902 22.07 0.28 0.279 21.40 0.04 0.040<br />
1.44 26.69 8.19 7.526 21.34 0.92 0.912 22.08 0.29 0.289 21.40 0.04 0.040<br />
1.48 26.72 8.22 7.551 21.35 0.93 0.921 22.08 0.29 0.289 21.40 0.04 0.040<br />
1.52 26.73 8.23 7.559 21.36 0.94 0.931 22.08 0.29 0.289 21.41 0.05 0.050<br />
1.56 26.76 8.26 7.584 21.37 0.95 0.941 22.09 0.30 0.299 21.41 0.05 0.050<br />
1.60 26.78 8.28 7.601 21.38 0.96 0.951 22.10 0.31 0.309 21.41 0.05 0.050 3.00 940<br />
1.64 26.79 8.29 7.610 21.39 0.97 0.961 22.10 0.31 0.309 21.41 0.05 0.050<br />
1.68 26.81 8.31 7.626 21.40 0.98 0.970 22.11 0.32 0.319 21.41 0.05 0.050<br />
1.73 26.81 8.31 7.626 21.41 0.99 0.980 22.11 0.32 0.319 21.41 0.05 0.050<br />
1.77 26.85 8.35 7.660 21.42 1.00 0.990 22.11 0.32 0.319 21.41 0.05 0.050<br />
1.82 26.85 8.35 7.660 21.43 1.01 1.000 22.12 0.33 0.329 21.42 0.06 0.060<br />
1.86 26.87 8.37 7.676 21.44 1.02 1.010 22.12 0.33 0.329 21.42 0.06 0.060<br />
1.91 26.87 8.37 7.676 21.45 1.03 1.019 22.13 0.34 0.339 21.42 0.06 0.060<br />
1.96 26.88 8.38 7.685 21.46 1.04 1.029 22.13 0.34 0.339 21.42 0.06 0.060<br />
10:42 AM 2.01 26.89 8.39 7.693 21.47 1.05 1.039 22.14 0.35 0.349 21.42 0.06 0.060 2.99 940<br />
2.06 26.94 8.44 7.735 21.48 1.06 1.049 22.15 0.36 0.359 21.42 0.06 0.060<br />
2.11 26.96 8.46 7.751 21.49 1.07 1.059 22.15 0.36 0.359 21.42 0.06 0.060<br />
2.17 26.97 8.47 7.760 21.50 1.08 1.068 22.15 0.36 0.359 21.42 0.06 0.060<br />
2.22 26.97 8.47 7.760 21.51 1.09 1.078 22.16 0.37 0.369 21.42 0.06 0.060<br />
2.28 26.97 8.47 7.760 21.52 1.10 1.088 22.16 0.37 0.369 21.43 0.07 0.070<br />
2.34 26.99 8.49 7.776 21.53 1.11 1.098 22.17 0.38 0.378 21.43 0.07 0.070<br />
2.40 27.03 8.53 7.810 21.53 1.11 1.098 22.17 0.38 0.378 21.43 0.07 0.070<br />
2.46 27.01 8.51 7.793 21.54 1.12 1.107 22.18 0.39 0.388 21.43 0.07 0.070<br />
2.52 27.05 8.55 7.826 21.55 1.13 1.117 22.18 0.39 0.388 21.43 0.07 0.070<br />
2.58 27.04 8.54 7.818 21.56 1.14 1.127 22.18 0.39 0.388 21.43 0.07 0.070<br />
2.65 27.08 8.58 7.851 21.57 1.15 1.137 22.19 0.40 0.398 21.43 0.07 0.070<br />
2.71 27.06 8.56 7.835 21.57 1.15 1.137 22.20 0.41 0.408 21.43 0.07 0.070<br />
2.78 27.08 8.58 7.851 21.58 1.16 1.147 22.20 0.41 0.408 21.43 0.07 0.070<br />
2.85 27.10 8.60 7.868 21.59 1.17 1.156 22.20 0.41 0.408 21.44 0.08 0.080<br />
2.92 27.11 8.61 7.876 21.60 1.18 1.166 22.21 0.42 0.418 21.44 0.08 0.080<br />
2.99 27.13 8.63 7.893 21.61 1.19 1.176 22.21 0.42 0.418 21.44 0.08 0.080 2.98<br />
3.07 27.13 8.63 7.893 21.61 1.19 1.176 22.22 0.43 0.428 21.44 0.08 0.080<br />
3.14 27.12 8.62 7.884 21.62 1.20 1.186 22.22 0.43 0.428 21.44 0.08 0.080<br />
3.22 27.13 8.63 7.893 21.63 1.21 1.195 22.22 0.43 0.428 21.44 0.08 0.080<br />
3.30 27.16 8.66 7.917 21.64 1.22 1.205 22.23 0.44 0.438 21.44 0.08 0.080<br />
3.38 27.19 8.69 7.942 21.64 1.22 1.205 22.24 0.45 0.448 21.44 0.08 0.080<br />
3.47 27.17 8.67 7.926 21.66 1.24 1.225 22.24 0.45 0.448 21.45 0.09 0.090<br />
3.55 27.17 8.67 7.926 21.66 1.24 1.225 22.24 0.45 0.448 21.45 0.09 0.090<br />
3.64 27.20 8.70 7.951 21.67 1.25 1.234 22.25 0.46 0.458 21.45 0.09 0.090<br />
3.73 27.19 8.69 7.942 21.67 1.25 1.234 22.25 0.46 0.458 21.45 0.09 0.090<br />
3.82 27.18 8.68 7.934 21.67 1.25 1.234 22.25 0.46 0.458 21.45 0.09 0.090<br />
3.91 27.21 8.71 7.959 21.68 1.26 1.244 22.26 0.47 0.468 21.45 0.09 0.090<br />
4.01 27.21 8.71 7.959 21.68 1.26 1.244 22.25 0.46 0.458 21.45 0.09 0.090 2.95 935<br />
4.11 27.20 8.70 7.951 21.69 1.27 1.254 22.26 0.47 0.468 21.45 0.09 0.090<br />
4.21 27.18 8.68 7.934 21.69 1.27 1.254 22.26 0.47 0.468 21.45 0.09 0.090<br />
4.31 27.24 8.74 7.984 21.71 1.29 1.273 22.27 0.48 0.478 21.46 0.10 0.100<br />
4.41 27.27 8.77 8.008 21.71 1.29 1.273 22.28 0.49 0.487 21.46 0.10 0.100<br />
*Corrected drawdowns result from correction for de<strong>w<strong>at</strong>er</strong>ing (see text)
<strong>Ground</strong>-W<strong>at</strong>er Investig<strong>at</strong>ion <strong>at</strong> <strong>Mount</strong> <strong>Carmel</strong><br />
24-Hour Test—Test Well 2 (Continued)<br />
October 22-23,1992<br />
Pumped Test Well 2 Observ<strong>at</strong>ion Well 1 Observ<strong>at</strong>ion Well 2 Observ<strong>at</strong>ion Well 3<br />
D<strong>at</strong>e/ Elapsed Depth to Drawdown Depth to Drawdown Depth to Drawdown Depth to Drawdown Piez<br />
Hour time W<strong>at</strong>er Obs Corr* W<strong>at</strong>er Obs Corr* W<strong>at</strong>er Obs Corr* W<strong>at</strong>er Obs Corr* Head R<strong>at</strong>e Remarks<br />
(win) (ft) (ft) (ft) (ft) (ft) (ft) (ft) (ft) (ft) (ft) (ft) (ft) (ft) (gpm)<br />
4.52 27.19 8.69 7.942 21.70 1.28 1.264 22.27 0.48 0.478 21.46 0.10 0.100<br />
4.63 27.25 8.75 7.992 21.73 1.31 1.293 22.28 0.49 0.487 21.46 0.10 0.100<br />
4.74 27.25 8.75 7.992 21.73 1.31 1.293 22.29 0.50 0.497 21.46 0.10 0.100<br />
4.86 27.26 8.76 8.000 21.74 1.32 1.303 22.29 0.50 0.497 21.46 0.10 0.100<br />
4.98 27.27 8.77 8.008 21.75 1.33 1.312 22.30 0.51 0.507 21.46 0.10 0.100 2.97 935<br />
10:45 AM 5.10 27.27 8.77 8.008 21.75 1.33 1.312 22.30 0.51 0.507 21.46 0.10 0.100<br />
5.22 27.29 8.79 8.025 21.75 1.33 1.312 22.30 0.51 0.507 21.47 0.11 0.110<br />
5.35 27.30 8.80 8.033 21.76 1.34 1.322 22.31 0.52 0.517 21.47 0.11 0.110<br />
5.47 27.28 8.78 8.017 21.77 1.35 1.332 22.31 0.52 0.517 21.47 0.11 0.110<br />
5.61 27.32 8.82 8.050 21.78 1.36 1.341 22.32 0.53 0.527 21.47 0.11 0.110<br />
6.00 27.28 8.78 8.017 21.77 1.35 1.332 22.30 0.51 0.507 21.47 0.11 0.110 2.97 935<br />
6.14 27.31 8.81 8.042 21.77 1.35 1.332 22.30 0.51 0.507 21.47 0.11 0.110<br />
6.29 27.29 8.79 8.025 21.78 1.36 1.341 22.32 0.53 0.527 21.47 0.11 0.110<br />
6.44 27.32 8.82 8.050 21.78 1.36 1.341 22.32 0.53 0.527 21.47 0.11 0.110<br />
6.59 27.31 8.81 8.042 21.79 1.37 1.351 22.32 0.53 0.527 21.47 0.11 0.110<br />
6.75 27.32 8.82 8.050 21.79 1.37 1.351 22.33 0.54 0.537 21.47 0.11 0.110<br />
6.91 27.33 8.83 8.058 21.80 1.38 1.361 22.33 0.54 0.537 21.48 0.12 0.120<br />
7.08 27.33 8.83 8.058 21.80 1.38 1.361 22.33 0.54 0.537 21.48 0.12 0.120 2.95 935<br />
7.25 27.36 8.86 8.083 21.80 1.38 1.361 22.34 0.55 0.547 21.48 0.12 0.120<br />
7.42 27.37 8.87 8.091 21.82 1.40 1.380 22.35 0.56 0.557 21.48 0.12 0.120<br />
7.60 27.40 8.90 8.116 21.82 1.40 1.380 22.35 0.56 0.557 21.48 0.12 0.120<br />
7.78 27.40 8.90 8.116 21.82 1.40 1.380 22.35 0.56 0.557 21.49 0.13 0.130<br />
7.96 27.41 8.91 8.124 21.83 1.41 1.390 22.35 0.56 0.557 21.49 0.13 0.130<br />
8.16 27.42 8.92 8.132 21.83 1.41 1.390 22.36 0.57 0.567 21.49 0.13 0.130 2.95 935<br />
8.36 27.42 8.92 8.132 21.83 1.41 1.390 22.36 0.57 0.567 21.49 0.13 0.130<br />
8.56 27.46 8.96 8.165 21.84 1.42 1.400 22.37 0.58 0.576 21.49 0.13 0.130<br />
8.76 27.45 8.95 8.157 21.85 1.43 1.410 22.37 0.58 0.576 21.49 0.13 0.130<br />
8.97 27.48 8.98 8.182 21.85 1.43 1.410 22.37 0.58 0.576 21.49 0.13 0.130 2.95 935<br />
9.18 27.49 8.99 8.190 21.86 1.44 1.419 22.37 0.58 0.576 21.50 0.14 0.140<br />
9.40 27.52 9.02 8.214 21.86 1.44 1.419 22.38 0.59 0.586 21.50 0.14 0.140<br />
9.62 27.51 9.01 8.206 21.86 1.44 1.419 22.38 0.59 0.586 21.50 0.14 0.140<br />
9.84 27.56 9.06 8.247 21.87 1.45 1.429 22.38 0.59 0.586 21.50 0.14 0.140<br />
10:50 AM 10.1 27.57 9.07 8.255 21.87 1.45 1.429 22.38 0.59 0.586 21.50 0.14 0.140 2.95 935<br />
12.1 27.69 9.19 8.354 21.91 1.49 1.468 22.41 0.62 0.616 21.51 0.15 0.150 2.95 935<br />
13.9 27.77 9.27 8.419 21.93 1.51 1.487 22.42 0.63 0.626 21.52 0.16 0.160 2.94 935<br />
16.0 27.85 9.35 8.484 21.96 1.54 1.516 22.44 0.65 0.645 21.53 0.17 0.170 2.94 935<br />
18.1 27.95 9.45 8.566 21.99 1.57 1.545 22.46 0.67 0.665 21.54 0.18 0.180 2.93<br />
11:00 AM 20.1 27.98 9.48 8.590 22.00 1.58 1.555 22.47 0.68 0.675 21.55 0.19 0.190 2.94 935 Adjust r<strong>at</strong>e<br />
22.1 28.03 9.53 8.631 22.02 1.60 1.574 22.48 0.69 0.685 21.55 0.19 0.190 2.95 935<br />
24.1 28.09 9.59 8.679 22.05 1.63 1.603 22.51 0.72 0.714 21.57 0.21 0.209 2.94 935<br />
26.1 28.11 9.61 8.696 22.06 1.64 1.613 22.51 0.72 0.714 21.57 0.21 0.209 2.95 935<br />
28.1 28.14 9.64 8.720 22.08 1.66 1.632 22.52 0.73 0.724 21.58 0.22 0.219 2.95 935<br />
11:10 AM 30.1 28.18 9.68 8.752 22.09 1.67 1.642 22.54 0.75 0.744 21.59 0.23 0.229 2.94 935<br />
32.1 28.17 9.67 8.744 22.09 1.67 1.642 22.53 0.74 0.734 21.58 0.22 0.219 2.94 935<br />
34.1 28.23 9.73 8.793 22.11 1.69 1.661 22.55 0.76 0.754 21.59 0.23 0.229 2.95 935<br />
36.2 28.26 9.76 8.817 22.13 1.71 1.681 22.56 0.77 0.764 21.60 0.24 0.239 2.94 935<br />
38.0 28.27 9.77 8.825 22.14 1.72. 1.690 22.57 0.78 0.774 21.61 0.25 0.249 2.94 935<br />
*Corrected drawdowns result from correction for de<strong>w<strong>at</strong>er</strong>ing (see text)
<strong>Ground</strong>-W<strong>at</strong>er Investig<strong>at</strong>ion <strong>at</strong> <strong>Mount</strong> <strong>Carmel</strong><br />
24-Hour Test—Test Well 2 (Continued)<br />
October 22-23, 1992<br />
Pumped Test Well 2 Observ<strong>at</strong>ion Well 1 Observ<strong>at</strong>ion Well 2 Observ<strong>at</strong>ion Well 3<br />
D<strong>at</strong>e/ Elapsed Depth to Drawdown Depth to Drawdown Depth to Drawdown Depth to Drawdown Piez<br />
Hour time W<strong>at</strong>er Obs Corf W<strong>at</strong>er Obs Con* W<strong>at</strong>er Obs Corr* W<strong>at</strong>er Obs Corr* Head R<strong>at</strong>e Remarks<br />
(min) (ft) (ft) (ft) (ft) (ft) (ft) (ft) (ft) (ft) (ft) (ft) (ft) (ft) (gpm)<br />
11:20 AM 40.0 28.33 9.83 8.873 22.16 1.74 1.710 22.58 0.79 0.783 21.61 0.25 0.249 2.94 935<br />
42.0 28.33 9.83 8.873 22.17 1.75 1.719 22.59 0.80 0.793 21.62 0.26 0.259<br />
44.0 28.36 9.86 8.897 22.18 1.76 1.729 22.59 0.80 0.793 21.62 0.26 0.259<br />
44.8 28.39 9.89 8.922 22.20 1.78 1.748 22.61 0.82 0.813 21.63 0.27 0.269 2.93 Adjust r<strong>at</strong>e<br />
46.1 28.39 9.89 8.922 22.20 1.78 1.748 22.61 0.82 0.813 21.63 0.27 0.269<br />
48.1 28.46 9.96 8.978 22.22 1.80 1.768 22.63 0.84 0.832 21.64 0.28 0.279<br />
11:30 AM 50.1 28.50 10.00 9.010 22.23 1.81 1.777 22.64 0.85 0.842 21.64 0.28 0.279 2.95 935<br />
52.1 28.53 10.03 9.034 22.25 1.83 1.796 22.65 0.86 0.852 21.65 0.29 0.289<br />
54.1 28.56 10.06 9.058 22.27 1.85 1.816 22.66 0.87 0.862 21.66 0.30 0.299<br />
56.2 28.58 10.08 9.074 22.28 1.86 1.825 22.67 0.88 0.872 21.66 0.30 0.299<br />
58.1 28.59 10.09 9.082 22.28 1.86 1.825 22.67 0.88 0.872 21.66 0.30 0.299 2.95 935<br />
11:40 AM 60.1 28.61 10.11 9.098 22.29 1.87 1.835 22.68 0.89 0.882 21.67 0.31 0.309 2.95 935<br />
65.1 28.66 10.16 9.138 22.32 1.90 1.864 22.70 0.91 0.901 21.68 0.32 0.319<br />
70.0<br />
75.0<br />
28.71<br />
28.75<br />
10.21<br />
10.25<br />
9.178<br />
9.210<br />
22.35<br />
22.37<br />
1.93<br />
1.95<br />
1.893<br />
1.912<br />
22.72<br />
22.74<br />
0.93<br />
0.95<br />
0.921<br />
0.940<br />
21.69<br />
21.70<br />
0.33<br />
0.34<br />
0.329<br />
0.339<br />
2.95 935<br />
80.0 28.79 10.29 9.242 22.39 1.97 1.931 22.76 0.97 0.960 21.71 0.35 0.349 2.95 935<br />
85.0 28.83 10.33 9.273 22.41 1.99 1.950 22.77 0.98 0.970 21.72 0.36 0.359<br />
90.0 28.87 10.37 9.305 22.43 2.01 1.970 22.79 1.00 0.989 21.73 0.37 0.368 2.94 935<br />
95.0 28.89 10.39 9.321 22.45 2.03 1.989 22.80 1.01 0.999 21.73 0.37 0.368<br />
100 28.93 10.43 9.353 22.47 2.05 2.008 22.82 1.03 1.019 21.74 0.38 0.378 2.94 935<br />
110 28.90 10.40 9.329 22.49 2.07 2.027 22.84 . 1.05 1.038 21.76 0.40 0.398 2.94 935 Adjust r<strong>at</strong>e<br />
12:40 PM 120 29.13 10.63 9.511 22.55 2.13 2.085 22.88 1.09 1.077 21.78 0.42 0.418 2.% 935<br />
130 29.16 10.66 9.535 22.58 2.16 2.113 22.90 1.11 1.097 21.79 0.43 0.428 2.% 935<br />
140 29.19 10.69 9.559 22.59 2.17 2.123 22.91 1.12 1.107 21.80 0.44 0.438 2.% 935<br />
150 29.19 10.69 9.559 22.61 2.19 2.142 22.92 1.13 1.116 21.81 0.45 0.448 2.% 935<br />
160 29.29 10.79 9.637 22.66 2.24 2.190 22.% 1.17 1.155 21.83 0.47 0.467 2.% 935<br />
01:40 PM<br />
170<br />
180<br />
29.32<br />
29.34<br />
10.82<br />
10.84<br />
9.661<br />
9.677<br />
22.67<br />
22.69<br />
2.25<br />
2.27<br />
2.199<br />
2.218<br />
22.97<br />
22.99<br />
1.18<br />
1.20<br />
1.165<br />
1.185<br />
21.84<br />
21.85<br />
0.48<br />
0.49<br />
0.477<br />
0.487<br />
2.%<br />
2.%<br />
935<br />
935<br />
190 29.41 10.91 9.732 22.73 2.31 2.257 23.02 1.23 1.214 21.87 0.51 0.507 2.96 935<br />
200<br />
210<br />
29.42<br />
29.20<br />
10.92<br />
10.70<br />
9.739<br />
9.566<br />
22.74<br />
22.66<br />
2.32<br />
2.24<br />
2.266<br />
2.190<br />
23.03<br />
22.95<br />
1.24<br />
1.16<br />
1.224<br />
1.146<br />
21.88<br />
21.85<br />
0.52<br />
0.49<br />
0.517<br />
0.487<br />
2.% 935<br />
220 29.24 10.74 9.598 22.69 2.27 2.218 22.98 1.19 1.175 21.86 0.50 0.497<br />
02:40 PM<br />
230 29.29 10.79 9.637 22.72 2.30 2.247 22.99 1.20 1.185 21.87 0.51 0.507<br />
240 29.30 10.80 9.645 22.73 2.31 2.257 23.00 1.21 1.194 21.88 0.52 0.517<br />
2.% 935<br />
250 29.34 10.84 9.677 22.75 2.33 2.276 23.03 1.24 1.224 21.89 0.53 0.527<br />
260 29.37 10.87 9.700 22.76 2.34 2.285 23.04 1.25 1.233 21.90 0.54 0.537 2.% 935<br />
270 29.39 10.89 9.716 22.78 2.36 2.304 23.05 1.26 1.243 21.91 0.55 0.547<br />
280 29.42 10.92 9.739 22.80 2.38 2.323 23.07 1.28 1.263 21.92 0.56 0.556<br />
03:40 PM 300 29.46 10.96 9.771 22.82 2.40 2.342 23.09 1.30 1.282 21.93 0.57 0.566<br />
290 29.42 10.92 9.739 22.81 2.39 2.333 23.08 1.29 1.272 21.93 0.57 0.566 2.95 935<br />
310 29.46 10.96 9.771 22.83 2.41 2.352 23.10 1.31 1.292 21.94 0.58 0.576<br />
330 29.51 11.01 9.810 22.85 2.43 2.371 23.12 1.33 1.311 21.95 0.59 0.586<br />
320 29.49 10.99 9.794 22.84 2.42 2.361 23.11 1.32 1.301 21.95 0.59 0.586 2.95 935<br />
340 29.51 11.01 9.810 22.86 2.44 2.380 23.13 1.34 1.321 21.96 0.60 0.5%<br />
04:40 PM<br />
350 29.54 11.04 9.833 22.88 2.46 2.399 23.14 1.35 1.331 21.97 0.61 0.606<br />
360 29.54 11.04 9.833 22.89 2.47 2.409 23.15 1.36 1.340 21.97 0.61 0.606<br />
2.96 935<br />
370 29.56 11.06 9.849 22.89 2.47 2.409 23.16 1.37 1.350 21.98 0.62 0.616<br />
*Corrected drawdowns result from correction for de<strong>w<strong>at</strong>er</strong>ing (see text)
<strong>Ground</strong>-W<strong>at</strong>er Investig<strong>at</strong>ion <strong>at</strong> <strong>Mount</strong> <strong>Carmel</strong><br />
24-Hour Test—Test Well 2 (Continued)<br />
October 22-23,1992<br />
Pumped Test Well 2 Observ<strong>at</strong>ion Well 1 Observ<strong>at</strong>ion Well 2 Observ<strong>at</strong>ion Well 3<br />
D<strong>at</strong>e/ Elapsed Depth to Drawdown Depth to Drawdown Depth to Drawdown Depth to Drawdown Piez<br />
Hour time W<strong>at</strong>er Obs Con* W<strong>at</strong>er Obs Corr* W<strong>at</strong>er Obs Con* W<strong>at</strong>er Obs Corr* Head R<strong>at</strong>e Remarks<br />
(min) (ft) (ft) (ft) (ft) (ft) (ft) (ft) (ft) (ft) (ft) (ft) (ft) (ft) (gpm)<br />
380 29.57 11.07 9.857 22.90 2.48 2.418 23.16 1.37 1.350 21.99 0.63 0.625 2.94 935<br />
390 29.59 11.09 9.872 22.92 2.50 2.437 23.18 1.39 1.369 21.99 0.63 0.625<br />
400 29.59 11.09 9.872 22.92 2.50 2.437 23.19 1.40 1.379 22.00 0.64 0.635<br />
410 29.66 11.16 9.927 22.94 2.52 2.456 23.20 1.41 1.389 22.01 0.65 0.645 2.93 Adjust r<strong>at</strong>e<br />
05:40 PM 420 29.64 11.14 9.911 22.94 2.52 2.456 23.20 1.41 1.389 22.01 0.65 0.645<br />
431 29.65 11.15 9.919 22.96 2.54 2.475 23.21 1.42 1.399 22.02 0.66 0.655<br />
06:00 PM 440 29.69 11.19 9.950 22.97 2.55 2.485 23.22 1.43 1.408 22.02 0.66 0.655 2.95 935<br />
442 29.68 11.18 9.942 22.96 2.54 2.475 23.22 1.43 1.408 22.02 0.66 0.655<br />
443 29.67 11.17 9.935 22.96 2.54 2.475 23.22 1.43 1.408 22.02 0.66 0.655<br />
444 29.68 11.18 9.942 22.97 2.55 2.485 23.22 1.43 1.408 22.02 0.66 0.655 McDAS stopped<br />
06:06 PM 446<br />
447<br />
448<br />
29.68<br />
29.68<br />
29.68<br />
11.18<br />
11.18<br />
11.18<br />
9.942<br />
9.942<br />
9.942<br />
22.97<br />
22.97<br />
22.97<br />
2.55<br />
2.55<br />
2.55<br />
2.485<br />
2.485<br />
2.485<br />
23.23 1.44 1.418 22.03 0.67 0.665 Omnid<strong>at</strong>a started<br />
449 29.63 11.13 9.903 22.96 2.54 2.475 23.24 1.45 1.428<br />
06:10 PM 450 29.60 11.10 9.880 22.94 2.52 2.456 23.22 1.43 1.408 22.02 0.66 0.655<br />
451 29.60 11.10 9.880 22.95 2.53 2.466 23.22 1.43 1.408 22.02 0.66 0.655<br />
452 29.60 11.10 9.880 22.95 2.53 2.466 23.22 1.43 1.408 22.02 0.66 0.655<br />
453 29.59 11.09 9.872 22.95 2.53 2.466 23.22 1.43 1.408 22.02 0.66 0.655<br />
454 29.61 11.11 9.888 22.96 2.54 2.475 23.22 1.43 1.408 22.02 0.66 0.655<br />
455 29.60 11.10 9.880 22.96 2.54 2.475 23.22 1.43 1.408 22.02 0.66 0.655<br />
456 29.60 11.10 9.880 22.% 2.54 2.475 23.22 1.43 1.408 22.03 0.67 0.665<br />
457 29.60 11.10 9.880 22.96 2.54 2.475 23.22 1.43 1.408 22.03 0.67 0.665<br />
458 29.61 11.11 9.888 22.96 2.54 2.475 23.22 1.43 1.408 22.03 0.67 0.665<br />
459 29.60 11.10 9.880 22.96 2.54 2.475 23.22 1.43 1.408 22.03 0.67 0.665<br />
06:20 PM 460 29.61 11.11 9.888 22.96 2.54 2.475 23.23 1.44 1.418 22.03 0.67 0.665<br />
06:25 PM 465 29.62 11.12 9.896 22.97 2.55 2.485 23.23 1.44 1.418 22.02 0.66 0.655<br />
06:28 PM 468 29.62 11.12 9.896 22.97 2.55 2.485 23.23 1.44 1.418 22.02 0.66 0.655 2.95 935<br />
06:40 PM 480 Omnid<strong>at</strong>a did not log 23.00 2.58 2.513 23.25 1.46 1.437 22.03 0.67 0.665 Omnid<strong>at</strong>a did not log<br />
490 pumped well channel 23.00 2.58 2.513 23.26 1.47 1.447 22.04 0.68 0.675 pumped well channel<br />
07:00 PM 500 23.02 2.60 2.532 23.27 1.48 1.457 22.04 0.68 0.675 2.95 935<br />
07:30 PM 530 23.04 2.62 2.551 23.29 1.50 1.476 22.04 0.68 0.675 2.95 935<br />
07:40 PM 540 23.05 2.63 2.561 23.30 1.51 1.486 22.04 0.68 0.675<br />
08:00 PM 560 23.06 2.64 2.570 23.31 1.52 1.495 22.05 0.69 0.685 2.95 935<br />
08:40 PM 600 23.09 2.67 2.599 23.33 1.54 1.515 22.05 0.69 0.685<br />
09:00 PM 620 23.10 2.68 2.608 23.35 1.56 1.534 22.06 0.70 0.694 2.95 935<br />
09:40 PM 660 23.12 2.70 2.627 23.37 1.58 1.553 22.07 0.71 0.704<br />
10:00 PM 680 23.13 2.71 2.636 23.38 1.59 1.563 22.07 0.71 0.704 2.95 935<br />
10:40 PM 720 23.15 2.73 2.655 23.40 1.61 1.582 22.08 0.72 0.714<br />
11:00 PM 740 23.16 2.74 2.665 23.41 1.62 1.592 22.09 0.73 0.724 2.95 935<br />
11:40 PM 780 23.18 2.76 2.684 23.43 1.64 1.611 22.11 0.75 0.744<br />
10/23/92<br />
12:00 AM 800 23.19 2.77 2.693 23.44 1.65 1.621 22.11 0.75 0.744 2.95 935<br />
12:40 AM 840 23.22 2.80 2.721 23.46 1.67 1.640 22.13 0.77 0.763<br />
01:00 AM 860 23.22 2.80 2.721 23.47 1.68 1.650 22.14 0.78 0.773 2.95 935<br />
01:40 AM 900 23.24 2.82 2.740 23.48 1.69 1.660 22.15 0.79 0.783<br />
02:00 AM 920 23.25 2.83 2.750 23.49 1.70 1.669 22.16 0.80 0.793 2.95 935<br />
02:40 AM 960 23.27 2.85 2.769 23.51 1.72 1.688 22.17 0.81 0.802<br />
*Corrected drawdowns result from correction for de<strong>w<strong>at</strong>er</strong>ing (see text)
<strong>Ground</strong>-W<strong>at</strong>er Investig<strong>at</strong>ion <strong>at</strong> <strong>Mount</strong> <strong>Carmel</strong><br />
24-Hour Test—Test Well 2 (Continued)<br />
October 22-23, 1992<br />
Pumped Test Well 2 Observ<strong>at</strong>ion Well 1 Observ<strong>at</strong>ion Well 2 Observ<strong>at</strong>ion Well 3<br />
D<strong>at</strong>e/ Elapsed Depth to Drawdown Depth to Drawdown Depth to Drawdown Depth to Drawdown Piez<br />
Hour time W<strong>at</strong>er Obs Corr* W<strong>at</strong>er Obs Corr* W<strong>at</strong>er Obs Corr* W<strong>at</strong>er Obs Corr* Head R<strong>at</strong>e Remarks<br />
(win) (ft) (ft) (ft) (ft) (ft) (ft) (ft) (ft) (ft) (ft) (ft) (ft) (ft) (gpm)<br />
03:00 AM 980 23.27 2.85 2.769 23.51 1.72 1.688 22.18 0.82 0.812 2.95 935<br />
03:20 AM 1000 23.28 2.86 2.778 23.52 1.73 1.698 22.19 0.83 0.822<br />
03:40 AM 1020 23.29 2.87 2.787 23.53 1.74 1.708 22.20 0.84 0.832<br />
04:00 AM 1040 23.30 2.88 2.797 23.54 1.75 1.717 22.20 0.84 0.832 2.95 935<br />
04:40 AM 1080 23.32 2.90 2.816 23.55 1.76 1.727 22.22 0.86 0.851<br />
05:00 AM 1100 23.33 2.91 2.825 23.56 1.77 1.737 22.23 0.87 0.861 2.95 935<br />
05:40 AM 1140 23.34 2.92 2.835 23.58 1.79 1.756 22.24 0.88 0.871<br />
06:00 AM 1160 23.35 2.93 2.844 23.58 1.79 1.756 22.24 0.88 0.871 2.95 935<br />
06:40 AM 1200 23.37 2.95 2.863 23.60 1.81 1.775 22.25 0.89 0.881<br />
06:50 AM 1210 23.37 2.95 2.863 23.60 1.81 1.775 22.26 0.90 0.891<br />
06:54 AM 1214 23.37 2.95 2.863 23.60 1.81 1.775 22.26 0.90 0.891<br />
06:55 AM 1215 23.37 2.95 2.863 23.60 1.81 1.775 22.26 0.90 0.891<br />
06:56 AM 1216 23.37 2.95 2.863 23.60 1.81 1.775 22.26 0.90 0.891<br />
06:57 AM 1217 23.37 2.95 2.863 23.60 1.81 1.775 22.26 0.90 0.891<br />
06:58 AM 1218 23.37 2.95 2.863 23.60 1.81 1.775 22.26 0.90 0.891<br />
06:59 AM 1219 23.37 2.95 2.863 23.60 1.81 1.775 22.26 0.90 0.891<br />
07:00 AM 1220 23.37 2.95 2.863 23.61 1.82 1.785 22.26 0.90 0.891 2.95 935<br />
07:01 AM 1221 23.37 2.95 2.863 23.60 1.81 1.775 22.26 0.90 0.891<br />
07:02 AM 1222 23.37 2.95 2.863 23.61 1.82 1.785 22.26 0.90 0.891<br />
07:03 AM 1223 23.37 2.95 2.863 23.61 1.82 1.785 22.26 0.90 0.891<br />
07:04 AM 1224 23.38 2.96 2.872 23.61 1.82 1.785 22.26 0.90 0.891<br />
07:05 AM<br />
07:06 AM<br />
1225<br />
1226<br />
23.38<br />
23.38<br />
2.%<br />
2.96<br />
2.872<br />
2.872<br />
23.61<br />
23.61<br />
1.82<br />
1.82<br />
1.785<br />
1.785<br />
22.26<br />
22.26<br />
0.90<br />
0.90<br />
0.891<br />
0.891 Omnid<strong>at</strong>a stopped<br />
07:07 AM<br />
07:08 AM<br />
1227<br />
1228<br />
23.38<br />
23.39<br />
2.96<br />
2.97<br />
2.872<br />
2.882<br />
23.61<br />
23.62<br />
1.82<br />
1.83<br />
1.785<br />
1.794<br />
22.26<br />
22.27<br />
0.90<br />
0.91<br />
0.891<br />
0.900<br />
1229 30.36 11.86 10.467<br />
1230 30.33 11.83 10.444 23.40 2.98 2.891<br />
1231 30.32 11.82 10.437 23.42 3.00 2.910 23.62 1.83 1.794 22.26 0.90 0.891<br />
1232 30.30 11.80 10.421 23.41 2.99 2.900 23.61 1.82 1.785 22.26 0.90 0.891<br />
1233 30.29 11.79 10.414 23.40 2.98 2.891 23.61 1.82 1.785 22.26 0.90 0.891<br />
1234 30.27 11.77 10.398 23.40 2.98 2.891 23.61 1.82 1.785 22.25 0.89 0.881<br />
1235 30.28 11.78 10.406 23.40 2.98 2.891 23.61 1.82 1.785 22.26 0.90 0.891<br />
1236 30.29 11.79 10.414 23.39 2.97 2.882 23.61 1.82 1.785 22.25 0.89 0.881<br />
1237 30.26 11.76 10.391 23.38 2.96 2.872 23.60 1.81 1.775 22.25 0.89 0.881<br />
07:18 AM 1238 30.30 11.80 10.421 23.39 2.97 2.882 23.62 1.83 1.794 22.26 0.90 0.891<br />
1239 30.31 11.81 10.429 23.40 2.98 2.891 23.63 1.84 1.804 22.26 0.90 0.891<br />
07:20 AM 1240 30.29 11.79 10.414 23.39 2.97 2.882 23.61 1.82 1.785 22.26 0.90 0.891<br />
1241 30.28 11.78 10.406 23.38 2.96 2.872 23.61 1.82 1.785 22.25 0.89 0.881<br />
1242 30.25 11.75 10.383 23.37 2.95 2.863 23.60 1.81 1.775 22.25 0.89 0.881<br />
1243 30.24 11.74 10.375 23.37 2.95 2.863 23.61 1.82 1.785 22.24 0.88 0.871<br />
1244 30.27 11.77 10.398 23.38 2.96 2.872 23.61 1.82 1.785 22.25 0.89 0.881<br />
1245 30.27 11.77 10.398 23.38 2.96 2.872 23.61 1.82 1.785 22.25 0.89 0.881<br />
1246 30.24 11.74 10.375 23.38 2.96 2.872 23.61 1.82 1.785 22.25 0.89 0.881<br />
1247 30.41 11.91 10.506 23.44 3.02 2.929 23.67 1.88 1.842 22.27 0.91 0.900<br />
07:28 AM 1248 30.40 11.90 10.498 23.44 3.02 2.929 23.67 1.88 1.842 22.27 0.91 0.900<br />
1249 30.41 11.91 10.506 23.44 3.02 2.929 23.67 1.88 1.842 22.27 0.91 0.900<br />
07:30 AM 1250 30.42 11.92 10.513 23.44 3.02 2.929 23.67 1.88 1.842 22.27 0.91 0.900<br />
McDAS started<br />
*Corrected drawdowns result from correction for dewalering (see text)
<strong>Ground</strong>-W<strong>at</strong>er Investig<strong>at</strong>ion <strong>at</strong> <strong>Mount</strong> <strong>Carmel</strong><br />
24-Hour Test—Test Well 2 (Continued)<br />
October 22-23,1992<br />
Pumped Test Well 2 Observ<strong>at</strong>ion Well 1 Observ<strong>at</strong>ion Well 2 Observ<strong>at</strong>ion Well 3<br />
D<strong>at</strong>e/ Elapsed Depth to Drawdown Depth to Drawdown Depth to Drawdown Depth to Drawdown Piez<br />
Hour time W<strong>at</strong>er Obs Con* W<strong>at</strong>er Obs Corr* W<strong>at</strong>er Obs Corr* W<strong>at</strong>er Obs Corr* Head R<strong>at</strong>e Remarks<br />
(mill) (ft) (ft) (ft) (ft) (ft) (ft) (ft) (ft) (ft) (ft) (ft) (ft) (ft) (gpm)<br />
1251 30.41 11.91 10.506 23.44 3.02 2.929 23.67 1.88 1.842 22.28 0.92 0.910<br />
1252 30.41 11.91 10.506 23.44 3.02 2.929 23.67 1.88 1.842 22.28 0.92 0.910<br />
1253 30.41 11.91 10.506 23.44 3.02 2.929 23.67 1.88 1.842 22.28 0.92 0.910<br />
1254 30.40 11.90 10.498 23.44 3.02 2.929 23.67 1.88 1.842 22.28 0.92 0.910<br />
1255 30.40 11.90 10.498 23.44 3.02 2.929 23.67 1.88 1.842 22.28 0.92 0.910<br />
1256 30.41 11.91 10.506 23.44 3.02 2.929 23.67 1.88 1.842 22.28 0.92 0.910<br />
1257 30.41 11.91 10.506 23.44 3.02 2.929 23.67 1.88 1.842 22.28 0.92 0.910<br />
07:38 AM 1258 30.41 11.91 10.506 23.44 3.02 2.929 23.67 1.88 1.842 22.28 0.92 0.910<br />
1259 30.40 11.90 10.498 23.44 3.02 2.929 23.67 1.88 1.842 22.28 0.92 0.910<br />
07:40 AM 1260 30.41 11.91 10.506 23.44 3.02 2.929 23.67 1.88 1.842 22.28 0.92 0.910<br />
07:50 AM 1270 30.40 11.90 10.498 23.45 3.03 2.938 23.67 1.88 1.842 22.29 0.93 0.920<br />
08:00 AM 1280 30.42 11.92 10.513 23.45 3.03 2.938 23.68 1.89 1.852 22.29 0.93 0.920 2.95 935<br />
1290 30.43 11.93 10.521 23.45 3.03 2.938 23.68 1.89 1.852 22.30 0.94 0.930<br />
1300 30.43 11.93 10.521 23.46 3.04 2.947 23.69 1.90 1.862 22.30 0.94 0.930<br />
1310 30.42 11.92 10.513 23.46 3.04 2.947 23.69 1.90 1.862 22.31 0.95 0.940<br />
1320 30.40 11.90 10.498 23.45 3.03 2.938 23.68 1.89 1.852 22.31 0.95 0.940 W<strong>at</strong>er sample collected<br />
1330 30.34 11.84 10.452 23.43 3.01 2.919 23.66 1.87 1.833 22.30 0.94 0.930 T=56F<br />
09:00 AM 1340 30.43 11.93 10.521 23.47 3.05 2.957 23.70 1.91 1.871 22.32 0.96 0.949 2.95 935<br />
1350 30.44 11.94 10.528 23.47 3.05 2.957 23.70 1.91 1.871 22.32 0.96 0.949<br />
1360 30.39 11.89 10.490 23.45 3.03 2.938 23.68 1.89 1.852 22.32 0.96 0.949<br />
09:30 AM 1370 30.35 11.85 10.460 23.44 3.02 2.929 23.66 1.87 1.833 22.32 0.96 0.949 Noted rise in gw levels<br />
1380 30.17 11.67 10.322 23.36 2.94 2.853 23.59 1.80 1.765 22.29 0.93 0.920 but no change in r<strong>at</strong>e<br />
1382 30.17 11.67 10.322 23.37 2.95 2.863 23.59 1.80 1.765 22.29 0.93 0.920<br />
1384 30.17 11.67 10.322 23.37 2.95 2.863 23.60 1.81 1.775 22.29 0.93 0.920<br />
1386 30.18 11.68 10.329 23.37 2.95 2.863 23.60 1.81 1.775 22.29 0.93 0.920<br />
1388 30.17 11.67 10.322 23.37 2.95 2.863 23.60 1.81 1.775 22.29 0.93 0.920<br />
09:50 AM 1390 30.19 11.69 10.337 23.37 2.95 2.863 23.60 1.81 1.775 22.30 0.94 0.930<br />
1392 30.18 11.68 10.329 23.37 2.95 2.863 23.60 1.81 1.775 22.30 0.94 0.930<br />
1394 30.18 11.68 10.329 23.37 2.95 2.863 23.60 1.81 1.775 22.30 0.94 0.930<br />
1396 30.19 11.69 10.337 23.37 2.95 2.863 23.61 1.82 1.785 22.30 0.94 0.930<br />
09:58 AM 1398 30.15 11.65 10.306 23.38 2.96 2.872 23.61 1.82 1.785 22.30 0.94 0.930<br />
09:59 AM 1399 30.19 11.69 10.337 23.38 2.96 2.872 23.61 1.82 1.785 22.30 0.94 0.930<br />
10:00 AM 1400 30.19 11.69 10.337 23.37 2.95 2.863 23.60 1.81 1.775 22.30 0.94 0.930 2.95 935 Pump Off<br />
0.011<br />
0.020<br />
0.031<br />
0.039<br />
0.051<br />
0.061<br />
0.072<br />
0.079<br />
0.091<br />
0.104<br />
0.127<br />
0.153<br />
0.202<br />
28.41<br />
28.42<br />
28.46<br />
28.03<br />
27.19<br />
26.65<br />
26.16<br />
25.82<br />
25.34<br />
24.85<br />
24.26<br />
23.80<br />
23.44<br />
23.38<br />
23.38<br />
23.38<br />
23.37<br />
23.36<br />
23.36<br />
23.34<br />
23.33<br />
23.32<br />
23.30<br />
23.25<br />
23.21<br />
23.13<br />
23.61<br />
23.60<br />
23.61<br />
23.61<br />
23.60<br />
23.60<br />
23.60<br />
23.60<br />
23.59<br />
23.59<br />
23.59<br />
23.58<br />
23.56<br />
22.30<br />
22.30<br />
22.30<br />
22.30<br />
22.30<br />
22.30<br />
22.30<br />
22.30<br />
22.30<br />
22.29<br />
22.30<br />
22.30<br />
22.29<br />
Recovery<br />
*Corrected drawdowns result from correction for de<strong>w<strong>at</strong>er</strong>ing (see text)
<strong>Ground</strong>-W<strong>at</strong>er Investig<strong>at</strong>ion <strong>at</strong> <strong>Mount</strong> <strong>Carmel</strong><br />
24-Hour Test—Test Well 2 (Continued)<br />
October 22-23, 1992<br />
Pumped Test Well 2 Observ<strong>at</strong>ion Well 1 Observ<strong>at</strong>ion Well 2 Observ<strong>at</strong>ion Well 3<br />
D<strong>at</strong>e/ Elapsed Depth to Drawdown Depth to Drawdown Depth to Drawdown Depth to Drawdown Piez<br />
Hour time W<strong>at</strong>er Obs Corr* W<strong>at</strong>er Obs Corr* W<strong>at</strong>er Obs Corf W<strong>at</strong>er Obs Corr* Head R<strong>at</strong>e Remarks<br />
(min) (ft) (ft) (ft) (ft) (ft) (ft) (ft) (ft) (ft) (ft) (ft) (ft) (ft) (gpm)<br />
0.252<br />
0.302<br />
0.403<br />
0.502<br />
0.605<br />
0.709<br />
0.806<br />
0.914<br />
0.997<br />
10:01 AM 1.02<br />
1.21<br />
1.41<br />
1.59<br />
1.79<br />
1.88<br />
1.97<br />
10:02 AM 2.02<br />
2.51<br />
3.03<br />
3.49<br />
4.02<br />
4.52<br />
10:05 AM 5.08<br />
5.99<br />
7.07<br />
8.14<br />
9.14<br />
10:10 AM 10.0<br />
12.0<br />
14.1<br />
16.2<br />
18.1<br />
10:20 AM 19.9<br />
22.3<br />
25.0<br />
28.0<br />
10:30 AM 30.0<br />
35.0<br />
40.0<br />
45.0<br />
50.0<br />
55.0<br />
11:00 AM 60.0<br />
65.0<br />
70.0<br />
75.1<br />
80.1<br />
23.44<br />
23.57<br />
23.40<br />
23.16<br />
22.98<br />
22.84<br />
22.74<br />
22.64<br />
22.58<br />
22.56<br />
22.45<br />
22.36<br />
22.30<br />
22.24<br />
22.22<br />
22.20<br />
22.19<br />
22.11<br />
22.03<br />
21.97<br />
21.92<br />
21.87<br />
21.82<br />
21.75<br />
21.69<br />
21.61<br />
21.57<br />
21.52<br />
21.42<br />
21.32<br />
21.23<br />
21.16<br />
21.09<br />
21.04<br />
20.93<br />
20.81<br />
20.75<br />
20.63<br />
20.49<br />
20.39<br />
20.31<br />
20.23<br />
20.16<br />
20.09<br />
20.04<br />
19.97<br />
19.93<br />
23.06<br />
23.02<br />
22.97<br />
22.93<br />
22.89<br />
22.86<br />
22.84<br />
22.82<br />
22.80<br />
22.80<br />
22.77<br />
22.75<br />
22.74<br />
22.72<br />
22.72<br />
22.71<br />
22.71<br />
22.69<br />
22.67<br />
22.65<br />
22.64<br />
22.62<br />
22.61<br />
22.59<br />
22.57<br />
22.54<br />
22.52<br />
22.50<br />
22.47<br />
22.43<br />
22.39<br />
22.36<br />
22.33<br />
22.31<br />
22.27<br />
22.21<br />
22.19<br />
22.13<br />
22.06<br />
22.00<br />
21.96<br />
21.91<br />
21.87<br />
21.82<br />
21.79<br />
21.75<br />
21.73<br />
23.55<br />
23.53<br />
23.52<br />
23.50<br />
23.49<br />
23.47<br />
23.46<br />
23.45<br />
23.45<br />
23.45<br />
23.43<br />
23.43<br />
23.42<br />
23.41<br />
23.41<br />
23.40<br />
23.40<br />
23.39<br />
23.38<br />
23.37<br />
23.37<br />
23.36<br />
23.35<br />
23.34<br />
23.33<br />
23.32<br />
23.31<br />
23.30<br />
23.28<br />
23.26<br />
23.24<br />
23.23<br />
23.21<br />
23.21<br />
23.19<br />
23.16<br />
23.15<br />
23.13<br />
23.09<br />
23.05<br />
23.03<br />
23.00<br />
22.97<br />
22.95<br />
22.93<br />
22.90<br />
22.88<br />
22.29<br />
22.29<br />
22.29<br />
22.29<br />
22.28<br />
22.28<br />
22.28<br />
22.28<br />
22.28<br />
22.28<br />
22.27<br />
22.27<br />
22.27<br />
22.27<br />
22.27<br />
22.27<br />
22.27<br />
22.26<br />
22.26<br />
22.26<br />
22.25<br />
22.25<br />
22.25<br />
22.25<br />
22.24<br />
22.24<br />
22.24<br />
22.23<br />
22.23<br />
22.22<br />
22.21<br />
22.21<br />
22.20<br />
22.20<br />
22.20<br />
22.19<br />
22.18<br />
22.18<br />
22.16<br />
22.15<br />
22.14<br />
22.13<br />
22.12<br />
22.11<br />
22.10<br />
22.09<br />
22.08<br />
*Corrected drawdowns result from correction for de<strong>w<strong>at</strong>er</strong>ing (see text)
<strong>Ground</strong>-W<strong>at</strong>er Investig<strong>at</strong>ion <strong>at</strong> <strong>Mount</strong> <strong>Carmel</strong><br />
24-Hour Test—Test Well 2 (Concluded)<br />
October 22-23, 1992<br />
Pumped Test Well 2 Observ<strong>at</strong>ion Well 1 Observ<strong>at</strong>ion Well 2 Observ<strong>at</strong>ion Well 3<br />
D<strong>at</strong>e/ Elapsed Depth to Drawdown Depth to Drawdown Depth to Drawdown Depth to Drawdown Piez<br />
Hour time W<strong>at</strong>er Obs Corr* W<strong>at</strong>er Obs Corr* W<strong>at</strong>er Obs Corr* W<strong>at</strong>er Obs Corr* Head R<strong>at</strong>e Remarks<br />
(min)<br />
85.1<br />
11:30 AM 90.1<br />
95.1<br />
100.0<br />
110.0<br />
12:00 PM 120.0<br />
130.0<br />
140.0<br />
150.0<br />
160.0<br />
170.0<br />
01:00 PM 180.1<br />
190.1<br />
(ft)<br />
(ft) (ft) (ft)<br />
19.88<br />
21.69<br />
19.83<br />
21.65<br />
19.79<br />
21.62<br />
19.74<br />
21.59<br />
19.66<br />
21.54<br />
19.58<br />
21.47<br />
19.52<br />
21.41<br />
19.46<br />
21.38<br />
19.41<br />
21.32<br />
19.35<br />
21.29<br />
19.30<br />
21.25<br />
19.25 21.21<br />
21.17<br />
(ft) (ft) (ft)<br />
22.86<br />
22.84<br />
22.82<br />
22.80<br />
22.76<br />
22.72<br />
22.69<br />
22.65<br />
22.62<br />
22.59<br />
22.56<br />
22.52<br />
22.50<br />
(ft) (ft) (ft)<br />
22.07<br />
22.06<br />
22.06<br />
22.05<br />
22.03<br />
22.01<br />
22.00<br />
21.99<br />
21.97<br />
21.%<br />
21.94<br />
21.92<br />
(ft) (ft) (ft) (gpm)<br />
End of Test<br />
*Corrected drawdowns result from correction for de<strong>w<strong>at</strong>er</strong>ing (see text)
Appendix D.<br />
First Long-Term Aquifer Test: W<strong>at</strong>er-Level Measurements<br />
(November 1992)
<strong>Ground</strong>-W<strong>at</strong>er Investig<strong>at</strong>ion <strong>at</strong> <strong>Mount</strong> <strong>Carmel</strong><br />
First Long-Term Aquifer Test—Test Well 2<br />
November 9-17,1992<br />
Pumped Test Well : Observ<strong>at</strong>ion Well 1 Observ<strong>at</strong>ion Well 2 Observ<strong>at</strong>ion Well 3 Observ<strong>at</strong>ion Well 4<br />
D<strong>at</strong>e/ Elapsed Depth to Drawdown Depth to Drawdown Depth to Drawdown Depth to Drawdown Depth to Drawdown Piez<br />
Hour time W<strong>at</strong>er Obs W<strong>at</strong>er Obs W<strong>at</strong>er Obs W<strong>at</strong>er Obs W<strong>at</strong>er Obs Head R<strong>at</strong>e Remarks<br />
(min) (ft) (ft) (ft) (ft) (ft) (ft) (ft) (ft) (ft) (ft) (ft) (gpm)<br />
11/09/92<br />
10:44 AM 0.0 12.20 14.09 15.51 13.12 10.59 McDAS started<br />
1.0<br />
2.0<br />
12.20<br />
12.19<br />
14.09<br />
14.09<br />
15.51<br />
15.51<br />
13.12<br />
13.12<br />
10.59<br />
10.59<br />
W<strong>at</strong>er level trend<br />
3.0 12.19 14.09 15.52 13.12 10.59<br />
4.0 12.19 14.09 15.51 13.12 10.59<br />
5.1 12.18 14.09 15.51 13.12 10.59<br />
6.0 12.18 14.09 15.51 13.10 10.59<br />
7.0 12.18 14.09 15.51 13.11 10.59<br />
8.0 12.17 14.09 15.51 13.11 10.59<br />
9.0 12.17 14.09 15.51 13.11 10.59<br />
10:54 AM 10.0 12.17 14.09 15.51 13.11 10.59<br />
12.0 12.17 14.09 15.51 13.11 10.58<br />
14.0 12.17 14.08 15.51 13.11 10.57<br />
16.0 12.16 14.08 15.51 13.11 10.57<br />
18.0 12.16 14.08 15.51 13.11 10.57<br />
11:04 AM 20.0 12.16 14.08 15.51 13.11 10.57<br />
22.0 12.16 14.08 15.51 13.11 10.58<br />
24.0 12.16 14.08 15.51 ' 13.11 10.58<br />
26.0 12.15 14.08 15.50 13.11 10.58<br />
28.0 12.15 14.08 15.50 13.11 10.57<br />
30.0 12.15 14.08 15.50 13.11 10.57<br />
35.0 12.15 14.08 15.50 13.11 10.57<br />
11:24 AM 40.0 12.14 14.08 15.50 13.11 10.57<br />
45.0 12.14 14.08 15.50 13.10 10.57<br />
50.0 12.14 14.07 15.49 13.09 10.57<br />
55.0 12.13 14.07 15.49 13.09 10.56<br />
60.0 12.13 14.07 15.49 13.09 10.56<br />
11:44 AM 60.1 12.13 14.07 15.49 13.09 10.56<br />
65.0 12.12 14.07 15.49 13.09 10.56<br />
69.8 12.12 14.06 15.48 13.09 10.55<br />
70.1 12.12 14.06 15.48 13.09 10.56<br />
75.0 12.12 14.07 15.48 13.09 10.56<br />
12:04 PM 80.0 12.12 14.07 15.48 13.09 10.56<br />
85.0 12.11 14.07 15.48 13.09 10.55<br />
85.1 12.11 14.06 15.48 13.09 10.55<br />
90.0 12.12 14.06 15.48 13.09 10.55<br />
95.0 12.11 14.06 15.48 13.09 10.55<br />
12:24 PM 100 12.11 14.06 15.47 13.09 10.55<br />
105 12.11 14.06 15.47 13.09 10.55<br />
110 12.10 14.06 15.47 13.09 10.55<br />
115 12.10 14.06 15.47 13.09 10.54<br />
12:44 PM 120 12.10 14.06 15.47 13.09 10.54<br />
125 12.10 14.06 15.47 13.09 10.54<br />
130 12.10 14.06 15.47 13.09 10.54<br />
135 12.10 14.06 15.47 13.09 10.54<br />
01:04 PM 140 12.10 14.06 15.47 13.09 10.54<br />
142 12.10 14.06 15.47 13.09 10.54<br />
144 12.09 14.06 15.47 13.09 10.54<br />
146 12.09 14.06 15.47 13.09 10.54<br />
148 12.09 14.05 15.46 13.09 10.54<br />
01:14 PM 150 12.09 14.05 15.46 13.09 10.54
<strong>Ground</strong>-W<strong>at</strong>er Investig<strong>at</strong>ion <strong>at</strong> <strong>Mount</strong> <strong>Carmel</strong><br />
First Long-Term Aquifer Test—Test Well 2 (Continued)<br />
November 9-17, 1992<br />
Pumped Test Well: Observ<strong>at</strong>ion Well 1 Observ<strong>at</strong>ion Well 2 Observ<strong>at</strong>ion Well 3 Observ<strong>at</strong>ion Well 4<br />
D<strong>at</strong>e/ Elapsed Depth to Drawdown Depth to Drawdown Depth to Drawdown Depth to Drawdown Depth to Drawdown Piez<br />
Hour time W<strong>at</strong>er Obs W<strong>at</strong>er Obs W<strong>at</strong>er Obs W<strong>at</strong>er Obs W<strong>at</strong>er Obs Head R<strong>at</strong>e Remarks<br />
(min)<br />
151<br />
(ft)<br />
12.09<br />
(ft)<br />
(ft)<br />
14.05<br />
(ft)<br />
(ft)<br />
15.46<br />
(ft)<br />
(ft)<br />
13.09<br />
(ft)<br />
(ft)<br />
10.54<br />
(ft) (ft) (gpm)<br />
01:20 PM 0.010 13.56 1.47 14.05 0.00 15.45 13.08 10.52 Pump On<br />
0.015 15.62 3.53 14.05 0.00 15.46 13.08 10.53<br />
0.020 14.48 2.39 14.05 0.00 15.45 13.08 10.52<br />
0.025 13.82 1.73 14.06 0.01 15.47 0.01 13.09 0.01 10.55 0.01<br />
0.030 12.72 0.63 14.07 0.02 15.47 0.01 13.09 0.01 10.55 0.01<br />
0.041 14.21 2.12 14.07 0.02 15.47 0.01 13.09 0.01 10.55 0.01<br />
0.051 15.33 3.24 14.08 0.03 15.47 0.01 13.09 0.01 10.55 0.01<br />
0.060 15.79 3.70 14.08 0.03 15.47 0.01 13.09 0.01 10.55 0.01<br />
0.070 16.16 4.07 14.09 0.04 15.48 0.02 13.09 0.01 10.55 0.01<br />
0.079 16.45 4.36 14.11 0.06 15.48 0.02 13.09 0.01 10.55 0.01<br />
0.091 16.83 4.74 14.12 0.07 15.49 0.03 13.09 0.01 10.55 0.01<br />
0.10 17.01 4.92 14.13 0.08 15.49 0.03 13.09 0.01 10.57 0.03<br />
0.15 17.80 5.71 14.20 0.15 15.48 0.02 13.09 0.01 10.57 0.03<br />
0.20<br />
0.24<br />
18.29<br />
18.47<br />
6.20<br />
6.38<br />
14.29<br />
14.34<br />
0.24<br />
0.29<br />
15.52<br />
15.53<br />
0.06<br />
0.07<br />
13.09<br />
13.10<br />
0.01<br />
0.02<br />
10.61<br />
10.61<br />
0.07<br />
0.07<br />
0.30 18.76 6.67 14.40 0.35 15.51 0.05 13.09 0.01 10.62 0.08<br />
0.40 19.03 6.94 14.50 0.45 15.57 0.11 13.10 0.02 10.66 0.12<br />
0.50 19.22 7.13 14.59 0.54 15.60 0.14 13.10 0.02 10.69 0.15<br />
0.60 19.34 7.25 14.65 0.60 15.63 0.17 13.11 0.03 10.71 0.17<br />
0.70 19.48 7.39 14.71 0.66 15.65 0.19 13.12 0.04 10.72 0.18<br />
0.80 19.64 7.55 14.77 0.72 15.68 0.22 13.12 0.04 10.75 0.21<br />
0.90 19.76 7.67 14.80 0.75 15.66 0.20 13.11 0.03 10.73 0.19<br />
01:21 PM 1.0 19.96 7.87 14.86 0.81 15.71 0.25 13.12 0.04 10.78 0.24 2.84 920 Adjusting r<strong>at</strong>e<br />
1.5 19.83 7.74 15.00 0.95 15.76 0.30 13.14 0.06 10.83 0.29<br />
2.0 20.09 8.00 15.14 1.09 15.86 0.40 13.17 0.09 10.91 0.37 2.56 870<br />
2.5 20.25 8.16 15.25 1.20 15.91 0.45 13.19 0.11 10.97 0.43<br />
3.0 20.38 8.29 15.33 1.28 15.% 0.50 13.20 0.12 11.01 0.47 2.56 870<br />
3.5 20.48 8.39 15.40 1.35 16.00 0.54 13.22 0.14 11.05 0.51<br />
4.0 20.58 8.49 15.46 1.41 16.05 0.59 13.23 0.15 11.09 0.55 2.55 870<br />
01:25 PM 5.1 20.72 8.63 15.57 1.52 16.12 0.66 13.26 0.18 11.15 0.61 2.55 870<br />
6.0 20.82 8.73 15.63 1.58 16.16 0.70 13.28 0.20 11.19 0.65 2.54 868<br />
7.0 20.89 8.80 15.68 1.63 16.21 0.75 13.30 0.22 11.22 0.68 2.53 866<br />
8.1 20.94 8.85 15.73 1.68 16.24 0.78 13.32 0.24 11.26 0.72 2.53 866<br />
9.1 20.98 8.89 15.77 1.72 16.27 0.81 13.33 0.25 11.28 0.74 2.52 864<br />
01:30 PM 9.9 21.02 8.93 15.80 1.75 16.29 0.83 13.34 0.26 11.31 0.77 2.52 864 Adjusting r<strong>at</strong>e<br />
11.9 21.13 9.04 15.85 1.80 16.33 0.87 13.36 0.28 11.35 0.81 2.56 870<br />
14.0 21.19 9.10 15.88 1.83 16.36 0.90 13.38 0.30 11.37 0.83 2.56 870<br />
16.1 21.22 9.13 15.90 1.85 16.38 0.92 13.40 0.32 11.40 0.86 2.54 868<br />
18.1 21.24 9.15 15.92 1.87 16.40 0.94 13.41 0.33 11.42 0.88 2.54 868<br />
01:40 PM 19.8 21.27 9.18 15.93 1.88 16.41 0.95 13.42 0.34 11.44 0.90 2.56 870<br />
24.9 21.29 9.20 15.96 1.91 16.43 0.97 13.43 0.35 11.47 0.93 2.55 870<br />
29.9 21.31 9.22 15.98 1.93 16.45 0.99 13.45 0.37 11.50 0.96 2.56 870<br />
35.2 21.34 9.25 16.00 1.95 16.47 1.01 13.46 0.38 11.53 0.99 2.56 870<br />
02:00 PM 40.4 21.36 9.27 16.02 1.97 16.48 1.02 13.47 0.39 11.55 1.01 2.57 872<br />
45.3 21.38 9.29 16.03 1.98 16.49 1.03 13.48 0.40 11.56 1.02<br />
49.7 21.39 9.30 16.02 1.97 16.49 1.03 13.49 0.41 11.57 1.03 2.56 870<br />
54.6 21.39 9.30 16.03 1.98 16.50 1.04 13.49 0.41 11.58 1.04<br />
59.8 21.41 9.32 16.05 2.00 16.51 1.05 13.50 0.42 11.60 1.06 2.56 870<br />
65.6 21.41 9.32 16.05 2.00 16.51 1.05 13.51 0.43 11.61 1.07<br />
70.4 21.43 9.34 16.06 2.01 16.52 1.06 13.50 0.42 11.62 1.08
<strong>Ground</strong>-W<strong>at</strong>er Investig<strong>at</strong>ion <strong>at</strong> <strong>Mount</strong> <strong>Carmel</strong><br />
First Long-Term Aquifer Test—Test Well 2 (Continued)<br />
November 9-17,1992<br />
Pumped Test Well : Observ<strong>at</strong>ion Well 1 Observ<strong>at</strong>ion Well 2 Observ<strong>at</strong>ion Well 3 Observ<strong>at</strong>ion Well 4<br />
D<strong>at</strong>e/ Elapsed Depth to Drawdown Depth to Drawdown Depth to Drawdown Depth to Drawdown Depth to Drawdown Piez<br />
Hour time W<strong>at</strong>er Obs W<strong>at</strong>er Obs W<strong>at</strong>er Obs W<strong>at</strong>er Obs W<strong>at</strong>er Obs Head R<strong>at</strong>e Remarks<br />
(min) (ft) (ft) (ft) (ft) (ft) (ft) (ft) (ft) (ft) (ft) (ft) (gpm)<br />
75.4 21.43 9.34 16.07 2.02 16.53 1.07 13.51 0.43 11.63 1.09 2.56 870<br />
80.8 21.44 9.35 16.07 2.02 16.53 1.07 13.51 0.43 11.64 1.10<br />
84.7 21.45 9.36 16.08 2.03 16.54 1.08 13.52 0.44 11.65 1.11<br />
90.7 21.45 9.36 16.08 2.03 16.54 1.08 13.53 0.45 11.66 1.12 2.55 870<br />
95.0 21.46 9.37 16.08 2.03 16.55 1.09 13.53 0.45 11.66 1.12<br />
03:00 PM 99.5 21.47 9.38 16.09 2.04 16.55 1.09 13.53 0.45 11.67 1.13<br />
104 21.46 9.37 16.10 2.05 16.55 1.09 13.53 0.45 11.68 1.14<br />
109 21.47 9.38 16.10 2.05 16.56 1.10 13.54 0.46 11.69 1.15<br />
2.56 870<br />
114 21.47 9.38 16.11 2.06 16.57 1.11 13.55 0.47 11.70 1.16<br />
119 21.49 9.40 16.11 2.06 16.57 1.11 13.54 0.46 11.71 1.17 2.56 870<br />
125 21.49 9.40 16.12 2.07 16.57 1.11 13.55 0.47 11.71 1.17<br />
131 21.49 9.40 16.12 2.07 16.58 1.12 13.55 0.47 11.72 1.18<br />
140 21.50 9.41 16.13 2.08 16.58 1.12 13.56 0.48 11.73 1.19<br />
150 21.52 9.43 16.14 2.09 16.59 1.13 13.56 0.48 11.74 1.20 2.56 870<br />
04:00 PM 160 21.52 9.43 16.15 2.10 16.59 1.13 13.57 0.49 11.75 1.21<br />
172<br />
180<br />
21.53<br />
21.54<br />
9.44<br />
9.45<br />
16.15<br />
16.16<br />
2.10<br />
2.11<br />
16.60<br />
16.61<br />
1.14<br />
1.15<br />
13.57<br />
13.58<br />
0.49<br />
0.50<br />
11.76<br />
11.77<br />
1.22<br />
1.23 2.56 870<br />
193 21.55 9.46 16.17 2.12 16.61 1.15 13.58 0.50 11.78 1.24<br />
04:51 PM<br />
201 21.55 9.46 16.17 2.12 16.62 1.16 13.58 0.50 11.79 1.25<br />
211<br />
16.18 2.13 16.63 1.17 13.59 0.51<br />
216<br />
16.18 2.13<br />
Disconnect McDAS<br />
05:00 PM 220 21.57 9.48 16.14 2.09 16.64 1.18 13.59 0.51 11.80 1.26 Omnid<strong>at</strong>a logging<br />
05:20 PM 240 21.61 9.52 16.17 2.12 16.65 1.19 13.60 0.52 11.83 1.29<br />
06:00 PM 280 21.64 9.55 16.19 2.14 16.66 1.20 13.61 0.53 11.86 1.32 2.56 870<br />
06:20 PM 300 21.63 9.54 16.20 2.15 16.67 1.21 13.62 0.54 11.87 1.33<br />
07:00 PM 340 21.66 9.57 16.22 2.17 16.69 1.23 13.63 0.55 11.89 1.35 2.56 870<br />
07:20 PM 360 21.66 9.57 16.23 2.18 16.69 1.23 13.63 0.55 11.89 1.35<br />
08:00 PM 400 21.68 9.59 16.24 2.19 16.71 1.25 13.63 0.55 11.91 1.37 2.54 868<br />
08:20 PM 420 21.69 9.60 16.25 2.20 16.71 1.25 13.63 0.55 11.92 1.38<br />
09:00 PM 460 21.71 9.62 16.26 2.21 16.72 1.26 13.63 0.55 11.93 1.39 2.54 868<br />
09:20 PM 480 21.71 9.62 16.26 2.21 16.72 1.26 13.62 0.54 11.94 1.40<br />
09.40 PM 500 21.72 9.63 16.27 2.22 16.73 1.27 13.62 0.54 11.94 1.40<br />
10:00 PM 520 21.72 9.63 16.28 2.23 16.74 1.28 13.62 0.54 11.95 1.41 2.54 868<br />
10:20 PM 540 21.72 9.63 16.28 2.23 16.74 1.28 13.62 0.54 11.95 1.41<br />
11:00 PM 580 21.74 9.65 16.29 2.24 16.75 1.29 13.62 0.54 11.96 1.42 2.54 868<br />
11:20 PM 600 21.75 9.66 16.30 2.25 16.75 1.29 13.62 0.54 11.96 1.42<br />
11/10/92 -<br />
12:00 AM 640 21.75 9.66 16.31 2.26 16.76 1.30 13.62 0.54 11.97 1.43<br />
12:20 AM 660 21.76 9.67 16.31 2.26 16.76 1.30 13.62 0.54 11.97 1.43<br />
2.54 868<br />
01:00 AM 700 21.77 9.68 16.32 2.27 16.78 1.32 13.62 0.54 11.98 1.44 2.54 868<br />
01:20 AM 720 21.78 9.69 16.33 2.28 16.78 1.32 13.62 0.54 11.99 1.45<br />
02:00 AM 760 21.77 9.68 16.33 2.28 16.78 1.32 13.62 0.54 11.99 1.45 2.54 868<br />
02:20 AM 780 21.78 9.69 16.33 2.28 16.78 1.32 13.63 0.55 12.00 1.46<br />
02:40 AM 800 21.78 9.69 16.34 2.29 16.79 1.33 13.63 0.55 12.00 1.46<br />
03:00 AM 820 21.78 9.69 16.34 2.29 16.78 1.32 13.64 0.56 12.00 1.46 2.54 868<br />
03:20 AM 840 21.78 9.69 16.34 2.29 16.79 1.33 13.64 0.56 12.00 1.46<br />
04:00 AM 880 21.79 9.70 16.35 2.30 16.80 1.34 13.66 0.58 12.02 1.48 2.54 868<br />
04:20 AM 900 21.79 9.70 16.36 2.31 16.80 1.34 13.66 0.58 12.02 1.48<br />
05:00 AM 940 21.81 9.72 16.36 2.31 16.81 1.35 13.67 0.59 12.02 1.48 2.54 868<br />
05:20 AM 960 21.82 9.73 16.38 2.33 16.81 1.35 13.67 0.59 12.03 1.49<br />
06:00 AM 1000 21.82 9.73 16.38 2.33 16.82 1.36 13.68 0.60 12.03 1.49 2.54 868<br />
06:20 AM 1020 21.81 9.72 16.39 2.34 16.83 1.37 13.68 0.60 12.04 1.50
<strong>Ground</strong>-W<strong>at</strong>er Investig<strong>at</strong>ion <strong>at</strong> <strong>Mount</strong> <strong>Carmel</strong><br />
First Long-Term Aquifer Test—Test Well 2 (Continued)<br />
November 9-17,1992<br />
Pumped Test Well : Observ<strong>at</strong>ion Well 1 Observ<strong>at</strong>ion Well 2 Observ<strong>at</strong>ion Well 3 Observ<strong>at</strong>ion Well 4<br />
D<strong>at</strong>e/ Elapsed Depth to Drawdown Depth to Drawdown Depth to Drawdown Depth to Drawdown Depth to Drawdown Piez<br />
Hour time W<strong>at</strong>er Obs W<strong>at</strong>er Obs W<strong>at</strong>er Obs W<strong>at</strong>er Obs W<strong>at</strong>er Obs Head R<strong>at</strong>e Remarks<br />
(min) (ft) (ft) (ft) (ft) (ft) (ft) (ft) (ft) (ft) (ft) (ft) (gpm)<br />
07:00 AM 1060 21.82 9.73 16.39 2.34 16.83 1.37 13.69 0.61 12.04 1.50 2.54 868<br />
07:20 AM 1080 21.84 9.75 16.40 2.35 16.84 1.38 13.69 0.61 12.04 1.50<br />
07:40 AM 1100 21.84 9.75 16.40 2.35 16.84 1.38 13.69 0.61 12.05 1.51<br />
08:00 AM 1120 21.85 9.76 16.41 2.36 16.84 1.38 13.69 0.61 12.05 1.51 2.54 868<br />
08:20 AM 1140 21.84 9.75 16.41 2.36 16.84 1.38 13.69 0.61 12.05 1.51<br />
08:35 AM 1155 15.77 Measured depth to <strong>w<strong>at</strong>er</strong><br />
08:37 AM 1157 16.87 Measured depth to <strong>w<strong>at</strong>er</strong><br />
08:39 AM 1159 16.52 Measured depth to <strong>w<strong>at</strong>er</strong><br />
08:40 AM 1160 21.98 Measured depth to <strong>w<strong>at</strong>er</strong><br />
0&42 AM 1162 12.04 Measured depth to <strong>w<strong>at</strong>er</strong><br />
08:45 AM 1165 W<strong>at</strong>er sample collected;<br />
09:20 AM 1200 21.83 9.74 16.41 2.36 16.84 1.38 13.67 0.59 12.05 1.51 T=56F; River T=46F<br />
10:00 AM 1240 21.86 9.77 16.41 2.36 16.85 1.39 13.67 0.59 12.05 1.51 2.54 868<br />
10:20 AM 1260 21.86 9.77 16.41 2.36 16.85 1.39 13.67 0.59 12.04 1.50<br />
11:00 AM 1300 21.89 9.80 16.42 2.37 16.85 1.39 13.67 0.59 12.05 1.51<br />
11:20 AM 1320 21.88 9.79 16.43 2.38 16.86 1.40 13.67 0.59 12.05 1.51<br />
12:00 PM 1360 21.90 9.81 16.44 2.39 16.87 1.41 13.67 0.59 12.06 1.52 2.54 868<br />
12:20 PM 1380 21.89 9.80 16.44 2.39 16.86 1.40 13.67 0.59 12.06 1.52<br />
12:40 PM 1400 21.90 9.81 16.44 2.39 16.87 1.41 13.67 0.59 12.06 1.52<br />
01:20 PM 1440 21.90 9.81 16.45 2.40 16.88 1.42 13.67 0.59 12.07 1.53<br />
02:00 PM 1480 21.91 9.82 16.46 2.41 16.88 1.42 13.68 0.60 12.07 1.53 2.54 868<br />
02-20 PM 1500 21.92 9.83 16.46 2.41 16.88 1.42 13.68 0.60 12.07 1.53<br />
03:20 PM 1560 21.94 9.85 16.47 2.42 16.90 1.44 13.69 0.61 12.08 1.54<br />
04:00 PM 1600 21.95 9.86 16.48 2.43 16.90 1.44 13.70 0.62 12.08 1.54 2.54 868<br />
04:20 PM 1620 21.95 9.86 16.48 2.43 16.91 1.45 13.70 0.62 12.08 1.54<br />
05:20 PM 1680 21.95 9.86 16.49 2.44 16.92 1.46 13.72 0.64 12.09 1.55<br />
05:40 PM 1700 21.97 9.88 16.49 2.44 16.91 1.45 13.72 0.64 12.09 1.55<br />
06:00 PM 1720 21.97 9.88 16.50 2.45 16.92 1.46 13.72 0.64 12.09 1.55 2.54 868<br />
06:20 PM 1740 21.98 9.89 16.49 2.44 16.91 1.45 13.72 0.64 12.09 1.55<br />
07:20 PM 1800 21.99 9.90 16.51 2.46 16.92 1.46 13.73 0.65 12.09 1.55<br />
08:00 PM 1840 21.98 9.89 16.51 2.46 16.93 1.47 13.73 0.65 12.10 1.56 2.54 868<br />
0&20 PM 1860 22.00 9.91 16.51 2.46 16.93 1.47 13.73 0.65 12.10 1.56<br />
09:00 PM 1900 22.00 9.91 16.51 2.46 16.93 1.47 13.73 0.65 12.10 1.56<br />
09:20 PM 1920 22.01 9.92 16.52 2.47 16.94 1.48 13.74 0.66 12.11 1.57<br />
10:00 PM 1960 22.01 9.92 16.52 2.47 16.95 1.49 13.74 0.66 12.11 1.57 2.54 868<br />
10:20 PM 1980 22.00 9.91 16.53 2.48 16.94 1.48 13.74 0.66 12.11 1.57<br />
10:40 PM 2000 22.01 9.92 16.53 2.48 16.95 1.49 13.74 0.66 12.11 1.57<br />
11:20 PM 2040 22.01 9.92 16.53 2.48 16.95 1.49 13.75 0.67 12.11 1.57<br />
1VI1/92 -<br />
12:00 AM 2080 22.02 9.93 16.53 2.48 16.95 1.49 13.75 0.67 12.11 1.57 2.54 868<br />
12:20 AM 2100 22.03 9.94 16.54 2.49 16.95 1.49 13.76 0.68 12.11 1.57<br />
01:20 AM 2160 22.03 9.94 16.54 2.49 16.96 1.50 13.77 0.69 12.12 1.58<br />
02:00 AM 2200 22.03 9.94 16.55 2.50 16.96 1.50 13.77 0.69 12.12 1.58<br />
02:20 AM 2220 22.03 9.94 16.55 2.50 16.96 1.50 13.77 0.69 12.12 1.58<br />
03:20 AM 2280 22.04 9.95 16.56 2.51 16.97 1.51 13.78 0.70 12.12 1.58<br />
04:00 AM 2320 22.05 9.96 16.56 2.51 16.98 1.52 13.77 0.69 12.13 1.59 2.54 868<br />
04:20 AM 2340 22.04 9.95 16.56 2.51 16.98 1.52 13.77 0.69 12.13 1.59<br />
05:20 AM 2400 22.05 9.96 16.57 2.52 16.98 1.52 13.77 0.69 12.13 1.59<br />
06:00 AM 2440 22.06 9.97 16.57 2.52 16.99 1.53 13.78 0.70 12.13 1.59 2.54 868<br />
06:20 AM 2460 22.06 9.97 16.57 2.52 16.99 1.53 13.80 0.72 12.14 1.60<br />
07:20 AM 2520 22.05 9.96 16.59 2.54 17.00 1.54 13.82 0.74 12.14 1.60<br />
08:00 AM 2560 22.06 9.97 16.59 2.54 17.00 1.54 13.82 0.74 12.15 1.61 2.54 868
<strong>Ground</strong>-W<strong>at</strong>er Investig<strong>at</strong>ion <strong>at</strong> <strong>Mount</strong> <strong>Carmel</strong><br />
First Long-Term Aquifer Test—Test Well 2 (Continued)<br />
November 9-17,1992<br />
Pumped Test Well : Observ<strong>at</strong>ion Well 1 Observ<strong>at</strong>ion Well 2 Observ<strong>at</strong>ion Well 3 Observ<strong>at</strong>ion Well 4<br />
D<strong>at</strong>e/ Elapsed Depth to Drawdown Depth to Drawdown Depth to Drawdown Depth to Drawdown Depth to Drawdown Piez<br />
Hour time W<strong>at</strong>er Obs W<strong>at</strong>er Obs W<strong>at</strong>er Obs W<strong>at</strong>er Obs W<strong>at</strong>er Obs Head R<strong>at</strong>e Remarks<br />
(min) (ft) (ft) (ft) (ft) (ft) (ft) (ft) (ft) (ft) (ft) (ft) (gpm)<br />
08:20 AM 2580 22.06 9.97 16.58 2.53 16.99 1.53 13.82 0.74 12.15 1.61<br />
08:40 AM 2600 22.05 9.96 16.58 2.53 16.99 1.53 13.81 0.73 12.14 1.60<br />
09:20 AM 2640 22.04 9.95 16.58 2.53 16.98 1.52 13.81 0.73 12.14 1.60<br />
10:00 AM 2680 22.04 9.95 16.57 2.52 16.98 1.52 13.81 0.73 12.14 1.60 2.54 868<br />
10:20 AM 2700 22.03 9.94 16.57 2.52 16.98 1.52 13.81 0.73 12.13 1.59<br />
11:20 AM 2760 22.02 9.93 16.56 2.51 16.97 1.51 13.80 0.72 12.12 1.58<br />
12:00 PM 2800 22.02 9.93 16.56 2.51 16.97 1.51 13.80 0.72 12.12 1.58 2.54 868<br />
12:20 PM 2820 22.01 9.92 16.56 2.51 16.96 1.50 13.79 0.71 12.11 1.57<br />
01:20 PM 2880 22.01 9.92 16.55 2.50 16.96 1.50 13.78 0.70 12.10 1.56<br />
02:00 PM 2920 22.01 9.92 16.55 2.50 16.96 1.50 13.78 0.70 12.10 1.56 2.54 868<br />
02:20 PM 2940 22.01 9.92 16.55 2.50 16.96 1.50 13.78 0.70 12.10 1.56<br />
03:20 PM 3000 22.01 9.92 16.56 2.51 16.97 1.51 13.79 0.71 12.10 1.56<br />
04:00 PM 3040 22.01 9.92 16.56 2.51 16.96 1.50 13.79 0.71 12.10 1.56 2.54 868<br />
04:20 PM 3060 22.01 9.92 16.56 2.51 16.96 1.50 13.79 0.71 12.10 1.56<br />
05:20 PM 3120 22.01 9.92 16.56 2.51 16.97 1.51 13.79 0.71 12.10 1.56<br />
06:00 PM 3160 22.02 9.93 16.56 2.51 16.96 1.50 13.79 0.71 12.10 1.56 2.54 868<br />
06:20 PM 3180 22.02 9.93 16.56 2.51 16.97 1.51 13.79 0.71 12.10 1.56<br />
06:40 PM 3200 22.02 9.93 16.56 2.51 16.97 1.51 13.79 0.71 12.10 1.56<br />
07:20 PM 3240 22.03 9.94 16.56 2.51 16.97 1.51 13.79 0.71 12.10 1.56<br />
08:00 PM 3280 22.03 9.94 16.56 2.51 16.97 1.51 13.79 0.71 12.10 1.56 2.54 868<br />
08:20 PM 3300 22.03 9.94 16.56 2.51 16.97 1.51 13.79 0.71 12.10 1.56<br />
09:20 PM 3360 22.03 9.94 16.56 2.51 16.96 1.50 13.78 0.70 12.09 1.55<br />
10:00 PM 3400 22.02 9.93 16.56 2.51 16.97 1.51 13.78 0.70 12.09 1.55 2.54 868<br />
10:20 PM 3420 22.02 9.93 16.57 2.52 16.97 1.51 13.78 0.70 12.09 1.55<br />
11:20 PM 3480 22.03 9.94 16.57 2.52 16.97 1.51 13.78 0.70 12.09 1.55<br />
1V12/92 —<br />
12:00 AM 3520 22.02 9.93 16.57 2.52 16.96 1.50 13.77 0.69 12.08 1.54 2.54 868<br />
12:20 AM 3540 22.01 9.92 16.57 2.52 16.97 1.51 13.77 0.69 12.08 1.54<br />
01:20 AM 3600 21.99 9.90 16.56 2.51 16.96 1.50 13.77 0.69 12.07 1.53<br />
02:20 AM 3660 21.95 9.86 16.54 2.49 16.94 1.48 13.76 0.68 12.06 1.52<br />
03:20 AM 3720 21.89 9.80 16.52 2.47 16.92 1.46 13.75 0.67 12.04 1.50<br />
04:00 AM 3760 21.89 9.80 16.53 2.48 16.93 1.47 13.77 0.69 12.04 1.50 2.54 868<br />
04:20 AM 3780 21.85 9.76 16.50 2.45 16.90 1.44 13.74 0.66 11.99 1.45<br />
04:40 AM 3800 21.83 9.74 16.50 2.45 16.89 1.43 13.74 0.66 12.00 1.46<br />
05:20 AM 3840 21.75 9.66 16.46 2.41 16.86 1.40 13.72 0.64 11.98 1.44<br />
06:00 AM 3880 21.64 9.55 16.41 2.36 16.81 1.35 13.70 0.62 11.93 1.39 2.54 868<br />
06:20 AM 3900 21.56 9.47 16.37 2.32 16.77 1.31 13.68 0.60 11.90 1.36<br />
07:20 AM 3960 21.30 9.21 16.27 2.22 16.66 1.20 13.63 0.55 11.79 1.25<br />
08:00 AM 4000 21.26 9.17 16.24 2.19 16.64 1.18 13.61 0.53 11.76 1.22 2.54 868<br />
08:20 AM 4020 21.27 9.18 16.24 2.19 16.64 1.18 13.61 0.53 11.76 1.22<br />
09:20 AM 4080 21.06 8.97 16.14 2.09 16.53 1.07 13.54 0.46 11.66 1.12<br />
10:00 AM 4120 19.84 7.75 15.65 1.60 16.05 0.59 13.34 0.26 11.17 0.63 2.54 868<br />
10:20 AM 4140 20.26 8.17 15.82 1.77 16.21 0.75 13.41 0.33 11.34 0.80<br />
11:20 AM 4200 20.64 8.55 15.96 1.91 16.36 0.90 13.46 0.38 11.49 0.95<br />
12:00 PM 4240 20.82 8.73 16.02 1.97 16.42 0.96 13.48 0.40 11.55 1.01 2.54 868<br />
12:20 PM 4260 20.73 8.64 15.98 1.93 16.38 0.92 13.46 0.38 11.52 0.98<br />
01:20 PM 4320 21.06 8.97 16.10 2.05 16.51 1.05 13.54 0.46 9.55 -0.99<br />
02:00 PM 4360 21.02 8.93 16.08 2.03 16.48 1.02 13.52 0.44 9.42 -1.12 2.54 868<br />
02:20 PM 4380 21.02 8.93 16.09 2.04 16.49 1.03 13.53 0.45 9.61 -0.93<br />
02:40 PM 4400 20.99 8.90 16.05 2.00 16.45 0.99 13.49 0.41 9.78 -0.76<br />
03:20 PM 4440 21.01 8.92 16.06 2.01 16.46 1.00 13.52 0.44 9.71 -0.83<br />
04:00 PM 4480 20.98 8.89 16.03 1.98 16.43 0.97 13.49 0.41 10.43 -0.11 2.54 868
<strong>Ground</strong>-W<strong>at</strong>er Investig<strong>at</strong>ion <strong>at</strong> <strong>Mount</strong> <strong>Carmel</strong><br />
First Long-Term Aquifer Test—Test Well 2 (Continued)<br />
November 9-17,1992<br />
Pumped Test Well: Observ<strong>at</strong>ion Well 1 Observ<strong>at</strong>ion Well 2 Observ<strong>at</strong>ion Well 3 Observ<strong>at</strong>ion Well 4<br />
D<strong>at</strong>e/ Elapsed Depth to Drawdown Depth to Drawdown Depth to Drawdown Depth to Drawdown Depth to Drawdown Piez<br />
Hour time W<strong>at</strong>er Obs W<strong>at</strong>er Obs W<strong>at</strong>er Obs W<strong>at</strong>er Obs W<strong>at</strong>er Obs Head R<strong>at</strong>e Remarks<br />
(min) (ft) (ft) (ft) (ft) (ft) (ft) (ft) (ft) (ft) (ft) (ft) (gpm)<br />
04:20 PM 4500 20.97 8.88 16.03 1.98 16.43 0.97 13.47 0.39 11.14 0.60<br />
05:20 PM 4560 20.96 8.87 15.99 1.94 16.40 0.94 13.45 0.37 11.55 1.01<br />
06:00 PM 4600 20.93 8.84 15.97 1.92 16.37 0.91 13.41 0.33 11.58 1.04 2.54 868<br />
06:20 PM 4620 20.92 8.83 15.96 1.91 16.36 0.90 13.41 0.33 11.58 1.04<br />
07:20 PM 4680 20.87 8.78 15.92 1.87 16.32 0.86 13.37 0.29 11.56 1.02<br />
08:00 PM 4720 20.82 8.73 15.88 1.83 16.28 0.82 13.34 0.26 11.54 1.00 2.54 868<br />
08:20 PM 4740 20.81 8.72 15.87 1.82 16.27 0.81 13.33 0.25 11.53 0.99<br />
09:20 PM 4800 20.76 8.67 15.83 1.78 16.23 0.77 13.29 0.21 11.51 0.97<br />
10:00 PM 4840 20.74 8.65 15.81 1.76 16.21 0.75 13.27 0.19 11.49 0.95 2.54 868<br />
10:20 PM 4860 20.73 8.64 15.79 1.74 16.19 0.73 13.26 0.18 11.48 0.94<br />
11:20 PM 4920 20.68 8.59 15.75 1.70 16.16 0.70 13.22 0.14 11.46 0.92<br />
1V13/92 -<br />
12:00 AM 4960 20.64 8.55 15.72 1.67 16.12 0.66 13.20 0.12 11.43 0.89 2.55 870<br />
12:20 AM 4980 20.64 8.55 15.70 1.65 16.10 0.64 13.18 0.10 11.41 0.87<br />
12:40 AM 5000 20.62 8.53 15.68 1.63 16.09 0.63 13.17 0.09 11.40 0.86<br />
01:20 AM 5040 20.58 8.49 15.65 1.60 16.06 0.60 13.14 0.06 11.38 0.84<br />
02:20 AM 5100 20.54 8.45 15.61 1.56 16.02 0.56 13.11 0.03 11.35 0.81<br />
03:20 AM 5160 20.49 8.40 15.56 1.51 15.97 0.51 13.07 -0.01 11.31 0.77<br />
04:00 AM 5200 20.46 8.37 15.54 1.49 15.94 0.48 13.04 -0.04 11.29 0.75 2.55 970<br />
04:20 AM 5220 20.44 8.35 15.52 1.47 15.92 0.46 13.03 -0.05 11.28 0.74<br />
05:20 AM 5280 20.41 8.32 15.48 1.43 15.89 0.43 13.00 -0.08 11.25 0.71<br />
06:00 AM 5320 20.38 8.29 15.46 1.41 15.86 0.40 12.97 -0.11 11.23 0.69 2.55 870<br />
06:20 AM 5340 20.37 8.28 15.44 1.39 15.85 0.39 12.96 -0.12 11.22 0.68<br />
07:20 AM 5400 20.32 8.23 15.40 1.35 15.81 0.35 12.92 -0.16 11.18 0.64<br />
08:00 AM 5440 20.28 8.19 15.37 1.32 15.78 0.32 12.89 -0.19 11.16 0.62 2.57 872<br />
08:20 AM 5460 20.27 8.18 15.36 1.31 15.76 0.30 12.87 -0.21 11.14 0.60<br />
09:20 AM 5520 20.23 8.14 15.31 1.26 15.72 0.26 12.82 -0.26 11.09 0.55<br />
10:00 AM 5560 20.20 8.11 15.27 1.22 15.70 0.24 12.81 -0.27 11.06 0.52 2.56 870<br />
10:20 AM 5580 20.18 8.09 15.29 1.24 15.68 0.22 12.78 -0.30 11.10 0.56<br />
10:40 AM 5600 20.16 8.07 15.25 1.20 15.66 0.20 12.77 -0.31 11.04 0.50<br />
11:20 AM 5640 20.13 8.04 15.23 1.18 15.63 0.17 12.74 -0.34 11.04 0.50<br />
12:00 PM 5680 20.10 8.01 15.19 1.14 15.60 0.14 12.71 -0.37 11.01 0.47 2.56 870<br />
12:20 PM 5700 20.09 8.00 15.18 1.13 15.59 0.13 12.69 -0.39 10.97 0.43<br />
01:20 PM 5760 19.16 7.07 14.77 0.72 15.18 -0.28 12.50 -0.58 10.57 0.03<br />
02:00 PM 5800 18.69 6.60 14.48 0.43 14.93 -0.53 12.39 -0.69 10.37 -0.17 2.56 870<br />
02:20 PM 5820 18.39 6.30 14.40 0.35 14.82 -0.64 12.33 -0.75 10.25 -0.29<br />
03:20 PM 5880 17.66 5.57 14.10 0.05 14.52 -0.94 12.18 -0.90 9.92 -0.62<br />
04:00 PM 5920 17.67 5.58 14.07 0.02 14.50 -0.96 12.15 -0.93 9.92 -0.62 2.58 874<br />
04:20 PM 5940 17.41 5.32 13.97 -0.08 14.39 -1.07 12.10 -0.98 9.83 -0.71<br />
05:20 PM 6000 17.96 5.87 14.16 0.11 14.58 -0.88 12.15 -0.93 10.02 -0.52<br />
06:00 PM 6040 17.78 5.69 14.07 0.02 14.48 -0.98 12.09 -0.99 9.94 -0.60 2.57 872<br />
06:20 PM 6060 17.97 5.88 14.13 0.08 14.55 -0.91 12.11 -0.97 10.01 -0.53<br />
07:20 PM 6120 18.11 6.02 14.15 0.10 14.57 -0.89 12.08 -1.00 10.05 -0.49<br />
08:00 PM 6160 18.32 6.23 14.22 0.17 14.64 -0.82 12.09 -0.99 10.12 -0.42 2.58 874<br />
08:20 PM 6180 18.22 6.13 14.16 0.11 14.58 -0.88 12.06 -1.02 10.07 -0.47<br />
08:40 PM 6200 18.26 6.17 14.16 0.11 14.58 -0.88 12.05 -1.03 10.08 -0.46<br />
09:20 PM 6240 18.02 5.93 14.01 -0.04 14.44 -1.02 11.98 -1.10 9.97 -0.57<br />
10:00 PM 6280 18.11 6.02 14.06 0.01 14.48 -0.98 11.98 -1.10 9.99 -0.55 2.58 874<br />
10:20 PM 6300 18.28 6.19 14.11 0.06 14.53 -0.93 11.99 -1.09 10.05 -0.49<br />
11:20 PM 6360 18.31 6.22 14.08 0.03 14.50 -0.96 11.96 -1.12 10.03 -0.51<br />
11/14/92 -<br />
12:00 AM 6400 18.18 6.09 13.99 -0.06 14.42 -1.04 11.91 -1.17 9.97 -0.57 2.58 874
<strong>Ground</strong>-W<strong>at</strong>er Investig<strong>at</strong>ion <strong>at</strong> <strong>Mount</strong> <strong>Carmel</strong><br />
First Long-Term Aquifer Test—Test Well 2 (Continued)<br />
November 9-17,1992<br />
Pumped Test Well : Observ<strong>at</strong>ion Well 1 Observ<strong>at</strong>ion Well 2 Observ<strong>at</strong>ion Well 3 Observ<strong>at</strong>ion Well 4<br />
D<strong>at</strong>e/ Elapsed Depth to Drawdown Depth to Drawdown Depth to Drawdown Depth to Drawdown Depth to Drawdown Piez<br />
Hour time W<strong>at</strong>er Obs W<strong>at</strong>er Obs W<strong>at</strong>er Obs W<strong>at</strong>er Obs W<strong>at</strong>er Obs Head R<strong>at</strong>e Remarks<br />
(min) (ft) (ft) (ft) (ft) (ft) (ft) (ft) (ft) (ft) (ft) (ft) (gpm)<br />
12:20 AM 6420 17.95 5.86 13.85 -0.20 14.29 -1.17 11.85 -1.23 9.86 -0.68<br />
01:20 AM 6480 17.55 5.46 13.73 -0.32 14.15 -1.31 11.75 -1.33 9.69 -0.85<br />
02:20 AM 6540 17.77 5.68 13.78 -0.27 14.20 -1.26 11.74 -1.34 9.75 -0.79<br />
03:20 AM 6600 17.97 5.88 13.84 -0.21 14.26 -1.20 11.74 -1.34 9.81 -0.73<br />
04:00 AM 6640 17.96 5.87 13.80 -0.25 14.23 -1.23 11.71 -1.37 9.78 -0.76 2.58 874<br />
04:20 AM 6660 17.96 5.87 13.80 -0.25 14.22 -1.24 11.69 -1.39 9.77 -0.77<br />
05:20 AM 6720 17.98 5.89 13.77 -0.28 14.19 -1.27 11.66 -1.42 9.75 -0.79<br />
06:00 AM 6760 17.98 5.89 13.75 -0.30 14.17 -1.29 11.63 -1.45 9.73 -0.81 2.58 874<br />
06:20 AM 6780 17.96 5.87 13.73 -0.32 14.15 -1.31 11.61 -1.47 9.71 -0.83<br />
06:40 AM 6800 17.94 5.85 13.71 -0.34 14.13 -1.33 11.59 -1.49 9.69 -0.85<br />
07:20 AM 6840 17.88 5.79 13.67 -0.38 14.09 -1.37 11.55 -1.53 9.65 -0.89<br />
08:00 AM 6880 17.71 5.62 13.59 -0.46 14.00 -1.46 11.49 -1.59 9.56 -0.98 2.58 874<br />
08:20 AM 6900 17.70 5.61 13.57 -0.48 13.99 -1.47 11.48 -1.60 9.55 -0.99<br />
09:20 AM 6960 17.65 5.56 13.52 -0.53 13.94 -1.52 11.42 -1.66 9.49 -1.05<br />
10.00 AM 7000 17.62 5.53 13.49 -0.56 13.90 -1.56 11.38 -1.70 9.46 -1.08 2.58 874<br />
10.20 AM 7020 17.59 5.50 13.46 -0.59 13.88 -1.58 11.37 -1.71 9.42 -1.12<br />
11:20 AM 7080 17.52 5.43 13.41 -0.64 13.83 -1.63 11.32 -1.76 9.39 -1.15<br />
12:00 PM 7120 17.49 5.40 13.37 -0.68 13.79 -1.67 11.28 -1.80 9.35 -1.19 2.60 876<br />
12:20 PM 7140 17.46 5.37 13.35 -0.70 13.77 -1.69 11.27 -1.81 9.33 -1.21<br />
01:20 PM 7200 17.24 5.15 13.23 -0.82 13.65 -1.81 11.19 -1.89 9.22 -1.32<br />
02:00 PM 7240 17.12 5.03 13.16 -0.89 13.58 -1.88 11.14 -1.94 9.15 -1.39 2.60 876<br />
02:20 PM 7260 17.15 5.06 13.17 -0.88 13.58 -1.88 11.13 -1.95 9.15 -1.39<br />
03:20 PM 7320 17.16 5.07 13.14 -0.91 13.56 -1.90 11.09 -1.99 9.12 -1.42<br />
04:00 PM 7360 17.13 5.04 13.11 -0.94 13.53 -1.93 11.06 -2.02 9.09 -1.45 2.60 876<br />
04:20 PM 7380 17.12 5.03 13.09 -0.96 13.51 -1.95 11.05 -2.03 9.07 -1.47<br />
04:40 PM 7400 17.09 5.00 13.07 -0.98 13.49 -1.97 11.03 -2.05 9.06 -1.48<br />
05:20 PM 7440 17.07 4.98 13.04 -1.01 13.46 -2.00 11.00 -2.08 9.04 -1.50<br />
06:00 PM 7480 17.02 4.93 13.00 -1.05 13.42 -2.04 10.97 -2.11 9.01 -1.53 2.60 876<br />
06:20 PM 7500 17.00 4.91 12.98 -1.07 13.40 -2.06 10.96 -2.12 8.99 -1.55<br />
07:20 PM 7560 16.98 4.89 12.94 -1.11 13.35 -2.11 10.91 -2.17 8.95 -1.59<br />
08:00 PM 7600 16.95 4.86 12.91 -1.14 13.32 -2.14 10.88 -2.20 8.92 -1.62 2.61 876<br />
08:20 PM 7620 16.92 4.83 12.89 -1.16 13.30 -2.16 10.86 -2.22 8.90 -1.64<br />
09:20 PM 7680 16.88 4.79 12.84 -1.21 13.26 -2.20 10.81 -2.27 8.85 -1.69<br />
10:00 PM 7720 16.83 4.74 12.80 -1.25 13.22 -2.24 10.77 -2.31 8.81 -1.73 2.62 877<br />
10:20 PM 7740 16.82 4.73 12.78 -1.27 13.20 -2.26 10.75 -2.33 8.80 -1.74<br />
11:20 PM 7800 16.74 4.65 12.72 -1.33 13.14 -2.32 10.70 -2.38 8.74 -1.80<br />
1V15/92 -<br />
12:00 AM 7840 16.72 4.63 12.69 -1.36 13.10 -2.36 10.66 -2.42 8.70 -1.84 2.62 877<br />
12:20 AM 7860 16.70 4.61 12.68 -1.37 13.09 -2.37 10.64 -2.44 8.69 -1.85<br />
01:20 AM 7920 16.65 4.56 12.63 -1.42 13.04 -2.42 10.59 -2.49 8.64 -1.90<br />
02:20 AM 7980 16.60 4.51 12.57 -1.48 12.98 -2.48 10.54 -2.54 8.59 -1.95<br />
02:40 AM 8000 16.58 4.49 12.55 -1.50 12.96 -2.50 10.52 -2.56 8.58 -1.96<br />
03:20 AM 8040 16.55 4.46 12.52 -1.53 12.93 -2.53 10.49 -2.59 8.55 -1.99<br />
04:00 AM 8080 16.53 4.44 12.49 -1.56 12.90 -2.56 10.46 -2.62 8.52 -2.02 2.66 880<br />
04:20 AM 8100 16.51 4.42 12.47 -1.58 12.88 -2.58 10.44 -2.64 8.50 -2.04<br />
05:20 AM 8160 16.47 4.38 12.42 -1.63 12.83 -2.63 10.39 -2.69 8.45 -2.09<br />
06:00 AM 8200 16.44 4.35 12.39 -1.66 12.80 -2.66 10.35 -2.73 8.42 -2.12 2.66 880<br />
06:20 AM 8220 16.41 4.32 12.37 -1.68 12.78 -2.68 10.34 -2.74 8.42 -2.12<br />
07:20 AM 8280 16.39 4.30 12.33 -1.72 12.74 -2.72 10.28 -2.80 8.37 -2.17<br />
08:00 AM 8320 16.38 4.29 12.30 -1.75 12.72 -2.74 10.26 -2.82 8.33 -2.21 2.66 880<br />
08:20 AM 8340 16.33 4.24 12.27 -1.78 12.68 -2.78 10.23 -2.85 8.29 -2.25<br />
09:20 AM 8400 16.32 4.23 12.24 -1.81 12.65 -2.81 10.18 -2.90 8.25 -2.29
<strong>Ground</strong>-W<strong>at</strong>er Investig<strong>at</strong>ion <strong>at</strong> <strong>Mount</strong> <strong>Carmel</strong><br />
First Long-Term Aquifer Test—Test Well 2 (Continued)<br />
November 9-17,1992<br />
Pumped Test Well: Observ<strong>at</strong>ion Well 1 Observ<strong>at</strong>ion Well 2 Observ<strong>at</strong>ion Well 3 Observ<strong>at</strong>ion Well 4<br />
D<strong>at</strong>e/ Elapsed Depth to Drawdown Depth to Drawdown Depth to Drawdown Depth to Drawdown Depth to Drawdown Piez<br />
Hour time W<strong>at</strong>er Obs W<strong>at</strong>er Obs W<strong>at</strong>er Obs W<strong>at</strong>er Obs W<strong>at</strong>er Obs Head R<strong>at</strong>e Remarks<br />
(min) (ft) (ft) (ft) (ft) (ft) (ft) (ft) (ft) (ft) (ft) (ft) (gpm)<br />
10:00 AM 8440 16.30 4.21 12.21 -1.84 12.62 -2.84 10.14 -2.94 8.20 -2.34 2.66 880<br />
10:20 AM 8460 16.30 4.21 12.20 -1.85 12.61 -2.85 10.13 -2.95 8.19 -2.35<br />
11:20 AM 8520 16.17 4.08 12.14 -1.91 12.52 -2.94 10.06 -3.02 8.13 -2.41<br />
12:00 PM 8560 15.97 3.88 12.01 -2.04 12.42 -3.04 9.99 -3.09 8.01 -2.53 2.67 882<br />
12:20 PM 8580 15.52 3.43 11.83 -2.22 12.23 -3.23 9.90 -3.18 7.81 -2.73<br />
12:40 PM 8600 15.55 3.46 11.81 -2.24 12.23 -3.23 9.89 -3.19 7.79 -2.75<br />
01:20 PM 8640 13.85 1.76 10.98 -3.07 11.43 -4.03 9.55 -3.53 7.05 -3.49<br />
02:00 PM 8680 14.60 2.51 11.39 -2.66 11.80 -3.66 9.67 -3.41 7.37 -3.17 2.68 885<br />
02:20 PM 8700 14.36 2.27 11.29 -2.76 11.70 -3.76 9.62 -3.46 7.25 -3.29<br />
03:20 PM 8760 14.69 2.60 11.39 -2.66 11.79 -3.67 9.63 -3.45 7.36 -3.18<br />
04:00 PM 8800 14.74 2.65 11.38 -2.67 11.79 -3.67 9.61 -3.47 7.35 -3.19 2.64 878<br />
04:20 PM 8820 14.75 2.66 11.37 -2.68 11.78 -3.68 9.60 -3.48 7.34 -3.20<br />
05:20 PM 8880 14.89 2.80 11.39 -2.66 11.80 -3.66 9.58 -3.50 7.37 -3.17<br />
06:00 PM 8920 14.93 2.84 11.39 -2.66 11.79 -3.67 9.56 -3.52 7.36 -3.18 2.66 880<br />
06:20 PM 8940 14.97 2.88 11.39 -2.66 11.79 -3.67 9.55 -3.53 7.37 -3.17<br />
07:20 PM 9000 15.23 3.14 11.46 -2.59 11.86 -3.60 9.55 -3.53 7.43 -3.11<br />
08:00 PM 9040 15.37 3.28 11.49 -2.56 11.89 -3.57 9.54 -3.54 7.47 -3.07 2.64 878<br />
08:20 PM 9060 15.37 3.28 11.47 -2.58 11.87 -3.59 9.53 -3.55 7.45 -3.09<br />
09:20 PM 9120 15.14 3.05 11.34 -2.71 11.75 -3.71 9.44 -3.64 7.32 -3.22<br />
10:00 PM 9160 15.07 2.98 11.30 -2.75 11.70 -3.76 9.40 -3.68 7.27 -3.27 2.64 878<br />
10:20 PM 9180 15.00 2.91 11.25 -2.80 11.65 -3.81 9.37 -3.71 7.22 -3.32<br />
10:40 PM 9200 14.89 2.80 11.19 -2.86 11.59 -3.87 9.34 -3.74 7.16 -3.38<br />
11:20 PM 9240 14.70 2.61 11.09 -2.96 11.49 -3.97 9.27 -3.81 7.06 -3.48<br />
11/16/92 —<br />
12:00 AM 9300 14.66 2.57 11.05 -3.00 11.45 -4.01 9.23 -3.85 7.02 -3.52 2.66 880<br />
12:20 AM 9300 14.62 2.53 11.02 -3.03 11.43 -4.03 9.21 -3.87 6.99 -3.55<br />
01:20 AM 9360 14.56 2.47 10.95 -3.10 11.36 -4.10 9.15 -3.93 6.92 -3.62<br />
02:00 AM 9400 14.64 2.55 10.95 -3.10 11.36 -4.10 9.14 -3.94 6.93 -3.61<br />
02:20 AM 9420 14.75 2.66 10.99 -3.06 11.39 -4.07 9.17 -3.91 6.97 -3.57<br />
03:20 AM 9480 14.90 2.81 11.00 -3.05 11.40 -4.06 9.20 -3.88 6.97 -3.57<br />
04:00 AM 9520 14.86 2.77 10.95 -3.10 11.36 -4.10 9.21 -3.87 6.92 -3.62 2.68 885<br />
04:20 AM 9540 14.84 2.75 10.92 -3.13 11.34 -4.12 9.21 -3.87 6.90 -3.64<br />
05:20 AM 9600 14.78 2.69 10.86 -3.19 11.28 -4.18 9.21 -3.87 6.83 -3.71<br />
06:00 AM 9640 14.71 2.62 10.80 -3.25 11.23 -4.23 9.20 -3.88 6.77 -3.77 2.68 885<br />
06:20 AM 9660 14.68 2.59 10.77 -3.28 11.21 -4.25 9.21 -3.87 6.74 -3.80<br />
07:20 AM 9720 14.16 2.07 10.52 -3.53 11.02 -4.44 9.13 -3.95 6.49 -4.05<br />
08:00 AM 9760 13.77 1.68 10.33 -3.72 10.85 -4.61 9.07 -4.01 6.30 -4.24 2.70 890<br />
08:20 AM 9780 13.22 1.13 10.10 -3.95 10.58 -4.88 8.98 -4.10 6.12 -4.42<br />
08:40 AM 9800 12.68 0.59 9.86 -4.19 10.28 -5.18 8.89 -4.19 5.93 -4.61<br />
09:20 AM 9840 12.18 0.09 9.62 -4.43 9.95 -5.51 8.81 -4.27 5.66 -4.88<br />
10:00 AM 9880 12.79 0.70 9.83 -4.22 10.25 -5.21 8.93 -4.15 5.88 -4.66 2.68 885<br />
10:20 AM 9900 13.06 0.97 9.89 -4.16 10.36 -5.10 8.98 -4.10 5.95 -4.59<br />
11:20 AM 9960 11.61 -0.48 9.28 -4.77 9.53 -5.93 8.75 -4.33 5.21 -5.33<br />
11:30 AM 9970 11.12 -0.97 9.08 -4.97 9.34 -6.12 8.67 -4.41 4.94 -5.60<br />
11:40 AM 9980 11.29 -0.80 9.13 -4.92 9.37 -6.09 8.70 -4.38 4.99 -5.55<br />
11:50 AM 9990 11.82 -0.27 9.33 -4.72 9.60 -5.86 8.79 -4.29 5.25 -5.29 2.70 890 W<strong>at</strong>er sample collected;<br />
— ' — T=57F<br />
12:00 PM 10000 Disconnect Omnid<strong>at</strong>a<br />
12:10 PM 10010 11.82 -0.27 9.22 -4.83 9.60 -5.86 8.79 -4.29 5.25 -5.29 McDAS logging<br />
10011 11.82 -0.27 9.22 -4.83 9.60 -5.86 8.79 -4.29 5.24 -5.30<br />
10012 11.81 -0.28 9.21 -4.84 9.60 -5.86 8.79 -4.29 5.23 -5.31<br />
10013 11.82 -0.27 9.21 -4.84 9.60 -5.86 8.79 -4.29 5.23 -5.31
<strong>Ground</strong>-W<strong>at</strong>er Investig<strong>at</strong>ion <strong>at</strong> <strong>Mount</strong> <strong>Carmel</strong><br />
First Long-Term Aquifer Test—Test Well 2 (Continued)<br />
November 9-17,1992<br />
Pumped Test Well : Observ<strong>at</strong>ion Well 1 Observ<strong>at</strong>ion Well 2 Observ<strong>at</strong>ion Well 3 Observ<strong>at</strong>ion Well 4<br />
D<strong>at</strong>e/ Elapsed Depth to Drawdown Depth to Drawdown Depth to Drawdown Depth to Drawdown Depth to Drawdown Piez<br />
Hour time W<strong>at</strong>er Obs W<strong>at</strong>er Obs W<strong>at</strong>er Obs W<strong>at</strong>er Obs W<strong>at</strong>er Obs Head R<strong>at</strong>e Remarks<br />
(min) (ft) (ft) (ft) (ft) (ft) (ft) (ft) (ft) (ft) (ft) (ft) (gpm)<br />
10014 11.82 -0.27 9.22 -4.83 9.60 -5.86 8.79 -4.29 5.23 -5.31<br />
10015 11.80 -0.29 9.22 -4.83 9.60 -5.86 8.79 -4.29 5.23 -5.31<br />
10016 11.81 -0.28 9.22 -4.83 9.59 -5.87 8.79 -4.29 5.23 -5.31<br />
10017 11.80 -0.29 9.22 -4.83 9.59 -5.87 8.79 -4.29 5.22 -5.32<br />
10018 11.81 -0.28 9.21 -4.84 9.59 -5.87 8.79 -4.29 5.20 -5.34<br />
12:19 PM 10019 11.80 -0.29 9.21 -4.84 9.59 -5.87 8.79 -4.29 5.20 -5.34<br />
12:20 PM 10020 11.82 -0.27 9.21 -4.84 9.59 -5.87 8.79 -4.29 5.21 -5.33 Pump Off<br />
0.011<br />
0.015<br />
0.020<br />
0.025<br />
0.030<br />
0.040<br />
0.051<br />
0.060<br />
0.070<br />
0.079<br />
0.091<br />
0.10<br />
0.15<br />
0.20<br />
0.30<br />
0.40<br />
0.50<br />
0.60<br />
0.70<br />
0.80<br />
0.90<br />
12:21 PM 1.0<br />
1.2<br />
1.5<br />
2.0<br />
2.5<br />
3.0<br />
4.0<br />
12:25 PM 5.0<br />
6.0<br />
6.9<br />
8.0<br />
8.9<br />
12:30 PM 10.0<br />
12.0<br />
14.1<br />
16.2<br />
18.2<br />
12:40 PM 19.9<br />
21.8<br />
23.4<br />
23.9<br />
26.2<br />
9.77<br />
10.51<br />
10.74<br />
10.53<br />
10.26<br />
9.56<br />
9.00<br />
8.61<br />
8.26<br />
7.96<br />
7.65<br />
6.64 7.43<br />
6.13<br />
5.60<br />
5.26<br />
5.01<br />
4.80<br />
4.66<br />
4.51<br />
4.38<br />
4.27<br />
4.09<br />
3.89<br />
3.62<br />
3.40<br />
3.24<br />
3.02<br />
2.88<br />
2.77<br />
2.71<br />
2.65<br />
2.61<br />
2.55<br />
2.51<br />
2.46<br />
2.43<br />
2.41<br />
2.39<br />
2.38<br />
2.36<br />
2.34<br />
8.38<br />
8.30<br />
8.19<br />
8.03<br />
7.90<br />
7.81<br />
7.67<br />
7.57<br />
7.49<br />
7.45<br />
7.40<br />
7.38<br />
7.35<br />
7.31<br />
7.28<br />
7.25<br />
7.23<br />
7.22<br />
7.21<br />
7.19<br />
7.18<br />
McDAS did not log observ<strong>at</strong>ion well channels<br />
9.34<br />
9.30<br />
9.25<br />
9.17<br />
9.09<br />
9.04<br />
8.95<br />
8.87<br />
8.82<br />
8.78<br />
8.75<br />
8.73<br />
8.70<br />
8.67<br />
8.64<br />
8.62<br />
8.60<br />
8.59<br />
8.58<br />
8.57<br />
10.99<br />
8.79<br />
8.79<br />
8.79<br />
8.79<br />
8.79<br />
8.79<br />
8.79<br />
8.79<br />
8.79<br />
8.79<br />
8.79<br />
8.79<br />
8.79<br />
8.79<br />
8.78<br />
8.78<br />
8.78<br />
8.78<br />
8.79<br />
10.48<br />
8.79<br />
8.79<br />
4.97<br />
4.93<br />
4.88<br />
4.81<br />
4.74<br />
4.69<br />
4.61<br />
4.54<br />
4.49<br />
4.46<br />
4.43<br />
4.41<br />
4.39<br />
4.35<br />
4.32<br />
4.30<br />
4.28<br />
4.27<br />
4.26<br />
4.25<br />
4.23<br />
Recovery<br />
Measured depth to <strong>w<strong>at</strong>er</strong><br />
Measured depth to <strong>w<strong>at</strong>er</strong>
<strong>Ground</strong>-W<strong>at</strong>er Investig<strong>at</strong>ion <strong>at</strong> <strong>Mount</strong> <strong>Carmel</strong><br />
First Long-Term Aquifer Test—Test Well 2 (Continued)<br />
November 9-17,1992<br />
Pumped Test Well : Observ<strong>at</strong>ion Well 1 Observ<strong>at</strong>ion Well 2 Observ<strong>at</strong>ion Well 3 Observ<strong>at</strong>ion Well 4<br />
D<strong>at</strong>e/ Elapsed Depth to Drawdown Depth to Drawdown Depth to Drawdown Depth to Drawdown Depth to Drawdown Piez<br />
Hour time W<strong>at</strong>er Obs W<strong>at</strong>er Obs W<strong>at</strong>er Obs W<strong>at</strong>er Obs W<strong>at</strong>er Obs Head R<strong>at</strong>e Remarks<br />
(min) (ft) (ft) (ft) (ft) (ft) (ft) (ft) (ft) (ft) (ft) (ft) (gpm)<br />
Note: Logged depths to <strong>w<strong>at</strong>er</strong> do not agree with measureddue to adjustments of d<strong>at</strong>a between loggers and<br />
signal interpret<strong>at</strong>ion error due to overpressuriz<strong>at</strong>ion of transmitters caused by the rise in <strong>w<strong>at</strong>er</strong> levels.<br />
27.4 9.58 Measured depth to <strong>w<strong>at</strong>er</strong><br />
28.1 2.33<br />
7.16 8.55 8.79 4.22<br />
29.4 7.69<br />
Measured depth to <strong>w<strong>at</strong>er</strong><br />
12:50 PM 30.1 2.32 7.16 8.54 8.79 4.21<br />
31.5<br />
6.30 Measured depth to <strong>w<strong>at</strong>er</strong><br />
35.3 2.30 7.13 8.52 8.79 4.18<br />
01:00 PM 39.6 2.28 7.12 8.51 8.79 4.18<br />
•45.5 2.25 7.09 8.49 8.79 4.14<br />
49.9 2.23 7.08 8.47 8.79 4.12<br />
54.7 2.21 7.06 8.46 8.78 4.11<br />
59.9 2.19 7.05 8.44 8.78 4.07<br />
65.7 2.17 7.03 8.43 8.78 4.06<br />
01:30 PM 70.4 2.15 7.02 8.41 10.51 4.05 OW 3 transducer raised<br />
75.5 2.14 7.00 8.41 13.29 4.04 River T=45F<br />
80.8 2.13 7.00 8.39 13.28 4.01<br />
84.6 2.11 6.98 8.38 13.27 4.00<br />
90.6 2.10 6.95 8.36 13.26 3.97<br />
94.7 2.08 6.94 8.35 13.25 3.96<br />
02:01 PM 101 2.06 6.94 8.34 13.24 3.95<br />
111 2.04 6.90 8.31 13.22 3.92<br />
121 2.01 6.88 8.30 13.20 3.88<br />
02:31 PM 131 1.98 6.86 8.27 13.18 3.85<br />
141 1.96 6.83 8.25 13.16 3.82<br />
151 1.94 6.81 8.22 13.14 3.79<br />
03:01 PM 161 1.91 6.78 8.20 13.12 3.77<br />
171 1.88 6.76 8.18 13.11 3.73<br />
181 1.87 6.74 8.16 13.09 3.70<br />
03:31 PM 191 1.85 6.72 8.13 13.07 3.68<br />
201 1.82 6.69 8.11 13.05 3.65<br />
211 1.79 6.67 8.09 13.02 3.62<br />
221 1.77 6.65 8.07 13.01 3.60<br />
231 1.76 6.62 8.05 12.99 3.58<br />
04:21 PM 241 1.73 6.60 8.03 12.97 3.54<br />
243 1.73 6.60 8.02 12.97 3.54<br />
04:25 PM 245 1.72 6.59 8.02 12.% 3.54<br />
247 1.72 6.59 8.01 12.96 3.54<br />
248 1.72 6.59 8.02 12.96 3.53 Disconnect McDAS<br />
04:30 PM 250 3.45 6.59 8.02 13.30 3.53 Omnid<strong>at</strong>a logging<br />
04:31 PM 251 1.28 6.41 8.02 12.93 3.53<br />
04:32 PM 252 1.61 6.53 8.02 12.98 3.53<br />
04:33 PM 253 1.72 6.58 8.03 13.00 3.53<br />
04:34 PM 254 1.76 6.59 8.02 13.01 3.53<br />
04:35 PM 255 1.86 6.64 8.03 13.02 3.53<br />
04:36 PM 256 1.88 6.66 8.02 13.03 3.53<br />
— 256 9.99 Measured depth to <strong>w<strong>at</strong>er</strong><br />
04:37 PM 257 1.95 6.69 8.03 13.04 3.53<br />
— 257 10.43 Measured depth to <strong>w<strong>at</strong>er</strong><br />
257<br />
8.97<br />
Measured depth to <strong>w<strong>at</strong>er</strong><br />
04:38 PM 258 1.97<br />
6.68 8.02 13.04 3.53<br />
258 7.03 Measured depth to <strong>w<strong>at</strong>er</strong>
<strong>Ground</strong>-W<strong>at</strong>er Investig<strong>at</strong>ion <strong>at</strong> <strong>Mount</strong> <strong>Carmel</strong><br />
First Long-Term Aquifer Test—Test Well 2 (Concluded)<br />
November 9-17, 1992<br />
Pumped Test Well: Observ<strong>at</strong>ion Well 1 Observ<strong>at</strong>ion Well 2 Observ<strong>at</strong>ion Well 3 Observ<strong>at</strong>ion Well 4<br />
D<strong>at</strong>e/ Elapsed Depth to Drawdown Depth to Drawdown Depth to Drawdown Depth to Drawdown Depth to Drawdown Piez<br />
Hour time W<strong>at</strong>er Obs W<strong>at</strong>er Obs W<strong>at</strong>er Obs W<strong>at</strong>er Obs W<strong>at</strong>er Obs Head R<strong>at</strong>e Remarks<br />
(min) (ft) (ft) (ft) (ft) (ft) (ft) (ft) (ft) (ft) (ft) (ft) (gpm)<br />
04:39 PM 259 2.03 6.70 8.02 13.05 3.53<br />
04:40 PM 260 2.04 6.71 8.02 13.05 3.53<br />
- 260 5.60<br />
04:41 PM 261 2.05 6.70 8.02 13.05 3.53<br />
Measured depth to <strong>w<strong>at</strong>er</strong><br />
04:42 PM 262 2.07 6.72 8.03 13.05 3.53<br />
04:43 PM 263 2.08 6.73 8.03 13.06 3.53<br />
04:44 PM 264 2.09 6.73 8.03 13.05 3.53<br />
04:45 PM 265 2.09 6.72 8.03 13.05 3.53<br />
05:00 PM 280 2.01 6.67 8.03 13.01 3.54<br />
05:20 PM 300 1.96 6.63 8.02 12.98 3.53<br />
05:40 PM 320 1.92 6.60 8.02 12.94 3.53<br />
06:00 PM 340 1.91 6.56 8.02 12.91 3.53<br />
06:20 PM 360 1.87 6.52 8.02 12.87 3.53<br />
06:40 PM 380 1.84 6.48 8.02 12.83 3.53<br />
07:00 PM 400 1.80 6.44 8.02 12.79 3.53<br />
07:20 PM 420 1.77 6.40 8.01 12.76 3.52<br />
07:40 PM 440 1.75 6.38 8.01 12.72 3.52<br />
08:00 PM 460 1.51 6.25 8.01 12.64 3.52<br />
08:20 PM 480 0.75 5.89 8.01 12.48 3.52<br />
08:40 PM 500 -1.62 5.06 8.00 12.09 3.51<br />
09:00 PM 520 -0.41 4.91 8.00 11.92 3.51<br />
09:20 PM 540 -2.80 4.69 8.00 11.84 3.51<br />
09:40 PM 560 -2.33 4.75 8.00 11.88 3.51<br />
10.00 PM 580 -1.11 5.17 8.00 12.04 3.51<br />
10:20 PM 600 0.18 5.53 8.00 12.19 3.51<br />
10:40 PM 620 0.74 5.76 8.00 12.26 3.50<br />
11:00 PM 640 1.23 5.93 7.99 12.31 3.50<br />
11:20 PM 660 1.17 5.88 7.99 12.27 3.50<br />
11:40 PM 680 1.03 5.81 7.99 12.21 3.50<br />
11/17/92 -<br />
12:00 AM 700 -0.47 5.17 7.99 11.93 3.50<br />
12:20 AM 720 0.21 5.43 7.99 12.01 3.50<br />
12:40 AM 740 0.28 5.44 8.00 11.98 3.50<br />
01:00 AM 760 0.38 5.44 8.00 11.96 3.51<br />
01:20 AM 780 0.24 5.37 8.00 11.91 3.51<br />
01:40 AM 800 -0.08 5.22 8.00 11.82 3.51<br />
02:20 AM 840 -1.15 4.73 8.00 11.58 3.51<br />
03:20 AM 900 -0.77 4.82 8.00 11.55 3.51<br />
04:20 AM 960 -0.73 4.78 8.01 11.47 3.51<br />
05:00 AM 1000 -0.81 4.69 8.00 11.40 3.51<br />
05:20 AM 1020 -0.78 4.68 8.00 11.38 3.51<br />
06:20 AM 1080 -0.80 4.60 8.00 11.28 3.51<br />
06:40 AM 1100 -0.78 4.60 8.00 11.26 3.51<br />
07:20 AM 1140 -0.92 4.50 8.00 11.18 3.51<br />
08:20 AM 1200 0.03 4.82 8.01 11.25 3.52 End of Test
Appendix E.<br />
Second Long-Term Aquifer Test: W<strong>at</strong>er-Level Measurements<br />
(June-July 1993)
<strong>Ground</strong>—W<strong>at</strong>er Investig<strong>at</strong>ion <strong>at</strong> <strong>Mount</strong> <strong>Carmel</strong><br />
Second Long-Term Test- -Test Well 2<br />
June 28-July 7,1993<br />
Pumped Test Well 2 Observ<strong>at</strong>ion Well 1 Observ<strong>at</strong>ion Well 2 Observ<strong>at</strong>ion Well 3 Observ<strong>at</strong>ion Well 4<br />
D<strong>at</strong>e/ Elapsed Depth to Drawdown Depth to Drawdown Depth to Drawdown Depth to Drawdown Depth to Drawdown Piez<br />
Hour time W<strong>at</strong>er Obs Adj+ W<strong>at</strong>er Obs Adj+ W<strong>at</strong>er Obs Adj+ W<strong>at</strong>er Obs Adj+ W<strong>at</strong>er Obs Adj+ Head R<strong>at</strong>e Remarks<br />
(min) (ft) (ft) (ft) (ft) (ft) (ft) (ft) (ft) (ft) (ft) (ft) (ft) (ft) (it) (ft) (ft) (gpm)<br />
06/28/93 —<br />
02:42 PM 0.0 17.31 18.99 20.19 19.65 14.54 W<strong>at</strong>er level trend<br />
02:52 PM 0.0 17.01 18.85 20.11 19.63 14.46 Omnid<strong>at</strong>a logging<br />
03:02 PM 0.0 16.88 18.79 20.07 19.62 14.42<br />
03:12 PM 0.0 16.84 18.77 20.06 19.61 14.41<br />
03:22 PM 0.0 16.82 18.75 20.04 19.61 14.37<br />
03:32 PM 0.0 16.80 18.76 20.04 19.61 14.40<br />
03:42 PM 0.0 16.80 18.75 20.04 19.62 14.34<br />
03:52 PM 0.0 16.80 18.76 20.04 19.62 14.40<br />
04:02 PM 0.0 16.79 18.76 20.03 19.62 14.40<br />
05:02 PM 0.0 16.79 18.76 20.04 19.63 14.37<br />
06:02 PM 0.0 16.85 18.76 20.04 19.64 14.38<br />
07:02 PM 0.0 16.81 18.76 20.04 19.64 14.36<br />
08:02 PM 0.0 16.79 18.77 20.05 19.64 14.37<br />
09:02 PM 0.0 16.77 18.78 20.06 19.62 14.38<br />
10:02 PM 0.0 16.77 18.79 20.07 19.62 14.39<br />
11:02 PM 0.0 16.77 18.80 20.07 19.60 14.39<br />
06/29/93 -<br />
12:02 AM 0.0 16.77 18.80 20.08 19.59 14.39<br />
01:02 AM 0.0 16.77 18.80 20.08 19.58 14.39<br />
02:02 AM 0.0 16.78 18.81 20.09 19.58 14.40<br />
03:02 AM 0.0 16.79 18.81 20.09 19.57 14.41<br />
04:02 AM 0.0 16.79 18.82 20.10 19.58 14.42<br />
05:02 AM 0.0 16.79 18.82 20.10 19.57 14.42<br />
06:02 AM 0.0 16.80 18.82 20.10 19.58 14.42<br />
07:02 AM 0.0 16.78 18.82 20.10 19.59 14.42<br />
08:02 AM 0.0 16.76 18.82 20.10 19.59 14.45<br />
09:02 AM 0.0 16.76 18.80 20.09 19.59 14.33<br />
10.02 AM 0.0 16.77 18.81 20.09 19.59 14.49<br />
11:02 AM 0.0 16.77 18.80 20.08 19.59 14.44<br />
12:02 PM 0.0 16.77 18.80 20.08 19.59 14.51<br />
01:02 PM 0.0 16.77 18.79 20.08 19.58 14.43<br />
02:02 PM 0.0 16.77 18.79 20.07 19.58 14.45<br />
03:02 PM 0.0 16.76 18.79 20.07 19.57 14.49<br />
04:02 PM 0.0 16.76 18.77 20.06 19.57 14.42<br />
05:02 PM 0.0 16.76 18.79 20.06 19.56 14.45<br />
06:02 PM 0.0 16.75 18.76 20.05 19.56 14.42<br />
07:02 PM 0.0 16.76 18.76 20.05 19.56 14.42<br />
08:02 PM 0.0 16.76 18.77 20.06 19.56 14.43<br />
09:02 PM 0.0 16.75 18.77 20.05 19.55 14.42<br />
10:02 PM 0.0 16.74 18.77 20.05 19.55 14.42<br />
11:02 PM 0.0 16.74 18.76 20.05 19.55 14.42<br />
06/30/93 -<br />
12:02 AM 0.0 16.74 18.76 20.05 19.56 14.43<br />
01:02 AM 0.0 16.73 18.76 20.05 19.56 14.42<br />
02:02 AM 0.0 16.73 18.76 20.04 19.56 14.41<br />
03:02 AM 0.0 16.74 18.76 20.05 19.57 14.42<br />
+Adjusted drawdowns result from correl<strong>at</strong>ion with river stage d<strong>at</strong>a (see text)<br />
* Piezometer/R<strong>at</strong>e reading within 5 minutes of indic<strong>at</strong>ed time
<strong>Ground</strong>-W<strong>at</strong>er Investig<strong>at</strong>ion <strong>at</strong> <strong>Mount</strong> <strong>Carmel</strong><br />
Second Long-Term Test—Test Well 2 (Continued)<br />
June 28-July 7,1993<br />
Pumped Test Well 2 Observ<strong>at</strong>ion Well 1 Observ<strong>at</strong>ion Well 2 Observ<strong>at</strong>ion Well 3 Observ<strong>at</strong>ion Well 4<br />
D<strong>at</strong>e/ Elapsed Depth to Drawdown Depth to Drawdown Depth to Drawdown Depth to Drawdown Depth to Drawdown Piez<br />
Hour lime W<strong>at</strong>er Obs Adj+ W<strong>at</strong>er Obs Adj+ W<strong>at</strong>er Obs Adj+ W<strong>at</strong>er Obs Adj+ W<strong>at</strong>er Obs Adj+ Head R<strong>at</strong>e Remarks<br />
(min) (ft) (ft) (ft) (ft) (ft) (ft) (ft) (ft) (ft) (ft) (ft) (ft) (ft) (ft) (ft) (ft) (gpm)<br />
04:02 AM 0.0 16.73 18.76 20.04 19.57 14.42<br />
05:02 AM 0.0 16.74 18.76 20.05 19.58 14.42<br />
06:02 AM 0.0 16.72 18.76 20.04 19.57 14.41<br />
07:02 AM 0.0 16.71 18.76 20.04 19.57 14.41<br />
08:02 AM 0.0 16.71 18.74 20.04 19.56 14.33<br />
09:02 AM 0.0 16.72 18.75 20.03 19.56 14.45<br />
09:12 AM 0.0 16.71 18.74 20.03 19.56 14.40<br />
09:22 AM 0.0 16.72 18.74 20.03 19.56 14.42<br />
09:32 AM 0.0 16.72 18.75 20.03 19.56 14.45<br />
09:42 AM 0.0 16.72 18.74 20.03 19.56 14.37<br />
09:52 AM 0.0 16.73 18.75 20.04 19.57 14.48<br />
10:01 AM 0.0 16.72 18.74 20.03 19.57 14.35 Omnid<strong>at</strong>a changed to<br />
10:02 AM 0.0 16.72 18.74 20.04 19.57 14.34 1 minute logging<br />
10:03 AM 0.0 16.72 18.74 20.03 19.57 14.33<br />
10:04 AM 0.0 16.72 18.74 20.03 19.56 14.32<br />
10:05 AM 0.0 16.72 18.73 20.03 19.56 14.30<br />
10:06 AM 0.0 16.72 18.74 20.03 19.57 14.32<br />
10:07 AM<br />
10:08 AM<br />
0.0<br />
0.0<br />
16.72<br />
16.72<br />
18.74<br />
18.74<br />
20.03<br />
20.03<br />
19.57<br />
19.56<br />
14.36<br />
14.37<br />
10.09 AM 0.0 16.72 18.74 20.03 19.56 14.38<br />
10:09 AM 0.0 14.52 Steel tape measurement<br />
10:10 AM 0.0 16.72 18.74 20.03 19.56 14.40<br />
10:11 AM 0.0 16.72 18.74 20.03 19.56 14.38<br />
10:11 AM 0.0 16.72 Steel tape measurement<br />
10:12 AM 0.0 16.72 18.74 20.03 19.56 14.42<br />
10:12 AM 0.0 18.74 Steel tape measurement<br />
10:13AM 0.0 16.72 18.74 20.03 19.56 14.46<br />
10:14 AM 0.0 16.72 18.74 20.02 19.57 14.47<br />
10:15 AM 0.0 16.72 18.74 20.08 19.56 14.47<br />
10:15 AM 0.0 20.04 Steel tape measurement<br />
10:16 AM 0.0 16.72 18.74 20.03 19.57 14.47<br />
10:17 AM 0.0 16.70 18.66 20.14 19.51 14.61<br />
10:17 AM 0.0 19.58 Steel tape measurement<br />
10:18 AM 0.0 16.72 18.74 20.03 19.56 14.49<br />
10:19 AM 0.0 16.72 18.74 20.03 19.56 14.48<br />
10:20 AM 0.0 16.72 18.74 20.03 19.56 14.48<br />
10:21 AM 0.0 16.72 18.74 20.03 19.56 14.47<br />
10:22 AM 0.0 16.72 18.74 20.03 19.56 14.47<br />
10:23 AM 0.0 16.72 18.74 20.03 19.56 14.46<br />
10:24 AM 0.0 16.72 18.74 20.02 19.56 14.43<br />
10:25 AM 0.0 18.76 20.04 19.57<br />
10:26 AM 0.0 18.76 20.04 19.57<br />
10:27 AM 0.0 18.76 20.04 19.57<br />
10:28 AM 0.0 20.05 19.58<br />
10:29 AM 0.0 20.05 19.58 End Omnid<strong>at</strong>a logging<br />
10:30 AM 0.0<br />
10:31 AM 0.0<br />
+Adjusted drawdowns result from correl<strong>at</strong>ion with river stage d<strong>at</strong>a (see text)<br />
* Piezometer/R<strong>at</strong>e reading within 5 minutes of indic<strong>at</strong>ed time
<strong>Ground</strong>-W<strong>at</strong>er Investig<strong>at</strong>ion <strong>at</strong> <strong>Mount</strong> <strong>Carmel</strong><br />
Second Long-Term Test- -Test Well 2 (Continued)<br />
June 28-July 7,1993<br />
Pumped Test Well 2 Observ<strong>at</strong>ion Well 1 Observ<strong>at</strong>ion Well 2 Observ<strong>at</strong>ion Well 3 Observ<strong>at</strong>ion Well 4<br />
D<strong>at</strong>e/ Elapsed Depth to Drawdown Depth to Drawdown Depth to Drawdown Depth to Drawdown Depth to Drawlown Piez<br />
Hour time W<strong>at</strong>er Obs Adj+ W<strong>at</strong>er Obs Adj+ W<strong>at</strong>er Obs Adj+ W<strong>at</strong>er Obs Adj+ W<strong>at</strong>er Obs Adj+ Head R<strong>at</strong>e Remarks<br />
(min) (ft) (ft) (ft) (ft) (ft) (ft) (ft) (ft) (ft) (ft) (ft) (ft) (ft) (ft) (ft) (ft) (gpm)<br />
10:33 AM 0.0 16.66 18.71 20.01 19.57 14.46 McDAS started<br />
10:34 AM 1.0 16.63 18.70 20.00 19.57 14.44 W<strong>at</strong>er Level Trend<br />
10:35 AM 2.0<br />
3.0<br />
4.0<br />
5.0<br />
6.0<br />
16.64<br />
16.72<br />
16.72<br />
16.72<br />
16.72<br />
18.71<br />
18.74<br />
18.74<br />
18.74<br />
18.74<br />
20.01<br />
20.04<br />
20.04<br />
20.04<br />
20.05<br />
19.57<br />
19.58<br />
19.58<br />
19.58<br />
19.58<br />
14.47<br />
14.50<br />
14.52<br />
14.52<br />
14.49<br />
10:40 AM 7.0<br />
8.0<br />
9.0<br />
10:43 AM 10.1<br />
11.0<br />
10:45 AM 12.0<br />
13.0<br />
14.0<br />
15.0<br />
16.0<br />
10:50 AM 17.0<br />
18.0<br />
19.0<br />
20.0<br />
21.0<br />
10:55 AM 22.0<br />
23.0<br />
24.0<br />
25.0<br />
26.0<br />
16.72<br />
16.72<br />
16.72<br />
16.72<br />
16.72<br />
16.72<br />
16.72<br />
16.72<br />
16.72<br />
16.72<br />
16.72<br />
16.72<br />
16.73<br />
16.73<br />
16.73<br />
16.73<br />
16.73<br />
16.73<br />
16.73<br />
16.73<br />
18.73<br />
18.73<br />
18.73<br />
18.73<br />
18.73<br />
18.73<br />
18.74<br />
18.74<br />
18.74<br />
18.73<br />
18.74<br />
18.73<br />
18.73<br />
18.73<br />
18.74<br />
18.73<br />
18.73<br />
18.73<br />
18.73<br />
18.74<br />
20.04<br />
20.04<br />
20.04<br />
20.04<br />
20.04<br />
20.04<br />
20.04<br />
20.04<br />
20.04<br />
20.04<br />
20.04<br />
20.04<br />
20.04<br />
20.04<br />
20.05<br />
20.04<br />
20.04<br />
20.04<br />
20.04<br />
20.05<br />
19.58<br />
19.58<br />
19.58<br />
19.58<br />
19.58<br />
19.58<br />
19.58<br />
19.58<br />
19.58<br />
19.58<br />
19.58<br />
19.58<br />
19.58<br />
19.58<br />
19.58<br />
19.58<br />
19.58<br />
19.59<br />
19.59<br />
19.59<br />
14.46<br />
14.41<br />
14.42<br />
14.43<br />
14.44<br />
14.44<br />
14.46<br />
14.48<br />
14.48<br />
14.44<br />
14.47<br />
14.48<br />
14.48<br />
14.48<br />
14.48<br />
14.44<br />
14.45<br />
14.46<br />
14.47<br />
14.49<br />
11:00 AM 27.0<br />
28.0<br />
29.0<br />
16.74<br />
16.74<br />
16.73<br />
18.74<br />
18.74<br />
18.74<br />
20.05<br />
20.04<br />
20.04<br />
19.59<br />
19.59<br />
19.59<br />
14.50<br />
14.48<br />
14.46<br />
11:03 AM 30.0 16.73 18.73 20.04 19.59 14.43<br />
11:16 AM 43.0 16.61 18.69 20.00 19.57 14.45<br />
11:17 AM 44.0 16.61<br />
18.69<br />
20.00<br />
19.57<br />
14.44<br />
45.0 16.61<br />
18.68<br />
19.99<br />
19.57<br />
14.42<br />
46.0 16.61<br />
18.68<br />
19.99<br />
19.57<br />
14.40<br />
11:20 AM 47.0<br />
48.0<br />
49.0<br />
50.0<br />
51.0<br />
11:25 AM 52.0<br />
53.0<br />
54.0<br />
16.61<br />
16.61<br />
16.62<br />
16.62<br />
16.63<br />
16.74<br />
16.74<br />
16.74<br />
18.68<br />
18.68<br />
18.68<br />
18.69<br />
18.68<br />
18.74<br />
18.74<br />
18.74<br />
19.99<br />
19.99<br />
19.99<br />
19.99<br />
20.00<br />
20.04<br />
20.04<br />
20.04<br />
11:28 AM 55.0 16.74<br />
18.74<br />
20.04<br />
19.59<br />
14.50<br />
55.4 16.74<br />
18.74<br />
20.04<br />
19.59<br />
14.50<br />
11:29 AM<br />
11:30 AM 0.000 0.00 0.00 18.73 -0.01 -0.01 20.04 0.00 0.00 19.59 0.00 0.00 14.47 -0.03 0.00 Pump ON<br />
19.57<br />
19.57<br />
19.57<br />
19.57<br />
19.57<br />
19.59<br />
19.59<br />
19.59<br />
14.39<br />
14.38<br />
14.39<br />
14.40<br />
14.40<br />
14.48<br />
14.51<br />
14.51<br />
+Adjusted drawdowns result from correl<strong>at</strong>ion with river stage d<strong>at</strong>a (see text)<br />
*Piezometer/R<strong>at</strong>e reading within 5 minutes of indic<strong>at</strong>ed time
<strong>Ground</strong>-W<strong>at</strong>er Investig<strong>at</strong>ion <strong>at</strong> <strong>Mount</strong> <strong>Carmel</strong><br />
Second Long-Term Test—Test Well 2 (Continued)<br />
June 28-July 7,1993<br />
Pumped Test Well 2 Observ<strong>at</strong>ion Well 1 Observ<strong>at</strong>ion Well 2 Observ<strong>at</strong>ion Well 3 Observ<strong>at</strong>ion Well 4<br />
D<strong>at</strong>e/ Elapsed Depth to Drawdown Depth to Drawdown Depth to Drawdown Depth to Drawdown Depth to Drawdown Piez<br />
Hour time W<strong>at</strong>er Obs Adj+ W<strong>at</strong>er Obs Adj+ W<strong>at</strong>er Obs Adj+ W<strong>at</strong>er Obs Adj+ W<strong>at</strong>er Obs Adj+ Head R<strong>at</strong>e Remarks<br />
(win) (ft) (ft) (ft) (ft) (ft) (ft) (ft) (ft) (ft) (ft) (ft) (ft) (ft) (ft) (ft) (ft) (gpm)<br />
0.001 17.71 0.97 0.96 18.74 0.00 0.00 20.04 0.00 0.00 19.59 0.00 0.00 14.46 -0.04 -0.01<br />
0.002 18.32 1.58 1.56 18.74 0.00 0.00 20.04 0.00 0.00 19.59 0.00 0.00 14.47 -0.03 0.00<br />
0.003 18.91 2.17 2.13 18.74 0.00 0.00 20.04 0.00 0.00 19.59 0.00 0.00 14.46 -0.04 -0.01<br />
0.004 19.39 2.65 2.58 18.73 -0.01 -0.01 20.04 0.00 0.00 19.59 0.00 0.00 14.47 -0.03 0.00<br />
0.005 19.63 2.89 2.81 18.74 0.00 0.00 20.04 0.00 0.00 19.59 0.00 0.00 14.47 -0.03 0.00<br />
0.005 19.70 2.96 2.88 18.74 0.00 0.00 20.05 0.01 0.01 19.59 0.00 0.00 14.47 -0.03 0.00<br />
0.006 19.71 2.97 2.89 18.74 0.00 0.00 20.04 0.00 0.00 19.59 0.00 0.00 14.47 -0.03 0.00<br />
0.007 19.49 2.75 2.68 18.73 -0.01 -0.01 20.04 0.00 0.00 19.59 0.00 0.00 14.46 -0.04 -0.01<br />
0.008 19.22 2.48 2.42 18.73 -0.01 -0.01 20.04 0.00 0.00 19.59 0.00 0.00 14.46 -0.04 -0.01<br />
0.009 18.95 2.21 2.16 18.74 0.00 0.00 20.04 0.00 0.00 19.59 0.00 0.00 14.46 -0.04 -0.01<br />
0.010 18.85 2.11 2.07 18.74 0.00 0.00 20.05 0.01 0.01 19.59 0.00 0.00 14.47 -0.03 0.00<br />
0.011 18.65 1.91 1.88 18.74 0.00 0.00 20.04 0.00 0.00 19.59 0.00 0.00 14.47 -0.03 0.00<br />
0.015 18.15 1.41 1.39 18.74 0.00 0.00 20.05 0.01 0.01 19.59 0.00 0.00 14.47 -0.03 0.00<br />
0.020 18.24 1.50 1.48 18.74 0.00 0.00 20.04 0.00 0.00 19.59 0.00 0.00 14.47 -0.03 0.00<br />
0.025 18.53 1.79 1.76 18.74 0.00 0.00 20.05 0.01 0.01 19.59 0.00 0.00 14.47 -0.03 0.00<br />
0.030 18.88 2.14 2.10 18.74 0.00 0.00 20.05 0.01 0.01 19.59 0.00 0.00 14.47 -0.03 0.00<br />
0.035 19.61 2.87 2.79 18.75 0.01 0.01 20.04 0.00 0.00 19.59 0.00 0.00 14.47 -0.03 0.00<br />
0.040 20.09 3.35 3.24 18.75 0.01 0.01 20.05 0.01 0.01 19.59 0.00 0.00 14.47 -0.03 0.00<br />
0.045 20.35 3.61 3.49 18.76 0.02 0.02 20.05 0.01 0.01 19.59 0.00 0.00 14.48 -0.02 0.01<br />
0.051 20.54 3.80 3.66 18.76 0.02 0.02 20.05 0.01 0.01 19.59 0.00 0.00 14.48 -0.02 0.01<br />
0.055 20.78 4.04 3.89 18.76 0.02 0.02 20.05 0.01 0.01 19.59 0.00 0.00 14.47 -0.03 0.00<br />
0.060 20.84 4.10 3.94 18.77 0.03 0.03 20.05 0.01 0.01 19.59 0.00 0.00 14.47 -0.03 0.00<br />
0.071 21.19 4.45 4.26 18.79 0.05 0.05 20.05 0.01 0.01 19.59 0.00 0.00 14.48 -0.02 0.01<br />
0.081 21.45 4.71 4.50 18.80 0.06 0.06 20.06 0.02 0.02 19.59 0.00 0.00 14.49 -0.01 0.02<br />
0.091 21.68 4.94 4.71 18.81 0.07 0.07 20.06 0.02 0.02 19.59 0.00 0.00 14.49 -0.01 0.02<br />
0.10 21.86 5.12 4.87 18.83 0.09 0.09 20.06 0.02 0.02 19.60 0.01 0.01 14.49 -0.01 0.02<br />
0.12 22.24 5.50 5.21 18.86 0.12 0.12 20.07 0.03 0.03 19.59 0.00 0.00 14.50 0.00 0.03<br />
0.14 22.42 5.68 5.38 18.90 0.16 0.16 20.07 0.03 0.03 19.60 0.01 0.01 14.51 0.01 0.04<br />
0.16 22.57 5.83 5.51 18.92 0.18 0.18 20.08 0.04 0.04 19.60 0.01 0.01 14.52 0.02 0.05<br />
0.16 22.69 5.95 5.62 18.93 0.19 0.19 20.09 0.05 0.05 19.59 0.00 0.00 14.52 0.02 0.05<br />
0.17 22.76 6.02 5.68 18.94 0.20 0.20 20.09 0.05 0.05 19.60 0.01 0.01 14.52 0.02 0.05<br />
0.18 22.73 5.99 5.65 18.96 0.22 0.22 20.09 0.05 0.05 19.60 0.01 0.01 14.52 0.02 0.05<br />
0.19 22.79 6.05 5.70 18.98 0.24 0.24 20.10 0.06 0.06 19.59 0.00 0.00 14.53 0.03 0.06<br />
0.20 22.87 6.13 5.78 18.99 0.25 0.25 20.09 0.05 0.05 19.60 0.01 0.01 14.54 0.04 0.07<br />
0.20 22.91 6.17 5.81 19.00 0.26 0.26 20.09 0.05 0.05 19.60 0.01 0.01 14.53 0.03 0.06<br />
0.22 23.02 6.28 5.91 19.02 0.28 0.28 20.10 0.06 0.06 19.60 0.01 0.01 14.54 0.04 0.07<br />
0.24 23.14 6.40 6.01 19.04 0.30 0.30 20.10 0.06 0.06 19.60 0.01 0.01 14.55 0.05 0.08<br />
0.26 23.23 6.49 6.09 19.07 0.33 0.33 20.11 0.07 0.07 19.60 0.01 0.01 14.55 0.05 0.08<br />
0.28 23.33 6.59 6.18 19.09 0.35 0.35 20.12 0.08 0.08 19.60 0.01 0.01 14.55 0.05 0.08<br />
0.30 23.38 6.64 6.22 19.12 0.38 0.38 20.12 0.08 0.08 19.60 0.01 0.01 14.56 0.06 0.09<br />
0.35 23.48 6.74 6.31 19.17 0.43 0.43 20.14 0.10 0.10 19.60 0.01 0.01 14.57 0.07 0.10<br />
0.41 23.61 6.87 6.42 19.21 0.47 0.47 20.15 0.11 0.11 19.61 0.02 0.02 14.58 0.08 0.11<br />
0.46 23.75 7.01 6.55 19.25 0.51 0.51 20.16 0.12 0.12 19.61 0.02 0.02 14.60 0.10 0.13<br />
0.50 23.83 7.09 6.62 19.28 0.54 0.54 20.18 0.14 0.14 19.61 0.02 0.02 14.60 0.10 0.13<br />
0.55 23.85 7.11 6.63 19.32 0.58 0.58 20.18 0.14 0.14 19.61 0.02 0.02 14.61 0.11 0.14<br />
0.60 23.91 7.17 6.69 19.36 0.62 0.62 20.19 0.15 0.15 19.61 0.02 0.02 14.63 0.13 0.16<br />
0.65 23.96 7.22 6.73 19.38 0.64 0.64 20.21 0.17 0.17 19.62 0.03 0.03 14.63 0.13 0.16<br />
+Adjusted drawdowns result from correl<strong>at</strong>ion with river stage d<strong>at</strong>a (see text)<br />
*Piezometer/R<strong>at</strong>e reading within 5 minutes of indic<strong>at</strong>ed time
<strong>Ground</strong>-W<strong>at</strong>er Investig<strong>at</strong>ion <strong>at</strong> <strong>Mount</strong> <strong>Carmel</strong><br />
Second Long-Term Test—Test Well 2 (Continued)<br />
June 28-July 7,1993<br />
Pumped Test Well 2 Observ<strong>at</strong>ion Well 1 Observ<strong>at</strong>ion Well 2 Observ<strong>at</strong>ion Well 3 Observ<strong>at</strong>ion Well 4<br />
D<strong>at</strong>e/ Elapsed Depth to Drawdown Depth to Drawdown Depth to Drawdown Depth to Drawdown Depth to Drawdown Piez<br />
Hour time W<strong>at</strong>er Obs Adj+ Wafer Obs Adj+ Wafer Obs Adj+ Wafer Obs Adj+ Wafer Obs Adj+ Head R<strong>at</strong>e Remarks<br />
(min) (ft) (ft) (ft) (ft) (ft) (ft) (ft) (ft) (ft) (ft) (ft) (ft) (ft) (ft) (ft) (ft) (gpm)<br />
0.70 24.05 7.31 6.81 19.40 0.66 0.66 20.22 0.18 0.18 19.62 0.03 0.03 14.64 0.14 0.17<br />
0.75 24.06 7.32 6.81 19.43 0.69 0.69 20.23 0.19 0.19 19.62 0.03 0.03 14.65 0.15 0.18<br />
0.80 24.18 7.44 6.92 19.46 0.72 0.72 20.23 0.19 0.19 19.62 0.03 0.03 14.66 0.16 0.19<br />
0.90 24.24 7.50 6.97 19.50 0.76 0.76 20.25 0.21 0.21 19.62 0.03 0.03 14.67 0.17 0.20<br />
11:31 AM 1.0 24.37 7.63 7.08 19.55 0.81 0.81 20.27 0.23 0.23 19.63 0.04 0.04 14.70 0.20 0.23 2.72 897<br />
1.2 24.50 7.76 7.19 19.62 0.88 0.88 20.30 0.26 0.26 19.63 0.04 0.04 14.72 0.22 0.25<br />
1.4 24.66 7.92 7.33 19.69 0.95 0.95 20.33 0.29 0.29 19.64 0.05 0.05 14.76 0.26 0.29<br />
1.6 24.73 7.99 7.39 19.74 1.00 1.00 20.36 0.32 0.32 19.65 0.06 0.06 14.78 0.28 0.31<br />
1.8 24.83 8.09 7.47 19.80 1.06 1.06 20.38 0.34 0.34 19.65 0.06 0.06 14.81 0.31 0.34<br />
2.0 24.90 8.16 7.53 19.85 1.11 1.11 20.41 0.37 0.37 19.66 0.07 0.07 14.84 0.34 0.37<br />
2.2 24.95 8.21 7.57 19.88 1.14 1.14 20.42 0.38 0.38 19.66 0.07 0.07 14.85 0.35 0.38<br />
2.5 25.04 8.30 7.65 19.93 1.19 1.19 20.45 0.41 0.41 19.67 0.08 0.08 14.89 0.39 0.42<br />
3.0 25.18 8.44 7.77 20.01 1.27 1.27 20.49 0.45 0.45 19.68 0.09 0.09 14.93 0.43 0.46 2.72 897<br />
4.0 25.34 8.60 7.90 20.12 1.38 1.38 20.55 0.51 0.51 19.70 0.11 0.11 14.99 0.49 0.52<br />
11:35 AM 5.0 25.45 8.71 7.99 20.20 1.46 1.46 20.60 0.56 0.56 19.71 0.12 0.12 15.03 0.53 0.56 2.70 895<br />
6.0 25.48 8.74 8.02 20.25 1.51 1.51 20.63 0.59 0.59 19.73 0.14 0.14 15.07 0.57 0.60<br />
7.1 25.53 8.79 8.06 20.29 1.55 1.55 20.66 0.62 0.62 19.74 0.15 0.15 15.10 0.60 0.63<br />
8.0 25.56 8.82 8.09 20.31 1.57 1.57 20.67 0.63 0.63 19.74 0.15 0.15 15.13 0.63 0.66 2.70 895<br />
8.9 25.58 8.84 8.10 20.33 1.59 1.59 20.69 0.65 0.65 19.75 0.16 0.16 15.12 0.62 0.65<br />
11:40 AM 10.0 25.62 8.88 8.14 20.34 1.60 1.60 20.70 0.66 0.66 19.76 0.17 0.17 15.12 0.62 0.65 2.70 895<br />
11.0 25.65 8.91 8.16 20.35 1.61 1.61 20.71 0.67 0.67 19.76 0.17 0.17 15.08 0.58 0.61<br />
12.0 25.64 8.90 8.15 20.36 1.62 1.62 20.71 0.67 0.67 19.76 0.17 0.17 15.10 0.60 0.63<br />
12.9 25.66 8.92 8.17 20.37 1.63 1.63 20.72 0.68 0.68 19.77 0.18 0.18 15.14 0.64 0.67<br />
14.1 25.66 8.92 8.17 20.38 1.64 1.64 20.73 0.69 0.69 19.77 0.18 0.18 15.17 0.67 0.70 2.70 895<br />
11:45 AM 15.1 25.68 8.94 8.19 20.39 1.65 1.65 20.73 0.69 0.69 19.77 0.18 0.18 15.18 0.68 0.71<br />
16.2 25.69 8.95 8.19 20.40 1.66 1.66 20.74 0.70 0.70 19.78 0.19 0.19 15.17 0.67 0.70<br />
18.1 25.71 8.97 8.21 20.40 1.66 1.66 20.75 0.71 0.71 19.78 0.19 0.19 15.16 0.66 0.69 2.68 893<br />
11:50 AM 19.9 25.72 8.98 8.22 20.41 1.67 1.67 20.75 0.71 0.71 19.79 0.20 0.20 15.20 0.70 0.73 2.70 895<br />
21.8 25.75 9.01 8.24 20.42 1.68 1.68 20.76 0.72 0.72 19.79 0.20 0.20 15.21 0.71 0.74<br />
11:54 AM 23.9 25.80 9.06 8.29 20.43 1.69 1.69 20.77 0.73 0.73 19.79 0.20 0.20 15.22 0.72 0.75<br />
11:55 AM 25.0 25.81 9.07 8.29 20.44 1.70 1.70 20.77 0.73 0.73 19.80 0.21 0.21 15.22 0.72 0.75 2.68 891<br />
26.1 25.82 9.08 8.30 20.45 1.71 1.71 20.78 0.74 0.74 19.80 0.21 0.21 15.21 0.71 0.74<br />
28.0 25.86 9.12 8.34 20.46 1.72 1.72 20.79 0.75 0.75 19.80 0.21 0.21 15.23 0.73 0.76<br />
12:00 PM 30.0 25.87 9.13 8.34 20.46 1.72 1.72 20.79 0.75 0.75 19.81 0.22 0.22 15.21 0.71 0.74 2.68 891<br />
35.2 25.93 9.19 8.39 20.49 1.75 1.75 20.81 0.77 0.77 19.81 0.22 0.22 15.27 0.77 0.80 2.68 891<br />
12:10 PM 40.4 25.97 9.23 8.43 20.51 1.77 1.77 20.82 0.78 0.78 19.82 0.23 0.23 15.33 0.83 0.86 2.68 891<br />
45.3 26.00 9.26 8.45 20.52 1.78 1.78 20.83 0.79 0.79 19.83 0.24 0.24 15.29 0.79 0.82 2.68 891<br />
12:20 PM 49.8 26.03 9.29 8.48 20.53 1.79 1.79 20.85 0.81 0.81 19.84 0.25 0.25 15.25 0.75 0.78<br />
54.6 26.05 9.31 8.49 20.54 1.80 1.80 20.86 0.82 0.82 19.85 0.26 0.26 15.32 0.82 0.85 2.68 891 W<strong>at</strong>er sample collected,<br />
12:30 PM 59.8 26.08 9.34 8.52 20.56 1.82 1.82 20.87 0.83 0.83 19.85 0.26 0.26 15.31 0.81 0.84 T=55F (electronic)<br />
65.6 26.11 9.37 8.54 20.58 1.84 1.84 20.88 0.84 0.84 19.86 0.27 0.27 15.39 0.89 0.92 2.68 891<br />
12:40 PM 70.3 26.13 9.39 8.56 20.59 1.85 1.85 20.89 0.85 0.85 19.87 0.28 0.28 15.39 0.89 0.92 River temper<strong>at</strong>ure, T=71<br />
75.3 26.16 9.42 8.58 20.60 1.86 1.86 20.90 0.86 0.86 19.87 0.28 0.28 15.38 0.88 0.91 2.68 891<br />
12:50 PM 80.7 26.18 9.44 8.60 20.61 1.87 1.87 20.91 0.87 0.87 19.88 0.29 0.29 15.44 0.94 0.97<br />
84.4 26.19 9.45 8.61 20.63 1.89 1.89 20.92 0.88 0.88 19.88 0.29 0.29 15.45 0.95 0.98<br />
01:00 PM 90.4 26.23 9.49 8.64 20.64 1.90 1.90 20.93 0.89 0.89 19.89 0.30 0.30 15.47 0.97 1.00 2.67 889<br />
94.4 26.24 9.50 8.65 20.65 1.91 1.91 20.94 0.90 0.90 19.89 0.30 0.30 15.49 0.99 1.02<br />
+Adjusted drawdowns result from correl<strong>at</strong>ion with river stage d<strong>at</strong>a (see text)<br />
*Piezometer/R<strong>at</strong>e reading within 5 minutes of indic<strong>at</strong>ed lime
<strong>Ground</strong>-W<strong>at</strong>er Investig<strong>at</strong>ion <strong>at</strong> <strong>Mount</strong> <strong>Carmel</strong><br />
Second Long-Term Test—Test Well 2 (Continued)<br />
June 28-July7,1993<br />
Pumped Test Wei 1 2 Observ<strong>at</strong>ion Well 1 Observ<strong>at</strong>ion Well 2 Observ<strong>at</strong>ion Well 3 Observ<strong>at</strong>ion Well 4<br />
D<strong>at</strong>e/ Elapsed Depth to Drawdown Depth to Drawdown Depth to Drawdown Depth to Drawdown Depth to Drandown Piez<br />
Hour time W<strong>at</strong>er Obs Adj+ W<strong>at</strong>er Obs Adj+ W<strong>at</strong>er Obs Adj+ W<strong>at</strong>er Obs Adj+ W<strong>at</strong>er Obs Adj+ Head R<strong>at</strong>e Remarks<br />
(min) (ft) (ft) (ft) (ft) (ft) (ft) (ft) (ft) (ft) (ft) (ft) (ft) (ft) (ft) (ft) (ft) (gpm)<br />
100.4 26.26 9.52 8.66 20.66 1.92 1.92 20.94 0.90 0.90 19.90 0.31 0.31 15.50 1.00 1.03<br />
110.4 26.30 9.56 8.70 20.67 1.93 1.93 20.96 0.92 0.92 19.91 0.32 0.32 15.45 0.95 0.98<br />
01:30 PM 120.4 26.33 9.59 8.72 20.72 1.98 1.98 20.98 0.94 0.94 19.92 0.33 0.33 15.60 1.10 1.13 2.67 889<br />
130.4 26.36 9.62 8.75 20.71 1.97 1.97 20.99 0.95 0.95 19.93 0.34 0.34 15.51 1.01 1.04<br />
140.4 26.38 9.64 8.76 20.74 2.00 2.00 21.00 0.96 0.96 19.94 0.35 0.35 15.61 1.11 1.14<br />
02:00 PM 150.4<br />
151.0<br />
26.46 9.72 8.83<br />
0.00<br />
20.74 2.00 2.00 21.02 0.98 0.98<br />
0.98<br />
19.95 0.36 0.36 15.56 1.06 1.09 2.67<br />
2.70<br />
889 Adjust r<strong>at</strong>e<br />
895<br />
160.4 26.49 9.75 8.85 20.76 2.02 2.02 21.03 0.99 0.99 19.96 0.37 0.37 15.59 1.09 1.12<br />
161.4 26.49 9.75 8.85 20.77 2.03 2.03 21.03 0.99 0.99 19.96 0.37 0.37 15.59 1.09 1.12<br />
16Z4 26.50 9.76 8.86 20.77 2.03 2.03 21.04 1.00 1.00 19.96 0.37 0.37 15.59 1.09 1.12<br />
163.4 26.50 9.76 8.86 20.77 2.03 2.03 21.04 1.00 1.00 19.96 0.37 0.37 15.59 1.09 1.12<br />
164.4 26.50 9.76 8.86 20.77 2.03 2.03 21.04 1.00 1.00 19.96 0.37 0.37 15.61 1.11 1.14<br />
165.4 26.51 9.77 8.87 20.78 2.04 2.04 21.04 1.00 1.00 19.96 0.37 0.37 15.63 1.13 1.16<br />
166.4 26.51 9.77 8.87 20.78 2.04 2.04 21.04 1.00 1.00 19.96 0.37 0.37 15.63 1.13 1.16<br />
167.4 26.51 9.77 8.87 20.78 2.04 2.04 21.04 1.00 1.00 19.% 0.37 0.37 15.65 1.15 1.18<br />
16a4 26.51 9.77 8.87 20.79 2.05 2.05 21.04 1.00 1.00 19.% 0.37 0.37 15.67 1.17 1.20<br />
169.4 26.51 9.77 8.87 20.79 2.05 2.05 21.04 1.00 1.00 19.% 0.37 0.37 15.65 1.15 1.18<br />
02:20 PM 170.4 26.53 9.79 8.89 20.79 2.05 2.05 21.05 1.01 1.01 19.97 0.38 0.38 15.66 1.16 1.19<br />
171.4 26.53 9.79 8.89 20.79 2.05 2.06 21.05 1.01 1.02 19.97 0.38 0.39 15.66 1.16 1.20<br />
172.4 26.52 9.78 8.89 20.80 2.06 2.07 21.04 1.00 1.01 19.97 0.38 0.39 15.68 1.18 1.22<br />
173.4 26.52 9.78 8.89 20.80 2.06 2.07 21.05 1.01 1.02 19.97 0.38 0.39 15.68 1.18 1.22<br />
174.4 26.53 9.79 8.89 20.79 2.05 2.06 21.05 1.01 1.02 19.97 0.38 0.39 15.63 1.13 1.17<br />
02:25 PM 175 End McDAS logging<br />
02:28 PM<br />
02:29 PM<br />
178<br />
179 20.81 2.07 2.08 Omnid<strong>at</strong>a logging<br />
0230 PM<br />
02:31 PM<br />
180<br />
181<br />
26.53<br />
26.53<br />
9.79<br />
9.79<br />
8.89<br />
8.89<br />
20.80<br />
20.80<br />
2.06<br />
2.06<br />
2.07<br />
2.07<br />
21.06<br />
21.06<br />
1.02<br />
1.02<br />
1.03<br />
1.03<br />
19.98<br />
19.98<br />
0.39<br />
0.39<br />
0.40<br />
0.40<br />
15.61<br />
15.62<br />
1.11<br />
1.12<br />
1.15<br />
1.16<br />
02:32 PM 182 26.53 9.79 8.89 20.80 2.06 2.07 21.06 1.02 1.03 19.98 0.39 0.40 15.63 1.13 1.17<br />
02:33 PM 183 26.54 9.80 8.90 20.80 2.06 2.07 21.06 1.02 1.03 19.98 0.39 0.40 15.65 1.15 1.19<br />
02:34 PM 184 26.54 9.80 8.90 20.80 2.06 2.07 21.06 1.02 1.03 19.98 0.39 0.40 15.66 1.16 1.20<br />
02:35 PM<br />
02:36 PM<br />
185<br />
186<br />
26.53<br />
26.54<br />
9.79<br />
9.80<br />
8.89<br />
8.90<br />
20.80<br />
20.81<br />
2.06<br />
2.07<br />
2.07<br />
2.08<br />
21.06<br />
21.06<br />
1.02<br />
1.02<br />
1.03<br />
1.03<br />
19.98<br />
19.98<br />
0.39<br />
0.39<br />
0.40<br />
0.40<br />
15.65<br />
15.66<br />
1.15<br />
1.16<br />
1.19<br />
1.20<br />
2.71 896<br />
02:37 PM 187 26.55 9.81 8.91 20.81 2.07 2.08 21.06 1.02 1.03 19.98 0.39 0.40 15.68 1.18 1.22<br />
02:38 PM 188 26.54 9.80 8.90 20.81 2.07 2.08 21.06 1.02 1.03 19.99 0.40 0.41 15.68 1.18 1.22<br />
02:39 PM 189 26.55 9.81 8.91 20.81 2.07 2.08 21.07 1.03 1.04 19.99 0.40 0.41 15.67 1.17 1.21<br />
02:40 PM 190 26.54 9.80 8.90 20.81 2.07 2.08 21.07 1.03 1.04 19.99 0.40 0.41 15.66 1.16 1.20<br />
02:41 PM 191 26.55 9.81 8.92 20.81 2.07 2.09 21.07 1.03 1.05 19.99 0.40 0.42 15.66 1.16 1.21<br />
02:42 PM 192 26.54 9.80 8.91 20.81 2.07 2.09 21.07 1.03 1.05 19.99 0.40 0.42 15.66 1.16 1.21<br />
02:43 PM 193 26.55 9.81 8.92 20.81 2.07 2.09 21.07 1.03 1.05 19.99 0.40 0.42 15.65 1.15 1.20<br />
02:44 PM 194 26.54 9.80 8.91 20.82 2.08 2.10 21.07 1.03 1.05 19.99 0.40 0.42 15.63 1.13 1.18<br />
02:45 PM 195 26.55 9.81 8.92 20.82 2.08 2.10 21.07 1.03 1.05 19.99 0.40 0.42 15.63 1.13 1.18<br />
02:46 PM 196 26.56 9.82 8.93 20.82 2.08 2.10 21.08 1.04 1.06 19.99 0.40 0.42 15.63 1.13 1.18<br />
02:47 PM 197 26.55 9.81 8.92 20.82 2.08 2.10 21.08 1.04 1.06 19.99 0.40 0.42 15.63 1.13 1.18<br />
02:52 PM 202 0.00 —<br />
03:00 PM 210 26.57 9.83 8.93 20.84 2.10 2.12 21.09 1.05 1.07 20.00 0.41 0.43 15.62 1.12 1.17<br />
2.70 895<br />
03:10 PM 220 26.59 9.85 8.95 20.85 2.11 2.13 21.10 1.06 1.08 20.00 0.41 0.43 15.69 1.19 1.24<br />
03:15 PM 225 0.00 - 2.68 891<br />
+Adjusted drawdowns result from correl<strong>at</strong>ion with river stage d<strong>at</strong>a (see text)<br />
*Piezometer/R<strong>at</strong>e reading within 5 minutes of indic<strong>at</strong>ed time
<strong>Ground</strong>-W<strong>at</strong>er Investig<strong>at</strong>ion <strong>at</strong> <strong>Mount</strong> <strong>Carmel</strong><br />
Second Long-Term Test- -Test Well 2 (Continued)<br />
June 28-July 7,1993<br />
Pumped Test Well 2 Observ<strong>at</strong>ion Well 1 Observ<strong>at</strong>ion Well 2 Observ<strong>at</strong>ion Well 3 Observ<strong>at</strong>ion Well 4<br />
D<strong>at</strong>e/ Elapsed Depth to Drawdown Depth to Drawdown Depth to Drawdown Depth to Drawdown Depth to Drawdown Piez<br />
Hour time W<strong>at</strong>er Obs Adj+ W<strong>at</strong>er Obs Adj+ W<strong>at</strong>er Obs Adj+ W<strong>at</strong>er Obs Adj+ W<strong>at</strong>er Obs Adj+ Head R<strong>at</strong>e Remarks<br />
(min) (ft) (ft) (ft) (ft) (ft) (ft) (ft) (ft) (ft) (ft) (ft) (ft) (ft) (ft) (ft) (ft) (gpn)<br />
03:18 PM 228 0.00 — 15.66 1.16 1.21 Steel tape measurement<br />
03:19 PM 229 26.54 9.80 8.91 — Steel tape measurement<br />
03:20 PM 230 26.60 9.86 8.96 20.86 2.12 2.14 21.10 1.06 1.08 20.00 0.41 0.43 15.68 1.18 1.23<br />
03:21 PM 231 0.00 20.72 1.98 2.01 — 377.75 Steel tape measurement<br />
03:23 PM 233 0.00 21.04 1.00 1.03 377.75 Steel tape measurement<br />
03:24 PM 234 0.00 — 19.96 0.37 0.40 Steel tape measurement<br />
03:30 PM 240 26.61 9.87 8.97 20.87 2.13 2.16 21.11 1.07 1.10 20.00 0.41 0.44 15.70 1.20 1.26<br />
03:40 PM 250 26.62 9.88 8.98 20.88 2.14 2.17 21.12 1.08 1.11 20.01 0.42 0.45 15.72 1.22 1.28<br />
03:50 PM 260 26.63 9.89 9.00 20.88 2.14 2.18 21.13 1.09 1.13 20.01 0.42 0.46 15.72 1.22 1.29<br />
04:00 PM 270 26.64 9.90 9.01 20.90 2.16 2.20 21.14 1.10 1.14 20.01 0.42 0.46 15.73 1.23 1.30 2.68 891<br />
04:10 PM 280 26.66 9.92 9.02 20.91 2.17 2.21 21.14 1.10 1.14 20.02 0.43 0.47 15.76 1.26 1.33<br />
04:20 PM 290 26.67 9.93 9.03 20.90 2.16 2.20 21.15 1.11 1.15 20.02 0.43 0.47 15.77 1.27 1.34<br />
04:30 PM 300 26.69 9.95 9.06 20.92 2.18 2.23 21.15 1.11 1.16 20.02 0.43 0.48 15.77 1.27 1.35<br />
05:00 PM 330 26.71 9.97 9.07 20.93 2.19 2.24 21.17 1.13 1.18 20.03 0.44 0.49 15.80 1.30 1.38 2.68 891<br />
05:20 PM 350 26.74 10.00 9.10 20.95 2.21 2.26 21.18 1.14 1.19 20.03 0.44 0.49 15.81 1.31 1.39<br />
05:40 PM 370 26.76 10.02 9.12 20.95 2.21 2.27 21.19 1.15 1.21 20.03 0.44 0.50 15.83 1.33 1.42<br />
05:50 PM 380 26.77 10.03 9.14 20.95 2.21 2.28 21.20 1.16 1.23 20.04 0.45 0.52 15.84 1.34 1.44<br />
06:00 PM 390 26.77 10.03 9.14 20.96 2.22 2.29 21.20 1.16 1.23 20.04 0.45 0.52 15.85 1.35 1.45 2.68 891<br />
06:10 PM 400 26.79 10.05 9.15 20.97 2.23 2.30 21.21 1.17 1.24 20.04 0.45 0.52 15.86 1.36 1.46<br />
06:30 PM 420 26.79 10.05 9.15 20.98 2.24 2.31 21.22 1.18 1.25 20.04 0.45 0.52 15.86 1.36 1.46<br />
07:00 PM 450 26.81 10.07 9.18 21.00 2.26 2.34 21.23 1.19 1.27 20.05 0.46 0.54 15.89 1.39 1.50<br />
07:15 PM 465 -<br />
07:20 PM 470 26.82 10.08 9.19 21.00 2.26 2.35 21.24 1.20 1.29 20.05 0.46 0.55 15.90 1.40 1.52<br />
2.68 891<br />
07:50 PM 500 26.84 10.10 9.22 21.02 2.28 2.38 21.25 1.21 1.31 20.05 0.46 0.56 15.92 1.42 1.55<br />
08:00 PM 510 26.85 10.11 9.22 21.02 2.28 2.38 21.25 1.21 1.31 20.06 0.47 0.57 15.92 1.42 1.55 2.68 891<br />
08:10 PM 520 26.85 10.11 9.23 21.02 2.28 2.39 21.25 1.21 1.32 20.06 0.47 0.58 15.93 1.43 1.57<br />
08:30 PM 540 26.86 10.12 9.25 21.03 2.29 2.41 21.26 1.22 1.34 20.06 0.47 0.59 15.93 1.43 1.58<br />
08:50 PM 560 26.88 10.14 9.27 21.03 2.29 2.42 21.26 1.22 1.35 20.06 0.47 0.60 15.94 1.44 1.60<br />
09:00 PM 570 26.88 10.14 9.27 21.03 2.29 2.42 21.27 1.23 1.36 20.06 0.47 0.60 15.94 1.44 1.60 2.68 891<br />
09:10 PM 580 26.89 10.15 9.28 21.04 2.30 2.43 21.27 1.23 1.36 20.06 0.47 0.60 15.95 1.45 1.61<br />
09:30 PM 600 26.89 10.15 9.30 21.04 2.30 2.45 21.27 1.23 1.38 20.07 0.48 0.63 15.95 1.45 1.63<br />
09:50 PM 620 26.90 10.16 9.31 21.05 2.31 2.47 21.28 1.24 1.40 20.07 0.48 0.64 15.97 1.47 1.66<br />
10:00 PM 630 26.90 10.16 9.31 21.05 2.31 2.47 21.28 1.24 1.40 20.07 0.48 0.64 15.97 1.47 1.66 2.68 891<br />
10:10 PM 640 26.91 10.17 9.32 21.05 2.31 2.47 21.28 1.24 1.40 20.07 0.48 0.64 15.97 1.47 1.66<br />
10:30 PM 660 26.90 10.16 9.32 21.05 2.31 2.48 21.28 1.24 1.41 20.07 0.48 0.65 15.98 1.48 1.68<br />
10:50 PM 680 26.92 10.18 9.35 21.05 2.31 2.50 21.28 1.24 1.43 20.07 0.48 0.67 15.98 1.48 1.70<br />
11:00 PM 690 26.92 10.18 9.35 21.05 2.31 2.50 21.28 1.24 1.43 20.07 0.48 0.67 15.98 1.48 1.70 2.68 891<br />
11:10 PM 700 26.92 10.18 9.35 21.05 2.31 2.50 21.28 1.24 1.43 20.07 0.48 0.67 15.98 1.48 1.70<br />
11:30 PM 720 26.92 10.18 9.36 21.05 2.31 2.51 21.28 1.24 1.44 20.07 0.48 0.68 15.99 1.49 1.72<br />
11:50 PM 740 26.92 10.18 9.37 21.05 2.31 2.52 21.28 1.24 1.45 20.07 0.48 0.69 15.99 1.49 1.73<br />
07/01/93 - -<br />
12:00 AM 750 26.92 10.18 9.37 21.05 2.31 2.52 21.28 1.24 1.45 20.07 0.48 0.69 16.00 1.50 1.74 2.7 895 * Piezometer reading was<br />
12:10 AM 760 26.92 10.18 9.37 21.05 2.31 2.52 21.28 1.24 1.45 20.07 0.48 0.69 16.00 1.50 1.74 noted within 4 minutes<br />
12:30 AM 780 26.92 10.18 9.38 21.05 2.31 2.54 21.28 1.24 1.47 20.07 0.48 0.71 16.01 1.51 1.77 of indic<strong>at</strong>ed clock time<br />
12:50 AM 800 26.93 10.19 9.41 21.05 2.31 2.55 21.28 1.24 1.48 20.07 0.48 0.72 16.00 1.50 1.77<br />
01:00 AM 810 26.93 10.19 9.41 21.05 2.31 2.55 21.28 1.24 1.48 20.06 0.47 0.71 16.00 1.50 1.77<br />
01:10 AM 820 26.92 10.18 9.40 21.04 2.30 2.54 21.28 1.24 1.48 20.06 0.47 0.71 16.01 1.51 1.78<br />
+Adjusted drawdowns result from correl<strong>at</strong>ion with river stage d<strong>at</strong>a (see text)<br />
* Piezometer/R<strong>at</strong>e reading within 5 minutes of indic<strong>at</strong>ed time
<strong>Ground</strong>-W<strong>at</strong>er Investig<strong>at</strong>ion <strong>at</strong> <strong>Mount</strong> <strong>Carmel</strong><br />
Second Long-Term Test- -Test Well 2 (Continued)<br />
June 28-July 7,1993<br />
Pumped Test Well 2 Observ<strong>at</strong>ion Well 1 Observ<strong>at</strong>ion Well 2 Observ<strong>at</strong>ion Well 3 Observ<strong>at</strong>ion Well 4<br />
D<strong>at</strong>e/ Elapsed Depth to Drawdown Depth to Drawdown Depth to Drawdown Depth to Drawdown Depth to Drawdown Piez<br />
Hour time W<strong>at</strong>er Obs Adj+ W<strong>at</strong>er Obs Adj+ W<strong>at</strong>er Obs Adj+ W<strong>at</strong>er Obs Adj+ W<strong>at</strong>er Obs Adj+ Head R<strong>at</strong>e Remarks<br />
(min) (ft) (ft) (ft) (ft) (ft) (ft) (ft) (ft) (ft) (ft) (ft) (ft) (ft) (ft) (ft) (ft) (gpm)<br />
01:30 AM 840 26.94 10.20 9.42 21.04 2.30 2.55 21.28 1.24 1.49 20.06 0.47 0.72 16.01 1.51 1.79<br />
01:50 AM 860 26.93 10.19 9.43 21.04 2.30 2.57 21.28 1.24 1.51 20.06 0.47 0.74 16.01 1.51 1.81<br />
02:00 AM 870 26.93 10.19 9.43 21.04 2.30 2.57 21.28 1.24 1.51 20.06 0.47 0.74 16.01 1.51 1.81 2.7 895 *<br />
02:10 AM 880 26.94 10.20 9.44 21.04 2.30 2.57 21.28 1.24 1.51 20.06 0.47 0.74 16.01 1.51 1.81<br />
02:30 AM 900 26.92 10.18 9.44 21.03 2.29 2.58 21.27 1.23 1.52 20.06 0.47 0.76 16.01 1.51 1.83<br />
02:50 AM 920 26.93 10.19 9.46 21.03 2.29 2.60 21.27 1.23 1.54 20.05 0.46 0.77 16.01 1.51 1.85<br />
03:00 AM 930 26.93 10.19 9.46 21.03 2.29 2.60 21.27 1.23 1.54 20.05 0.46 0.77 16.01 1.51 1.85 2.70 895 *<br />
03:10 AM 940 26.93 10.19 9.46 21.03 2.29 2.60 21.27 1.23 1.54 20.05 0.46 0.77 16.01 1.51 1.85<br />
03:30 AM 960 26.94 10.20 9.49 21.03 2.29 2.62 21.26 1.22 1.55 20.05 0.46 0.79 16.02 1.52 1.88<br />
03:50 AM 980 26.93 10.19 9.49 21.02 2.28 2.63 21.26 1.22 1.57 20.05 0.46 0.81 16.01 1.51 1.89<br />
04:00 AM 990 26.93 10.19 9.49 21.02 2.28 2.63 21.26 1.22 1.57 20.05 0.46 0.81 16.02 1.52 1.90 2.68 891 *<br />
04:10 AM 1000 26.92 10.18 9.49 21.02 2.28 2.63 21.26 1.22 1.57 20.05 0.46 0.81 16.02 1.52 1.90<br />
05:00 AM 1050 26.93 10.19 9.53 21.01 2.27 2.66 21.25 1.21 1.60 20.04 0.45 0.84 16.02 1.52 1.94 2.70 895 •<br />
05:50 AM 1100 26.91 10.17 9.54 21.00 2.26 2.69 21.24 1.20 1.63 20.03 0.44 0.87 16.03 1.53 1.99<br />
06:00 AM 1110 26.91 10.17 9.55 21.00 2.26 2.70 21.24 1.20 1.64 20.03 0.44 0.88 16.03 1.53 2.00<br />
06:10 AM 1120 26.91 10.17 9.56 20.99 2.25 2.70 21.23 1.19 1.64 20.03 0.44 0.89 16.03 1.53 2.01 2.68 891 •<br />
06:50 AM 1160 26.92 10.18 9.59 20.98 2.24 2.72 21.22 1.18 1.66 20.02 0.43 0.91 16.02 1.52 2.03 2.70 895 •<br />
07:00 AM 1170 26.91 10.17 9.59 20.98 2.24 2.73 21.22 1.18 1.67 20.01 0.42 0.91 16.03 1.53 2.05<br />
07:30 AM 1200 26.90 10.16 9.60 20.96 2.22 2.74 21.21 1.17 1.69 20.00 0.41 0.93 15.95 1.45 2.00<br />
08:00 AM 1230 26.88 10.14 9.61 20.96 2.22 2.77 21.20 1.16 1.71 19.99 0.40 0.95 15.99 1.49 2.07<br />
08:10 AM 1240 26.89 10.15 9.63 20.95 2.21 2.77 21.20 1.16 1.72 19.99 0.40 0.96 16.01 1.51 2.10 2.68 891 •<br />
09:00 AM 1290 26.87 10.13 9.63 20.94 2.20 2.79 21.19 1.15 1.74 19.97 0.38 0.97 16.01 1.51 2.13<br />
09.10 AM 1300 26.88 10.14 9.65 20.95 2.21 2.81 21.19 1.15 1.75 19.97 0.38 0.98 16.10 1.60 2.23 2.68 891 •<br />
10:00 AM 1350 26.87 10.13 9.66 20.93 2.19 2.82 21.17 1.13 1.76 19.96 0.37 1.00 16.05 1.55 2.21<br />
10:10 AM 1360 26.86 10.12 9.66 20.92 2.18 2.82 21.17 1.13 1.77 19.95 0.36 1.00 15.97 1.47 2.14 2.68 891<br />
10:50 AM 1400 26.86 10.12 9.68 20.91 2.17 2.83 21.15 1.11 1.77 19.94 0.35 1.01 16.11 1.61 2.30<br />
11:00 AM 1410 26.85 10.11 9.68 20.90 2.16 2.83 21.15 1.11 1.78 19.94 0.35 1.02 15.96 1.46 2.16<br />
11:10 AM 1420 26.85 10.11 9.69 20.90 2.16 2.84 21.15 1.11 1.79 19.94 0.35 1.03 15.98 1.48 2.19 2.68 891 •<br />
12:00 PM 1470 26.84 10.10 9.70 20.89 2.15 2.85 21.13 1.09 1.79 19.93 0.34 1.04 15.94 1.44 2.17<br />
12:10 PM 1480 26.83 10.09 9.70 20.88 2.14 2.85 21.13 1.09 1.80 19.93 0.34 1.05 15.83 1.33 2.07 2.69 893 •<br />
12:30 PM 1500 26.84 10.10 9.73 20.87 2.13 2.86 21.13 1.09 1.82 19.92 0.33 1.06 15.89 1.39 2.15<br />
01:00 PM 1530 26.83 10.09 9.73 20.85 2.11 2.85 21.12 1.08 1.82 19.91 0.32 1.06 15.86 1.36 2.13<br />
01:30 PM 1560 26.82 10.08 9.73 20.86 2.12 2.88 21.11 1.07 1.83 19.91 0.32 1.08 15.97 1.47 2.26 2.68 891 •<br />
02:00 PM 1590 26.81 10.07 9.74 20.85 2.11 2.89 21.10 1.06 1.84 19.89 0.30 1.08 15.96 1.46 2.27<br />
02:10 PM 1600 26.81 10.07 9.74 20.85 2.11 2.89 21.10 1.06 1.84 19.89 0.30 1.08 15.95 1.45 2.26<br />
02:30 PM 1620 26.81 10.07 9.75 20.84 2.10 2.89 21.09 1.05 1.84 19.88 0.29 1.08 15.95 1.45 2.27 2.68 891 *<br />
03:00 PM 1650 26.81 10.07 9.77 20.83 2.09 2.90 21.09 1.05 1.86 19.87 0.28 1.09 15.91 1.41 2.25 2.68 891<br />
03:50 PM 1700 26.79 10.05 9.78 20.81 2.07 2.92 21.07 1.03 1.88 19.85 0.26 1.11 15.92 1.42 2.30<br />
04:00 PM 1710 26.79 10.05 9.79 20.81 2.07 2.93 21.06 1.02 1.88 19.85 0.26 1.12 15.92 1.42 2.31<br />
05:00 PM 1770 26.77 10.03 9.80 20.76 2.02 2.91 21.04 1.00 1.89 19.82 0.23 1.12 15.90 1.40 2.32 2.68 891<br />
05:30 PM 1800 26.76 10.02 9.80 20.78 2.04 2.95 21.03 0.99 1.90 19.81 0.22 1.13 15.90 1.40 2.34<br />
06:00 PM 1830 26.76 10.02 9.81 20.76 2.02 2.94 21.02 0.98 1.90 19.80 0.21 1.13 15.90 1.40 2.35<br />
07:00 PM 1890 26.73 9.99 9.82 20.74 2.00 2.96 21.01 0.97 1.93 19.78 0.19 1.15 15.88 1.38 2.37 2.7 895<br />
07:10 PM 1900 26.72 9.98 9.82 20.74 2.00 2.97 21.00 0.96 1.93 19.77 0.18 1.15 15.88 1.38 2.38<br />
08:00 PM 1950 26.70 9.96 9.83 20.72 1.98 2.98 20.99 0.95 1.95 19.75 0.16 1.16 15.87 1.37 2.40<br />
08:50 PM 2000 26.69 9.95 9.83 20.71 1.97 2.99 20.97 0.93 1.95 19.74 0.15 1.17 15.86 1.36 2.41<br />
09:00 PM 2010 26.69 9.95 9.84 20.71 1.97 3.00 20.97 0.93 1.96 19.73 0.14 1.17 15.85 1.35 2.41 2.7 895<br />
+Adjusted drawdowns result from correl<strong>at</strong>ion with river stage d<strong>at</strong>a (see text)<br />
*Piezometer/R<strong>at</strong>e reading within 5 minutes of indic<strong>at</strong>ed time
<strong>Ground</strong>-W<strong>at</strong>er Investig<strong>at</strong>ion <strong>at</strong> <strong>Mount</strong> <strong>Carmel</strong><br />
Second Long-Term Test—Test Well 2 (Continued)<br />
June 28-July 7,1993<br />
Pumped Test Well 2 Observ<strong>at</strong>ion Well 1 Observ<strong>at</strong>ion Well 2 Observ<strong>at</strong>ion Well 3 Observ<strong>at</strong>ion Well 4<br />
D<strong>at</strong>e/ Elapsed Depth to Drawdown Depth to Drawdown Depth to Drawdown Depth to Drawdown Depth to Drawdown Piez<br />
Hour time W<strong>at</strong>er Obs Adj+ W<strong>at</strong>er Obs Adj+ W<strong>at</strong>er Obs Adj+ W<strong>at</strong>er Obs Adj+ W<strong>at</strong>er Obs Adj+ Head R<strong>at</strong>e Remarks<br />
(min) (ft) (ft) (ft) (ft) (ft) (ft) (ft) (ft) (ft) (ft) (ft) (ft) (ft) (ft) (ft) (ft) (gpm)<br />
10:00 PM 2070 26.67 9.93 9.86 20.68 1.94 3.01 20.94 0.90 1.97 19.71 0.12 1.19 15.84 1.34 2.44<br />
10:30 PM 2100 26.65 9.91 9.86 20.67 1.93 3.02 20.93 0.89 1.98 19.70 0.11 1.20 15.83 1.33 2.45<br />
11:00 PM 2130 26.65 9.91 9.87 20.66 1.92 3.03 20.92 0.88 1.99 19.68 0.09 1.20 15.82 1.32 2.46 2.7 895<br />
07/02/93 - -<br />
12:00 AM 2190 26.62 9.88 9.88 20.63 1.89 3.04 20.90 0.86 2.01 19.66 0.07 1.22 15.80 1.30 2.48<br />
12:10 AM 2200 26.61 9.87 9.88 20.62 1.88 3.04 20.89 0.85 2.01 19.66 0.07 1.23 15.79 1.29 2.48<br />
01:00 AM 2250 26.59 9.85 9.89 20.60 1.86 3.04 20.87 0.83 2.01 19.64 0.05 1.23 15.77 1.27 2.48<br />
01:50 AM 2300 26.57 9.83 9.89 20.58 1.84 3.05 20.85 0.81 2.02 19.62 0.03 1.24 15.76 1.26 2.50<br />
02:00 AM 2310 26.57 9.83 9.90 20.57 1.83 3.05 20.84 0.80 2.02 19.61 0.02 1.24 15.76 1.26 2.51<br />
03:00 AM 2370 26.53 9.79 9.90 20.55 1.81 3.07 20.82 0.78 2.04 19.58 -0.01 1.25 15.73 1.23 2.52 2.7 895<br />
03:30 AM 2400 26.52 9.78 9.91 20.53 1.79 3.07 20.81 0.77 2.05 19.57 -0.02 1.26 15.72 1.22 2.53<br />
04:00 AM 2430 26.50 9.76 9.91 20.52 1.78 3.08 20.79 0.75 2.05 19.56 -0.03 1.27 15.71 1.21 2.54<br />
05:00 AM 2490 26.48 9.74 9.92 20.49 1.75 3.09 20.76 0.72 2.06 19.53 -0.06 1.28 15.69 1.19 2.56 2.72 897 •<br />
05:10 AM 2500 26.47 9.73 9.92 20.49 1.75 3.10 20.76 0.72 2.07 19.52 -0.07 1.28 15.69 1.19 2.57<br />
06:00 AM 2550 26.46 9.72 9.94 20.47 1.73 3.11 20.74 0.70 2.08 19.50 -0.09 1.29 15.68 1.18 2.59<br />
06:50 AM 2600 26.44 9.70 9.95 20.45 1.71 3.13 20.72 0.68 2.10 19.48 -0.11 1.31 15.68 1.18 2.63 2.72 897 •<br />
07:00 AM 2610 26.44 9.70 9.96 20.44 1.70 3.13 20.71 0.67 2.10 19.48 -0.11 1.32 15.67 1.17 2.63<br />
08:00 AM 2670 26.41 9.67 9.98 20.41 1.67 3.15 20.68 0.64 2.12 19.46 -0.13 1.35 15.64 1.14 2.65<br />
08:30 AM 2700 26.39 9.65 9.98 20.40 1.66 3.17 20.67 0.63 2.14 19.44 -0.15 1.36 15.65 1.15 2.69<br />
09:00 AM 2730 26.38 9.64 9.99 20.38 1.64 3.17 20.66 0.62 2.15 19.43 -0.16 1.37 15.63 1.13 2.69<br />
09:20 AM 2750 26.37 9.63 9.99 20.37 1.63 3.17 20.65 0.61 2.15 19.43 -0.16 1.38 15.62 1.12 2.69 2.70 895<br />
10:00 AM 2790 26.35 9.61 9.99 20.35 1.61 3.17 20.63 0.59 2.15 19.41 -0.18 1.38 15.56 1.06 2.65<br />
10:10AM 2800 26.34 9.60 9.99 20.36 1.62 3.19 20.62 0.58 2.15 19.40 -0.19 1.38 15.71 1.21 2.81<br />
11:00 AM 2850 26.32 9.58 10.01 20.32 1.58 3.19 20.60 0.56 2.17 19.38 -0.21 1.40 15.53 1.03 2.67<br />
11:10AM 2860 26.32 9.58 10.01 20.31 1.57 3.19 20.60 0.56 2.18 19.38 -0.21 1.41 15.52 1.02 2.67 2.70 895<br />
11:50 AM 2900 26.30 9.56 10.00 20.30 1.56 3.18 20.58 0.54 2.16 19.37 -0.22 1.40 15.59 1.09 2.74<br />
12:00 PM 2910 26.29 9.55 10.00 20.28 1.54 3.17 20.57 0.53 2.16 19.36 -0.23 1.40 15.37 0.87 2.53<br />
01:00 PM 2970 26.27 9.53 10.03 20.24 1.50 3.18 20.54 0.50 2.18 19.34 -0.25 1.43 15.42 0.92 2.63<br />
01:10 PM 2980 26.27 9.53 10.03 20.25 1.51 3.19 20.54 0.50 2.18 19.34 -0.25 1.43 15.53 1.03 2.74 2.72 897 •<br />
01:30 PM 3000 26.26 9.52 10.03 20.23 1.49 3.18 20.53 0.49 2.18 19.33 -0.26 1.43 15.47 0.97 2.69<br />
02:00 PM 3030 26.24 9.50 10.02 20.18 1.44 3.14 20.51 0.47 2.17 19.32 -0.27 1.43 15.38 0.88 2.61<br />
02:45 PM 3075 —<br />
03:00 PM 3090 26.22 9.48 10.05 20.18 1.44 3.20 20.49 0.45 2.21 19.30 -0.29 1.47 15.39 0.89 2.68<br />
2.72 897<br />
03:10 PM 3100 26.22 9.48 10.06 20.20 1.46 3.23 20.49 0.45 2.22 19.29 -0.30 1.47 15.53 1.03 2.83<br />
04:00 PM 3150 26.20 9.46 10.06 20.18 1.44 3.23 20.46 0.42 2.21 19.27 -0.32 1.47 15.47 0.97 2.79<br />
04:50 PM 3200 26.18 9.44 10.06 20.15 1.41 3.22 20.44 0.40 2.21 19.26 -0.33 1.48 15.45 0.95 2.79<br />
05:00 PM 3210 26.18 9.44 10.06 20.15 1.41 3.23 20.44 0.40 2.22 19.25 -0.34 1.48 15.42 0.92 2.77 2.72 897<br />
06:00 PM 3270 26.16 9.42 10.07 20.12 1.38 3.23 20.42 0.38 2.23 19.23 -0.36 1.49 15.41 0.91 2.79<br />
06:30 PM 3300 26.15 9.41 10.08 20.11 1.37 3.24 20.41 0.37 2.24 19.22 -0.37 1.50 15.40 0.90 2.80<br />
07:00 PM<br />
08:00 PM<br />
3330<br />
3390<br />
26.14<br />
26.10<br />
9.40<br />
9.36<br />
10.08<br />
10.08<br />
20.10<br />
20.07<br />
1.36<br />
1.33<br />
3.24<br />
3.25<br />
20.40<br />
20.38<br />
0.36<br />
0.34<br />
2.24<br />
2.26<br />
19.22<br />
19.19<br />
-0.37<br />
-0.40<br />
1.51<br />
1.52<br />
15.39<br />
15.37<br />
0.89<br />
0.87<br />
2.80<br />
2.82<br />
2.72 897 •<br />
08:10 PM 3400 26.10 9.36 10.09 20.07 1.33 3.26 20.37 0.33 2.26 19.19 -0.40 1.53 15.36 0.86 2.82<br />
09:00 PM 3450 26.08 9.34 10.09 20.05 1.31 3.27 20.35 0.31 2.27 19.16 -0.43 1.53 15.35 0.85 2.84 2.72 897 ♦<br />
09:50 PM 3500 26.05 9.31 10.09 20.03 1.29 3.27 20.33 0.29 2.27 19.13 -0.46 1.52 15.32 0.82 2.83<br />
10.00 PM 3510 26.04 9.30 10.09 20.02 1.28 3.27 20.32 0.28 2.27 19.12 -0.47 1.52 15.32 0.82 2.84<br />
11:00 PM 3570 26.01 9.27 10.09 20.00 1.26 3.29 20.30 0.26 2.29 19.07 -0.52 1.51 15.30 0.80 2.86 2.72 897 ♦<br />
11:30 PM 3600 25.99 9.25 10.09 19.98 1.24 3.29 20.28 0.24 2.29 19.05 -0.54 1.51 15.29 0.79 2.87<br />
+Adjusted drawdowns result from correl<strong>at</strong>ion with river stage d<strong>at</strong>a (see text)<br />
*Piezometer/R<strong>at</strong>e reading within 5 minutes of indic<strong>at</strong>ed time
<strong>Ground</strong>-W<strong>at</strong>er Investig<strong>at</strong>ion <strong>at</strong> <strong>Mount</strong> <strong>Carmel</strong><br />
Second Long-Term Test- -Test Well 2 (Continued)<br />
June 28-July 7,1993<br />
Pumped Test Well 2 Observ<strong>at</strong>ion Well 1 Observ<strong>at</strong>ion Well 2 Observ<strong>at</strong>ion Well 3 Observ<strong>at</strong>ion Well 4<br />
D<strong>at</strong>e/ Elapsed Depth to Drawdown Depth to Drawdown Depth to Drawdown Depth to Drawdown Depth to Drawdown Piez<br />
Hour lime W<strong>at</strong>er Obs Adj+ W<strong>at</strong>er Obs Adj+ W<strong>at</strong>er Obs Adj+ W<strong>at</strong>er Obs Adj+ Wafer Obs Adj+ Head R<strong>at</strong>e Remarks<br />
(min) (ft) (ft) (ft) (ft) (ft) (ft) (ft) (ft) (ft) (ft) (ft) (ft) (ft) (ft) (ft) (ft) (gpm)<br />
07/03/93 — —<br />
12:00 AM<br />
01:00 AM<br />
3630<br />
3690<br />
25.98<br />
25.94<br />
9.24<br />
9.20<br />
10.11<br />
10.11<br />
19.97<br />
19.93<br />
1.23<br />
1.19<br />
3.31<br />
3.30<br />
20.26<br />
20.24<br />
0.22<br />
0.20<br />
2.30<br />
2.31<br />
19.03<br />
18.99<br />
-0.56<br />
-0.60<br />
1.52<br />
1.51<br />
15.27<br />
15.25<br />
0.77<br />
0.75<br />
2.88<br />
2.89<br />
01:10 AM 3700 25.94 9.20 10.11 19.93 1.19 3.31 20.23 0.19 2.31 18.99 -0.60 1.52 15.23 0.73 2.88<br />
02:00 AM 3750 25.90 9.16 10.10 19.90 1.16 3.30 20.21 0.17 2.31 18.96 -0.63 1.51 15.22 0.72 2.89<br />
02:50 AM 3800 25.87 9.13 10.11 19.88 1.14 3.32 20.18 0.14 2.32 18.93 -0.66 1.52 15.19 0.69 2.90<br />
03:00 AM 3810 25.86 9.12 10.11 19.87 1.13 3.32 20.18 0.14 2.33 18.92 -0.67 1.52 15.19 0.69 2.91 2.72 897<br />
04:00 AM 3870 25.82 9.08 10.10 19.84 1.10 3.33 20.15 0.11 2.34 18.89 -0.70 1.53 15.16 0.66 2.92<br />
04:30 AM 3900 25.81 9.07 10.11 19.82 1.08 3.33 20.13 0.09 2.34 18.87 -0.72 1.53 15.15 0.65 2.93<br />
05:00 AM 3930 25.79 9.05 10.12 19.81 1.07 3.35 20.11 0.07 2.35 18.86 -0.73 1.55 15.14 0.64 2.95 2.72 897<br />
06:00 AM 3990 25.74 9.00 10.12 19.77 1.03 3.36 20.08 0.04 2.37 18.82 -0.77 1.56 15.11 0.61 2.97<br />
06:10 AM 4000 25.74 9.00 10.13 19.76 1.02 3.36 20.07 0.03 2.37 18.82 -0.77 1.57 15.10 0.60 2.97<br />
07:00 AM 4050 25.70 8.96 10.13 19.73 0.99 3.37 20.04 -0.00 2.38 18.78 -0.81 1.57 15.09 0.59 3.00 2.72 897<br />
07:50 AM 4100 25.66 8.92 10.13 19.70 0.96 3.38 20.01 -0.03 2.39 18.75 -0.84 1.58 15.07 0.57 3.02<br />
08:00 AM 4110 25.66 8.92 10.13 19.69 0.95 3.38 20.00 -0.04 2.39 18.75 -0.84 1.59 15.07 0.57 3.03<br />
09:00 AM 4170 25.63 8.89 10.15 19.66 0.92 3.40 19.97 -0.07 2.41 18.72 -0.87 1.61 15.09 0.59 3.10 2.72 897<br />
09:30 AM 4200 25.61 8.87 10.16 19.64 0.90 3.41 19.95 -0.09 2.42 18.70 -0.89 1.62 15.05 0.55 3.09<br />
10:00 AM 4230 25.59 8.85 10.16 19.62 0.88 3.42 19.93 -0.11 2.43 18.69 -0.90 1.64 15.02 0.52 3.09<br />
11:00 AM 4290 25.55 8.81 10.17 19.58 0.84 3.42 19.89 -0.15 2.43 18.66 -0.93 1.65 15.17 0.67 3.28 2.72 897<br />
11:10AM 4300 25.55 8.81 10.18 19.57 0.83 3.42 19.89 -0.15 2.44 18.66 -0.93 1.66 15.03 0.53 3.15<br />
12:00 PM 4350 25.51 8.77 10.18 19.54 0.80 3.43 19.86 -0.18 2.45 18.63 -0.96 1.67 15.11 0.61 3.27<br />
12:50 PM 4400 25.48 8.74 10.18 19.51 0.77 3.44 19.82 -0.22 2.45 18.60 -0.99 1.68 14.92 0.42 3.12<br />
01:00 PM 4410 25.47 8.73 10.18 19.50 0.76 3.44 19.82 -0.22 2.46 18.60 -0.99 1.69 14.87 0.37 3.08 2.72 897 *<br />
02:00 PM 4470 25.43 8.69 10.20 ' 19.44 0.70 3.44 19.78 -0.26 2.48 18.57 -1.02 1.72 14.90 0.40 3.17<br />
02:30 PM 4500 25.42 8.68 10.22 19.44 0.70 3.48 19.76 -0.28 2.50 18.56 -1.03 1.75 14.84 0.34 3.15<br />
03:00 PM 4530 25.40 8.66 10.22 19.42 0.68 3.48 19.74 -0.30 2.50 18.54 -1.05 1.75 14.84 0.34 3.17 2.72 897 *<br />
04:00 PM 4590 25.37 8.63 10.23 19.40 0.66 3.50 19.71 -0.33 2.51 18.52 -1.07 1.77 14.80 0.30 3.17<br />
04:10 PM 4600 25.37 8.63 10.24 19.40 0.66 3.51 19.70 -0.34 2.51 18.51 -1.08 1.77 14.80 0.30 3.18<br />
05:00 PM 4650 25.33 8.59 10.23 19.33 0.59 3.47 19.67 -0.37 2.51 18.49 -1.10 1.78 14.77 0.27 3.18 2.74 899 *<br />
05:50 PM 4700 25.30 8.56 10.23 19.30 0.56 3.48 19.63 -0.41 2.51 18.46 -1.13 1.79 14.75 0.25 3.20<br />
06:00 PM 4710 25.29 8.55 10.23 19.30 0.56 3.49 19.63 -0.41 2.52 18.45 -1.14 1.79 14.74 0.24 3.20<br />
06:55 PM 4765 —<br />
07:00 PM 4770 25.25 8.51 10.24 19.27 0.53 3.51 19.60 -0.44 2.54 18.41 -1.18 1.80 14.71 0.21 3.22<br />
2.74 899<br />
07:30 PM 4800 25.23 8.49 10.24 19.26 0.52 3.52 19.59 -0.45 2.55 18.39 -1.20 1.80 14.70 0.20 3.23<br />
08:00 PM 4830 25.20 8.46 10.23 19.24 0.50 3.51 19.57 -0.47 2.54 18.37 -1.22 1.79 14.68 0.18 3.22<br />
09:00 PM 4890 25.17 8.43 10.24 19.21 0.47 3.52 19.54 -0.50 2.55 18.33 -1.26 1.79 14.65 0.15 3.23 2.74 899 *<br />
09:10 PM 4900 25.15 8.41 10.23 19.20 0.46 3.52 19.53 -0.51 2.55 18.32 -1.27 1.79 14.65 0.15 3.24<br />
10:00 PM 4950 25.13 8.39 10.24 19.17 0.43 3.52 19.50 -0.54 2.55 18.29 -1.30 1.79 14.62 0.12 3.24<br />
10:50 PM 5000 25.08 8.34 10.23 19.14 0.40 3.53 19.47 -0.57 2.56 18.26 -1.33 1.80 14.59 0.09 3.25<br />
11:00 PM 5010 25.09 8.35 10.25 19.14 0.40 3.54 19.47 -0.57 2.57 18.25 -1.34 1.80 14.59 0.09 3.26 2.74 899<br />
07/04/93 - -<br />
12:00 AM 5070 25.04 8.30 10.25 19.10 0.36 3.55 19.43 -0.61 2.58 18.22 -1.37 1.82 14.56 0.06 3.28<br />
12:30 AM 5100 25.02 8.28 10.25 19.08 0.34 3.55 19.42 -0.62 2.59 18.21 -1.38 1.83 14.54 0.04 3.28<br />
01:00 AM 5130 25.00 8.26 10.24 19.07 0.33 3.56 19.40 -0.64 2.59 18.19 -1.40 1.83 14.52 0.02 3.28<br />
02:00 AM 5190 24.96 8.22 10.25 19.03 0.29 3.57 19.37 -0.67 2.61 18.16 -1.43 1.85 14.49 -0.01 3.30<br />
02:10 AM 5200 24.95 8.21 10.25 19.03 0.29 3.58 19.36 -0.68 2.61 18.15 -1.44 1.85 14.49 -0.01 3.31<br />
03:00 AM 5250 24.92 8.18 10.26 19.00 0.26 3.59 19.33 -0.71 2.62 18.12 -1.47 1.86 14.46 -0.04 3.32 2.74 899<br />
+Adjusted drawdowns result from correl<strong>at</strong>ion with river stage d<strong>at</strong>a (see text)<br />
•Piezometer/R<strong>at</strong>e reading within 5 minutes of indic<strong>at</strong>ed time
<strong>Ground</strong>-W<strong>at</strong>er Investig<strong>at</strong>ion <strong>at</strong> <strong>Mount</strong> <strong>Carmel</strong><br />
Second Long-Term Test—Test Well 2 (Continued)<br />
June 28-July 7, 1993<br />
Pumped Test Well 2 Observ<strong>at</strong>ion Well 1 Observ<strong>at</strong>ion Well 2 Observ<strong>at</strong>ion Well 3 Observ<strong>at</strong>ion Well 4<br />
D<strong>at</strong>e/ Elapsed Depth to Drawdown Depth to Drawdown Depth to Drawdown Depth to Drawdown Depth to Drawdown Piez<br />
Hour time W<strong>at</strong>er Obs Adj+ Wafer Obs Adj+ W<strong>at</strong>er Obs Adj+ W<strong>at</strong>er Obs Adj+ W<strong>at</strong>er Obs Adj+ Head R<strong>at</strong>e Remarks<br />
(min) (ft) (ft) (ft) (ft) (ft) (ft) (ft) (ft) (ft) (ft) (ft) (ft) (ft) (ft) (ft) (ft) (gpm)<br />
03:50 AM 5300 24.89 8.15 10.25 18.97 0.23 3.58 19.30 -0.74 2.61 18.10 -1.49 1.86 14.43 -0.07 3.31<br />
04:00 AM 5310 24.87 8.13 10.24 18.96 0.22 3.58 19.30 -0.74 2.62 18.09 -1.50 1.86 14.43 -0.07 3.32<br />
05:00 AM 5370 24.84 8.10 10.26 18.93 0.19 3.60 19.27 -0.77 2.64 18.06 -1.53 1.88 14.40 -0.10 3.34 2.74 899 *<br />
05:30 AM 5400 24.81 8.07 10.25 18.91 0.17 3.60 19.25 -0.79 2.64 18.05 -1.54 1.89 14.39 -0.11 3.35<br />
06:00 AM 5430 24.79 8.05 10.25 18.89 0.15 3.60 19.23 -0.81 2.64 18.03 -1.56 1.89 14.37 -0.13 3.35<br />
06:55 AM 5485 —<br />
07:00 AM 5490 24.75 8.01 10.25 18.86 0.12 3.60 19.19 -0.85 2.63 17.99 -1.60 1.88 14.36 -0.14 3.37<br />
2.74 899<br />
07:10 AM 5500 24.74 8.00 10.25 18.85 0.11 3.60 19.19 -0.85 2.64 17.99 -1.60 1.89 14.35 -0.15 3.37<br />
08:00 AM 5550 24.71 7.97 10.26 18.82 0.08 3.61 19.15 -0.89 2.64 17.96 -1.63 1.90 14.31 -0.19 3.37<br />
08:50 AM 5600 24.67 7.93 10.25 18.79 0.05 3.62 19.12 -0.92 2.65 17.93 -1.66 1.91 14.30 -0.20 3.40<br />
09:00 AM 5610 24.66 7.92 10.25 18.78 0.04 3.62 19.12 -0.92 2.66 17.92 -1.67 1.91 14.30 -0.20 3.41 2.74 899<br />
10:00 AM 5670 24.63 7.89 10.26 18.73 -0.01 3.61 19.08 -0.96 2.66 17.89 -1.70 1.92 14.26 -0.24 3.41<br />
10:30 AM 5700 24.61 7.87 10.27 18.71 -0.03 3.62 19.06 -0.98 2.67 17.87 -1.72 1.93 14.21 -0.29 3.39<br />
11:00 AM 5730 24.60 7.86 10.28 18.69 -0.05 3.63 19.04 -1.00 2.68 17.85 -1.74 1.94 14.21 -0.29 3.42 2.74 899<br />
12:00 PM 5790 24.53 7.79 10.26 18.64 -0.10 3.62 18.99 -1.05 2.67 17.81 -1.78 1.94 14.15 -0.35 3.40<br />
12:10 PM 5800 24.53 7.79 10.27 18.64 -0.10 3.63 18.98 -1.06 2.67 17.81 -1.78 1.95 14.12 -0.38 3.38<br />
01:00 PM 5850 24.48 7.74 10.27 18.60 -0.14 3.64 18.95 -1.09 2.69 17.78 -1.81 1.97 14.14 -0.36 3.45 2.74 899<br />
01:50 PM 5900 24.44 7.70 10.27 18.53 -0.21 3.62 18.91 -1.13 2.70 17.74 -1.85 1.98 14.03 -0.47 3.39<br />
02:00 PM 5910 24.43 7.69 10.27 18.55 -0.19 3.65 18.90 -1.14 2.70 17.74 -1.85 1.99 14.09 -0.41 3.46<br />
02:50 PM 5960 24.39 7.65 10.28 18.51 -0.23 3.66 18.87 -1.17 2.72 17.70 -1.89 2.00 14.05 -0.45 3.47 2.74 899<br />
03:00 PM 5970 24.38 7.64 10.28 18.51 -0.23 3.67 18.86 -1.18 2.72 17.70 -1.89 2.01 14.04 -0.46 3.47<br />
03:30 PM 6000 24.35 7.61 10.28 18.48 -0.26 3.67 18.83 -1.21 2.72 17.67 -1.92 2.01 14.01 -0.49 3.47<br />
04:00 PM 6030 24.34 7.60 10.30 18.46 -0.28 3.67 18.81 -1.23 2.72 17.65 -1.94 2.01 14.00 -0.50 3.48<br />
05:00 PM 6090 24.28 7.54 10.31 18.39 -0.35 3.68 18.76 -1.28 2.75 17.61 -1.98 2.05 13.97 -0.53 3.53<br />
05:10 PM 6100 24.27 7.53 10.31 18.40 -0.34 3.70 18.75 -1.29 2.75 17.61 -1.98 2.06 13.96 -0.54 3.53 2.74 899 •<br />
06:00 PM 6150 24.23 7.49 10.32 18.36 -0.38 3.71 18.71 -1.33 2.76 17.57 -2.02 2.07 13.93 -0.57 3.55<br />
06:50 PM 6200 24.18 7.44 10.32 18.31 -0.43 3.71 18.67 -1.37 2.77 17.54 -2.05 2.09 13.89 -0.61 3.56<br />
07:00 PM 6210 24.18 7.44 10.32 18.30 -0.44 3.71 18.66 -1.38 2.77 17.54 -2.05 2.10 13.89 -0.61 3.57<br />
07:10 PM 6220 24.16 7.42 10.32 18.30 -0.44 3.73 18.66 -1.38 2.79 17.53 -2.06 2.11 13.88 -0.62 3.58 2.76 902 ♦<br />
08:00 PM 6270 24.12 7.38 10.34 18.25 -0.49 3.74 18.61 -1.43 2.80 17.50 -2.09 2.14 13.84 -0.66 3.60<br />
08:30 PM 6300 24.08 7.34 10.34 18.23 -0.51 3.76 18.59 -1.45 2.82 17.49 -2.10 2.17 13.82 -0.68 3.62<br />
09:00 PM 6330 24.04 7.30 10.34 18.19 -0.55 3.76 18.56 -1.48 2.83 17.47 -2.12 2.19 13.80 -0.70 3.64<br />
09:10 PM 6340 24.04 7.30 10.35 18.18 -0.56 3.77 18.55 -1.49 2.84 17.46 -2.13 2.20 13.79 -0.71 3.65 2.76 902<br />
10:00 PM 6390 23.98 7.24 10.35 18.13 -0.61 3.78 18.50 -1.54 2.85 17.42 -2.17 2.22 13.74 -0.76 3.66<br />
10:10 PM 6400 23.97 7.23 10.36 18.12 -0.62 3.79 18.49 -1.55 2.86 17.41 -2.18 2.23 13.74 -0.76 3.68<br />
11:00 PM 6450 23.91 7.17 10.36 18.07 -0.67 3.79 18.44 -1.60 2.86 17.38 -2.21 2.25 13.69 -0.81 3.68<br />
11:15 PM 6465 — 2.66 887 Adjusted r<strong>at</strong>e<br />
11:50 PM 6500 23.66 6.92 10.21 17.99 -0.75 3.77 18.37 -1.67 2.85 17.33 -2.26 2.26 13.63 -0.87 3.68<br />
07/05/93 - -<br />
12:00 AM 6510 23.65 6.91 10.21 17.97 -0.77 3.77 18.36 -1.68 2.86 17.32 -2.27 2.27 13.62 -0.88 3.69<br />
01:00 AM 6570 23.58 6.84 10.23 17.91 -0.83 3.80 18.30 -1.74 2.89 17.27 -2.32 2.31 13.58 -0.92 3.74<br />
01:30 AM 6600 23.55 6.81 10.24 17.87 -0.87 3.80 18.26 -1.78 2.89 17.25 -2.34 2.33 13.54 -0.96 3.74<br />
02:00 AM 6630 23.52 6.78 10.25 17.84 -0.90 3.82 18.23 -1.81 2.91 17.72 -2.37 2.35 13.51 -0.99 3.76<br />
03:00 AM 6690 23.45 6.71 10.27 17.77 -0.97 3.84 18.16 -1.88 2.93 17.17 -2.42 2.39 13.45 -1.05 3.79 2.66 887<br />
03:10 AM 6700 23.44 6.70 10.27 17.76 -0.98 3.85 18.15 -1.89 2.94 17.15 -2.44 2.39 13.44 -1.06 3.80<br />
04:00 AM 6750 23.38 6.64 10.28 17.70 -1.04 3.85 18.10 -1.94 2.95 17.11 -2.48 2.41 13.40 -1.10 3.82<br />
04:50 AM 6800 23.33 6.59 10.29 17.65 -1.09 3.87 18.04 -2.00 2.96 17.06 -2.53 2.43 13.35 -1.15 3.84<br />
+Adjusted drawdowns result from correl<strong>at</strong>ion with river stage d<strong>at</strong>a (see text)<br />
*Piezometer/R<strong>at</strong>e reading within 5 minutes of indic<strong>at</strong>ed time
<strong>Ground</strong>-W<strong>at</strong>er Investig<strong>at</strong>ion <strong>at</strong> <strong>Mount</strong> <strong>Carmel</strong><br />
Second Long-Term Test- -Test Well 2 (Continued)<br />
June 28-July 7,1993<br />
Pumped Test Well 2 Observ<strong>at</strong>ion Well 1 Observ<strong>at</strong>ion Well 2 Observ<strong>at</strong>ion Well 3 Observ<strong>at</strong>ion Well 4<br />
D<strong>at</strong>e/ Elapsed Depth to Drawdown Depth to Drawdown Depth to Drawdown Depth to Drawdown Depth to Drawtown Piez<br />
Hour time W<strong>at</strong>er Obs Adj + W<strong>at</strong>er Obs Adj+ W<strong>at</strong>er Obs Adj+ W<strong>at</strong>er Obs Adj+ W<strong>at</strong>er Obs Adj+ Head R<strong>at</strong>e Remarks<br />
(min) (ft) (ft) (ft) (ft) (ft) (ft) (ft) (ft) (ft) (ft) (ft) (ft) (ft) (ft) (ft) (ft) (gpm)<br />
05:00 AM 6810 23.30 6.56 10.29 17.64 -1.10 3.88 18.03 -2.01 2.97 17.05 -2.54 2.44 13.34 -1.16 3.85<br />
06:00 AM 6870 23.24 6.50 10.31 17.57 -1.17 3.90 17.97 -2.07 3.00 16.99 -2.60 2.47 13.28 -1.22 3.88<br />
06:30 AM 6900 23.20 6.46 10.31 17.54 -1.20 3.91 17.93 -2.11 3.00 16.96 -2.63 2.48 13.26 -1.24 3.90<br />
06:50 AM 6920 23.17 6.43 10.31 17.51 -1.23 3.91 17.91 -2.13 3.01 16.94 -2.65 2.49 13.27 -1.23 3.94 2.66 887<br />
07:00 AM 6930 23.16 6.42 10.31 17.50 -1.24 3.91 17.90 -2.14 3.01 16.93 -2.66 2.49 13.24 -1.26 3.92<br />
08:00 AM 6990 23.10 6.36 10.32 17.43 -1.31 3.92 17.83 -2.21 3.02 16.88 -2.71 2.52 13.14 -1.36 3.90<br />
08:10 AM 7000 23.07 6.33 10.31 17.41 -1.33 3.92 17.82 -2.22 3.03 16.87 -2.72 2.53 13.12 -1.38 3.90<br />
09:00 AM 7050 23.02 6.28 10.33 17.37 -1.37 3.95 17.77 -2.27 3.05 16.82 -2.77 2.55 13.12 -1.38 3.97 2.67 889 •<br />
09:50 AM 7100 22.97 6.23 10.30 17.30 -1.44 3.89 17.70 -2.34 2.99 16.77 -2.82 2.51 13.07 -1.43 3.93<br />
10:00 AM 7110 22.95 6.21 10.33 17.28 -1.46 3.92 17.69 -2.35 3.03 16.75 -2.84 2.54 13.01 - 1.49 3.92<br />
11:00 AM 7170 22.89 6.15 10.36 17.23 -1.51 3.97 17.62 -2.42 3.06 16.69 -2.90 2.58 13.09 -1.41 4.10<br />
11:10AM 7180 22.88 6.14 10.36 17.21 -1.53 3.96 17.61 -2.43 3.06 16.68 -2.91 2.58 13.01 -1.49 4.03 2.67 889 *<br />
11:30 AM 7200 22.86 6.12 10.36 17.17 -1.57 3.95 17.59 -2.45 3.07 16.66 -2.93 2.59 12.90 -1.60 3.95<br />
12:00 PM 7230 22.83 6.09 10.36 17.16 -1.58 3.97 17.56 -2.48 3.07 16.62 -2.97 2.58 13.05 -1.45 4.13<br />
01:00 PM 7290 22.76 6.02 10.37 17.10 -1.64 3.99 17.50 -2.54 3.09 16.56 -3.03 2.60 12.88 -1.62 4.04 2.67 889<br />
01:10 PM 7300 22.74 6.00 10.36 17.08 -1.66 3.98 17.48 -2.56 3.08 16.54 -3.05 2.59 12.90 -1.60 4.07<br />
02:00 PM 7350 22.69 5.95 10.37 17.01 -1.73 3.97 17.42 -2.62 3.08 16.48 -3.11 2.59 12.77 -1.73 4.00<br />
02:50 PM 7400 22.64 5.90 10.37 16.96 -1.78 3.97 17.38 -2.66 3.09 16.43 -3.16 2.59 12.75 -1.75 4.03 2.68 891<br />
03:00 PM 7410 22.63 5.89 10.37 16.95 -1.79 3.97 17.36 -2.68 3.08 16.42 -3.17 2.59 12.73 -1.77 4.02<br />
04:00 PM 7470 22.57 5.83 10.37 16.90 -1.84 3.98 17.31 -2.73 3.09 16.36 -3.23 2.59 12.68 -1.82, 4.03<br />
04:30 PM 7500 22.53 5.79 10.36 16.86 -1.88 3.96 17.27 -2.77 3.07 16.33 -3.26 2.58 12.66 -1.84. 4.03<br />
05:00 PM 7530 22.50 5.76 10.36 16.82 -1.92 3.95 17.24 -2.80 3.07 16.29 -3.30 2.57 12.63 -1.87 4.03 2.70 895 *<br />
06:00 PM 7590 22.45 5.71 10.36 16.77 -1.97 3.96 17.19 -2.85 3.08 16.24 -3.35 2.58 12.58 -1.92, 4.04<br />
06:10 PM 7600 22.44 5.70 10.36 16.76 -1.98 3.96 17.18 -2.86 3.08 16.24 -3.35 2.59 12.57 -1.93 4.04<br />
07:00 PM 7650 22.39 5.65 10.35 16.73 -2.01 3.97 17.15 -2.89 3.09 16.19 -3.40 2.58 12.53 -1.97 4.04<br />
07:15 PM 7665 —<br />
07:50 PM 7700 22.34 5.60 10.35 16.69 -2.05 3.97 17.11 -2.93 3.09 16.14 -3.45 2.57 12.49 -2.01 4.04<br />
2.70 895<br />
08:00 PM 7710 22.33 5.59 10.35 16.68 -2.06 3.97 17.10 -2.94 3.09 16.14 -3.45 2.58 12.48 -2.02, 4.04<br />
09:00 PM 7770 22.28 5.54 10.34 16.64 -2.10 3.97 17.05 -2.99 3.08 16.09 -3.50 2.57 12.43 -2.07 4.03<br />
09:10 PM 7780 22.26 5.52 10.32 16.62 -2.12 3.95 17.04 -3.00 3.07 16.08 -3.51 2.56 12.42 -2.08 4.02 2.70 895 •<br />
09:30 PM 7800 22.26 5.52 10.34 16.61 -2.13 3.96 17.03 -3.01 3.08 16.07 -3.52 2.57 12.40 -2.10 4.02<br />
10:00 PM 7830 22.22 5.48 10.32 16.59 -2.15 3.96 17.00 -3.04 3.07 16.05 -3.54 2.57 12.38 -2.12 4.02<br />
10:50 PM 7880 22.18 5.44 10.31 16.55 -2.19 3.95 16.96 -3.08 3.06 16.01 -3.58 2.56 12.34 -2.16 4.01 2.70 895 •<br />
11:00 PM 7890 22.15 5.41 10.30 16.54 -2.20 3.95 16.95 -3.09 3.06 16.00 -3.59 2.56 12.33 -2.17 4.01<br />
11:10 PM 7900 22.16 5.42 10.31 16.53 -2.21 3.95 16.94 -3.10 3.06 16.00 -3.59 2.57 12.32 -2.18 4.01<br />
07/06/93 — —<br />
12:00 AM 7950 22.11 5.37 10.30 16.49 -2.25 3.94 16.90 -3.14 3.05 15.96 -3.63 2.56 12.28 -2.22 4.00<br />
12:50 AM 8000 22.08 5.34 10.30 16.44 -2.30 3.92 16.86 -3.18 3.04 15.93 -3.66 2.56 12.23 -2.27 3.98<br />
01:00 AM 8010 22.07 5.33 10.30 16.44 -2.30 3.93 16.86 -3.18 3.05 15.92 -3.67 2.56 12.23 -2.27 3.99<br />
02:00 AM 8070 22.02 5.28 10.29 16.39 -2.35 3.91 16.81 -3.23 3.03 15.89 -3.70 2.56 12.18 -2.32 3.97<br />
02:30 AM 8100 21.99 5.25 10.28 16.37 -2.37 3.91 16.79 -3.25 3.03 15.87 -3.72 2.56 12.15 -2.35 3.%<br />
03:00 AM 8130 21.97 5.23 10.28 16.33 -2.41 3.89 16.75 -3.29 3.01 15.85 -3.74 2.56 12.13 -2.37 3.96 2.70 895<br />
04:00 AM 8190 21.93 5.19 10.29 16.29 -2.45 3.90 16.71 -3.33 3.02 15.82 -3.77 2.58 12.08 -2.42 3.%<br />
04:10 AM 8200 21.92 5.18 10.28 16.28 -2.46 3.89 16.71 -3.33 3.02 15.81 -3.78 2.57 12.07 -2.43 3.95<br />
05:00 AM 8250 21.87 5.13 10.26 16.25 -2.49 3.89 16.67 -3.37 3.01 15.78 -3.81 2.57 12.03 -2.47 3.94 2.70 895<br />
05:50 AM 8300 21.82 5.08 10.25 16.21 -2.53 3.88 16.63 -3.41 3.00 15.79 -3.80 2.61 11.99 -2.51 3.93<br />
06:00 AM 8310 21.81 5.07 10.25 16.20 -2.54 3.88 16.63 -3.41 3.01 15.80 -3.79 2.63 11.99 -2.51 3.94<br />
+Adjusted drawdowns result from correl<strong>at</strong>ion with river stage d<strong>at</strong>a (see text)<br />
*Piezometer/R<strong>at</strong>e reading within 5 minutes of indic<strong>at</strong>ed time
<strong>Ground</strong>-W<strong>at</strong>er Investig<strong>at</strong>ion <strong>at</strong> <strong>Mount</strong> <strong>Carmel</strong><br />
Second Long-Term Test—Test Well 2 (Continued)<br />
June 28-July 7,1993<br />
Pumped Test Well 2 Observ<strong>at</strong>ion Well 1 Observ<strong>at</strong>ion Well 2 Observ<strong>at</strong>ion Well 3 Observ<strong>at</strong>ion Well 4<br />
D<strong>at</strong>e/ Elapsed Depth to Drawdown Depth to Drawdown Depth to Drawdown Depth to Drawdown Depth to Drawdown Piez<br />
Hour time W<strong>at</strong>er Obs Adj+ W<strong>at</strong>er Obs Adj+ W<strong>at</strong>er Obs Adj+ W<strong>at</strong>er Obs Adj+ W<strong>at</strong>er Obs Adj+ Head R<strong>at</strong>e Remarks<br />
(win) (ft) (ft) (ft) (ft) (ft) (ft) (ft) (ft) (ft) (ft) (ft) (ft) (ft) (ft) (ft) (ft) (gpm)<br />
06:50 AM 8360 21.76 5.02 10.22 16.16 -2.58 3.86 16.59 -3.45 2.99 15.81 -3.78 2.66 11.95 -2.55 3.92 2.70 895<br />
07:00 AM 8370 21.75 5.01 10.21 16.16 -2.58 3.86 16.58 -3.46 2.98 15.81 -3.78 2.66 11.94 -2.56 3.91<br />
07:30 AM 8400 21.72 4.98 10.20 16.13 -2.61 3.84 16.56 -3.48 2.97 15.81 -3.78 2.67 11.92 -2.58 3.90<br />
08:00 AM 8430 21.70 4.96 10.19 16.11 -2.63 3.83 16.54 -3.50 2.96 15.81 -3.78 2.68 11.90 -2.60 3.89<br />
09:00 AM 8490 21.65 4.91 10.18 16.05 -2.69 3.81 16.49 -3.55 2.95 15.81 -3.78 2.72 11.79 -2.71 3.82<br />
09:10 AM 8500 21.64 4.90 10.17 16.05 -2.69 3.81 16.49 -3.55 2.95 15.81 -3.78 2.72 11.85 -2.65 3.88<br />
10:00 AM 8550 21.60 4.86 10.16 16.02 -2.72 3.80 16.45 -3.59 2.93 15.81 -3.78 2.74 11.82 -2.68 3.87<br />
10:50 AM 8600 21.56 4.82 10.14 15.98 -2.76 3.78 16.41 -3.63 2.91 15.81 -3.78 2.76 11.77 -2.73 3.84<br />
11:00 AM 8610 21.56 4.82 10.14 15.99 -2.75 3.79 16.41 -3.63 2.91 15.81 -3.78 2.76 11.87 -2.63 3.94<br />
11:10 AM 8620 21.55 4.81 10.13 15.96 -2.78 3.76 16.41 -3.63 2.91 15.81 -3.78 2.76 11.64 -2.86 3.71 2.72 897 •<br />
12:00 PM<br />
12:30 PM<br />
8670<br />
8700<br />
21.51<br />
21.49<br />
4.77<br />
4.75<br />
10.13<br />
10.12<br />
15.94<br />
15.92<br />
-2.80<br />
-2.82<br />
3.77<br />
3.76<br />
16.37<br />
16.35<br />
-3.67<br />
-3.69<br />
2.90<br />
2.89<br />
15.81<br />
15.82<br />
-3.78<br />
-3.77<br />
2.79<br />
2.81<br />
11.76<br />
11.73<br />
-2.74<br />
-2.77<br />
3.86<br />
3.84<br />
01:00 PM 8730 21.48 4.74 10.12 15.89 -2.85 3.74 16.33 -3.71 2.88 15.82 -3.77 2.82 11.68 -2.82 3.80<br />
01:15 PM 8745 —<br />
02:00 PM 8790 21.45 4.71 10.12 15.85 -2.89 3.73 16.29 -3.75 2.87 15.82 -3.77 2.85 11.64 -2.86 3.79<br />
2.72 897<br />
02:10 PM 8800 21.45 4.71 10.12 15.87 -2.87 3.75 16.29 -3.75 2.87 15.82 -3.77 2.85 11.73 -2.77 3.88<br />
03:00 PM 8850 21.43 4.69 10.12 15.81 -2.93 3.71 16.25 -3.79 2.85 15.82 -3.77 2.87 11.55 -2.95 3.72<br />
03:10 PM 8860 21.42 4.68 10.11 15.82 -2.92 3.72 16.25 -3.79 2.85 15.82 -3.77 2.87 11.64 -2.86 3.81 2.72 897<br />
03:50 PM 8900 21.38 4.64 10.09 15.78 -2.96 3.70 16.22 -3.82 2.84 15.82 -3.77 2.89 11.57 -2.93 3.76<br />
04:00 PM 8910 21.38 4.64 10.09 15.78 -2.96 3.70 16.22 -3.82 2.84 15.82 -3.77 2.89 11.58 -2.92 3.77<br />
04:55 PM 8965 —<br />
05:00 PM 8970 21.33 4.59 10.07 15.74 -3.00 3.68 16.18 -3.86 2.82 15.82 -3.77 2.91 11.53 -2.97 3.74<br />
2.72 897<br />
05:30 PM 9000 21.32 4.58 10.07 15.72 -3.02 3.67 16.17 -3.87 2.82 15.82 -3.77 2.92 11.51 -2.99 3.73<br />
06:00 PM 9030 21.29 4.55 10.05 15.70 -3.04 3.66 16.15 -3.89 2.81 15.82 -3.77 2.93 11.48 -3.02 3.71<br />
07:00 PM 9090 21.24 4.50 10.04 15.67 -3.07 3.66 16.11 -3.93 2.80 15.82 -3.77 2.96 11.44 -3.06 3.70<br />
07:05 PM 9095 —<br />
07:10 PM 9100 21.24 4.50 10.04 15.66 -3.08 3.65 16.11 -3.93 2.80 15.81 -3.78 2.95 11.44 -3.06 3.70<br />
2.72 897<br />
08:00 PM 9150 21.21 4.47 10.03 15.64 -3.10 3.64 16.09 -3.95 2.79 15.81 -3.78 2.% 11.41 -3.09 3.68<br />
08:50 PM 9200 21.17 4.43 10.01 15.61 -3.13 3.63 16.06 -3.98 2.78 15.81 -3.78 2.98 11.38 -3.12 3.67<br />
09.00 PM 9210 21.17 4.43 10.01 15.61 -3.13 3.63 16.06 -3.98 2.78 15.81 -3.78 2.98 11.38 -3.12 3.67<br />
09:15 PM 9225 —<br />
10:00 PM 9270 21.14 4.40 10.00 15.58 -3.16 3.61 16.03 -4.01 2.76 15.81 -3.78 2.99 11.34 -3.16 3.64<br />
2.74 899<br />
10.30 PM 9300 21.11 4.37 9.98 15.57 -3.17 3.61 16.02 -4.02 2.76 15.81 -3.78 3.00 11.33 -3.17 3.64<br />
11:00 PM 9330 21.11 4.37 9.99 15.56 -3.18 3.61 16.00 -4.04 2.75 15.81 -3.78 3.01 11.31 -3.19 3.63<br />
07/07/93 - —<br />
12:00 AM 9390 21.07 4.33 9.97 15.53 -3.21 3.60 15.97 -4.07 2.74 15.81 -3.78 3.03 11.28 -3.22 3.62<br />
12:10 AM 9400 21.06 4.32 9.96 15.52 -3.22 3.59 15.97 -4.07 2.74 15.81 -3.78 3.03 11.27 -3.23 3.61<br />
01:00 AM 9450 21.05 4.31 9.96 15.50 -3.24 3.58 15.94 -4.10 2.72 15.81 -3.78 3.04 11.25 -3.25 3.60<br />
01:50 AM 9500 21.03 4.29 9.95 15.47 -3.27 3.55 15.93 -4.11 2.71 15.81 -3.78 3.04 11.22 -3.28 3.57<br />
02:00 AM 9510 21.01 4.27 9.93 15.47 -3.27 3.55 15.92 -4.12 2.70 15.81 -3.78 3.04 11.21 -3.29 3.56<br />
03:00 AM 9570 21.00 4.26 9.94 15.46 -3.28 3.56 15.90 -4.14 2.70 15.81 -3.78 3.06 11.18 -3.32 3.55 2.72 897 *<br />
03:30 AM 9600 20.98 4.24 9.92 15.44 -3.30 3.54 15.88 -4.16 2.68 15.81 -3.78 3.06 11.17 -3.33 3.54<br />
04:00 AM 9630 20.97 4.23 9.92 15.43 -3.31 3.54 15.87 -4.17 2.68 15.81 -3.78 3.07 11.16 -3.34 3.54<br />
04:50 AM 9680 20.94 4.20 9.92 15.40 -3.34 3.53 15.85 -4.19 2.68 15.81 -3.78 3.09 11.13 -3.37 3.53 2.72 897<br />
05:00 AM 9690 20.95 4.21 9.92 15.40 -3.34 3.53 15.85 -4.19 2.68 15.81 -3.78 3.09 11.13 -3.37 3.53<br />
05:10 AM 9700 20.93 4.19 9.91 15.40 -3.34 3.53 15.84 -4.20 2.67 15.81 -3.78 3.09 11.12 -3.38 3.52<br />
06:00 AM 9750 20.89 4.15 9.89 15.38 -3.36 3.53 15.82 -4.22 2.67 15.81 -3.78 3.11 11.10 -3.40 3.52<br />
+Adjusted drawdowns result from correl<strong>at</strong>ion with river stage d<strong>at</strong>a (see text) *Piezometer/R<strong>at</strong>e reading within 5 minutes of indic<strong>at</strong>ed time
<strong>Ground</strong>-W<strong>at</strong>er Investig<strong>at</strong>ion <strong>at</strong> <strong>Mount</strong> <strong>Carmel</strong><br />
Second Long-Term Test- -Test Well 2 (Continued)<br />
June 28-July 7,1993<br />
Pumped Test Well 2 Observ<strong>at</strong>ion Well 1 Observ<strong>at</strong>ion Well 2 Observ<strong>at</strong>ion Well 3 Observ<strong>at</strong>ion Well 4<br />
D<strong>at</strong>e/ Elapsed Depth to Drawdown Depth to Drawdown Depth to Drawdown Depth to Drawdown Depth to Drawdown Piez<br />
Hour time W<strong>at</strong>er Obs Adj+ W<strong>at</strong>er Obs Adj+ W<strong>at</strong>er Obs Adj+ W<strong>at</strong>er Obs Adj+ W<strong>at</strong>er Obs Adj+ Head R<strong>at</strong>e Remarks<br />
(min) (ft) (ft) (ft) (ft) (ft) (ft) (ft) (ft) (ft) (ft) (ft) (ft) (ft) (ft) (ft) (ft) (gpm)<br />
06:45 AM 9795 _ 2.72 897<br />
06:50 AM 9800 20.87 4.13 9.88 15.35 -3.39 3.50 15.80 -4.24 2.65 15.81 -3.78 3.11 11.10 -3.40 3.52<br />
07:00 AM 9810 20.85 4.11 9.86 15.35 -3.39 3.50 15.79 -4.25 2.64 15.81 -3.78 3.11 11.07 -3.43 3.49<br />
08:00 AM 9870 20.84 4.10 9.87 15.32 -3.42 3.49 15.76 -4.28 2.63 15.81 -3.78 3.13 11.05 -3.45 3.49<br />
08:30 AM 9900 20.83 4.09 9.86 15.31 -3.43 3.48 15.75 -4.29 2.62 15.81 -3.78 3.13 11.03 -3.47 3.47<br />
09:00 AM 9930 20.81 4.07 9.85 15.29 -3.45 3.47 15.74 -4.30 2.62 15.81 -3.78 3.14 11.04 -3.46 3.49<br />
10:00 AM 9990 20.79 4.05 9.85 15.25 -3.49 3.45 15.70 -4.34 2.60 15.82 -3.77 3.17 10.99 -3.51 3.46<br />
10:10 AM 10000 20.78 4.04 9.84 15.25 -3.49 3.45 15.70 -4.34 2.60 15.82 -3.77 3.17 10.99 -3.51 3.46<br />
10:15 AM 10005 —<br />
10:20 AM 10010 20.78 4.04 9.84 15.24 -3.50 3.44 15.70 -4.34 2.60 15.82 -3.77 3.17 10.98 -3.52 3.45<br />
2.74 899<br />
10.29 AM 10019 — 14.64 -4.95<br />
10:30 AM 10020 20.75 4.01 9.83 15.24 -3.50 3.45 15.69 -4.35 2.60 15.82 -3.77 3.18 10.99 -3.51 3.47<br />
Steel tape measurement<br />
10:31 AM 10021 15.75 -4.29 2.66 Steel tape measurement<br />
10:32 AM 10022 20.75 4.01 9.83 15.24 -3.50 3.45 15.69 -4.35 2.60 15.82 -3.77 3.18 10.99 -3.51 3.47<br />
10:33 AM 10023 20.77 4.03 9.84 15.24 -3.50 3.45 15.68 -4.36 2.59 15.82 -3.77 3.18 11.00 -3.50 3.48<br />
10:34 AM 10024 20.75 4.01 9.83 15.24 -3.50 3.45 15.68 -4.36 2.59 15.82 -3.77 3.18 11.00 -3.50 3.48<br />
10:34 AM 10024 15.31 -3.43 3.52 —<br />
10:35 AM 10025 20.75 4.01 9.83 15.24 -3.50 3.45 15.68 -4.36 2.59 15.82 -3.77 3.18 10.98 -3.52 3.46<br />
Steel tape measurement<br />
10.36 AM 10026 20.76 4.02 9.83 15.24 -3.50 3.45 15.68 -4.36 2.59 15.82 -3.77 3.18 10.98 -3.52 3.46<br />
10:37 AM 10027 20.75 4.01 9.83 15.23 -3.51 3.44 15.68 -4.36 2.59 15.82 -3.77 3.18 10.98 -3.52 3.46<br />
10:37 AM 10027 21.03 4.29 10.05 —<br />
10:38 AM 10028 20.76 4.02 9.83 15.23 -3.51 3.44 15.68 -4.36 2.59 15.82 -3.77 3.18 10.97 -3.53 3.45<br />
Steel tape measurement<br />
10:39 AM 10029 20.74 4.00 9.82 15.23 -3.51 3.44 15.68 -4.36 2.59 15.82 -3.77 3.18 10.96 -3.54 3.44<br />
10:39 AM 10029 — 11.13 -3.37 3.61<br />
10:40 AM 10030 20.76 4.02 9.83 15.23 -3.51 3.44 15.68 -4.36 2.59 15.82 -3.77 3.18 10.97 -3.53 3.45<br />
Steel tape measurement<br />
10:41 AM 10031 20.76 4.02 9.84 15.23 -3.51 3.45 15.69 -4.35 2.61 15.82 -3.77 3.19 10.98 -3.52 3.47<br />
10:42 AM 10032 20.76 4.02 9.84 15.23 -3.51 3.45 15.68 -4.36 2.60 15.82 -3.77 3.19 10.98 -3.52 3.47<br />
10:43 AM 10033 20.75 4.01 9.83 15.23 -3.51 3.45 15.68 -4.36 2.60 15.82 -3.77 3.19 10.98 -3.52 3.47<br />
10.44 AM 10034 20.76 4.02 9.84 15.23 -3.51 3.45 15.68 -4.36 2.60 15.82 -3.77 3.19 10.98 -3.52 3.47<br />
10:45 AM 10035 20.75 4.01 9.83 15.23 -3.51 3.45 15.68 -4.36 2.60 15.82 -3.77 3.19 10.97 -3.53 3.46 W<strong>at</strong>er sample collected,<br />
10:46 AM 10036 20.75 4.01 9.83 15.22 -3.52 3.44 15.68 -4.36 2.60 15.82 -3.77 3.19 10.97 -3.53 3.46<br />
T=57.6F (electronic)<br />
10:47 AM 10037 20.76 4.02 9.84 15.23 -3.51 3.45 15.68 -4.36 2.60 15.82 -3.77 3.19 10.96 -3.54 3.45<br />
10:48 AM 10038 20.75 4.01 9.83 15.23 -3.51 3.45 15.68 -4.36 2.60 15.82 -3.77 3.19 10.97 -3.53 3.46<br />
10.49 AM 10039 20.75 4.01 9.83 15.23 -3.51 3.45 15.68 -4.36 2.60 15.82 -3.77 3.19 10.97 -3.53 3.46<br />
10:50 AM 10040 20.76 4.02 9.84 15.23 -3.51 3.45 15.68 -4.36 2.60 15.82 -3.77 3.19 10.97 -3.53 3.46 River temper<strong>at</strong>ure,<br />
10:51 AM 10041 20.76 4.02 9.84 15.22 -3.52 3.44 15.68 -4.36 2.60 15.82 -3.77 3.19 10.96 -3.54 3.45 T=79.5F (glass)<br />
10.52 AM 10042 20.76 4.02 9.84 15.22 -3.52 3.44 15.68 -4.36 2.60 15.82 -3.77 3.19 10.97 -3.53 3.46<br />
10:53 AM 10043 20.76 4.02 9.84 15.23 -3.51 3.45 15.68 -4.36 2.60 15.82 -3.77 3.19 10.98 -3.52 3.47<br />
10:54 AM 10044 20.76 4.02 9.84 15.23 -3.51 3.45 15.68 -4.36 2.60 15.82 -3.77 3.19 10.98 -3.52 3.47<br />
10.55 AM 10045 20.76 4.02 9.84 15.23 -3.51 3.45 15.68 -4.36 2.60 15.82 -3.77 3.19 10.96 -3.54 3.45<br />
10:56 AM 10046 15.24 -3.50 3.46 15.69 -4.35 2.61 15.82 -3.77 3.19<br />
10:57 AM 10047 15.26 -3.48 3.48 15.71 -4.33 2.63<br />
10:58 AM 10048 15.27 -3.47 3.49 - End Omnid<strong>at</strong>a logging<br />
10:59 AM 10049 11:00 AM 10050 —<br />
11:04 AM 10054 20.74 4.00 9.83 15.24 -3.50 3.47 15.68 -4.36 2.61 15.82 -3.77 3.20 11.00 -3.50 3.50 Begin McDAS logging<br />
10055 20.76 4.02 9.85 15.23 -3.51 3.46 15.68 -4.36 2.61 15.82 -3.77 3.20 10.99 -3.51 3.49<br />
+Adjusted drawdowns result from correl<strong>at</strong>ion with river stage d<strong>at</strong>a (see text)<br />
*Piezometer/R<strong>at</strong>e reading within 5 minutes of indic<strong>at</strong>ed time
<strong>Ground</strong> -W<strong>at</strong>er Investig<strong>at</strong>ion <strong>at</strong> <strong>Mount</strong> <strong>Carmel</strong><br />
Second Long-Term Test- -Test Well 2 (Continued)<br />
June 28-July 7,1993<br />
Pumped Test Well 2 Observ<strong>at</strong>ion Well 1 Observ<strong>at</strong>ion Well 2 Observ<strong>at</strong>ion Well 3 Observ<strong>at</strong>ion Well 4<br />
D<strong>at</strong>e/ Elapsed Depth to Drawdown Depth to Drawdown Depth to Drawdown Depth to Drawdown Depth to Drawdown Piez<br />
Hour time W<strong>at</strong>er Obs Adj+ W<strong>at</strong>er Obs Adj+ W<strong>at</strong>er Obs Adj+ W<strong>at</strong>er Obs Adj+ W<strong>at</strong>er Obs Adj+ Head R<strong>at</strong>e Remarks<br />
(min) (ft) (ft) (ft) (ft) (ft) (ft) (ft) (ft) (ft) (ft) (ft) (ft) (ft) (ft) (ft) (ft) (gpm)<br />
10056 20.74 4.00 9.83 15.23 -3.51 3.46 15.68 -4.36 2.61 15.82 -3.77 3.20 10.98 -3.52 3.48<br />
10057 20.76 4.02 9.85 15.23 -3.51 3.46 15.68 -4.36 2.61 15.82 -3.77 3.20 10.99 -3.51 3.49<br />
10058 20.76 4.02 9.85 15.22 -3.52 3.45 15.68 -4.36 2.61 15.82 -3.77 3.20 12.54 -1.96<br />
11:09 AM 10059 20.74 4.00 9.83 15.22 -3.52 3.45 15.68 -4.36 2.61 15.82 -3.77 3.20 10.% -3.54 3.46<br />
10060 20.73 3.99 9.83 15.22 -3.52 3.45 15.68 -4.36 2.61 15.82 -3.77 3.20 10.95 -3.55 3.45<br />
10061 20.74 4.00 9.83 15.22 -3.52 3.45 15.68 -4.36 2.61 10.% -3.54 3.46<br />
10062 20.72 3.98 9.82 15.22 -3.52 3.45 15.68 -4.36 2.61 15.77 -3.82 3.15 10.97 -3.53 3.47<br />
10063 20.76 4.02 9.85 15.22 -3.52 3.45 15.69 -4.35 2.62 15.82 -3.77 3.20 10.97 -3.53 3.47<br />
11:14AM 10064 20.75 4.01 9.84 15.22 -3.52 3.45 15.69 -4.35 2.62 15.81 -3.78 3.19 10.% -3.54 3.46<br />
10065 20.74 4.00 9.83 15.22 -3.52 3.45 15.68 -4.36 2.61 15.82 -3.77 3.20 10.% -3.54 3.46<br />
10066 20.76 4.02 9.85 15.21 -3.53 3.44 15.68 -4.36 2.61 15.82 -3.77 3.20 10.91 -3.59 3.41<br />
10067 20.78 4.04 9.87 15.22 -3.52 3.45 15.68 -4.36 2.61 15.82 -3.77 3.20 10.93 -3.57 3.43<br />
10068 20.76 4.02 9.85 15.22 -3.52 3.45 15.68 -4.36 2.61 15.81 -3.78 3.19 10.% -3.54 3.46<br />
11:19 AM 10069 20.75 4.01 9.84 15.22 -3.52 3.45 15.68 -4.36 2.61 15.82 -3.77 3.20 10.% -3.54 3.46<br />
10070 20.76 4.02 9.85 15.22 -3.52 3.45 15.68 -4.36 2.61 15.82 -3.77 3.20 10.95 -3.55 3.45<br />
11:20 AM 10070 Pump OFF<br />
11:20 AM 0.000<br />
0.001<br />
0.002<br />
0.003<br />
0.004<br />
0.005<br />
0.006<br />
0.007<br />
0.008<br />
0.009<br />
0.010<br />
0.012<br />
0.015<br />
0.020<br />
0.025<br />
0.031<br />
0.035<br />
0.040<br />
0.045<br />
0.050<br />
0.055<br />
0.060<br />
0.069<br />
0.079<br />
0.091<br />
0.10<br />
0.12<br />
0.14<br />
0.16<br />
0.18<br />
20.72<br />
20.72<br />
20.74<br />
20.73<br />
20.70<br />
20.82<br />
20.77<br />
20.75<br />
20.73<br />
20.73<br />
20.72<br />
20.50<br />
19.93<br />
19.56<br />
19.56<br />
19.34<br />
19.16<br />
18.86<br />
18.56<br />
18.17<br />
17.84<br />
17.47<br />
16.79<br />
16.27<br />
15.70<br />
15.28<br />
14.65<br />
14.17<br />
13.84<br />
13.58<br />
15.22<br />
15.22<br />
15.22<br />
15.22<br />
15.22<br />
15.22<br />
15.22<br />
15.22<br />
15.22<br />
15.22<br />
15.21<br />
15.22<br />
15.22<br />
15.22<br />
15.22<br />
15.22<br />
15.21<br />
15.22<br />
15.21<br />
15.21<br />
15.21<br />
15.21<br />
15.20<br />
15.19<br />
15.18<br />
15.17<br />
15.14<br />
15.10<br />
15.06<br />
15.02<br />
15.68<br />
15.68<br />
15.69<br />
15.68<br />
15.68<br />
15.69<br />
15.68<br />
15.68<br />
15.67<br />
15.68<br />
15.67<br />
15.68<br />
15.69<br />
15.69<br />
15.69<br />
15.69<br />
15.69<br />
15.68<br />
15.69<br />
15.68<br />
15.68<br />
15.69<br />
15.68<br />
15.68<br />
15.67<br />
15.68<br />
15.67<br />
15.66<br />
15.66<br />
15.65<br />
16.90<br />
16.90<br />
16.90<br />
16.90<br />
16.90<br />
16.90<br />
16.90<br />
16.90<br />
16.90<br />
16.90<br />
16.90<br />
16.90<br />
16.90<br />
16.90<br />
16.90<br />
16.90<br />
16.90<br />
16.90<br />
16.90<br />
16.90<br />
16.90<br />
16.90<br />
16.90<br />
16.90<br />
16.90<br />
16.90<br />
16.90<br />
16.90<br />
16.90<br />
16.90<br />
10.93<br />
10.94<br />
10.94<br />
10.94<br />
10.94<br />
10.94<br />
10.94<br />
10.94<br />
10.94<br />
10.94<br />
10.94<br />
10.94<br />
10.94<br />
10.94<br />
10.93<br />
10.93<br />
10.94<br />
10.94<br />
10.94<br />
10.93<br />
10.93<br />
10.93<br />
10.93<br />
10.93<br />
10.92<br />
10.91<br />
10.92<br />
10.90<br />
10.89<br />
10.89<br />
Recovery<br />
+Adjusted drawdowns result from correl<strong>at</strong>ion with river stage d<strong>at</strong>a (see text)<br />
*Piezometer/R<strong>at</strong>e reading within 5 minutes of indic<strong>at</strong>ed time
<strong>Ground</strong>-W<strong>at</strong>er Investig<strong>at</strong>ion <strong>at</strong> <strong>Mount</strong> <strong>Carmel</strong><br />
Second Long-Term Test- -Test Well 2 (Continued)<br />
June 28-July 7,1993<br />
Pumped Test Well 2 Observ<strong>at</strong>ion Well 1 Observ<strong>at</strong>ion Well 2 Observ<strong>at</strong>ion Well 3 Observ<strong>at</strong>ion Well 4<br />
D<strong>at</strong>e/ Elapsed Depth to Drawdown Depth to Drawdown Depth to Drawdown Depth to Drawdown Depth to Drawdown Piez<br />
Hour time W<strong>at</strong>er Obs Adj+ W<strong>at</strong>er Obs Adj+ W<strong>at</strong>er Obs Adj+ W<strong>at</strong>er Obs Adj+ W<strong>at</strong>er Obs Adj+ Head R<strong>at</strong>e Remarks<br />
(min) (ft) (ft) (ft) (ft) (ft) (ft) (ft) (ft) (ft) (ft) (ft) (ft) (ft) (ft) (ft) (ft) (gpm)<br />
0.20<br />
0.22<br />
0.24<br />
0.26<br />
0.28<br />
0.30<br />
0.35<br />
0.40<br />
0.46<br />
0.50<br />
0.55<br />
0.60<br />
0.65<br />
0.74<br />
0.80<br />
0.86<br />
0.90<br />
0.96<br />
11:21 AM 1.0<br />
1.2<br />
1.4<br />
1.6<br />
1.8<br />
2.0<br />
2.2<br />
2.5<br />
3.0<br />
3.5<br />
4.0<br />
4.5<br />
5.0<br />
6.1<br />
7.1<br />
8.0<br />
9.0<br />
11:30 AM 10.1<br />
12.1<br />
14.1<br />
16.2<br />
18.1<br />
11:40 AM 19.9<br />
21.8<br />
23.9<br />
26.1<br />
28.0<br />
11:50 AM 30.0<br />
35.2<br />
13.45<br />
13.44<br />
13.47<br />
13.54<br />
13.65<br />
13.71<br />
13.79<br />
13.73<br />
13.69<br />
13.62<br />
13.56<br />
13.50<br />
13.44<br />
13.33<br />
13.27<br />
13.23<br />
13.18<br />
13.13<br />
13.09<br />
12.92<br />
12.79<br />
12.67<br />
12.58<br />
12.48<br />
12.43<br />
12.32<br />
12.18<br />
12.07<br />
11.98<br />
11.91<br />
11.87<br />
11.79<br />
11.72<br />
11.69<br />
11.66<br />
11.63<br />
11.60<br />
11.57<br />
11.56<br />
11.55<br />
11.54<br />
11.52<br />
11.52<br />
11.51<br />
11.51<br />
11.50<br />
11.47<br />
14.97<br />
14.94<br />
14.90<br />
14.88<br />
14.84<br />
14.82<br />
14.76<br />
14.72<br />
14.67<br />
14.64<br />
14.61<br />
14.58<br />
14.55<br />
14.49<br />
14.46<br />
14.44<br />
14.42<br />
14.39<br />
14.37<br />
14.29<br />
14.22<br />
14.16<br />
14.11<br />
14.06<br />
14.01<br />
13.95<br />
13.87<br />
13.80<br />
13.74<br />
13.70<br />
13.66<br />
13.60<br />
13.54<br />
13.51<br />
13.49<br />
13.48<br />
13.45<br />
13.43<br />
13.42<br />
13.41<br />
13.40<br />
13.39<br />
13.38<br />
13.37<br />
13.36<br />
13.36<br />
13.35<br />
15.63<br />
15.63<br />
15.63<br />
15.62<br />
15.61<br />
15.61<br />
15.59<br />
15.57<br />
15.56<br />
15.54<br />
15.54<br />
15.52<br />
15.51<br />
15.49<br />
15.48<br />
15.47<br />
15.46<br />
15.44<br />
15.44<br />
15.40<br />
15.37<br />
15.33<br />
15.31<br />
15.28<br />
15.26<br />
15.23<br />
15.17<br />
15.13<br />
15.09<br />
15.06<br />
15.04<br />
14.99<br />
14.96<br />
14.94<br />
14.92<br />
14.90<br />
14.88<br />
14.86<br />
14.85<br />
14.85<br />
14.84<br />
14.83<br />
14.83<br />
14.82<br />
14.81<br />
14.81<br />
14.80<br />
16.90<br />
16.90<br />
16.90<br />
16.90<br />
16.90<br />
16.90<br />
16.90<br />
16.90<br />
16.90<br />
16.90<br />
16.90<br />
16.90<br />
16.90<br />
16.90<br />
15.78<br />
15.78<br />
15.78<br />
15.77<br />
15.77<br />
15.75<br />
15.74<br />
15.74<br />
15.73<br />
15.72<br />
15.72<br />
15.70<br />
15.69<br />
15.68<br />
15.67<br />
15.65<br />
15.65<br />
15.62<br />
15.61<br />
15.61<br />
15.59<br />
15.58<br />
15.57<br />
15.56<br />
15.56<br />
15.55<br />
15.55<br />
15.54<br />
15.53<br />
15.53<br />
15.53<br />
15.53<br />
15.52<br />
10.87<br />
10.87<br />
10.86<br />
10.86<br />
10.85<br />
10.84<br />
10.83<br />
10.82<br />
10.81<br />
10.80<br />
10.80<br />
10.78<br />
10.77<br />
10.76<br />
10.75<br />
10.74<br />
10.73<br />
10.73<br />
10.72<br />
10.69<br />
10.66<br />
10.64<br />
10.62<br />
10.60<br />
10.58<br />
10.56<br />
10.50<br />
10.48<br />
10.44<br />
10.42<br />
10.40<br />
10.33<br />
10.16<br />
10.13<br />
10.19<br />
10.26<br />
10.29<br />
10.27<br />
10.25<br />
10.24<br />
10.22<br />
10.05<br />
10.05<br />
10.03<br />
10.06<br />
10.14<br />
10.14<br />
+Adjusted drawdowns result from correl<strong>at</strong>ion with river stage d<strong>at</strong>a (see text)<br />
*Piezometer/R<strong>at</strong>e reading within 5 minutes of indic<strong>at</strong>ed time
<strong>Ground</strong>—W<strong>at</strong>er Investig<strong>at</strong>ion <strong>at</strong> <strong>Mount</strong> <strong>Carmel</strong><br />
Second Long-Term Test—Test Well 2 (Concluded)<br />
June 28-July 7,1993<br />
Pumped Test Well 2 Observ<strong>at</strong>ion Well 1 Observ<strong>at</strong>ion Well 2 Observ<strong>at</strong>ion Well 3 Observ<strong>at</strong>ion Well 4<br />
D<strong>at</strong>e/ Elapsed Depth to Drawdown Depth to Drawdown Depth to Drawdown Depth to Drawdown Depth to Drawdown Piez<br />
Hour time W<strong>at</strong>er Obs Adj+ W<strong>at</strong>er Obs Adj+ W<strong>at</strong>er Obs Adj+ W<strong>at</strong>er Obs Adj+ W<strong>at</strong>er Obs Adj+ Head R<strong>at</strong>e Remarks<br />
(min) (ft) (ft) (ft) (ft) (ft) (ft) (ft) (ft) (ft) (ft) (ft) (ft) (ft) (ft) (ft) (ft) (gpm)<br />
12:00 PM 40.4 11.46<br />
13.34<br />
14.79<br />
15.51<br />
10.16<br />
45.3 11.46<br />
13.32<br />
14.78<br />
15.51<br />
9.86<br />
50.8 11.43<br />
13.32<br />
14.77<br />
15.50<br />
10.10<br />
55.7 11.43<br />
13.31<br />
14.76<br />
15.50<br />
10.03<br />
12:21 PM 61.1 11.41 13.30 14.75 15.49 10.03<br />
12:24 PM 63.9 11.41 13.29 14.75 15.49 10.01 End McDAS logging<br />
Begin Onmid<strong>at</strong>aiogging<br />
12:30 PM 70.0 11.41 13.29 14.75 15.49 10.03<br />
12:31 PM 71.0 11.41 13.29 14.75 15.49 10.03<br />
12:32 PM 72.0 11.40 13.29 14.74 15.49 10.04<br />
12:33 PM 73.0 11.40 13.29 14.74 15.48 10.00<br />
12:34 PM 74.0 11.40 13.29 14.74 15.49 10.04<br />
12:35 PM 75.0 11.39 13.29 14.74 15.48 10.05<br />
12:36 PM 76.0 11.39 13.29 14.74 15.48 10.06<br />
12:37 PM 77.0 11.39 13.28 14.73 15.48 10.05<br />
12:38 PM 78.0 11.39 13.28 14.73 15.48 10.04<br />
12:39 PM 79.0 11.38 13.28 14.73 15.48 10.04<br />
12:40 PM 80.0 11.38 13.28 14.73 15.48 10.04<br />
12:41 PM 81.0 11.38 13.28 14.73 15.48 10.02<br />
12:42 PM 82.0 11.37 13.28 14.73 15.48 10.02<br />
12:43 PM 83.0 11.37 13.27 14.72 15.48 10.03<br />
1244 PM 84.0 11.37 13.28 14.73 15.48 10.04<br />
12:45 PM 85.0 11.36 13.27 14.72 15.47 10.03<br />
12:46 PM 86.0 11.36 13.27 14.72 15.48 10.02<br />
12:47 PM 87.0 11.36 13.27 14.72 15.47 10.01<br />
12:48 PM 88.0 11.35 13.27 14.72 15.47 10.02<br />
12:49 PM 89.0 11.35 13.27 14.72 15.47 10.01<br />
12:50 PM 90.0 11.35 13.26 14.71 15.47 10.00<br />
12:51 PM 91.0 11.35 13.26 14.71 15.47 9.99<br />
12:52 PM 92.0 11.34 13.26 14.71 15.47 9.99<br />
12:53 PM 93.0 11.34 13.26 14.71 15.47 10.00<br />
12:54 PM 94.0 11.34 13.26 14.71 15.47 10.00<br />
12:55 PM 95.0 11.33 13.26 14.71 15.47 9.99<br />
12:56 PM 96.0 11.33 13.26 14.70 15.46 9.99<br />
12:57 PM 97.0 11.33 13.25 14.70 15.47 10.00<br />
12:58 PM 98.0 11.33 13.25 14.70 15.46 9.99<br />
12:59 PM 99.0 11.32 13.25 14.70 15.46 9.99 End of Test<br />
+Adjusted drawdowns result from correl<strong>at</strong>ion with river stage d<strong>at</strong>a (see text)<br />
*Piezometer/R<strong>at</strong>e reading within 5 minutes of indic<strong>at</strong>ed time
Appendix F.<br />
Third Long-Term Aquifer Test: W<strong>at</strong>er-Level Measurements<br />
(August-September 1993)
<strong>Ground</strong>-W<strong>at</strong>er Investig<strong>at</strong>ion <strong>at</strong> <strong>Mount</strong> <strong>Carmel</strong>, <strong>IL</strong><br />
Third Long-Term Test—Test Well 2<br />
August 24-September 2,1993<br />
Pumped Test Well 2 Observ<strong>at</strong>ion Well 1 Observ<strong>at</strong>ion Well 2 Observ<strong>at</strong>ion Well 3 Observ<strong>at</strong>ion Well 4<br />
D<strong>at</strong>e/ Elapsed Depth to Drawdown Depth to Drawdown Depth to Drawdown Depth to Drawdown Depth to Drawdown Piez<br />
Hour time W<strong>at</strong>er Obs Adj+ W<strong>at</strong>er Obs Adj+ W<strong>at</strong>er Obs Adj+ W<strong>at</strong>er Obs Adj+ W<strong>at</strong>er Obs Adj+ Head R<strong>at</strong>e Remarks<br />
(min) (ft) (ft) (ft) (ft) (ft) (ft) (ft) (ft) (ft) (ft) (ft) (ft) (ft) (ft) (ft) (ft) (gpm)<br />
08/24/93<br />
12:19 PM -96 17.50 17.07<br />
12:20 PM -95 17.50 17.07<br />
12:21 PM -94 17.02<br />
01:00 PM -55<br />
01:01 PM -54 14.25 16.18 17.51 12.27<br />
01:02 PM -53 14.25 16.18 17.51 12.27<br />
01:03 PM -52 14.25 16.18 17.51 12.31<br />
01:04 PM -51<br />
01:05 PM -50 14.25 16.18 17.51 12.33<br />
01:10 PM -45 14.25 16.17 17.51 12.31<br />
01:15 PM -40 14.25 16.17 17.51 12.26<br />
01:20 PM -35 14.25 16.17 17.51 12.30<br />
01:25 PM -30 14.25 16.16 17.51 12.28<br />
01:30 PM -25 14.22 16.14 17.49 17.06 12.28 OW 2 Measured depth<br />
01:35 PM -20 14.22 16.14 17.49 17.06 12.29<br />
01:40 PM -15 14.22 16.14 17.49 17.06 12.29<br />
01:41 PM -14 14.22 16.14 17.49 17.06 12.25<br />
01:42 PM -13 14.22 16.14 17.49 17.06 12.25<br />
01:43 PM -12 14.22 16.14 17.49 17.07 12.24<br />
01:44 PM -11 14.22 16.14 17.49 17.07 12.27<br />
01:45 PM -10 14.22 16.14 17.49 17.07 12.28<br />
01:46 PM -9 14.22 16.14 17.49 17.07 12.28<br />
01:47 PM -8 14.22 16.14 17.49 17.07 12.30<br />
01:48 PM -7 14.22 16.14 17.49 17.07 12.32<br />
01:49 PM -6 14.22 16.14 17.49 17.07 12.29<br />
01:50 PM -5 14.22 16.14 17.49 17.07 12.28<br />
01:51 PM -4 14.22 16.14 17.49 17.07 12.28<br />
01:52 PM -3 14.22 16.14 17.50 17.07 12.29<br />
01:53 PM -2 14.22 16.14 17.49 17.07 12.29<br />
01:54 PM -1 14.22 16.14 17.50 17.07 12.30<br />
01:55 PM 0 14.25 0.00 16.15 0.00 17.51 0.00 17.07 0.00 12.30 0.00 Pump ON<br />
01:56 PM 1 22.00 7.78 7.20 16.85 0.71 0.70 17.74 0.25 0.23 17.11 0.04 0.04 12.51 0.21 0.21 2.75 900<br />
01:57 PM 2 22.56 8.34 7.68 17.11 0.97 0.96 17.89 0.40 0.38 17.15 0.08 0.08 12.66 0.36 0.36 2.77 904<br />
01:58 PM 3 23.02 8.80 8.07 17.27 1.13 1.12 17.99 0.50 0.48 17.18 0.11 0.11 12.76 0.46 0.46<br />
01:59 PM 4 23.18 8.96 8.21 17.38 1.24 1.23 18.08 0.59 0.57 17.21 0.14 0.14 12.83 0.53 0.53<br />
02:00 PM 5 23.31 9.09 8.31 17.45 1.31 1.30 18.14 0.65 0.63 17.23 0.16 0.16 12.88 0.58 0.58<br />
02:01 PM 6 23.41 9.19 8.40 17.51 1.37 1.36 18.19 0.70 0.68 17.25 0.18 0.18 12.91 0.61 0.61<br />
02:02 PM 7 23.47 9.25 8.45 17.55 1.41 1.40 18.22 0.73 0.71 17.27 0.20 0.20 12.91 0.61 0.61<br />
02:03 PM 8 23.53 9.31 8.50 17.58 1.44 1.43 18.25 0.76 0.74 17.29 0.22 0.22 12.97 0.67 0.67 2.77 904<br />
02:04 PM 9 23.57 9.35 8.53 17.60 1.46 1.45 18.28 0.79 0.77 17.30 0.23 0.23 13.00 0.70 0.70<br />
02:05 PM 10 23.59 9.37 8.55 17.62 1.48 1.47 18.30 0.81 0.79 17.31 0.24 0.24 13.00 0.70 0.70<br />
02:06 PM 11 23.62 9.40 8.57 17.64 1.50 1.49 18.31 0.82 0.80 17.32 0.25 0.25 13.00 0.70 0.70<br />
02:07 PM 12 23.64 9.42 8.59 17.65 1.51 1.50 18.32 0.83 0.81 17.33 0.26 0.26 13.03 0.73 0.73<br />
02:08 PM 13 23.65 9.43 8.60 17.66 1.52 1.51 18.33 0.84 0.82 17.34 0.27 0.27 13.04 0.74 0.74<br />
02:09 PM 14 23.66 9.44 8.61 17.67 1.53 1.52 18.34 0.85 0.83 17.34 0.27 0.27 13.06 0.76 0.76<br />
02:10 PM 15 23.68 9.46 8.62 17.68 1.54 1.52 18.35 0.86 0.83 17.35 0.28 0.27 13.07 0.77 0.76<br />
02:11 PM 16 23.69 9.47 8.62 17.69 1.55 1.53 18.36 0.87 0.84 17.35 0.28 0.27 13.06 0.76 0.75<br />
+ Adjusted drawdowns result from correl<strong>at</strong>ion with river stage d<strong>at</strong>a (see text) *Piezometer/R<strong>at</strong>e reading within 5 minutes of indic<strong>at</strong>ed time
<strong>Ground</strong>-W<strong>at</strong>er Investig<strong>at</strong>ion <strong>at</strong> <strong>Mount</strong> <strong>Carmel</strong>, <strong>IL</strong><br />
Third Long-Term Test—Test Well 2 (Continued)<br />
August 24-September 2,1993<br />
Pumped Test Well 2 Observ<strong>at</strong>ion Well 1 Observ<strong>at</strong>ion Well 2 Observ<strong>at</strong>ion Well 3 Observ<strong>at</strong>ion Well 4<br />
D<strong>at</strong>e/ Elapsed Depth to Drawdown Depth to Drawdown Depth to Drawdown Depth to Drawdown Depth to Drawdown Piez<br />
Hour time W<strong>at</strong>er Obs Adj+ W<strong>at</strong>er Obs Adj+ W<strong>at</strong>er Obs Adj+ W<strong>at</strong>er Obs Adj+ W<strong>at</strong>er Obs Adj+ Head R<strong>at</strong>e Remarks<br />
(min) (ft) (ft) (ft) (ft) (ft) (ft) (ft) (ft) (ft) (ft) (ft) (ft) (ft) (ft) (ft) (ft) (gpm)<br />
02:12 PM 17 23.70 9.48 8.63 17.69 1.55 1.53 18.37 0.88 0.85 17.36 0.29 0.28 13.07 0.77 0.76<br />
02:13 PM 18 23.71 9.49 8.64 17.70 1.56 1.54 18.38 0.89 0.86 17.36 0.29 0.28 13.09 0.79 0.78<br />
02:14 PM 19 23.71 9.49 8.64 17.70 1.56 1.54 18.38 0.89 0.86 17.37 0.30 0.29 13.09 0.79 0.78<br />
02:15 PM 20 23.72 9.50 8.65 17.71 1.57 1.55 18.39 0.90 0.87 17.37 0.30 0.29 13.10 0.80 0.79<br />
02:16 PM 21 23.72 9.50 8.65 17.71 1.57 1.55 18.39 0.90 0.87 17.38 0.31 0.30 13.13 0.83 0.82<br />
02:17 PM 22 23.74 9.52 8.67 17.72 1.58 1.56 18.40 0.91 0.88 17.38 0.31 0.30 13.13 0.83 0.82<br />
02:18 PM 23 23.73 9.51 8.66 17.72 1.58 1.56 18.40 0.91 0.88 17.38 0.31 0.30 13.14 0.84 0.83<br />
02:19 PM 24 23.75 9.53 8.67 17.72 1.58 1.56 18.41 0.92 0.89 17.39 0.32 0.31 13.14 0.84 0.83<br />
02:20 PM 25 23.75 9.53 8.67 17.72 1.58 1.56 18.41 0.92 0.89 17.39 0.32 0.31 13.14 0.84 0.83<br />
02:21 PM 26 23.75 9.53 8.67 17.73 1.59 1.57 18.42 0.93 0.90 17.39 0.32 0.31 13.15 0.85 0.84<br />
02:22 PM 27 23.76 9.54 8.68 17.73 1.59 1.57 18.42 0.93 0.90 17.40 0.33 0.32 13.17 0.87 0.86<br />
02:23 PM 28 23.76 9.54 8.68 17.74 1.60 1.58 18.42 0.93 0.90 17.40 0.33 0.32 13.18 0.88 0.87<br />
02:24 PM 29 23.77 9.55 8.68 17.74 1.60 1.58 18.43 0.94 0.91 17.40 0.33 0.32 13.18 0.88 0.87<br />
02:25 PM 30 23.78 9.56 8.69 17.74 1.60 1.58 18.43 0.94 0.91 17.41 0.34 0.33 13.18 0.88 0.87<br />
02:30 PM 35 23.79 9.57 8.70 17.75 1.61 1.59 18.45 0.96 0.93 17.42 0.35 0.34 13.21 0.91 0.90<br />
02:35 PM 40 23.81 9.59 8.72 17.76 1.62 1.60 18.46 0.97 0.94 17.43 0.36 0.35 13.21 0.91 0.90<br />
02:40 PM 45 23.83 9.61 8.73 17.77 1.63 1.61 18.48 0.99 0.% 17.44 0.37 0.36 13.28 0.98 0.97<br />
02:45 PM 50 23.85 9.63 8.75 17.78 1.64 1.62 18.48 0.99 0.96 17.45 0.38 0.37 13.25 0.95 0.94<br />
02:50 PM 55 23.87 9.65 8.76 17.79 1.65 1.62 18.50 1.01 0.97 17.46 0.39 0.37 13.28 0.98 0.96<br />
02:55 PM 60 23.89 9.67 8.78 17.79 1.65 1.62 18.50 1.01 0.97 17.47 0.40 0.38 13.30 1.00 0.98<br />
03:00 PM 65 23.90 9.68 8.79 17.80 1.66 1.63 18.51 1.02 0.98 17.48 0.41 0.39 13.31 1.01 0.99 2.75 900 •<br />
03:05 PM 70 23.92 9.70 8.80 17.81 1.67 1.64 18.52 1.03 0.99 17.49 0.42 0.40 13.32 1.02 1.00<br />
03:10 PM 75 23.93 9.71 8.81 17.81 1.67 1.64 18.53 1.04 1.00 17.49 0.42 0.40 13.38 1.08 1.06 River temp = 80.8F<br />
03:12 PM 77 23.93 9.71 8.81 17.81 1.67 1.64 18.53 1.04 1.00 17.49 0.42 0.40 13.36 1.06 1.04 GW temp = 56.1F<br />
03:15 PM 80 23.94 9.72 8.81 17.82 1.68 1.64 18.53 1.04 0.99 17.50 0.43 0.41 13.35 1.05 1.03 2.75 900 •<br />
03:20 PM 85 23.95 9.73 8.82 17.82 1.68 1.64 18.54 1.05 1.00 17.50 0.43 0.41 13.36 1.06 1.04<br />
03:25 PM 90 23.97 9.75 8.84 17.83 1.69 1.65 18.55 1.06 1.01 17.51 0.44 0.42 13.37 1.07 1.05 2.75 900 *<br />
03:30 PM 95 23.98 9.76 8.85 17.83 1.69 1.65 18.56 1.07 1.02 17.52 0.45 0.43 13.39 1.09 1.07<br />
03:35 PM 100 23.99 9.77 8.85 17.84 1.70 1.66 18.57 1.08 1.03 17.53 0.46 0.44 13.39 1.09 1.07<br />
03:40 PM 105 24.00 9.78 8.86 17.85 1.71 1.67 18.58 1.09 1.04 17.53 0.46 0.44 13.41 1.11 1.09<br />
03:45 PM 110 24.01 9.79 8.87 17.85 1.71 1.66 18.58 1.09 1.04 17.54 0.47 0.44 13.43 1.13 1.10<br />
03:49 PM 114 24.02 9.80 8.87 17.86 1.72 1.67 18.59 1.10 1.05 17.54 0.47 0.44 13.43 1.13 1.10<br />
04:01 PM 126 24.04 9.82 8.89 17.87 1.73 1.68 18.61 1.12 1.07 17.56 0.49 0.46 13.46 1.16 1.13<br />
04:11 PM 136 24.06 9.84 8.91 17.87 1.73 1.68 18.62 1.13 1.08 17.57 0.50 0.47 13.48 1.18 1.15<br />
04:21 PM 146 24.08 9.86 8.92 17.88 1.74 1.69 18.63 1.14 1.08 17.58 0.51 0.47 13.50 1.20 1.17<br />
04:31 PM 156 24.09 9.87 8.92 17.89 1.75 1.69 18.64 1.15 1.08 17.59 0.52 0.48 13.51 1.21 1.17<br />
04:41 PM 166 24.10 9.88 8.93 17.90 1.76 1.70 18.65 1.16 1.09 17.59 0.52 0.48 13.53 1.23 1.19<br />
04:51 PM 176 24.12 9.90 8.94 17.90 1.76 1.69 18.66 1.17 1.09 17.60 0.53 0.48 13.56 1.26 1.22<br />
05:01 PM 186 24.14 9.92 8.95 17.91 1.77 1.70 18.67 1.18 1.10 17.61 0.54 0.49 13.58 1.28 1.24<br />
05:11 PM 196 24.16 9.94 8.97 17.92 1.78 1.71 18.69 1.20 1.12 17.62 0.55 0.50 13.59 1.29 1.25<br />
05:21 PM 206 24.17 9.95 8.97 17.93 1.79 1.71 18.69 1.20 1.12 17.63 0.56 0.50 13.59 1.29 1.24<br />
05:31 PM 216 24.19 9.97 8.99 17.94 1.80 1.72 18.71 1.22 1.14 17.64 0.57 0.51 13.62 1.32 1.27<br />
05:41 PM 226 24.21 9.99 9.00 17.95 1.81 1.73 18.72 1.23 1.14 17.64 0.57 0.51 13.62 1.32 1.27<br />
05:51 PM 236 24.22 10.00 9.00 17.95 1.81 1.72 18.73 1.24 1.14 17.65 0.58 0.51 13.64 1.34 1.28 2.75 900 *<br />
06:01 PM 246 24.08 9.86 8.89 17.94 1.80 1.71 18.73 1.24 1.14 17.66 0.59 0.52 13.65 1.35 1.29<br />
06:11 PM 256 24.08 9.86 8.89 17.95 1.81 1.72 18.73 1.24 1.14 17.66 0.59 0.52 13.66 1.36 1.30<br />
06:21 PM 266 24.23 10.01 9.01 17.97 1.83 1.73 18.75 1.26 1.16 17.67 0.60 0.53 13.68 1.38 1.32<br />
06:31 PM 276 24.25 10.03 9.02 17.98 1.84 1.73 18.76 1.27 1.16 17.68 0.61 0.53 13.69 1.39 1.32<br />
+Adjusted drawdowns result from correl<strong>at</strong>ion with river stage d<strong>at</strong>a (see text)<br />
*Piezometer/R<strong>at</strong>e reading within 5 minutes of indic<strong>at</strong>ed time
<strong>Ground</strong>-W<strong>at</strong>er Investig<strong>at</strong>ion <strong>at</strong> <strong>Mount</strong> <strong>Carmel</strong>, <strong>IL</strong><br />
Third Long-Term Test—Test Well 2 (Continued)<br />
August 24-September 2,1993<br />
Pumped Test Well 2 Observ<strong>at</strong>ion Well 1 Observ<strong>at</strong>ion Well 2 Observ<strong>at</strong>ion Well 3 Observ<strong>at</strong>ion Well 4<br />
D<strong>at</strong>e/ Elapsed Depth to Drawdown Depth to Drawdown Depth to Drawdown . Depth to Drawdown Depth to Drawdown Piez<br />
Hour time W<strong>at</strong>er Obs Adj+ W<strong>at</strong>er Obs Adj+ W<strong>at</strong>er Obs Adj+ W<strong>at</strong>er Obs Adj+ W<strong>at</strong>er Obs Adj+ Head R<strong>at</strong>e Remarks<br />
(tnin) (ft) (ft) (ft) (ft) (ft) (ft) (ft) (ft) (ft) (ft) (ft) (ft) (ft) (ft) (ft) (ft) (gpm)<br />
06:41 PM 286 24.26 10.04 9.02 17.99 1.85 1.74 18.77 1.28 1.17 17.68 0.61 0.53 13.70 1.40 1.33<br />
06:51 PM 296 24.28 10.06 9.03 18.00 1.86 1.74 18.78 1.29 1.17 17.69 0.62 0.53 13.72 1.42 1.34<br />
07:01 PM 306 24.29 10.07 9.04 18.00 1.86 1.74 18.79 1.30 1.18 17.70 0.63 0.54 13.72 1.42 1.34<br />
07:21 PM 326 24.32 10.10 9.06 18.02 1.88 1.75 18.81 1.32 1.19 17.71 0.64 0.54 13.75 1.45 1.36<br />
07:41 PM 346 24.34 10.12 9.07 18.03 1.89 1.76 18.83 1.34 1.20 17.72 0.65 0.54 13.77 1.47 1.38<br />
08:01 PM 366 24.37 10.15 9.09 18.05 1.91 1.77 18.84 1.35 1.20 17.73 0.66 0.55 13.79 1.49 1.39 2.75 900 *<br />
08:21 PM 386 24.40 10.18 9.10 18.07 1.93 1.77 18.86 1.37 1.21 17.75 0.68 0.56 13.81 1.51 1.40<br />
08:41 PM 406 24.41 10.19 9.11 18.08 1.94 1.78 18.88 1.39 1.23 17.76 0.69 0.57 13.83 1.53 1.42<br />
09:01 PM 426 24.45 10.23 9.13 18.09 1.95 1.78 18.89 1.40 1.23 17.77 0.70 0.56 13.85 1.55 1.43<br />
09:21 PM 446 24.47 10.25 9.14 18.11 1.97 1.79 18.91 1.42 1.24 17.78 0.71 0.57 13.87 1.57 1.45<br />
09:41 PM 466 24.48 10.26 9.14 18.12 1.98 1.79 18.93 1.44 1.25 17.79 0.72 0.57 13.88 1.58 1.45<br />
10:01 PM 486 24.51 10.29 9.16 18.13 1.99 1.80 18.94 1.45 1.26 17.81 0.74 0.58 13.90 1.60 1.47 2.75 900 *<br />
10:21 PM 506 24.53 10.31 9.17 18.15 2.01 1.81 18.96 1.47 1.27 17.82 0.75 0.59 13.91 1.61 1.47<br />
10:41 PM 526 24.54 10.32 9.17 18.16 2.02 1.81 18.97 1.48 1.27 17.83 0.76 0.59 13.93 1.63 1.48<br />
11:01 PM 546 24.56 10.34 9.17 18.17 2.03 1.80 18.99 1.50 1.27 17.84 0.77 0.58 13.94 1.64 1.48<br />
11:21 PM 566 24.59 10.37 9.18 18.18 2.04 1.80 19.00 1.51 1.27 17.85 0.78 0.58 13.96 1.66 1.49<br />
11:41 PM 586 24.60 10.38 9.19 18.19 2.05 1.80 19.02 1.53 1.28 17.86 0.79 0.58 13.97 1.67 1.49<br />
08/25/93 — — — — — —<br />
12:01 AM 606 24.61 10.39 9.19 18.20 2.06 1.80 19.03 1.54 1.28 17.88 0.81 0.60 13.98 1.68 1.50<br />
12:21 AM 626 24.63 10.41 9.19 18.22 2.08 1.81 19.05 1.56 1.29 17.89 0.82 0.60 13.99 1.69 1.50<br />
2.75 900 *<br />
12:41 AM 646 24.65 10.43 9.21 18.23 2.09 1.81 19.06 1.57 1.29 17.90 0.83 0.60 14.01 1.71 1.51<br />
01:01 AM 666 24.67 10.45 9.21 18.24 2.10 1.80 19.07 1.58 1.29 17.91 0.84 0.60 14.02 1.72 1.51<br />
01:21 AM 686 24.69 10.47 9.21 18.25 2.11 1.80 19.09 1.60 1.30 17.92 0.85 0.59 14.04 1.74 1.52<br />
01:41 AM 706 24.70 10.48 9.22 18.26 2.12 1.80 19.10 1.61 1.30 17.94 0.87 0.61 14.05 1.75 1.53<br />
02:01 AM 726 24.72 10.50 9.23 18.28 2.14 1.82 19.12 1.63 1.31 17.95 0.88 0.61 14.07 1.77 1.54 2.76 902 •<br />
02:21 AM 746 24.75 10.53 9.24 18.29 2.15 1.81 19.14 1.65 1.32 17.97 0.90 0.62 14.08 1.78 1.54<br />
02:41 AM 766 24.76 10.54 9.24 18.30 2.16 1.81 19.15 1.66 1.31 17.98 0.91 0.62 14.09 1.79 1.54<br />
03:01 AM 786 24.78 10.56 9.24 18.32 2.18 1.80 19.17 1.68 1.31 17.99 0.92 0.61 14.11 1.81 1.54<br />
03:21 AM 806 24.79 10.57 9.23 18.33 2.19 1.80 19.18 1.69 1.31 18.01 0.94 0.62 14.12 1.82 1.54<br />
03:41 AM 826 24.82 10.60 9.25 18.35 2.21 1.81 19.20 1.71 1.31 18.02 0.95 0.61 14.13 1.83 1.54<br />
04:01 AM 846 24.83 10.61 9.24 18.36 2.22 1.80 19.22 1.73 1.32 18.04 0.97 0.62 14.15 1.85 1.55<br />
04:21 AM 866 24.85 10.63 9.25 18.38 2.24 1.81 19.24 1.75 1.33 18.05 0.98 0.62 14.17 1.87 1.56<br />
04:41 AM 886 24.87 10.65 9.25 18.39 2.25 1.79 19.25 1.76 1.32 18.07 1.00 0.62 14.18 1.88 1.55<br />
05:01 AM 906 24.88 10.66 9.24 18.41 2.27 1.80 19.27 1.78 1.32 18.08 1.01 0.62 14.20 1.90 1.56<br />
05:21 AM 926 24.91 10.69 9.26 18.43 2.29 1.80 19.29 1.80 1.33 18.10 1.03 0.63 14.21 1.91 1.56<br />
05:41 AM 946 24.93 10.71 9.26 18.44 2.30 1.80 19.31 1.82 1.33 18.11 1.04 0.62 14.22 1.92 1.56<br />
06:01 AM 966 24.95 10.73 9.27 18.46 2.32 1.81 19.33 1.84 1.34 18.13 1.06 0.63 14.23 1.93 1.56 2.75 900 *<br />
06:21 AM 986 24.96 10.74 9.26 18.48 2.34 1.81 19.34 1.85 1.34 18.15 1.08 0.64 14.25 1.95 1.57<br />
06:41 AM 1006 24.98 10.76 9.26 18.50 2.36 1.81 19.36 1.87 1.34 18.16 1.09 0.63 14.27 1.97 1.58<br />
07:01 AM 1026 25.01 10.79 9.27 18.52 2.38 1.81 19.38 1.89 1.34 18.18 1.11 0.64 14.28 1.98 1.57<br />
08:01 AM 1086 25.07 10.85 9.28 18.57 2.43 1.81 19.44 1.95 1.35 18.23 1.16 0.64 14.33 2.03 1.58 2.75 900 •<br />
08:21 AM 1106 25.09 10.87 9.28 18.60 2.46 1.82 19.45 1.96 1.34 18.25 1.18 0.64 14.35 2.05 1.59<br />
0901 AM 1146 25.13 10.91 9.28 18.63 2.49 1.81 19.49 2.00 1.34 18.29 1.22 0.65 14.38 2.08 1.59<br />
10:01 AM 1206 25.19 10.97 9.28 18.68 2.54 1.79 19.54 2.05 1.33 18.35 1.28 0.65 14.45 2.15 1.61 2.72 897 •<br />
11:01 AM 1266 25.34 11.12 9.35 18.75 2.61 1.80 19.61 2.12 1.34 18.41 1.34 0.66 14.48 2.18 1.59<br />
11:41 AM 1306 25.38 11.16 9.35 18.79 2.65 1.79 19.65 2.16 1.33 18.45 1.38 0.66 14.49 2.19 1.57<br />
12:01 PM 1326 25.41 11.19 9.35 18.81 2.67 1.79 19.67 2.18 1.33 18.47 1.40 0.66 14.57 2.27 1.64<br />
01:01 PM 1386 25.47 11.25 9.36 18.87 2.73 1.79 19.74 2.25 1.35 18.53 1.46 0.67 14.57 2.27 1.59<br />
+Adjusted drawdowns result from correl<strong>at</strong>ion with river stage d<strong>at</strong>a (see text)<br />
*Piezometer/R<strong>at</strong>e reading within 5 minutes of indic<strong>at</strong>ed time
<strong>Ground</strong>-W<strong>at</strong>er Investig<strong>at</strong>ion <strong>at</strong> <strong>Mount</strong> <strong>Carmel</strong>, <strong>IL</strong><br />
Third Long-Term Test—Test Well 2 (Continued)<br />
August 24-September 2, 1993<br />
Pumped Test Well 2 Observ<strong>at</strong>ion Well 1 Observ<strong>at</strong>ion Well 2 Observ<strong>at</strong>ion Well 3 Observ<strong>at</strong>ion Well 4<br />
D<strong>at</strong>e/ Elapsed Depth to Drawdown j Depth to Drawdown Depth to Drawdown Depth to Drawdown Depth to Drawdown Piez<br />
Hour time W<strong>at</strong>er Obs Adj+ W<strong>at</strong>er Obs Adj+ W<strong>at</strong>er Obs Adj+ W<strong>at</strong>er Obs Adj+ W<strong>at</strong>er Obs Adj+ Head R<strong>at</strong>e Remarks<br />
(min) (ft) (ft) (ft) (ft) (ft) (ft) (ft) (ft) (ft) (ft) (ft) (ft) (ft) 00 (ft) (ft) (gpm)<br />
01:21 PM 1406 25.49 11.27 9.35 18.89 2.75 1.79 19.76 2.27 1.34 18.55 1.48 0.67 14.61 2.31 1.61<br />
02:01 PM 1446 25.54 11.32 9.35 18.93 2.79 1.77 19.80 2.31 1.33 18.59 1.52 0.66 14.66 2.36 1.62 2.72 897 *<br />
03:01 PM 1506 25.61 11.39 9.36 18.98 2.84 1.76 19.87 2.38 1.34 18.66 1.59 0.67 14.68 2.38 1.60<br />
04:01 PM 1566 25.69 11.47 9.36 19.04 2.90 1.74 19.93 2.44 1.32 18.73 1.66 0.68 14.73 2.43 1.59 2.74 899 *<br />
04:41 PM 1606 25.74 11.52 9.36 19.08 2.94 1.73 19.98 2.49 1.33 18.77 1.70 0.68 14.75 2.45 1.57<br />
05:01 PM 1626 25.77 11.55 9.37 19.11 2.97 1.73 20.01 2.52 1.33 18.79 1.72 0.67 14.79 2.49 1.59<br />
06:01 PM 1686 25.86 11.64 9.38 19.17 3.03 1.71 20.08 2.59 1.33 18.86 1.79 0.68 14.85 2.55 1.60 2.74 899 *<br />
06:21 PM 1706 25.88 11.66 9.37 19.19 3.05 1.71 20.10 2.61 1.32 18.88 1.81 0.67 14.87 2.57 1.60<br />
07:01 PM 1746 25.94 11.72 9.38 19.24 3.10 1.70 20.15 2.66 1.32 18.93 1.86 0.68 14.90 2.60 1.59<br />
08:01 PM 1806 26.00 11.78 9.37 19.30 3.16 1.69 20.22 2.73 1.32 19.00 1.93 0.69 14.97 2.67 1.60 2.74 899 *<br />
09:01 PM 1866 26.09 11.87 9.38 19.37 3.23 1.68 20.30 2.81 1.32 19.07 2.00 0.69 15.03 2.73 1.61<br />
09:41 PM 1906 26.14 11.92 9.38 19.42 3.28 1.68 20.35 2.86 1.33 19.12 2.05 0.70 15.07 2.77 1.61<br />
10:01 PM 1926 26.16 11.94 9.38 19.44 3.30 1.67 20.37 2.88 1.32 19.14 2.07 0.69 15.09 2.79 1.61 2.74 899 •<br />
11:01 PM 1986 26.24 12.02 9.39 19.50 3.36 1.66 20.44 2.95 1.32 19.21 2.14 0.70 15.15 2.85 1.62<br />
11:21 PM 2006 26.26 12.04 9.38 19.52 3.38 1.66 20.46 2.97 1.32 19.23 2.16 0.70 15.16 2.86 1.61<br />
08/26/93 — — — — — —<br />
12:01 AM 2046 26.31 12.09 9.38 19.56 3.42 1.64 20.51 3.02 1.32 19.27 2.20 0.69 15.20 2.90 1.61 2.74 899 •<br />
01:01 AM 2106 26.38 12.16 9.39 19.61 3.47 1.63 20.57 3.08 1.32 19.34 2.27 0.71 15.26 2.% 1.62<br />
02:01 AM 2166 26.44 12.22 9.38 19.67 3.53 1.61 20.64 3.15 1.32 19.41 2.34 0.72 15.31 3.01 1.62 2.74 899 •<br />
02:41 AM 2206 26.49 12.27 9.38 19.71 3.57 1.60 20.68 3.19 1.31 19.45 2.38 0.71 15.35 3.05 1.62<br />
03:01 AM 2226 26.52 12.30 9.39 19.73 3.59 1.60 20.70 3.21 1.31 19.47 2.40 0.71 15.37 3.07 1.63<br />
03:51 AM 2276 26.56 12.34 9.38 19.78 3.64 1.60 20.76 3.27 1.32 19.52 2.45 0.72 15.42 3.12 1.64 2.74 899 *<br />
04:01 AM 2286 26.56 12.34 9.37 19.79 3.65 1.60 20.77 3.28 1.32 19.53 2.46 0.72 15.42 3.12 1.63<br />
04:21 AM 2306 26.60 12.38 9.39 19.81 3.67 1.60 20.79 3.30 1.32 19.55 2.48 0.72 15.44 3.14 1.64<br />
05:01 AM 2346 26.66 12.44 9.40 19.85 3.71 1.60 20.83 3.34 1.32 19.59 2.52 0.73 15.48 3.18 1.65<br />
05:51 AM 2396 26.71 12.49 9.40 19.90 3.76 1.59 20.88 3.39 1.32 19.65 2.58 0.74 15.53 3.23 1.66 2.75 900 •<br />
06:01 AM 2406 26.71 12.49 9.39 19.90 3.76 1.58 20.90 3.41 1.33 19.66 2.59 0.74 15.54 3.24 1.66<br />
07:01 AM 2466 26.78 12.56 9.40 19.96 3.82 1.57 20.96 3.47 1.32 19.72 2.65 0.75 15.60 3.30 1.67<br />
07:41 AM 2506 26.83 12.61 9.41 20.00 3.86 1.58 21.00 3.51 1.33 19.76 2.69 0.75 15.64 3.34 1.68<br />
07:51 AM 2516 26.83 12.61 9.40 20.01 3.87 1.58 21.01 3.52 1.33 19.77 2.70 0.76 15.64 3.34 1.68 2.74 899 •<br />
08:01 AM 2526 26.85 12.63 9.42 20.02 3.88 1.58 21.02 3.53 1.33 19.78 2.71 0.76 15.65 3.35 1.68<br />
09:01 AM 2586 26.90 12.68 9.40 20.07 3.93 1.57 21.08 3.59 1.33 19.84 2.77 0.77 15.71 3.41 1.69<br />
09:21 AM 2606 26.92 12.70 9.41 20.09 3.95 1.57 21.10 3.61 1.34 19.86 2.79 0.77 15.73 3.43 1.70<br />
10:01 AM 2646 26.97 12.75 9.42 20.12 3.98 1.57 21.13 3.64 1.33 19.90 2.83 0.78 15.79 3.49 1.74 2.70 895 •<br />
11:01 AM 2706 27.03 12.81 9.42 20.17 4.03 1.56 21.19 3.70 1.34 19.96 2.89 0.79 15.82 3.52 1.72<br />
12:01 PM 2766 27.10 12.88 9.44 20.22 4.08 1.56 21.25 3.76 1.35 20.02 2.95 0.81 15.87 3.57 1.74 2.69 893 •<br />
12:41 PM 2806 27.13 12.91 9.44 20.25 4.11 1.55 21.29 3.80 1.36 20.06 2.99 0.82 15.95 3.65 1.79<br />
01:01 PM 2826 27.15 12.93 9.44 20.26 4.12 1.54 21.30 3.81 1.35 20.08 3.01 0.83 15.82 3.52 1.65<br />
02:01 PM 2886 27.21 12.99 9.45 20.31 4.17 1.54 21.36 3.87 1.36 20.13 3.06 0.83 15.94 3.64 1.73 2.69 893 *<br />
02:21 PM 2906 27.24 13.02 9.46 20.33 4.19 1.55 21.38 3.89 1.37 20.15 3.08 0.84 16.11 3.81 1.89<br />
03:01 PM 2946 27.28 13.06 9.47 20.35 4.21 1.53 21.41 3.92 1.36 20.19 3.12 0.85 16.01 3.71 1.76<br />
04:01 PM 3006 27.34 13.12 9.48 20.40 4.26 1.54 21.47 3.98 1.38 20.24 3.17 0.86 16.05 3.75 1.77 2.69 893 •<br />
05:01 PM 3066 27.40 13.18 9.50 20.44 4.30 1.53 21.52 4.03 1.39 20.30 3.23 0.88 16.11 3.81 1.80<br />
05:41 PM 3106 27.45 13.23 9.51 20.48 4.34 1.55 21.56 4.07 1.40 20.33 3.26 0.89 16.15 3.85 1.82<br />
06:01 PM 3126 27.47 13.25 9.52 20.49 4.35 1.54 21.58 4.09 1.41 20.35 3.28 0.90 16.16 3.86 1.82 2.69 893 *<br />
07:01 PM 3186 27.52 13.30 9.53 20.54 4.40 1.55 21.63 4.14 1.42 20.40 3.33 0.91 16.21 3.91 1.84<br />
07:21 PM 3206 27.54 13.32 9.53 20.55 4.41 1.54 21.65 4.16 1.42 20.42 3.35 0.92 16.22 3.92 1.84<br />
08:01 PM 3246 27.57 13.35 9.53 20.58 4.44 1.54 21.68 4.19 1.42 20.45 3.38 0.92 16.26 3.96 1.85 2.66 887 *<br />
+Adjusted drawdowns result from correl<strong>at</strong>ion with river stage d<strong>at</strong>a (see text)<br />
*Piezometer/R<strong>at</strong>e reading within 5 minutes of indic<strong>at</strong>ed time
<strong>Ground</strong>-W<strong>at</strong>er Investig<strong>at</strong>ion <strong>at</strong> <strong>Mount</strong> <strong>Carmel</strong>, <strong>IL</strong><br />
Third Long-Term Test—Test Well 2 (Continued)<br />
August 24-September 2,1993<br />
Pumped' Test Weil 2 Observ<strong>at</strong>ion Well 1 Observ<strong>at</strong>ion Well 2 Observ<strong>at</strong>ion Well 3 Observ<strong>at</strong>ion Well 4<br />
D<strong>at</strong>e/ Elapsed Depth to Drawdown Depth to Drawdown Depth to Drawdown Depth to Drawdown Depth to Drawdown Piez<br />
Hour time W<strong>at</strong>er Obs Adj+ W<strong>at</strong>er Obs Adj+ W<strong>at</strong>er Obs Adj+ W<strong>at</strong>er Obs Adj+ W<strong>at</strong>er Obs Adj+ Head R<strong>at</strong>e Remarks<br />
(min) (ft) (ft) (ft) (ft) (ft) (ft) (ft) (ft) (ft) (ft) (ft) (ft) (ft) (ft) (ft) (ft) (gpm)<br />
09:01 PM 3306 27.61 13.39 9.54 20.62 4.48 1.55 21.73 4.24 1.45 20.50 3.43 0.95 16.31 4.01 1.88<br />
10:01 PM 3366 27.66 13.44 9.55 20.66 4.52 1.55 21.77 4.28 1.45 20.54 3.47 0.95 16.35 4.05 1.89 2.66 887 *<br />
10:41 PM 3406 27.69 13.47 9.55 20.68 4.54 1.55 21.80 4.31 1.45 20.57 3.50 0.96 16.38 4.08 1.90<br />
11:01 PM 3426 27.71 13.49 9.56 20.70 4.56 1.55 21.81 4.32 1.45 20.59 3.52 0.97 16.40 4.10 1.92<br />
11:51 PM 3476 27.75 13.53 9.57 20.73 4.59 1.56 21.85 4.36 1.47 20.62 3.55 0.98 16.43 4.13 1.93 2.74 899 *; Adjustedr<strong>at</strong>e<br />
08/27/93 — — — — — —<br />
12:01 AM 3486 27.80 13.58 9.61 20.74 4.60 1.56 21.86 4.37 1.47 20.63 3.56 0.98 16.44 4.14 1.93<br />
12:21 AM 3506 27.82 13.60 9.62 20.75 4.61 1.57 21.87 4.38 1.48 20.64 3.57 0.99 16.45 4.15 1.94<br />
01:01 AM 3546 27.84 13.62 9.62 20.77 4.63 1.57 21.90 4.41 1.49 20.67 3.60 1.00 16.48 4.18 1.96<br />
01:51 AM 3596 27.88 13.66 9.64 20.80 4.66 1.58 21.93 4.44 1.50 20.70 3.63 1.01 16.51 4.21 1.97 2.75 900 *<br />
02:01 AM 3606 27.89 13.67 9.64 20.80 4.66 1.57 21.94 4.45 1.50 20.71 3.64 1.02 16.52 4.22 1.98<br />
03:01 AM 3666 27.92 13.70 9.65 20.84 4.70 1.59 21.98 4.49 1.52 20.75 3.68 1.04 16.56 4.26 2.00<br />
03:41 AM 3706 27.96 13.74 9.67 20.86 4.72 1.60 22.01 4.52 1.54 20.77 3.70 1.05 16.59 4.29 2.02<br />
04:01 AM 3726 27.96 13.74 9.66 20.87 4.73 1.60 22.02 4.53 1.54 20.78 3.71 1.05 16.60 4.30 2.02 2.74 899 •<br />
05:01 AM 3786 28.00 13.78 9.67 20.90 4.76 1.60 22.06 4.57 1.55 20.82 3.75 1.07 16.64 4.34 2.04<br />
05:21 AM 3806 28.02 13.80 9.68 20.91 4.77 1.60 22.07 4.58 1.56 20.83 3.76 1.07 16.65 4.35 2.05<br />
06:01 AM 3846 28.04 13.82 9.69 20.94 4.80 1.62 22.09 4.60 1.56 20.86 3.79 1.09 16.68 4.38 2.07<br />
06:11AM 3856 28.05 13.83 9.69 20.94 4.80 1.61 22.10 4.61 1.57 20.86 3.79 1.09 16.68 4.38 2.06 2.75 900 •<br />
07:01 AM 3906 28.07 13.85 9.70 20.97 4.83 1.63 22.13 4.64 1.58 20.89 3.82 1.10 16.71 4.41 2.08<br />
07:51 AM 3956 28.11 13.89 9.71 21.00 4.86 1.64 22.16 4.67 1.60 20.92 3.85 1.11 16.75 4.45 2.11 2.74 899 •<br />
O&Ol AM 3966 28.11 13.89 9.71 21.00 4.86 1.63 22.16 4.67 1.59 20.93 3.86 1.12 16.76 4.46 2.12<br />
08:41 AM 4006 28.13 13.91 9.72 21.02 4.88 1.64 22.18 4.69 1.60 20.95 3.88 1.13 16.78 4.48 2.12<br />
09:01 AM 4026 28.14 13.92 9.72 21.03 4.89 1.64 22.19 4.70 1.60 20.96 3.89 1.13 16.79 4.49 2.13<br />
10:01 AM 4086 28.17 13.95 9.73 21.05 4.91 1.64 22.22 4.73 1.61 20.99 3.92 1.14 16.84 4.54 2.16 2.72 897 •<br />
10:21 AM 4106 28.19 13.97 9.74 21.06 4.92 1.64 22.23 4.74 1.61 21.01 3.94 1.16 16.87 4.57 2.19<br />
11:01 AM 4146 28.21 13.99 9.74 21.08 4.94 1.65 22.25 4.76 1.62 21.03 3.96 1.17 16.70 4.40 2.01<br />
12:01 PM 4206 28.24 14.02 9.75 21.10 4.96 1.65 22.28 4.79 1.64 21.06 3.99 1.18 16.89 4.59 2.19 2.69 893 •<br />
01:01 PM 4266 28.27 14.05 9.76 21.13 4.99 1.66 22.31 4.82 1.64 21.09 4.02 1.19 16.92 4.62 2.20<br />
01:41 PM 4306 28.30 14.08 9.77 21.14 5.00 1.66 22.33 4.84 1.65 21.11 4.04 1.20 16.94 4.64 2.21<br />
02:01 PM 4326 28.30 14.08 9.77 21.15 5.01 1.66 22.34 4.85 1.65 21.12 4.05 1.21 16.98 4.68 2.24<br />
03:01 PM 4386 28.33 14.11 9.78 21.17 5.03 1.67 22.37 4.88 1.67 21.15 4.08 1.22 16.94 4.64 2.19<br />
03:21 PM 4406 28.35 14.13 9.79 21.18 5.04 1.67 22.38 4.89 1.67 21.16 4.09 1.23 16.97 4.67 2.22<br />
04:01 PM 4446 28.38 14.16 9.80 21.20 5.06 1.67 22.40 4.91 1.68 21.18 4.11 1.23 17.00 4.70 2.24<br />
05:01 PM 4506 28.39 14.17 9.80 21.22 5.08 1.68 22.43 4.94 1.70 21.21 4.14 1.25 17.03 4.73 2.26<br />
06:01 PM 4566 28.45 14.23 9.83 21.24 5.10 1.68 22.46 4.97 1.70 21.24 4.17 126 17.06 4.76 2.27 2.74 899 •; Adjusted r<strong>at</strong>e<br />
06:41 PM 4606 28.51 14.29 9.87 21.27 5.13 1.70 22.48 4.99 1.72 21.26 4.19 1.27 17.09 4.79 2.29<br />
07:01 PM 4626 28.51 14.29 9.87 21.27 5.13 1.69 22.49 5.00 1.72 21.27 4.20 1.28 17.09 4.79 2.29<br />
08:01 PM 4686 28.54 14.32 9.88 21.29 5.15 1.70 22.52 5.03 1.74 21.29 4.22 1.29 17.12 4.82 2.31<br />
08:11 PM 4696 28.54 14.32 9.88 21.30 5.16 1.71 22.52 5.03 1.74 21.30 4.23 1.30 17.13 4.83 2.32 2.74 899 •<br />
08:21 PM 4706 28.55 14.33 9.88 21.30 5.16 1.70 22.53 5.04 1.74 21.30 4.23 1.29 17.13 4.83 2.31<br />
09:01 PM 4746 28.57 14.35 9.89 21.32 5.18 1.71 22.54 5.05 1.74 21.32 4.25 1.31 17.15 4.85 2.33<br />
10:01 PM 4806 28.60 14.38 9.91 21.34 5.20 1.72 22.57 5.08 1.76 21.34 4.27 1.31 17.18 4.88 2.35 2.74 899 •<br />
11:01 PM 4866 28.61 14.39 9.90 21.37 5.23 1.73 22.59 5.10 1.77 21.37 4.30 1.33 17.21 4.91 2.37<br />
11:41 PM 4906 28.63 14.41 9.91 21.38 5.24 1.73 22.61 5.12 1.78 21.38 4.31<br />
08/28/93 —<br />
— — —<br />
1.33<br />
—<br />
17.22 4.92 2.37<br />
—<br />
12:01 AM 4926 28.65 14.43 9.92 21.39 5.25 1.74 22.62 5.13 1.78 21.39 4.32 1.34 17.23 4.93 2.38 2.74 899 •<br />
01:01 AM 4986 28.66 14.44 9.92 21.41 5.27 1.74 22.64 5.15 1.79 21.41 4.34 1.35 17.26 4.96 2.40<br />
01:21 AM 5006 28.67 14.45 9.92 21.42 5.28 1.75 22.65 5.16 1.79 21.42 4.35 1.35 17.27 4.97 2.40<br />
+Adjusted drawdowns result from correl<strong>at</strong>ion with river stage d<strong>at</strong>a (see text)<br />
*Piezometer/R<strong>at</strong>e reading within 5 minutes of indic<strong>at</strong>ed time
<strong>Ground</strong>-W<strong>at</strong>er Investig<strong>at</strong>ion <strong>at</strong> <strong>Mount</strong> <strong>Carmel</strong>, <strong>IL</strong><br />
Third Long-Term Test—Test Well 2 (Continued)<br />
August 24-September 2,1993<br />
Pumped Test Well 2 Observ<strong>at</strong>ion Well 1 Observ<strong>at</strong>ion Well 2 Observ<strong>at</strong>ion Well 3 Observ<strong>at</strong>ion Well 4<br />
D<strong>at</strong>e/ Elapsed Depth to Drawdown i Depth to Drawdown Depth to Drawdown Depth to Drawdown Depth to Drawdown Piez<br />
Hour time W<strong>at</strong>er Obs Adj+ W<strong>at</strong>er Obs Adj+ W<strong>at</strong>er Obs Adj+ W<strong>at</strong>er Obs Adj+ W<strong>at</strong>er Obs Adj+ Head R<strong>at</strong>e Remarks<br />
(min) (ft) (ft) (ft) (ft) (ft) (ft) (ft) (ft) (ft) (ft) (ft) (ft) (ft) (ft) (ft) (ft) (gpm)<br />
01:51 AM 5036 28.68 14.46 9.93 21.43 5.29 1.75 22.66 5.17 1.79 21.43 4.36 1.35 17.28 4.98 2.41 2.75 900 *<br />
02:01 AM 5046 28.69 14.47 9.93 21.43 5.29 1.75 22.67 5.18 1.80 21.43 4.36 1.35 17.28 4.98 2.41<br />
03:01 AM 5106 28.72 14.50 9.95 21.45 5.31 1.76 22.69 5.20 1.81 21.46 4.39 1.37 17.31 5.01 2.43<br />
04:01 AM 5166 28.75 14.53 9.96 21.47 5.33 1.76 22.71 5.22 1.82 21.48 4.41 1.38 17.33 5.03 2.43 2.75 900 *<br />
04:41 AM 5206 28.75 14.53 9.96 21.48 5.34 1.77 22.73 5.24 1.84 21.49 4.42 1.39 17.35 5.05 2.45<br />
05:01 AM 5226 28.75 14.53 9.96 21.49 5.35 1.78 22.74 5.25 1.85 21.50 4.43 1.40 17.36 5.06 2.46<br />
06:01 AM 5286 28.75 14.53 9.94 21.50 5.36 1.77 22.75 5.26 1.83 21.52 4.45 1.40 17.38 5.08 2.47 2.71 896 *<br />
06:21 AM 5306 28.71 14.49 9.91 21.51 5.37 1.78 22.76 5.27 1.84 21.53 4.46 1.41 17.38 5.08 2.47<br />
07:01 AM 5346 28.72 14.50 9.91 21.53 5.39 1.79 22.77 5.28 1.85 21.54 4.47 1.41 17.41 5.11 2.49<br />
07:51 AM 5396 28.73 14.51 9.91 21.54 5.40 1.78 22.79 5.30 1.85 21.56 4.49 1.42 17.43 5.13 2.50 2.70 895 *<br />
08:01 AM 5406 28.73 14.51 9.90 21.54 5.40 1.78 22.79 5.30 1.85 21.56 4.49 1.42 17.43 5.13 2.50<br />
09:01 AM 5466 28.75 14.53 9.91 21.56 5.42 1.79 22.81 5.32 1.86 21.59 4.52 1.44 17.46 5.16 2.52<br />
09:41 AM 5506 28.76 14.54 9.92 21.57 5.43 1.79 22.83 5.34 1.87 21.60 4.53 1.44 17.51 5.21 2.56<br />
10:01 AM 5526 28.77 14.55 9.92 21.58 5.44 1.80 22.83 5.34 1.87 21.61 4.54 1.45 17.50 5.20 2.55 2.69 893 *<br />
11:01 AM 5586 28.79 14.57 9.92 21.59 5.45 1.79 22.85 5.36 1.87 21.63 4.56 1.45 17.50 5.20 2.54<br />
11:21 AM 5606 28.78 14.56 9.91 21.60 5.46 1.80 22.86 5.37 1.88 21.63 4.56 1.45 17.51 5.21 2.55<br />
12:01 PM 5646 28.81 14.59 9.93 21.61 5.47 1.81 22.87 5.38 1.89 21.65 4.58 1.47 17.50 5.20 2.54 2.69 893 *<br />
01:01 PM 5706 28.83 14.61 9.93 21.63 5.49 1.80 22.89 5.40 1.88 21.67 4.60 1.47 17.71 5.41 2.73<br />
02:01 PM 5766 28.86 14.64 9.95 21.64 5.50 1.81 22.91 5.42 1.90 21.69 4.62 1.48 17.58 5.28 2.59<br />
02:41 PM 5806 28.87 14.65 9.95 21.65 5.51 1.81 22.93 5.44 1.91 21.70 4.63 1.48 17.57 5.27 2.58<br />
03:01 PM 5826 28.88 14.66 9.96 21.66 5.52 1.81 22.93 5.44 1.90 21.71 4.64 1.49 17.57 5.27 2.57<br />
04:01 PM 5886 28.90 14.68 9.96 21.67 5.53 1.81 22.95 5.46 1.91 21.73 4.66 1.50 17.53 5.23 2.52<br />
04:11 PM 5896 28.90 14.68 9.96 21.68 5.54 1.82 22.96 5.47 1.92 21.74 4.67 1.51 17.58 5.28 2.57 2.74 899 *; Adjusted r<strong>at</strong>e<br />
04:21 PM 5906 28.91 14.69 9.% 21.68 5.54 1.81 22.96 5.47 1.91 21.74 4.67 1.50 17.58 5.28 2.57<br />
05:01 PM 5946 28.93 14.71 9.97 21.69 5.55 1.81 22.97 5.48 1.92 21.75 4.68 1.51 17.62 5.32 2.60<br />
06:01 PM 6006 28.95 14.73 9.98 21.71 5.57 1.83 22.99 5.50 1.93 21.78 4.71 1.53 17.64 5.34 2.62<br />
06:11 PM 6016 29.05 14.83 10.06 21.72 5.58 1.83 23.00 5.51 1.94 21.78 4.71 1.53 17.65 5.35 2.62 2.74 899<br />
07:01 PM 6066 29.04 14.82 10.04 21.74 5.60 1.84 23.02 5.53 1.94 21.80 4.73 1.54 17.65 5.35 2.62<br />
07:41 PM 6106 29.05 14.83 10.05 21.75 5.61 1.84 23.03 5.54 1.95 21.81 4.74 1.54 17.68 5.38 2.64<br />
08:01 PM 6126 29.07 14.85 10.06 21.76 5.62 1.85 23.04 5.55 1.95 21.81 4.74 1.53 17.69 5.39 2.65 2.74 899 *<br />
09:01 PM 6186 29.09 14.87 10.07 21.78 5.64 1.86 23.06 5.57 1.96 21.83 4.76 1.55 17.71 5.41 2.66<br />
09.21 PM 6206 29.09 14.87 10.06 21.79 5.65 1.86 23.07 5.58 1.97 21.84 4.77 1.55 17.72 5.42 2.67<br />
10:01 PM 6246 29.10 14.88 10.06 21.80 5.66 1.86 23.08 5.59 1.97 21.85 4.78 1.56 17.73 5.43 2.67<br />
10:11 PM 6256 29.13 14.91 10.09 21.80 5.66 1.86 23.09 5.60 1.98 21.85 4.78 1.55 17.74 5.44 2.68 2.74 899 *<br />
11:01 PM 6306 29.13 14.91 10.08 21.82 5.68 1.88 23.10 5.61 1.98 21.87 4.80 1.57 17.76 5.46 2.69<br />
08/29/93 - — — - — —<br />
12:01 AM 6366 29.15 14.93 10.08 21.84 5.70 1.88 23.12 5.63 1.98 21.89 4.82 1.57 17.77 5.47 2.69 2.74 899 *<br />
12:41 AM 6406 29.17 14.95 10.09 21.85 5.71 1.88 23.13 5.64 1.99 21.90 4.83 1.57 17.79 5.49 2.70<br />
01:01 AM 6426 29.18 14.96 10.10 21.85 5.71 1.88 23.14 5.65 1.99 21.91 4.84 1.58 17.79 5.49 2.70<br />
02:01 AM 6486 29.18 14.96 10.09 21.86 5.72 1.88 23.16 5.67 2.01 21.92 4.85 1.59 17.81 5.51 2.72 2.74 899 *<br />
02:21 AM 6506 29.19 14.97 10.10 21.87 5.73 1.89 23.16 5.67 2.00 21.93 4.86 1.59 17.82 5.52 2.72<br />
03:01 AM 6546 29.20 14.98 10.10 21.88 5.74 1.89 23.17 5.68 2.00 21.94 4.87 1.60 17.83 5.53 2.73<br />
04:01 AM 6606 29.21 14.99 10.10 21.89 5.75 1.89 23.19 5.70 2.02 21.96 4.89 1.61 17.85 5.55 2.74<br />
04:11 AM 6616 29.22 15.00 10.11 21.89 5.75 1.89 23.20 5.71 2.03 21.96 4.89 1.61 17.86 5.56 2.75 2.74 899 *<br />
05:01 AM 6666 29.22 15.00 10.10 21.91 5.77 1.89 23.21 5.72 2.02 21.97 4.90 1.61 17.87 5.57 2.75<br />
05:41 AM 6706 29.25 15.03 10.12 21.92 5.78 1.89 23.22 5.73 2.02 21.99 4.92 1.62 17.88 5.58 2.75<br />
06:01 AM 6726 29.25 15.03 10.11 21.93 5.79 1.90 23.23 5.74 2.03 21.99 4.92 1.61 17.89 5.59 2.76 2.74 899 *; Adjusted r<strong>at</strong>e<br />
07:01 AM 6786 29.29 15.07 10.14 21.95 5.81 1.91 23.25 5.76 2.04 22.01 4.94 1.63 17.92 5.62 2.78<br />
+Adjusted drawdowns result from correl<strong>at</strong>ion with river stage d<strong>at</strong>a (see text)<br />
*Piezometer/R<strong>at</strong>e reading within 5 minutes of indic<strong>at</strong>ed time
<strong>Ground</strong>-W<strong>at</strong>er Investig<strong>at</strong>ion <strong>at</strong> <strong>Mount</strong> <strong>Carmel</strong>, <strong>IL</strong><br />
Third Long-Term Test—Test Well 2 (Continued)<br />
August 24-September 2,1993<br />
Pumped Test Well 2 Observ<strong>at</strong>ion Well 1 Observ<strong>at</strong>ion Well 2 Observ<strong>at</strong>ion Well 3 Observ<strong>at</strong>ion Well 4<br />
D<strong>at</strong>e/ Elapsed Depth to Drawdown Depth to Drawdown Depth to Drawdown Depth to Drawdown Depth to Drawdown Piez<br />
Hour time W<strong>at</strong>er Obs Adj+ W<strong>at</strong>er Obs Adj+ W<strong>at</strong>er Obs Adj+ W<strong>at</strong>er Obs Adj+ W<strong>at</strong>er Obs Adj+ Head R<strong>at</strong>e Remarks<br />
(min) (ft) (ft) (ft) (ft) (ft) (ft) (ft) (ft) (ft) (ft) (ft) (ft) (ft) (ft) (ft) (ft) (gpn)<br />
07:21 AM 6806 29.29 15.07 10.13 21.95 5.81 1.91 23.25 5.76 2.04 22.02 4.95 1.63 17.92 5.62 2.78<br />
08:01 AM 6846 29.31 15.09 10.14 21.96 5.82 1.91 23.27 5.78 2.05 22.02 4.95 1.63 17.94 5.64 2.79 2.74 899 *<br />
09:01 AM 6906 29.33 15.11 10.15 21.98 5.84 1.92 23.28 5.79 2.05 22.02 4.95 1.62 17.97 5.67 2.82<br />
10:01 AM 6966 29.34 15.12 10.15 22.00 5.86 1.93 23.30 5.81 2.06 22.02 4.95 1.61 17.99 5.69 2.83 2.74 899 *<br />
10:41 AM 7006 29.36 15.14 10.16 22.01 5.87 1.93 23.31 5.82 2.06 22.03 4.96 1.61 18.00 5.70 2.83<br />
11:01 AM 7026 29.37 15.15 10.16 22.01 5.87 1.92 23.31 5.82 2.05 22.02 4.95 1.59 18.02 5.72 2.85<br />
12:01 PM 7086 29.38 15.16 10.17 22.03 5.89 1.94 23.33 5.84 2.07 21.97 4.90 1.54 18.01 5.71 2.84 2.74 899 *; Adjusted r<strong>at</strong>e<br />
12:11 PM 7096 29.44 15.22 10.22 22.03 5.89 1.94 23.33 5.84 2.07 21.97 4.90 1.54 18.03 5.73 2.86 from 2.68 ft<br />
12:21 PM 7106 29.44 15.22 10.21 22.04 5.90 1.94 23.34 5.85 2.08 21.97 4.90 1.54 18.00 5.70 2.82<br />
01:01 PM 7146 29.46 15.24 10.22 22.05 5.91 1.94 23.35 5.86 2.07 21.97 4.90 1.53 17.99 5.69 2.80<br />
02:01 PM 7206 29.48 15.26 10.23 22.07 5.93 1.95 23.37 5.88 2.09 21.96 4.89 1.51 18.03 5.73 2.84 2.74 899 *<br />
03:01 PM 7266 29.51 15.29 10.24 22.08 5.94 1.95 23.39 5.90 2.09 21.96 4.89 1.50 18.06 5.76 2.86<br />
03:41 PM 7306 29.52 15.30 10.24 22.09 5.95 1.95 23.40 5.91 2.09 21.96 4.89 1.49 18.07 5.77 2.86<br />
04:01 PM 7326 29.53 15.31 10.24 22.09 5.95 1.94 23.41 5.92 2.10 21.96 4.89 1.49 18.08 5.78 2.86 2.74 899 *<br />
05:01 PM 7386 29.56 15.34 10.26 22.11 5.97 1.96 23.43 5.94 2.11 21.96 4.89 1.48 18.11 5.81 2.89<br />
05:21 PM 7406 29.56 15.34 10.26 22.11 5.97 1.95 23.43 5.94 2.11 21.96 4.89 1.47 18.11 5.81 2.89<br />
06:01 PM 7446 29.59 15.37 10.28 22.13 5.99 1.96 23.45 5.96 2.12 21.96 4.89 1.47 18.13 5.83 2.90<br />
06:11 PM 7456 29.59 15.37 10.27 22.13 5.99 1.96 23.45 5.96 2.12 21.96 4.89 1.47 18.12 5.82 2.89 2.74 899 *<br />
07:01 PM 7506 29.59 15.37 10.27 22.14 6.00 1.96 23.46 5.97 2.12 21.% 4.89 1.46 18.14 5.84 2.90<br />
08:01 PM 7566 29.60 15.38 10.28 22.15 6.01 1.97 23.48 5.99 2.14 21.96 4.89 1.46 18.16 5.86 2.92 2.74 899 *<br />
08:41 PM 7606 29.60 15.38 10.27 22.16 6.02 1.97 23.48 5.99 2.13 21.97 4.90 1.46 18.16 5.86 2.92<br />
09:01 PM 7626 29.61 15.39 10.27 22.17 6.03 1.98 23.49 6.00 2.14 21.97 4.90 1.46 18.18 5.88 2.93<br />
10:01 PM 7686 29.62 15.40 10.28 22.18 6.04 1.98 23.50 6.01 2.14 21.97 4.90 1.45 18.19 5.89 2.94 2.74 899 *<br />
10.21 PM 7706 29.63 15.41 10.28 22.19 6.05 1.99 23.51 6.02 2.15 21.97 4.90 1.45 18.20 5.90 2.95<br />
11:01 PM 7746 29.63 15.41 10.28 22.19 6.05 1.98 23.52 6.03 2.15 21.97 4.90 1.45 18.21 5.91 2.95<br />
08/30/93 — — — — — —<br />
12:01 AM 7806 29.65 15.43 10.29 22.21 6.07 2.00 23.53 6.04 2.16 21.98 4.91 1.45 18.23 5.93 2.97 2.74 899 *<br />
01:01 AM 7866 29.66 15.44 10.29 22.22 6.08 2.00 23.55 6.06 2.17 21.98 4.91 1.44 18.24 5.94 2.97<br />
01:41 AM 7906 29.66 15.44 10.29 22.23 6.09 2.00 23.55 6.06 2.16 21.98 4.91 1.44 18.25 5.95 2.98<br />
02:01 AM 7926 29.67 15.45 10.29 22.23 6.09 2.00 23.56 6.07 2.17 21.98 4.91 1.44 18.25 5.95 2.98 2.74 899 *<br />
03:01 AM 7986 29.68 15.46 10.30 22.25 6.11 2.01 23.57 6.08 2.18 21.98 4.91 1.43 18.27 5.97 2.99<br />
03:21 AM 8006 29.68 15.46 10.30 22.25 6.11 2.01 23.58 6.09 2.19 21.98 4.91 1.43 18.28 5.98 3.00<br />
04:01 AM 8046 29.69 15.47 10.30 22.26 6.12 2.02 23.59 6.10 2.20 21.98 4.91 1.43 18.28 5.98 3.00 2.74 899 *<br />
05:01 AM 8106 29.71 15.49 10.31 22.27 6.13 2.02 23.60 6.11 2.19 21.99 4.92 1.43 18.30 6.00 3.01<br />
06:01 AM 8166 29.73 15.51 10.32 22.28 6.14 2.03 23.61 6.12 2.20 21.99 4.92 1.43 18.31 6.01 3.02 2.72 897 *<br />
06:41 AM 8206 29.74 15.52 10.33 22.29 6.15 2.03 23.62 6.13 2.20 21.99 4.92 1.42 18.32 6.02 3.02<br />
07:01 AM 8226 29.73 15.51 10.31 22.30 6.16 2.04 23.63 6.14 2.21 21.99 4.92 1.42 18.33 6.03 3.03<br />
0801 AM 8286 29.74 15.52 10.32 22.31 6.17 2.05 23.64 6.15 2.22 21.99 4.92 1.42 18.35 6.05 3.05 2.76 902 *; Adjusted r<strong>at</strong>e<br />
08:21 AM 8306 29.86 15.64 10.42 22.31 6.17 2.05 23.64 6.15 2.22 21.99 4.92 1.42 18.36 6.06 3.06<br />
09:01 AM 8346 29.75 15.53 10.33 22.31 6.17 2.05 23.65 6.16 2.23 21.99 4.92 1.42 18.36 6.06 3.06<br />
10:01 AM 8406 29.76 15.54 10.34 22.32 6.18 2.06 23.65 6.16 2.23 21.99 4.92 1.42 18.40 6.10 3.10 2.74 899 *<br />
11:01 AM 8466 29.77 15.55 10.35 22.33 6.19 2.07 23.66 6.17 2.24 21.99 4.92 1.42 18.40 6.10 3.10<br />
11:41 AM 8506 29.77 15.55 10.34 22.33 6.19 2.06 23.67 6.18 2.24 21.99 4.92 1.41 18.43 6.13 3.13<br />
12:01 PM 8526 29.77 15.55 10.34 22.34 6.20 2.07 23.67 6.18 2.24 21.99 4.92 1.41 18.42 6.12 3.11 2.74 899 *; Adjusted r<strong>at</strong>e<br />
01:01 PM 8586 29.81 15.59 10.37 22.35 6.21 2.08 23.68 6.19 2.25 21.99 4.92 1.41 18.40 6.10 3.09<br />
01:21 PM 8606 29.81 15.59 10.37 22.35 6.21 2.07 23.68 6.19 2.25 21.99 4.92 1.41 18.41 6.11 3.10<br />
02:01 PM 8646 29.82 15.60 10.37 22.35 6.21 2.06 23.69 6.20 2.25 21.99 4.92 1.40 18.44 6.14 3.12<br />
03:01 PM 8706 29.84 15.62 10.38 22.36 6.22 2.07 23.69 6.20 2.25 21.99 4.92 1.40 18.39 6.09 3.07<br />
2.74 899 *; Adjusted r<strong>at</strong>e<br />
+Adjusted drawdowns result from correl<strong>at</strong>ion with river stage d<strong>at</strong>a (see text) *Piezometer/R<strong>at</strong>e reading within 5 minutes of indic<strong>at</strong>ed time
<strong>Ground</strong>-W<strong>at</strong>er Investig<strong>at</strong>ion <strong>at</strong> <strong>Mount</strong> <strong>Carmel</strong>, <strong>IL</strong><br />
Third Long-Term Test—Test Well 2 (Continued)<br />
August 24-September 2, 1993<br />
Pumped Test Well 2 Observ<strong>at</strong>ion Well 1 Observ<strong>at</strong>ion Well 2 Observ<strong>at</strong>ion Well 3 Observ<strong>at</strong>ion Well 4<br />
D<strong>at</strong>e/ Elapsed Depth to Drawdown Depth to Drawdown Depth to Drawdown Depth to Drawdown Depth to Drawdown Piez<br />
Hour time W<strong>at</strong>er Obs Adj+ W<strong>at</strong>er Obs Adj+ W<strong>at</strong>er Obs Adj+ W<strong>at</strong>er Obs Adj+ W<strong>at</strong>er Obs Adj+ Head R<strong>at</strong>e Remarks<br />
(min) (ft) (ft) (ft) (ft) (ft) (ft) (ft) (ft) (ft) (ft) (ft) (ft) (ft) (ft) (ft) (ft) (gpm)<br />
04:01 PM 8766 29.86 15.64 10.39 22.36 6.22 2.07 23.71 6.22 2.26 22.00 4.93 1.40 18.44 6.14 3.12 2.74 899 *<br />
04:41 PM 8806 29.87 15.65 10.40 22.37 6.23 2.08 23.72 6.23 2.27 21.99 4.92 1.39 18.44 6.14 3.12<br />
05:01 PM 8826 29.88 15.66 10.41 22.37 6.23 2.08 23.72 6.23 2.27 21.99 4.92 1.39 18.45 6.15 3.13<br />
06:01 PM 8886 29.90 15.68 10.41 22.38 6.24 2.07 23.73 6.24 2.27 22.00 4.93 1.39 18.46 6.16 3.13 2.74 899 *<br />
06:21 PM 8906 29.90 15.68 10.41 22.38 6.24 2.07 23.74 6.25 2.28 21.99 4.92 1.38 18.46 6.16 3.13<br />
07:01 PM 8946 29.89 15.67 10.41 22.39 6.25 2.08 23.74 6.25 2.28 22.00 4.93 1.39 18.47 6.17 3.14<br />
08:01 PM 9006 29.90 15.68 10.41 22.40 6.26 2.08 23.76 6.27 2.29 21.99 4.92 1.37 18.48 6.18 3.14 2.74 899 *<br />
09:01 PM 9066 29.91 15.69 10.41 22.42 6.28 2.10 23.77 6.28 2.29 21.99 4.92 1.37 18.50 6.20 3.16<br />
09:41 PM 9106 29.92 15.70 10.42 22.43 6.29 2.11 23.78 6.29 2.30 21.99 4.92 1.37 18.51 6.21 3.17<br />
10:01 PM 9126 29.92 15.70 10.42 22.43 6.29 2.11 23.78 6.29 2.30 21.99 4.92 1.37 18.51 6.21 3.17 2.74 899 *<br />
11:01 PM 9186 29.93 15.71 10.42 22.44 6.30 2.10 23.79 6.30 2.30 21.99 4.92 1.35 18.52 6.22 3.17<br />
11:21 PM 9206 29.92 15.70 10.41 22.45 6.31 2.11 23.79 6.30 2.30 21.99 4.92 1.35 18.53 6.23 3.18<br />
08/31/93 - — — — — —<br />
12:01 AM 9246 29.95 15.73 10.43 22.45 6.31 2.11 23.80 6.31 2.30 21.99 4.92 1.35 18.54 6.24 3.18 2.74 899 *<br />
01:01 AM 9306 29.95 15.73 10.43 22.46 6.32 2.12 23.81 6.32 2.31 21.99 4.92 1.35 18.55 6.25 3.19<br />
02:01 AM 9366 29.96 15.74 10.43 22.47 6.33 2.12 23.82 6.33 2.31 21.99 4.92 1.34 18.56 6.26 3.20 2.74 899 *<br />
02:41 AM 9406 29.97 15.75 10.44 22.48 6.34 2.13 23.83 6.34 2.32 21.99 4.92 1.34 18.57 6.27 3.21<br />
03:01 AM 9426 29.97 15.75 10.44 22.48 6.34 2.13 23.83 6.34 2.32 21.99 4.92 1.34 18.58 6.28 3.22<br />
04:01 AM 9486 29.98 15.76 10.43 22.49 6.35 2.12 23.84 6.35 2.32 21.99 4.92 1.33 18.58 6.28 3.21 2.74 899 *<br />
04:21 AM 9506 29.98 15.76 10.43 22.50 6.36 2.13 23.85 6.36 2.33 21.99 4.92 1.33 18.59 6.29 3.22<br />
05:01 AM 9546 29.99 15.77 10.44 22.50 6.36 2.13 23.86 6.37 2.34 21.99 4.92 1.33 18.59 6.29 3.22<br />
06:01 AM 9606 29.99 15.77 10.44 22.51 6.37 2.14 23.87 6.38 2.34 21.99 4.92 1.32 18.61 6.31 3.23 2.74 899 *<br />
07:01 AM 9666 30.01 15.79 10.45 22.53 6.39 2.15 23.88 6.39 2.35 21.99 4.92 1.32 18.63 6.33 3.24<br />
07:41 AM 9706 30.03 15.81 10.46 22.53 6.39 2.14 23.88 6.39 2.34 21.99 4.92 1.31 18.64 6.34 3.25<br />
08:01 AM 9726 30.03 15.81 10.46 22.54 6.40 2.15 23.89 6.40 2.35 21.99 4.92 1.31 18.64 6.34 3.25 2.74 899 *; Adjusted r<strong>at</strong>e<br />
09:01 AM 9786 30.03 15.81 10.46 22.54 6.40 2.15 23.89 6.40 2.35 21.99 4.92 1.31 18.65 6.35 3.26<br />
09:21 AM 9806 30.04 15.82 10.46 22.55 6.41 2.16 23.90 6.41 2.36 21.99 4.92 1.31 18.66 6.36 3.27<br />
10:01 AM 9846 30.03 15.81 10.46 22.55 6.41 2.16 23.90 6.41 2.36 21.99 4.92 1.31 18.73 6.43 3.34 2.74 899 *<br />
11:01 AM 9906 30.04 15.82 10.45 22.56 6.42 2.16 23.91 6.42 2.36 21.99 4.92 1.30 18.73 6.43 3.33<br />
12:01 PM 9966 30.05 15.83 10.45 22.56 6.42 2.15 23.92 6.43 2.36 21.99 4.92 1.29 18.72 6.42 3.31 2.74 899 *<br />
1241 PM 10006 30.05 15.83 10.45 22.57 6.43 2.16 23.93 6.44 2.37 22.00 4.93 1.30 18.88 6.58 3.47<br />
01:01 PM 10026 30.05 15.83 10.45 22.57 6.43 2.16 23.93 6.44 2.37 21.99 4.92 1.29 18.70 6.40 3.29<br />
02:01 PM 10086 30.09 15.87 10.48 22.58 6.44 2.15 23.94 6.45 2.36 22.00 4.93 1.29 18.72 6.42 3.30 2.74 899 *<br />
02:21 PM 10106 30.09 15.87 10.47 22.58 6.44 2.15 23.94 6.45 2.36 22.00 4.93 1.28 18.58 6.28 3.16<br />
03:01 PM 10146 30.11 15.89 10.48 22.59 6.45 2.15 23.95 6.46 2.36 22.00 4.93 1.28 18.79 6.49 3.36<br />
04:01 PM 10206 30.13 15.91 10.48 22.60 6.46 2.15 23.96 6.47 2.36 22.00 4.93 1.26 18.76 6.46 3.32 2.74 899 *<br />
05:01 PM 10266 30.14 15.92 10.49 22.61 6.47 2.15 23.98 6.49 2.37 22.00 4.93 1.26 18.71 6.41 3.27<br />
05:41 PM 10306 30.14 15.92 10.48 22.62 6.48 2.15 23.99 6.50 2.38 22.00 4.93 1.25 18.75 6.4.'i 3.30<br />
06:01 PM 10326 30.14 15.92 10.48 22.62 6.48 2.15 23.99 6.50 2.37 22.00 4.93 1.25 18.75 6.45 3.30 2.74 899 *<br />
07:01 PM 10386 30.13 15.91 10.47 22.63 6.49 2.16 24.00 6.51 2.38 22.00 4.93 1.25 18.75 6.45 3.30<br />
07:21 PM 10406 30.14 15.92 10.48 22.64 6.50 2.17 24.00 6.51 2.38 22.00 4.93 1.25 18.75 6.4.'i 3.30<br />
08:01 PM 10446 30.14 15.92 10.48 22.64 6.50 2.17 24.01 6.52 2.39 22.00 4.93 1.25 18.76 6.46 3.31 2.74 899 *<br />
09:01 PM 10506 30.15 15.93 10.48 22.66 6.52 2.18 24.02 6.53 2.39 21.99 4.92 1.23 18.78 6.48 3.32<br />
10:01 PM 10566 30.17 15.95 10.49 22.67 6.53 2.19 24.03 6.54 2.40 22.00 4.93 1.24 18.79 6.49 3.33 2.74 899 *<br />
10:41 PM 10606 30.16 15.94 10.48 22.68 6.54 2.19 24.04 6.55 2.40 21.99 4.92 1.22 18.80 6.50 3.33<br />
11:01 PM 10626 30.16 15.94 10.48 22.68 6.54 2.18 24.04 6.55 2.40 21.99 4.92 1.22 18.80 6.50 3.33<br />
09/01/93 - - - - - -<br />
12:01 AM 10686 30.18 15.96 10.49 22.69 6.55 2.19 24.05 6.56 2.41 21.99 4.92 1.22 18.81 6.51 3.34 2.74 899 *<br />
+Adjusted drawdowns result from correl<strong>at</strong>ion with river stage d<strong>at</strong>a (see text)<br />
*Piezomeler/R<strong>at</strong>e reading within 5 minutes of indic<strong>at</strong>ed time
<strong>Ground</strong>-W<strong>at</strong>er Investig<strong>at</strong>ion <strong>at</strong> <strong>Mount</strong> <strong>Carmel</strong>, <strong>IL</strong><br />
Third Long-Term Test—Test Well 2 (Continued)<br />
August 24-September 2,1993<br />
Pumped Test Well 2 Observ<strong>at</strong>ion Well 1 Observ<strong>at</strong>ion Well 2 Observ<strong>at</strong>ion Well 3 Observ<strong>at</strong>ion Well 4<br />
D<strong>at</strong>e/ Elapsed Depth to Drawdown Depth to Drawdown Depth to Drawdown Depth to Drawdown , Depth to Drawdown Piez<br />
Hour time W<strong>at</strong>er Obs Adj+ W<strong>at</strong>er Obs Adj+ W<strong>at</strong>er Obs Adj+ W<strong>at</strong>er Obs Adj+ W<strong>at</strong>er Obs Adj+ Head R<strong>at</strong>e Remarks<br />
(min) (ft) (ft) (ft) (ft) (ft) (ft) (ft) (ft) (ft) (ft) (ft) (ft) (ft) (ft) (ft) (ft) (gpm)<br />
12:21 AM 10706 30.19 15.97 10.50 22.69 6.55 2.19 24.05 6.56 2.41 21.99 4.92 1.22 18.82 6.52 3.35<br />
01:01 AM 10746 30.19 15.97 10.50 22.70 6.56 2.20 24.06 6.57 2.42 21.99 4.92 1.22 18.82 6.52 3.35<br />
01:51 AM 10796 30.19 15.97 10.49 22.70 6.56 2.20 24.07 6.58 2.42 21.99 4.92 1.21 18.83 6.53 3.35 2.74 899 *<br />
02:01 AM 10806 30.20 15.98 10.50 22.71 6.57 2.20 24.07 6.58 2.42 21.99 4.92 1.21 18.83 6.53 3.35<br />
03:01 AM 10866 30.20 15.98 10.50 22.71 6.57 2.20 24.08 6.59 2.43 21.99 4.92 1.21 18.84 6.54 3.36<br />
03:41 AM 10906 30.21 15.99 10.51 22.71 6.57 2.20 24.08 6.59 2.43 21.99 4.92 1.21 18.85 6.55 3.37<br />
03:51 AM 10916 30.20 15.98 10.50 22.72 6.58 2.21 24.08 6.59 2.43 21.99 4.92 1.21 18.85 6.55 3.37 2.74 899 *<br />
04:01 AM 10926 30.21 15.99 10.51 22.72 6.58 2.21 24.08 6.59 2.43 21.99 4.92 1.21 18.85 6.55 3.37<br />
05:01 AM 10986 30.22 16.00 10.52 22.72 6.58 2.21 24.09 6.60 2.44 21.99 4.92 1.21 18.86 6.56 3.38<br />
05:21 AM 11006 30.21 15.99 10.51 22.73 6.59 2.22 24.09 6.60 2.44 21.99 4.92 1.21 18.86 6.56 3.38<br />
06:01 AM 11046 30.09 15.87 10.41 22.72 6.58 2.21 24.09 6.60 2.44 21.99 4.92 1.21 18.86 6.56 3.38 2.72 897 *; Adjusted r<strong>at</strong>e<br />
07:01 AM 11106 30.08 15.86 10.41 22.73 6.59 2.22 24.10 6.61 2.45 21.99 4.92 1.21 18.87 6.57 3.39<br />
07:51 AM 11156 30.08 15.86 10.41 22.73 6.59 2.22 24.10 6.61 2.45 21.99 4.92 1.21 18.88 6.58 3.40 2.73 898 *<br />
08:01 AM 11166 30.12 15.90 10.44 22.74 6.60 2.23 24.10 6.61 2.45 21.99 4.92 1.21 18.87 6.57 3.39<br />
08:11 AM 11176 30.23 16.01 10.52 22.75 6.61 2.24 24.10 6.61 2.45 21.99 4.92 1.21 18.89 6.59 3.41 2.75 900 *; Adjusted r<strong>at</strong>e<br />
08:41 AM 11206 30.23 16.01 10.53 22.75 6.61 2.25 24.10 6.61 2.46 21.99 4.92 1.22 18.89 6.59 3.42 from 2.69 ft<br />
09:01 AM 11226 30.23 16.01 10.53 22.75 6.61 2.25 24.10 6.61 2.46 21.99 4.92 1.22 18.89 6.59 3.42<br />
10:01 AM 11286 30.24 16.02 10.54 22.76 6.62 2.26 24.11 6.62 2.47 21.99 4.92 1.22 18.89 6.59 3.42 2.74 899 *<br />
10:21 AM 11306 30.23 16.01 10.53 22.76 6.62 2.26 24.11 6.62 2.47 21.99 4.92 1.22 18.90 6.60 3.43<br />
11:01 AM 11346 30.24 16.02 10.54 22.76 6.62 2.27 24.11 6.62 2.47 21.99 4.92 1.22 18.91 6.61 3.44<br />
12:01 PM 11406 30.25 16.03 10.55 22.76 6.62 2.27 24.11 6.62 2.47 22.00 4.93 1.23 18.92 6.62 3.45 2.75 900 *<br />
01:01 PM 11466 30.24 16.02 10.54 22.75 6.61 2.26 24.11 6.62 2.47 22.00 4.93 1.23 18.90 6.60 3.43<br />
01:41 PM 11506 30.24 16.02 10.55 22.75 6.61 2.27 24.11 6.62 2.48 22.00 4.93 1.24 18.90 6.60 3.44<br />
02:01 PM 11526 30.24 16.02 10.55 22.75 6.61 2.27 24.11 6.62 2.49 22.00 4.93 1.25 18.92 6.62 3.47 2.75 900 *<br />
03:01 PM 11586 30.24 16.02 10.55 22.75 6.61 2.27 24.12 6.63 2.50 22.00 4.93 1.25 18.97 6.67 3.52<br />
03:21 PM 11606 30.25 16.03 10.56 22.75 6.61 2.27 24.12 6.63 2.50 22.00 4.93 1.25 18.92 6.62 3.47<br />
04:01 PM 11646 30.25 16.03 10.56 22.75 6.61 2.27 24.12 6.63 2.50 22.00 4.93 1.25 18.92 6.62 3.47 2.74 899 *<br />
05:01 PM 11706 30.24 16.02 10.55 22.75 6.61 2.27 24.12 6.63 2.50 22.00 4.93 1.25 18.91 6.61 3.46<br />
06:01 PM 11766 30.24 16.02 10.55 22.75 6.61 2.27 24.12 6.63 2.50 22.00 4.93 1.25 18.94 6.64 3.49 2.74 899 *<br />
06:41 PM 11806 30.24 16.02 10.55 22.75 6.61 2.27 24.12 6.63 2.50 22.00 4.93 1.25 18.93 6.63 3.48<br />
07:01 PM 11826 30.25 16.03 10.56 22.76 6.62 2.28 24.12 6.63 2.50 22.00 4.93 1.25 18.94 6.64 3.49<br />
08:01 PM 11886 30.23 16.01 10.55 22.76 6.62 2.29 24.13 6.64 2.51 22.00 4.93 1.25 18.94 6.64 3.49 2.74 899 *<br />
08:21 PM 11906 30.23 16.01 10.55 22.76 6.62 2.29 24.13 6.64 2.51 22.00 4.93 1.25 18.94 6.64 3.49<br />
09:01 PM 11946 30.23 16.01 10.55 22.76 6.62 2.29 24.12 6.63 2.50 21.99 4.92 1.24 18.95 6.65 3.50<br />
10:01 PM 12006 30.22 16.00 10.56 22.76 6.62 2.31 24.13 6.64 2.53 21.99 4.92 1.25 18.95 6.65 3.51 2.74 899 *<br />
11:01 PM 12066 30.21 15.99 10.55 22.76 6.62 2.31 24.12 6.63 2.52 21.99 4.92 1.25 18.95 6.65 3.51<br />
11:41 PM 12106 30.22 16.00 10.56 22.75 6.61 2.30 24.12 6.63 2.52 21.99 4.92 1.25 18.95 6.65 3.51<br />
09/02/93 — — — — — —<br />
12:01 AM 12126 30.22 16.00 10.56 22.75 6.61 2.30 24.12 6.63 2.52 21.99 4.92 1.25 18.% 6.66 3.52 2.74 899 *<br />
01:01 AM 12186 30.21 15.99 10.56 22.75 6.61 2.31 24.12 6.63 2.53 21.99 4.92 1.27 18.95 6.65 3.52<br />
01:21 AM 12206 30.21 15.99 10.56 22.75 6.61 2.31 24.12 6.63 2.53 21.99 4.92 1.27 18.96 6.66 3.53<br />
02:01 AM 12246 30.20 15.98 10.55 22.75 6.61 2.31 24.12 6.63 2.53 21.99 4.92 1.27 18.96 6.66 3.53 2.74 899 •<br />
03:01 AM 12306 30.19 15.97 10.55 22.75 6.61 2.32 24.12 6.63 2.54 21.99 4.92 1.27 18.96 6.66 3.54<br />
04:01 AM 12366 30.20 15.98 10.56 22.75 6.61 2.32 24.12 6.63 2.54 21.99 4.92 1.27 18.96 6.66 3.54 2.74 899 •<br />
04:41 AM 12406 30.19 15.97 10.55 22.75 6.61 2.32 24.12 6.63 2.54 21.99 4.92 1.27 18.96 6.66 3.54<br />
05:01 AM 12426 30.20 15.98 10.56 22.75 6.61 2.32 24.12 6.63 2.54 22.00 4.93 1.28 18.96 6.66 3.54<br />
06:01 AM 12486 30.18 15.96 10.55 22.75 6.61 2.32 24.12 6.63 2.54 22.00 4.93 1.29 18.97 6.67 3.55 2.74 899 •<br />
06:21 AM 12506 30.19 15.97 10.56 22.75 6.61 2.33 24.12 6.63 2.55 22.00 4.93 1.29 18.96 6.66 3.54<br />
+ Adjusted drawdowns result from correl<strong>at</strong>ion with river stage d<strong>at</strong>a (see text) *Piezometer/R<strong>at</strong>e reading within 5 minutes of indic<strong>at</strong>ed time
<strong>Ground</strong>-W<strong>at</strong>er Investig<strong>at</strong>ion <strong>at</strong> <strong>Mount</strong> <strong>Carmel</strong>, <strong>IL</strong><br />
Third Long-Term Test—Test Well 2 (Concluded)<br />
August 24-September 2,1993<br />
Pumped Test Well 2 Observ<strong>at</strong>ion Well 1 Observ<strong>at</strong>ion Well 2 Observ<strong>at</strong>ion Well 3 Observ<strong>at</strong>ion Well 4<br />
D<strong>at</strong>e/ Elapsed Depth to Drawdown Depth to Drawdown Depth to Drawdown . Depth to Drawdown Depth to Drawdown Piez<br />
Hour time W<strong>at</strong>er Obs Adj+ W<strong>at</strong>er Obs Adj+ W<strong>at</strong>er Obs Adj+ W<strong>at</strong>er Obs Adj+ W<strong>at</strong>er Obs Adj+ Head R<strong>at</strong>e Remarks<br />
(min) (ft) (ft) (ft) (ft) (ft) (ft) (ft) (ft) (ft) (ft) (ft) (ft) (ft) (ft) (ft) (ft) (gpm)<br />
07:01 AM 12546 30.18 15.96 10.55 22.75 6.61 2.33 24.12 6.63 2.55 22.00 4.93 129 18.97 6.67 3.56<br />
08:01 AM 12606 30.18 15.96 10.55 22.75 6.61 2.33 24.12 6.63 2.55 22.00 4.93 1.29 18.97 6.67 3.56<br />
08:11 AM 12616 30.18 15.96 10.55 22.75 6.61 2.33 24.12 6.63 2.55 22.00 4.93 1.29 18.97 6.67 3.56 2.74 899 *<br />
09:01 AM 12666 30.17 15.95 10.54 22.75 6.61 2.33 24.12 6.63 2.55 22.00 4.93 1.29 18.98 6.68 3.57<br />
09:41 AM 12706 30.17 15.95 10.54 22.75 6.61 2.33 24.12 6.63 2.55 22.00 4.93 1.29 18.99 6.69 3.58<br />
10.01 AM 12726 30.18 15.96 10.55 22.74 6.60 2.32 24.11 6.62 2.54 22.00 4.93 1.29 19.03 6.73 3.62<br />
10:11 AM 12736 30.18 15.96 10.55 22.74 6.60 2.32 24.11 6.62 2.54 22.00 4.93 1.30 18.97 6.67 3.56 2.74 899 *<br />
11:01 AM 12786 30.18 15.96 10.56 22.75 6.61 2.34 24.12 6.63 2.56 22.00 4.93 1.30 18.99 6.69 3.58<br />
11:21 AM 12806 30.18 15.96 10.56 22.75 6.61 2.34 24.12 6.63 2.56 22.00 4.93 1.30 19.07 6.77 3.66<br />
12:01 PM 12846 30.17 15.95 10.55 22.74 6.60 2.33 24.12 6.63 2.56 22.00 4.93 1.30 19.03 6.73 3.62<br />
12:11 PM 12856 30.18 15.96 10.56 22.74 6.60 2.33 24.12 6.63 2.56 22.00 4.93 1.30 18.91 6.61 3.50 2.74 899 *<br />
01:01 PM 12906 30.18 15.96 10.56 22.75 6.61 2.34 24.12 6.63 2.56 22.00 4.93 1.30 18.92 6.62 3.51<br />
02:01 PM 12966 30.18 15.96 10.56 22.74 6.60 2.33 24.12 6.63 2.56 22.00 4.93 1.30 18.99 6.69 3.58<br />
02:11 PM 12976 30.18 15.96 10.56 22.74 6.60 2.33 24.12 6.63 2.56 22.00 4.93 1.30 18.98 6.68 3.57 2.74 899 *<br />
02:41 PM 13006 30.18 15.96 10.56 22.74 6.60 2.33 24.13 6.64 2.57 22.00 4.93 1.30 18.99 6.69 3.58<br />
03:01 PM 13026 30.18 15.96 10.56 22.74 6.60 2.33 24.13 6.64 2.57 22.00 4.93 1.30 19.02 6.72 3.61<br />
03:11 PM 13036 30.18 15.96 10.56 22.74 6.60 2.33 24.12 6.63 2.56 22.00 4.93 1.30 19.02 6.72 3.61<br />
03:21 PM 13046 30.18 15.96 10.56 22.74 6.60 2.33 24.13 6.64 2.57 22.00 4.93 1.30 18.98 6.68 3.57<br />
03:31 PM 13056 30.19 15.97 10.56 22.74 6.60 2.33 24.13 6.64 2.57 22.00 4.93 1.30 18.99 6.69 3.58<br />
03:41 PM 13066 30.19 15.97 10.56 22.74 6.60 2.33 24.13 6.64 2.57 22.00 4.93 1.30 18.98 6.68 3.57<br />
03:51 PM 13076 30.18 15.96 10.56 22.74 6.60 2.33 24.13 6.64 2.57 22.00 4.93 1.30 18.95 6.65 3.54<br />
04:01 PM 13086 30.19 15.97 10.56 22.74 6.60 2.33 24.13 6.64 2.57 22.00 4.93 1.30 18.99 6.69 3.58<br />
04:11 PM 130% 30.20 15.98 10.57 22.74 6.60 2.33 24.13 6.64 2.57 22.00 4.93 1.30 18.96 6.66 3.55<br />
04:21 PM 13106 30.20 15.98 10.57 22.74 6.60 2.33 24.13 6.64 2.57 22.00 4.93 1.30 18.98 6.68 3.57 2.74 899 *<br />
04:31 PM 13116 30.20 15.98 10.57 22.74 6.60 2.33 24.13 6.64 2.57 22.00 4.93 1.30 18.99 6.69 3.58<br />
04:41 PM 13126 30.19 15.97 10.56 22.74 6.60 2.32 24.13 6.64 2.56 22.00 4.93 1.29 18.99 6.69 3.58<br />
04:51 PM 13136 30.19 15.97 10.56 22.74 6.60 2.32 24.13 6.64 2.56 22.00 4.93 1.29 19.00 6.70 3.59<br />
05:01 PM 13146 30.20 15.98 10.57 22.74 6.60 2.32 24.13 6.64 2.56 22.00 4.93 1.29 18.99 6.69 3.58<br />
05:11 PM 13156 30.20 15.98 10.57 22.75 6.61 2.33 24.13 6.64 2.56 22.00 4.93 1.29 18.98 6.68 3.57<br />
05:21 PM 13166 30.20 15.98 10.57 22.75 6.61 2.33 24.13 6.64 2.56 22.00 4.93 1.29 19.00 6.70 3.59<br />
05:31 PM 13176 30.20 15.98 10.57 22.75 6.61 2.33 24.14 6.65 2.57 22.00 4.93 1.29 19.01 6.71 3.60<br />
05:41 PM 13186 30.22 16.00 10.58 22.75 6.61 2.32 24.14 6.65 2.56 22.00 4.93 129 18.99 6.69 3.57<br />
05:51 PM 13196 30.21 15.99 10.57 22.75 6.61 2.32 24.14 6.65 2.56 22.00 4.93 1.29 19.00 6.70 3.58<br />
06:01 PM 13206 30.22 16.00 10.58 22.76 6.62 2.33 24.14 6.65 2.56 22.00 4.93 1.29 19.00 6.70 3.58 2.74 899 *<br />
06:31 PM 13236 30.24 16.02 10.59 22.76 6.62 2.33 24.14 6.65 2.56 22.00 4.93 1.29 18.94 6.64 3.52 End of Test<br />
D<strong>at</strong>a logging equipment<br />
ceased to function.<br />
+Adjusted drawdowns result from correl<strong>at</strong>ion with river stage d<strong>at</strong>a (see text)<br />
*Piezometer/R<strong>at</strong>e reading within 5 minutes of indic<strong>at</strong>ed time
Appendix G.<br />
Elev<strong>at</strong>ions of <strong>Ground</strong>-W<strong>at</strong>er Levels and the Wabash River
Elev<strong>at</strong>ions of <strong>Ground</strong>-W<strong>at</strong>er Levels and the Wabash River<br />
Intermittent Record: October 1992 - September 1993<br />
105
Elev<strong>at</strong>ions of <strong>Ground</strong>—W<strong>at</strong>er Levels and the Wabash River<br />
Intermittent Record: October 1992 - September 1993 (Continued)<br />
106
Elev<strong>at</strong>ions of <strong>Ground</strong>—W<strong>at</strong>er Levels and the Wabash River<br />
Intermittent Record: October 1992 - September 1993 (Continued)<br />
107
Elev<strong>at</strong>ions of <strong>Ground</strong>—W<strong>at</strong>er Levels and the Wabash River<br />
Intermittent Record: October 1992 - September 1993 (Continued)<br />
108
Elev<strong>at</strong>ions of <strong>Ground</strong>-W<strong>at</strong>er Levels and the Wabash River<br />
Intermittent Record: October 1992 - September 1993 (Continued)<br />
109
Elev<strong>at</strong>ions of <strong>Ground</strong>-W<strong>at</strong>er Levels and the Wabash River<br />
Internment Record: October 1992 - September 1993 (Continued<br />
110
Elev<strong>at</strong>ions of <strong>Ground</strong>-W<strong>at</strong>er Levels and the Wabash River<br />
Intermittent Record: October 1992 - September 1993 (Continued)<br />
111
Elev<strong>at</strong>ions of <strong>Ground</strong>-W<strong>at</strong>er Levels and the Wabash River<br />
Intermittent Record: October 1992 - September 1993 (Continued)<br />
112
Elev<strong>at</strong>ions of <strong>Ground</strong>—W<strong>at</strong>er Levels and the Wabash River<br />
Intermittent Record: October 1992 - September 1993 (Continued)<br />
113
Elev<strong>at</strong>ions of <strong>Ground</strong>-W<strong>at</strong>er Levels and the Wabash River<br />
Intermittent Record: October 1992 - September 1993 (Continued)<br />
114
Elev<strong>at</strong>ions of <strong>Ground</strong>—W<strong>at</strong>er Levels and the Wabash River<br />
Intermittent Record: October 1992 — September 1993 (Continued)<br />
115
Elev<strong>at</strong>ions of <strong>Ground</strong>-W<strong>at</strong>er Levels and the Wabash River<br />
Intermittent Record: October 1992 - September 1993 (Continued)<br />
116
Elev<strong>at</strong>ions of <strong>Ground</strong>—W<strong>at</strong>er Levels and the Wabash River<br />
Intermittent Record: October 1992 - September 1993 (Continued)<br />
117
Elev<strong>at</strong>ions of <strong>Ground</strong>-W<strong>at</strong>er Levels and the Wabash River<br />
Intermittent Record: October 1992 - September 1993 (Continued)<br />
118
Elev<strong>at</strong>ions of <strong>Ground</strong>-W<strong>at</strong>er Levels and the Wabash River<br />
Intermittent Record: October 1992 — September 1993 (Continued)<br />
119
Elev<strong>at</strong>ions of <strong>Ground</strong>-W<strong>at</strong>er Levels and the Wabash River<br />
Intermittent Record: October 1992 - September 1993 (Continued)<br />
120
Elev<strong>at</strong>ions of <strong>Ground</strong>—W<strong>at</strong>er Levels and the Wabash River<br />
Intermittent Record: October 1992 - September 1993 (Continued)<br />
121
Elev<strong>at</strong>ions of <strong>Ground</strong>-W<strong>at</strong>er Levels and the Wabash River<br />
Intermittent Record: October 1992 - September 1993 (Continued)<br />
122
Elev<strong>at</strong>ions of <strong>Ground</strong>-W<strong>at</strong>er Levels and the Wabash River<br />
Intermittent Record: October 1992 - September 1993 (Continued)<br />
123
Elev<strong>at</strong>ions of <strong>Ground</strong>-W<strong>at</strong>er Levels and the Wabash River<br />
Intermittent Record: October 1992 - September 1993 (Continued)<br />
124
Elev<strong>at</strong>ions of <strong>Ground</strong>-W<strong>at</strong>er Levels and the Wabash River<br />
Intermittent Record: October 1992 - September 1993 (Continued)<br />
125
Elev<strong>at</strong>ions of <strong>Ground</strong>-W<strong>at</strong>er Levels and the Wabash River<br />
Intermittent Record: October 1992 - September 1993 (Continued)<br />
126
Elev<strong>at</strong>ions of <strong>Ground</strong>-W<strong>at</strong>er Levels and the Wabash River<br />
Intermittent Record: October 1992 - September 1993 (Continued)<br />
127
Elev<strong>at</strong>ions of <strong>Ground</strong>-W<strong>at</strong>er Levels and the Wabash River<br />
Intermittent Record: October 1992 - September 1993 (Continued)<br />
128
Elev<strong>at</strong>ions of <strong>Ground</strong>—W<strong>at</strong>er Levels and the Wabash River<br />
Intermittent Record: October 1992 — September 1993 (Continued)<br />
129
Elev<strong>at</strong>ions of <strong>Ground</strong>—W<strong>at</strong>er Levels and the Wabash River<br />
Intermittent Record: October 1992 - September 1993 (Continued)<br />
130
Elev<strong>at</strong>ions of <strong>Ground</strong>—W<strong>at</strong>er Levels and the Wabash River<br />
Intermittent Record: October 1992 - September 1993 (Continued)<br />
131
Elev<strong>at</strong>ions of <strong>Ground</strong>—W<strong>at</strong>er Levels and the Wabash River<br />
Intermittent Record: October 1992 - September 1993 (Continued)<br />
132
Elev<strong>at</strong>ions of <strong>Ground</strong>—W<strong>at</strong>er Levels and the Wabash River<br />
Intermittent Record: October 1992 - September 1993 (Continued)<br />
133
Elev<strong>at</strong>ions of <strong>Ground</strong>—W<strong>at</strong>er Levels and the Wabash River<br />
Intermittent Record: October 1992 - September 1993 (Continued)<br />
134
Elev<strong>at</strong>ions of <strong>Ground</strong>-W<strong>at</strong>er Levels and the Wabash River<br />
Intermittent Record: October 1992 - September 1993 (Continued)<br />
135
Elev<strong>at</strong>ions of <strong>Ground</strong>-W<strong>at</strong>er Levels and the Wabash River<br />
Intermittent Record: October 1992 - September 1993 (Continued)<br />
136
Elev<strong>at</strong>ions of <strong>Ground</strong>-W<strong>at</strong>er Levels and the Wabash River<br />
Intermittent Record: October 1992 - September 1993 (Continued)<br />
137
Elev<strong>at</strong>ions of <strong>Ground</strong>—W<strong>at</strong>er Levels and the Wabash River<br />
Intermittent Record: October 1992 - September 1993 (Continued)<br />
138
Elev<strong>at</strong>ions of <strong>Ground</strong>-W<strong>at</strong>er Levels and the Wabash River<br />
Intermittent Record: October 1992 - September 1993 (Continued)<br />
139
Elev<strong>at</strong>ions of <strong>Ground</strong>-W<strong>at</strong>er Levels and the Wabash River<br />
Intermittent Record: October 1992 - September 1993 (Continued)<br />
140
Elev<strong>at</strong>ions of <strong>Ground</strong>—W<strong>at</strong>er Levels and the Wabash River<br />
Intermittent Record: October 1992 - September 1993 (Continued)<br />
141<br />
* Piezometer/R<strong>at</strong>e reading within 5 minutes of indic<strong>at</strong>ed time
Elev<strong>at</strong>ions of <strong>Ground</strong>—W<strong>at</strong>er Levels and the Wabash River<br />
Intermittent Record: October 1992 - September 1993 (Continued)<br />
142<br />
* Piezometer/R<strong>at</strong>e reading within 5 minutes of indic<strong>at</strong>ed time
Elev<strong>at</strong>ions of <strong>Ground</strong>-W<strong>at</strong>er Levels and the Wabash River<br />
Intermittent Record: October 1992 - September 1993 (Continued)<br />
143<br />
* Piezometer/R<strong>at</strong>e reading within 5 minutes of indic<strong>at</strong>ed time
Elev<strong>at</strong>ions of <strong>Ground</strong>—W<strong>at</strong>er Levels and the Wabash River<br />
Intermittent Record: October 1992 - September 1993 (Continued)<br />
144
Elev<strong>at</strong>ions of <strong>Ground</strong>-W<strong>at</strong>er Levels and the Wabash River<br />
Intermittent Record: October 1992 - September 1993 (Continued)<br />
145
Elev<strong>at</strong>ions of <strong>Ground</strong>—W<strong>at</strong>er Levels and the Wabash River<br />
Intermittent Record: October 1992 - September 1993 (Continued)<br />
146
Elev<strong>at</strong>ions of <strong>Ground</strong>—W<strong>at</strong>er Levels and the Wabash River<br />
Intermittent Record: October 1992 - September 1993 (Continued)<br />
147
Elev<strong>at</strong>ions of <strong>Ground</strong>-W<strong>at</strong>er Levels and the Wabash River<br />
Intermittent Record: October 1992 - September 1993 (Continued)<br />
148<br />
* Piezometer/R<strong>at</strong>e reading within 5 minutes of indic<strong>at</strong>ed time
Elev<strong>at</strong>ions of <strong>Ground</strong>-W<strong>at</strong>er Levels and the Wabash River<br />
Intermittent Record: October 1992 - September 1993 (Continued)<br />
149<br />
* Piezometer/R<strong>at</strong>e reading within 5 minutes of indic<strong>at</strong>ed time
Elev<strong>at</strong>ions of <strong>Ground</strong>-W<strong>at</strong>er Levels and the Wabash River<br />
Intermittent Record: October 1992 - September 1993 (Continued)<br />
150<br />
* Piezometer/R<strong>at</strong>e reading within 5 minutes of indic<strong>at</strong>ed time
Elev<strong>at</strong>ions of <strong>Ground</strong>-W<strong>at</strong>er Levels and the Wabash River<br />
Intermittent Record: October 1992 - September 1993 (Concluded)<br />
151<br />
* Piezometer/R<strong>at</strong>e reading within 5 minutes of indic<strong>at</strong>ed time
Appendix H.<br />
Correspondence of Preliminary Results
<strong>Illinois</strong> St<strong>at</strong>e W<strong>at</strong>er Survey<br />
Hydrology Division<br />
2204 Griffith Drive<br />
<strong>Champaign</strong>, <strong>Illinois</strong> 61820-7495<br />
Telephone (217) 333-4300<br />
Telefax (217) 333-6540<br />
December 23, 1992<br />
Mr. Mark Bader<br />
City Administr<strong>at</strong>or<br />
City of <strong>Mount</strong> <strong>Carmel</strong><br />
219 North Market Street<br />
<strong>Mount</strong> <strong>Carmel</strong>, <strong>IL</strong> 62863<br />
Dear Mr. Bader:<br />
This letter is to report our progress on the cooper<strong>at</strong>ive ground-<strong>w<strong>at</strong>er</strong><br />
<strong>investig<strong>at</strong>ion</strong> underway <strong>at</strong> the site south of <strong>Mount</strong> <strong>Carmel</strong> in the NH, NE¼,<br />
Section 32, T.1 S., R.12 W., Wabash County. With the cooper<strong>at</strong>ion and<br />
assistance of your drilling contractor, Speth Plumbing, Inc., and your city<br />
staff, we have conducted a step test on October 20, 1992, to evalu<strong>at</strong>e the<br />
condition of Test Well 2, a 24-hour aquifer test on October 22-23, 1992,<br />
and a 7-day aquifer test on November 9-17, 1992, to evalu<strong>at</strong>e the hydraulic<br />
properties of the sand and gravel aquifer. The ground-<strong>w<strong>at</strong>er</strong> level d<strong>at</strong>a<br />
collected during these tests has been analyzed by accepted methodologies.<br />
The results of the 24-hour aquifer test provided preliminary values for<br />
aquifer hydraulic properties and indic<strong>at</strong>ed th<strong>at</strong> the sand and gravel<br />
m<strong>at</strong>erials comprising the aquifer are quite permeable (which is in agreement<br />
with the results of the 24-hour test, July 16-17, 1991, <strong>at</strong> TW 1-91). The<br />
d<strong>at</strong>a also indic<strong>at</strong>ed th<strong>at</strong> flow conditions for the test were entirely under<br />
<strong>w<strong>at</strong>er</strong>-table conditions. Lastly, the d<strong>at</strong>a suggested neither a recharge<br />
boundary (<strong>at</strong> the Wabash River) nor a barrier boundary - <strong>at</strong> least for the<br />
dur<strong>at</strong>ion of the test.<br />
The 7-day aquifer test was affected by <strong>at</strong> least three conditions th<strong>at</strong><br />
influenced the <strong>w<strong>at</strong>er</strong>-level d<strong>at</strong>a to varying degrees:<br />
a) W<strong>at</strong>er levels in all five wells prior to the start of the test<br />
indic<strong>at</strong>ed th<strong>at</strong> nonpumping ground-<strong>w<strong>at</strong>er</strong> levels had risen some 7 feet<br />
from their levels prior to the 24-hour test. As a result, flow<br />
conditions <strong>at</strong> the start of the 7-day test were artesian. During the<br />
test, however, conditions converted from artesian to <strong>w<strong>at</strong>er</strong>-table,<br />
causing a distortion of the cone of depression.<br />
b) During approxim<strong>at</strong>ely the first 2600 minutes of the test, the river<br />
stages were falling <strong>at</strong> an average r<strong>at</strong>e of about 0.022 ft/100 min.<br />
155
Mr. Bader/December 23, 1992/Page 2<br />
c) During the remainder of the test, river stages climbed - <strong>at</strong> times<br />
dram<strong>at</strong>ically - causing <strong>w<strong>at</strong>er</strong> levels in all five wells to rise by such<br />
an amount as to mask the influence of the test pumping. The effects<br />
of these influences were superimposed on the <strong>w<strong>at</strong>er</strong>-level drawdowns<br />
caused by pumping, beginning especially during the drawdown phase<br />
when slow, gravity drainage within the aquifer was taking place, and<br />
increasing near the end of the gravity drainage. The result was th<strong>at</strong><br />
most of the d<strong>at</strong>a were rendered intractable to adjustment, and<br />
analysis was severely compromised.<br />
In order th<strong>at</strong> an informed decision might be made about whether a new 7-day<br />
test should be conducted under more stable Wabash River and aquifer<br />
conditions, an aquifer and well field yield analysis was made using the<br />
aquifer hydraulic properties determined from the 24-hour test and a<br />
conserv<strong>at</strong>ive scenario of aquifer conditions. A conceptual idealized<br />
aquifer model was postul<strong>at</strong>ed in which the potential effect of the river as<br />
a recharge boundary was neglected, although the river's effect as a control<br />
on the s<strong>at</strong>ur<strong>at</strong>ed thickness of the aquifer was maintained. Based on the<br />
geometry of aquifer m<strong>at</strong>erials in the area, the model selected was a 90°<br />
wedge-shaped aquifer whose axis was perpendicular to the river and whose<br />
l<strong>at</strong>eral extent toward and beyond the river was effectively infinite.<br />
To test the feasibility of developing the desired 3-mgd <strong>w<strong>at</strong>er</strong> supply under<br />
the most severe anticip<strong>at</strong>ed conditions, the s<strong>at</strong>ur<strong>at</strong>ed thickness of the<br />
aquifer was assumed to be th<strong>at</strong> thickness which exists when the Wabash is <strong>at</strong><br />
its lowest stage. U. S. Geological Survey records from the river stage<br />
gage <strong>at</strong> <strong>Mount</strong> <strong>Carmel</strong> indic<strong>at</strong>e th<strong>at</strong> a level of 2.1 feet above the gage d<strong>at</strong>um<br />
was observed during the severe drought of 1988-89, which was only 0.35 ft<br />
higher than the historic low. The river stages for the start of the 24-<br />
hour and 7-day tests, by comparison, were 5.34 ft and 13.94 ft,<br />
respectively. Observed <strong>w<strong>at</strong>er</strong> levels in the wells were correl<strong>at</strong>ed with<br />
observed river stages, and the resulting regression equ<strong>at</strong>ions were used to<br />
estim<strong>at</strong>e expected low ground-<strong>w<strong>at</strong>er</strong> level stages during a severe drought. A<br />
river stage of 2.0 ft above d<strong>at</strong>um was assumed to represent severe drought<br />
conditions. From this inform<strong>at</strong>ion an aquifer s<strong>at</strong>ur<strong>at</strong>ed thickness was<br />
estim<strong>at</strong>ed <strong>at</strong> each well. The s<strong>at</strong>ur<strong>at</strong>ed thickness was then multiplied by the<br />
hydraulic conductivity derived from the 24-hour test to determine the<br />
transmissivity for the conceptual idealized aquifer model.<br />
An average transmissivity of about 231,000 gpd/ft was calcul<strong>at</strong>ed from the<br />
individual values determined <strong>at</strong> the wells and was used in the idealized<br />
model, along with a value of 0.1 for the specific yield. A second model<br />
which utilized a specific yield of 0.15 was also tested. Various distances<br />
. from a hypothesized well field to the barrier boundaries were also tested.<br />
Three different models were tested in all, in order to assess the<br />
sensitivity of the model to specific yield and size of aquifer in the<br />
vicinity of the well field.<br />
The results of the idealized model analysis suggest th<strong>at</strong> under conditions<br />
of severe low river stage a ground-<strong>w<strong>at</strong>er</strong> supply of about 1.8 to 2.2 mgd<br />
156
Mr. Bader/December 23, 1992/Page 3<br />
could be developed from the aquifer, even if the aquifer is not in<br />
hydraulic contact with the Wabash River. Given this analysis and the d<strong>at</strong>a<br />
collected under less than desirable river conditions, it certainly appears<br />
prudent to consider conducting the 7-day aquifer test under stable river<br />
and aquifer conditions. If the test can be conducted under strictly <strong>w<strong>at</strong>er</strong><br />
table conditions, the d<strong>at</strong>a would be more amenable to analysis than was the<br />
case for the aquifer test conducted November 9-17, 1992.<br />
Although these results do not achieve the objective of a ground-<strong>w<strong>at</strong>er</strong><br />
supply of about 3-mgd, they do suggest th<strong>at</strong> a supply capable of meeting the<br />
present demands of the city (about 1.2 mgd) can be developed. Even if the<br />
further aquifer testing and analysis <strong>at</strong> this time indic<strong>at</strong>e th<strong>at</strong> a 3-mgd<br />
supply is not available in the vicinity of Test Well 2, an additional 1-mgd<br />
likely could be developed in the future, if needed, from 2 or 3 production<br />
wells in the vicinity of Test Well 1-91 loc<strong>at</strong>ed in the NW¼, Section 5, T.2<br />
S., R.12 W. Depending on the response of the aquifer system to pumpage, it<br />
might be possible to develop the additional 1 mgd from a loc<strong>at</strong>ion closer to<br />
the site of Test Well 2.<br />
We will be happy, if you desire, to cooper<strong>at</strong>e in the conduct of another 7-<br />
day aquifer test as soon as river stages, we<strong>at</strong>her and ground conditions,<br />
and work schedules allow. Hopefully this can be accomplished during the<br />
month of January, 1993. The results of this second test should be<br />
available to you about 3-4 weeks after its conclusion. We can conduct,<br />
with your assistance, this second 7-day aquifer test within the terms of<br />
our present cooper<strong>at</strong>ive agreement.<br />
Very truly yours,<br />
Ellis W. Sanderson, P.E.<br />
Senior Engineer<br />
Office of <strong>Ground</strong>-W<strong>at</strong>er Resources<br />
Evalu<strong>at</strong>ion and Management<br />
Phone: (217) 333-0235<br />
Adrian P. Visocky, P.E.<br />
Director<br />
Office of <strong>Ground</strong>-W<strong>at</strong>er Resources<br />
Evalu<strong>at</strong>ion and Management<br />
Phone: (217) 333-1724<br />
cc:<br />
Jim Speth, Speth Plumbing, Inc.<br />
IEPA (2)<br />
157
<strong>Illinois</strong> St<strong>at</strong>e W<strong>at</strong>er Survey<br />
February 1, 1993<br />
Hydrology Division<br />
2204 Griffith Drive<br />
<strong>Champaign</strong>, <strong>Illinois</strong> 61820-7495<br />
Telephone (217) 333-4300<br />
Telefax (217) 333-6540<br />
Mr. Michael L. Gill, P.E.<br />
Lamac Engineering Company, Inc.,<br />
323 West 3rd Street<br />
P.O. Box 160<br />
Mt. <strong>Carmel</strong>, <strong>IL</strong> 62863<br />
Dear Mr. Gill:<br />
This is in response to our recent telephone convers<strong>at</strong>ions regarding a well<br />
field configur<strong>at</strong>ion for the site under <strong>investig<strong>at</strong>ion</strong> by the City of <strong>Mount</strong><br />
<strong>Carmel</strong>. We understand th<strong>at</strong> you are interested in the constructed well<br />
field having the capability of withdrawing as much as 3 million gallons per<br />
day (mgd).<br />
The cooper<strong>at</strong>ive <strong>investig<strong>at</strong>ion</strong> in progress with the City of <strong>Mount</strong> <strong>Carmel</strong> has<br />
indic<strong>at</strong>ed th<strong>at</strong> a yield of about 2 mgd should be possible. The analysis<br />
using the idealized model described in our letter to Mr. Bader d<strong>at</strong>ed<br />
December 23, 1992, assumed a three-well well field with the production<br />
wells spaced about 500 feet apart along the shoreline of the Wabash River.<br />
We understand th<strong>at</strong> the city owns property <strong>at</strong> the site th<strong>at</strong> includes about<br />
1300 feet of shoreline along the Wabash River. If the constructed well<br />
field is to have the capability of about 3 mgd, anticip<strong>at</strong>ing th<strong>at</strong> the<br />
planned subsequent testing proves this yield amount, then additional<br />
property would be required if the 500-foot spacing is to be maintained.<br />
After review of the inform<strong>at</strong>ion available <strong>at</strong> this time, we suggest th<strong>at</strong> a<br />
reasonable approach may be a four-well well field with the wells on a 400-<br />
foot spacing. If we assume an average production r<strong>at</strong>e of about 500 gpm for<br />
each well, then the combined r<strong>at</strong>e from all wells would approach the desired<br />
3 mgd.<br />
If the <strong>w<strong>at</strong>er</strong> demand for the city increases in the future requiring<br />
production th<strong>at</strong> approaches 3 mgd, then one or more additional well sites<br />
may be required to allow for <strong>at</strong> least one production well on standby<br />
st<strong>at</strong>us. It may be prudent for the city to acquire a long-term option for<br />
additional property north or south of the present city-owned site. Whether<br />
one direction is better than the other cannot be determined unless<br />
additional test borings are made to confirm the thickness and texture of<br />
the sand and gravel aquifer m<strong>at</strong>erial. The site of Test Well 1 loc<strong>at</strong>ed<br />
about 1-14 miles south of the city-owned site represents another possible<br />
site to consider for a long-term option.<br />
We do not recommend th<strong>at</strong> any wells be loc<strong>at</strong>ed away from the shoreline of<br />
the Wabash River.<br />
158
Mr. Gill/February 1, 1993/Page 2<br />
Please contact us if you have further questions. We continue our posture<br />
of waiting until river and aquifer conditions are rel<strong>at</strong>ively stable to<br />
conduct another 7-day aquifer test.<br />
Very truly yours,<br />
Office of <strong>Ground</strong>-W<strong>at</strong>er Resource<br />
Evalu<strong>at</strong>ion and Management<br />
Phone: (217) 333-0235<br />
Enclosures as st<strong>at</strong>ed.<br />
cc:<br />
Mark Bader, City of <strong>Mount</strong> <strong>Carmel</strong><br />
IEPA (2)<br />
Adrian Visocky, ISWS<br />
159
<strong>Illinois</strong> St<strong>at</strong>e W<strong>at</strong>er Survey<br />
Hydrology Division<br />
2204 Griffith Drive<br />
<strong>Champaign</strong>, <strong>Illinois</strong> 61820-7495<br />
Telephone (217) 333-4300<br />
Telefax (217) 333-6540<br />
Mr. Mark Bader<br />
City Administr<strong>at</strong>or<br />
City of <strong>Mount</strong> <strong>Carmel</strong><br />
219 North Market Street<br />
<strong>Mount</strong> <strong>Carmel</strong>, <strong>IL</strong> 62863<br />
Dear Mr. Bader:<br />
We have completed our analysis of d<strong>at</strong>a during the aquifer test collected in August from <strong>Mount</strong><br />
<strong>Carmel</strong> Test Well 2, loc<strong>at</strong>ed in the NW¼, NE¼, NE¼ of Section 32, T.1S., R.12W., Wabash<br />
County. We will write a formal report of all of our d<strong>at</strong>a collection and analyses and send you a draft<br />
version for your review, but we wish to share with you <strong>at</strong> this time the basic findings from our<br />
<strong>investig<strong>at</strong>ion</strong>.<br />
The purpose of the <strong>investig<strong>at</strong>ion</strong>, of course, was to determine the feasibility of developing a ground<strong>w<strong>at</strong>er</strong><br />
supply of up to 3 mgd <strong>at</strong> the site. After examining the <strong>w<strong>at</strong>er</strong>-level d<strong>at</strong>a from the wells, along<br />
with river stage d<strong>at</strong>a, we were able to calcul<strong>at</strong>e the hydraulic properties of the aquifer and hypothesize<br />
a conceptual flow model for the aquifer. The analysis concluded th<strong>at</strong> the Wabash River was in<br />
hydraulic connection with the aquifer during the test, and so the conceptual model included such a<br />
connection, with allowances for conditions under dry we<strong>at</strong>her river stages.<br />
The next step was to incorpor<strong>at</strong>e the conceptual flow into an idealized m<strong>at</strong>hem<strong>at</strong>ical aquifer and to<br />
calcul<strong>at</strong>e the effect of ground-<strong>w<strong>at</strong>er</strong> withdrawals from a hypothetical well field <strong>at</strong> the site. Worst-case<br />
conditions were assumed for the analysis, including low river stages. Based on these calcul<strong>at</strong>ions it<br />
appears th<strong>at</strong> a 3 mgd supply is feasible <strong>at</strong> the site from a well field consisting of four wells, spaced <strong>at</strong><br />
approxim<strong>at</strong>ely 400 feet, along with a standby well.<br />
The next logical step for <strong>Mount</strong> <strong>Carmel</strong> would be to investig<strong>at</strong>e aquifer conditions <strong>at</strong> the northeast end<br />
(parallel to the river) of the hypothetical well field - a site 1600 feet northeast of Test Well 2 - by<br />
drilling a test boring. The boring would allow the city to determine if sufficient sand and gravel<br />
deposits are present to allow the construction of a production well. Similar borings could be made <strong>at</strong><br />
the intermedi<strong>at</strong>e well loc<strong>at</strong>ions, 800 feet and 1200 feet northeast of TW2. We would be happy to<br />
discuss the details of this phase of the <strong>investig<strong>at</strong>ion</strong>, whenever you wish.<br />
Please call us, if you have any questions about our findings.<br />
Sincerely,<br />
Adrian P. Visocky, Director<br />
Office of <strong>Ground</strong>-W<strong>at</strong>er Resource<br />
Evalu<strong>at</strong>ion and Management<br />
Phone: (217)333-1724<br />
160
<strong>Illinois</strong> St<strong>at</strong>e W<strong>at</strong>er Survey<br />
January 6, 1994<br />
Hydrology Division<br />
2204 Griffith Drive<br />
<strong>Champaign</strong>, <strong>Illinois</strong> 61820-7495<br />
Telephone (217) 333-4300<br />
Telefax (217) 333-6540<br />
Mr. Brad Gould<br />
Lamac Engineering Company, Inc.<br />
323 West 3rd Street<br />
P.O. Box 160<br />
<strong>Mount</strong> <strong>Carmel</strong>, <strong>IL</strong> 62863<br />
Dear Mr. Gould:<br />
We have reviewed the driller's logs and sieve d<strong>at</strong>a for the test borings drilled <strong>at</strong> the<br />
prospective loc<strong>at</strong>ions of the production wells for the new well field for the City of<br />
<strong>Mount</strong> <strong>Carmel</strong>. The test borings are loc<strong>at</strong>ed along the Wabash River about 400-feet<br />
apart in the SEVi, SE¼, Section 29 and the NE¼, NE¼, Section 32, T.1 S., R.12 W.,<br />
Wabash County, <strong>IL</strong>. A pumping Test Well 2 exists <strong>at</strong> the site and has been used for<br />
extensive aquifer testing to evalu<strong>at</strong>e the long-term safe yield of a well field <strong>at</strong> this<br />
site. The results of the analysis of the aquifer test d<strong>at</strong>a collected during the August-<br />
September 1993 period were reported in a letter to the city d<strong>at</strong>ed October 23, 1993<br />
The design of the well field in this analysis allowed for extreme drought conditions<br />
and ground-<strong>w<strong>at</strong>er</strong> levels <strong>at</strong> elev<strong>at</strong>ions much lower than experienced during the<br />
aquifer tests. Probable well screen lengths of about 20 feet were assumed in the well<br />
field yield analysis with individual production wells oper<strong>at</strong>ed <strong>at</strong> about 500 gpm.<br />
The sieve d<strong>at</strong>a of the form<strong>at</strong>ion samples collected during the test borings show the<br />
sand and gravel aquifer is primarily a coarse sand to fine gravel m<strong>at</strong>erial and does<br />
vary from well site to well site. According to our well design criteria, production<br />
wells <strong>at</strong> two of the sites could be of tubular construction. However, the other two<br />
sites do require a gravel packed well for maximum yield and long service life. To<br />
facilit<strong>at</strong>e specific<strong>at</strong>ions and efficient field construction procedures it is recommended<br />
th<strong>at</strong> all production wells be of gravel packed construction. The reverse rotary<br />
drilling method is also recommended to facilit<strong>at</strong>e well development processes and<br />
promote hydraulically efficient production wells. For the design production r<strong>at</strong>e of<br />
500 gpm from an individual well, the well screen in each production well can be 12-<br />
inches in diameter (pipe size) and 20 feet long. The bottom of the well screen<br />
should be placed <strong>at</strong> the bottom of the sand and gravel aquifer. The minimum bore<br />
hole diameter for this diameter of well screen is 24 inches. Well pump intakes<br />
should be set no lower than the top of the well screen in each production well.<br />
161
Mr. Gould/January 6, 1994/Page 2<br />
For the production well <strong>at</strong> the site of test boring 1 (proposed Production Well 2) our<br />
well design criteria indic<strong>at</strong>e the ideal gravel pack would be about 1.8 mm to 3.0 mm<br />
in grain size. If m<strong>at</strong>erial from Northern Gravel Company, Musc<strong>at</strong>ine, IA, is used,<br />
their No. 2 well pack m<strong>at</strong>erial is about 1.7 to 3.0 mm and would be s<strong>at</strong>isfactory for<br />
use. A continuous slot well screen with 0.080-inch slots (80 slot) can be used with<br />
this No. 2 gravel pack m<strong>at</strong>erial. Based on the driller's log of this test boring, the<br />
well screen would be placed between depths of 44 and 64 feet.<br />
For the production well <strong>at</strong> the site of test boring 2 (proposed Production Well 3) our<br />
well design criteria indic<strong>at</strong>e the ideal gravel pack would be about 2.6 mm to 4.2 mm<br />
in grain size. If m<strong>at</strong>erial from Northern Gravel Company is used, their No. 3 well<br />
pack m<strong>at</strong>erial is about 2.2 to 4.2 mm and would be s<strong>at</strong>isfactory for use. A<br />
continuous slot well screen with 0.100-inch slots (100 slot) can be used with this No.<br />
3 gravel pack m<strong>at</strong>erial. Based on the driller's log of this test boring, the well screen<br />
would be placed between depths of 43½ and 63½ feet.<br />
For the production wells <strong>at</strong> the sites of test borings 3 and 4 (proposed Production<br />
Wells 4 and 5) our well design criteria indic<strong>at</strong>e the ideal gravel pack would be about<br />
6.6 mm to 11.5 mm in grain size. If m<strong>at</strong>erial from Northern Gravel Company is<br />
used, their ¼ × ⅛-inch well pack m<strong>at</strong>erial is about 3.4 to 6.3 mm and would be<br />
s<strong>at</strong>isfactory for use. A continuous slot well screen with 0.150-inch slots (150 slot)<br />
can be used with this ¼ × ⅛-inch gravel pack m<strong>at</strong>erial. Based on the driller's log of<br />
these test borings, the well screen would be placed between depths of 40 and 60 feet.<br />
Please contact us if you have any questions about these suggestions for the design of<br />
the production wells for <strong>Mount</strong> <strong>Carmel</strong>.<br />
Very truly yours,<br />
Ellis W. Sanderson, P.E.<br />
Senior Engineer<br />
Office of <strong>Ground</strong>-W<strong>at</strong>er Resources<br />
Evalu<strong>at</strong>ion and Management<br />
Phone: (217) 333-0235<br />
cc:<br />
Mark Bader, City Administr<strong>at</strong>or, <strong>Mount</strong> <strong>Carmel</strong><br />
IEPA (2)<br />
162
Appendix I.<br />
Chemical Analyses of W<strong>at</strong>er Samples
<strong>Illinois</strong> St<strong>at</strong>e W<strong>at</strong>er Survey<br />
WATER SAMPLE DATA<br />
LABORATORY SAMPLE NUMBER: 226303<br />
SOURCE: TEST WELL NO. 2<br />
OWNER: CITY OF MOUNT CARMEL<br />
LOCATION: SOUTH OF MOUNT CARMEL<br />
COUNTY: WABASH TOWNSHIP: 1S RANGE: 12W SECTION: 32.2H<br />
DATE COLLECTED: 10/23/92 DATE RECEIVED: 11/04/92<br />
WELL DEPTH (Ft.): 68 TEMPERATURE REPORTED (F): 56<br />
TREATMENT:<br />
COMMENTS:<br />
NONE<br />
SAMPLE COLLECTED AFTER PUMPING AT 935 GPM FOR 22 HOURS.<br />
Chemistry Division<br />
2204 Griffith Drive<br />
<strong>Champaign</strong>, <strong>Illinois</strong> 61820-7495<br />
Telephone (217) 333-9321<br />
Telefax (217) 333-6540<br />
PARAMETER:<br />
mg/L<br />
PARAMETER:<br />
mg/L<br />
Iron (Total Fe): 0.42<br />
Manganese (Mn): 0.15<br />
Calcium (Ca): 84.7<br />
Magnesium (Mg): 24.3<br />
Sodium (Na): 9.5<br />
Barium (Ba): 0.03<br />
Copper (Cu):
<strong>Illinois</strong> St<strong>at</strong>e W<strong>at</strong>er Survey<br />
WATER SAMPLE DATA<br />
LABORATORY SAMPLE NUMBER: 226335<br />
SOURCE: TEST WELL NO. 2<br />
OWNER: CITY OF MOUNT CARMEL<br />
LOCATION: SOUTH OF MT. CARMEL<br />
COUNTY: WABASH TOWNSHIP: 1S RANGE: 12W SECTION: 32.2H<br />
DATE COLLECTED: 11/10/92 DATE RECEIVED: 11/17/92<br />
WELL DEPTH (Ft.): 68 TEMPERATURE REPORTED (F): 56<br />
TREATMENT: NONE<br />
COMMENTS: SAMPLE COLLECTED AFTER PUMPING AT 870 GPM FOR 19.4<br />
HOURS.<br />
Chemistry Division<br />
2204 Griffith Drive<br />
<strong>Champaign</strong>, <strong>Illinois</strong> 61820-7495<br />
Telephone (217) 333-9321<br />
Telefax (217) 333-6540<br />
PARAMETER:<br />
mg/L<br />
PARAMETER:<br />
mg/L<br />
Iron (Total Fe): 0.37<br />
Manganese (Mn): 0.14<br />
Calcium (Ca): 83.7<br />
Magnesium (Mg): 23.4<br />
Sodium (Na): 9.0<br />
Barium (Ba): 0.03<br />
Copper (Cu):
<strong>Illinois</strong> St<strong>at</strong>e W<strong>at</strong>er Survey<br />
WATER SAMPLE DATA<br />
LABORATORY SAMPLE NUMBER: 226334<br />
SOURCE: TEST WELL NO. 2<br />
OWNER: CITY OF MOUNT CARMEL<br />
LOCATION: SOUTH OF MT. CARMEL<br />
COUNTY: WABASH TOWNSHIP: 1S RANGE: 12W SECTION: 32.2H<br />
DATE COLLECTED: 11/16/92 DATE RECEIVED: 11/17/92<br />
WELL DEPTH (Ft.): 68 TEMPERATURE REPORTED (F): 57<br />
TREATMENT: NONE<br />
COMMENTS: SAMPLE COLLECTED AFTER PUMPING AT 870 GPM FOR 166.5<br />
HOURS.<br />
Chemistry Division<br />
2204 Griffith Drive<br />
<strong>Champaign</strong>, <strong>Illinois</strong> 61820-7495<br />
Telephone (217) 333-9321<br />
Telefax (217) 333-6540<br />
PARAMETER:<br />
mg/L<br />
PARAMETER:<br />
mg/L<br />
Iron (Total Fe): 0.32<br />
Manganese (Mn): 0.13<br />
Calcium (Ca): 82.2<br />
Magnesium (Mg): 22.7<br />
Sodium (Na): 9.9<br />
Barium (Ba): 0.03<br />
Copper (Cu):
<strong>Illinois</strong> St<strong>at</strong>e W<strong>at</strong>er Survey<br />
WATER SAMPLE DATA<br />
LABORATORY SAMPLE NUMBER: 226981<br />
SOURCE: TEST WELL NO. 2<br />
OWNER: CITY OF MT. CARMEL<br />
LOCATION: SOUTH OF MT. CARMEL<br />
COUNTY: WABASH TOWNSHIP: 1S RANGE: 12W SECTION: 32.2H<br />
DATE COLLECTED: 06/30/93 DATE RECEIVED: 07/27/93<br />
WELL DEPTH (Ft.): 68 TEMPERATURE REPORTED (F): 55<br />
TREATMENT: NONE<br />
COMMENTS:<br />
SAMPLE COLLECTED AT 3:00 PM AFTER PUMPING AT 895 GPM<br />
FOR 2.5 HOURS.<br />
Chemistry Division<br />
2204 Griffith Drive<br />
<strong>Champaign</strong>, <strong>Illinois</strong> 61820-7495<br />
Telephone (217) 333-9321<br />
Telefax (217) 333-6540<br />
PARAMETER:<br />
mg/L<br />
PARAMETER:<br />
mg/L<br />
Iron (Total Fe): 0.27<br />
Manganese (Mn): 0.15<br />
Calcium (Ca): 86.4<br />
Magnesium (Mg): 24.4<br />
Sodium (Na): 9.2<br />
Aluminum (Al): 0.02<br />
Barium (Ba): 0.03<br />
Copper (Cu):
<strong>Illinois</strong> St<strong>at</strong>e W<strong>at</strong>er Survey<br />
WATER SAMPLE DATA<br />
LABORATORY SAMPLE NUMBER: 226982<br />
SOURCE: TEST WELL NO. 2<br />
OWNER: CITY OF MT. CARMEL<br />
LOCATION: SOUTH OF MT. CARMEL<br />
COUNTY: WABASH TOWNSHIP: 1S RANGE: 12W SECTION: 32.2H<br />
DATE COLLECTED: 07/07/93 DATE RECEIVED: 07/27/93<br />
WELL DEPTH (Ft.): 68 TEMPERATURE REPORTED (F): 57.6<br />
TREATMENT:<br />
COMMENTS:<br />
NONE<br />
SAMPLE COLLECTED AT 11:45 AM AFTER PUMPING AT 895 GPM<br />
FOR 167 1/4 HOURS.<br />
Chemistry Division<br />
2204 Griffith Drive<br />
<strong>Champaign</strong>, <strong>Illinois</strong> 61820-7495<br />
Telephone (217) 333-9321<br />
Telefax (217) 333-6540<br />
PARAMETER:<br />
mg/L<br />
PARAMETER:<br />
mg/L<br />
Iron (Total Fe): 0.24<br />
Manganese (Mn): 0.13<br />
Calcium (Ca): 89.2<br />
Magnesium (Mg): 24.9<br />
Sodium (Na): 10.5<br />
Aluminuim (Al):
<strong>Illinois</strong> St<strong>at</strong>e W<strong>at</strong>er Survey<br />
WATER SAMPLE DATA<br />
LABORATORY SAMPLE NUMBER: 226983<br />
SOURCE: WABASH RIVER<br />
OWNER: ND<br />
LOCATION: SOUTH OF MT. CARMEL<br />
COUNTY: WABASH TOWNSHIP: ND RANGE: ND SECTION: ND<br />
DATE COLLECTED: 07/07/93 DATE RECEIVED: 07/27/93<br />
WELL DEPTH (Ft.): ND TEMPERATURE REPORTED (F): 79.5<br />
TREATMENT:<br />
COMMENTS:<br />
NONE<br />
SAMPLE COLLECTED AT 11:50 AM FROM WABASH RIVER AT TEST<br />
WELL NO. 2 SITE. TURBIDITY DUE TO OXIDIZED IRON,<br />
MANGANESE, AND S<strong>IL</strong>T/CLAY.<br />
Chemistry Division<br />
2204 Griffith Drive<br />
<strong>Champaign</strong>, <strong>Illinois</strong> 61820-7493<br />
Telephone (217) 333-9321*<br />
Telefax (217) 333-6540<br />
PARAMETER:<br />
mg/L<br />
PARAMETER:<br />
mg/L<br />
Iron (Total Fe): 9.62<br />
Manganese (Mn): 0.36<br />
Calcium (Ca): 57.8<br />
Magnesium (Mg): 18.2<br />
Sodium (Na): 7.2<br />
Aluminum (Al): 6.23<br />
Barium (Ba): 0.11<br />
Copper (Cu): 0.01<br />
Silicon (Si): 15.9<br />
Zinc (Zn): 0.03<br />
Turbidity (Lab): 218 NTU<br />
Color:<br />
23 PCU<br />
Odor:<br />
NONE<br />
pH (in Lab): 7.9<br />
Fluoride (F): 0.3<br />
Nitr<strong>at</strong>e (as N03-N): 24.3<br />
Chloride (Cl): 14.5<br />
Sulf<strong>at</strong>e (S04): 24.4<br />
Alkalinity (as CaC03): 128<br />
Hardness (as CaC03): 219<br />
Total Dissolved Minerals: 265<br />
< = Below detection limit (i.e.
Appendix J.<br />
Sieve D<strong>at</strong>a for Aquifer Samples from Test Well 2
Appendix J. Sieve D<strong>at</strong>a for Aquifer Samples from Test Well 2<br />
Drilled by Speth Plumbing, Inc.<br />
Drilled October, 1992<br />
Samples sieved by <strong>Illinois</strong> St<strong>at</strong>e Geological Survey<br />
Gravel Pack:<br />
**"Grit" 370.5 100.00 99.83 27.26 0.88 0.42<br />
Notes:<br />
* Combined with 50'-55'<br />
**From Rogers Group, Inc., Vincennes, IN<br />
Tested sample of "grit" was about 29.3 percent CaCO 3 .<br />
173
Appendix K.<br />
Driller's Logs of Test Borings <strong>at</strong> Production Well Sites
Appendix K. Driller's Logs of Test Borings <strong>at</strong> Production Well Sites<br />
Test Boring 1-93 for Production Well 2<br />
Drilled by Speth Plumbing, Inc.<br />
Drilled November 5, 1993<br />
Loc<strong>at</strong>ed approxim<strong>at</strong>ely 325 feet north-northeast of Test Well 2<br />
Form<strong>at</strong>ion From To<br />
(feet below land surface)<br />
Sandy clay 0 15<br />
Brown sand and gravel 15 18<br />
Clay 18 19<br />
Gray sand and gravel 19 64<br />
Gray shale 64 65<br />
Test Boring 2-93 for Production Well 3<br />
Drilled by Speth Plumbing, Inc.<br />
Drilled November 5, 1993<br />
Loc<strong>at</strong>ed approxim<strong>at</strong>ely 725 feet north-northeast of Test Well 2<br />
Form<strong>at</strong>ion From To<br />
(feet below land surface)<br />
Sandy clay 0 14<br />
Brown sand and gravel 14 19<br />
Gray sand and gravel 19 63.5<br />
Gray shale 63.5 64.5<br />
177
Appendix K. (Concluded)<br />
Test Boring 3-93 for Production Well 3<br />
Drilled by Speth Plumbing, Inc.<br />
Drilled November 8, 1993<br />
Loc<strong>at</strong>ed approxim<strong>at</strong>ely 1125 feet north-northeast of Test Well 2<br />
Form<strong>at</strong>ion From To<br />
(feet below land surface)<br />
Brown clay 0 20<br />
Brown sand and gravel 20 30<br />
Gray sand and gravel 30 60<br />
Gray shale 60 62<br />
Test Boring 4-93 for Production Well 5<br />
Drilled by Speth Plumbing, Inc.<br />
Drilled November 8, 1993<br />
Loc<strong>at</strong>ed approxim<strong>at</strong>ely 1525 feet north-northeast of Test Well 2<br />
Form<strong>at</strong>ion From To<br />
(feet below land surface)<br />
Sandy clay 0 21<br />
Brown sand and gravel 21 38<br />
Gray sand and gravel 38 60<br />
Gray shale 60 62<br />
178
Appendix L.<br />
Sieve D<strong>at</strong>a for Aquifer Samples Collected from Test Borings<br />
<strong>at</strong> Production Well Sites
Appendix L. Sieve D<strong>at</strong>a for Aquifer Samples from Test Borings<br />
<strong>at</strong> Production Well Sites<br />
Test Boring 1-93 for Production Well 2<br />
Drilled by Speth Plumbing, Inc.<br />
Drilled November 5,1993<br />
Samples sieved by Lamac Engineering, Inc.<br />
Test Boring 2-93 for Production Well 3<br />
Drilled by Speth Plumbing, Inc.<br />
Drilled November 5,1993<br />
Samples sieved by Lamac Engineering, Inc.<br />
181
Test Boring 3-93 for Production Well 4<br />
Drilled by Speth Plumbing, Inc.<br />
Drilled November 8, 1993<br />
Samples sieved by Lamac Engineering, Inc.<br />
Appendix L. (Concluded)<br />
Test Boring 4-93 for Production Well 5<br />
Drilled by Speth Plumbing, Inc.<br />
Drilled November 8, 1993<br />
Samples sieved by Lamac Engineering, Inc.<br />
182