Answer Key Sample 2 1) a) Histogram for Salary Histogram for Age ...
Answer Key Sample 2 1) a) Histogram for Salary Histogram for Age ...
Answer Key Sample 2 1) a) Histogram for Salary Histogram for Age ...
You also want an ePaper? Increase the reach of your titles
YUMPU automatically turns print PDFs into web optimized ePapers that Google loves.
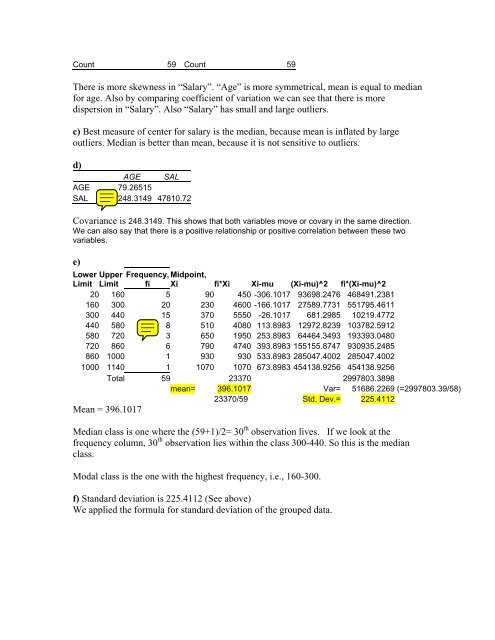
Count 59 Count 59<br />
There is more skewness in “<strong>Salary</strong>”. “<strong>Age</strong>” is more symmetrical, mean is equal to median<br />
<strong>for</strong> age. Also by comparing coefficient of variation we can see that there is more<br />
dispersion in “<strong>Salary</strong>”. Also “<strong>Salary</strong>” has small and large outliers.<br />
c) Best measure of center <strong>for</strong> salary is the median, because mean is inflated by large<br />
outliers. Median is better than mean, because it is not sensitive to outliers.<br />
d)<br />
AGE SAL<br />
AGE 79.26515<br />
SAL 248.3149 47810.72<br />
Covariance is 248.3149. This shows that both variables move or covary in the same direction.<br />
We can also say that there is a positive relationship or positive correlation between these two<br />
variables.<br />
e)<br />
Lower Upper Frequency, Midpoint,<br />
Limit Limit fi Xi fi*Xi Xi-mu (Xi-mu)^2 fi*(Xi-mu)^2<br />
20 160 5 90 450 -306.1017 93698.2476 468491.2381<br />
160 300 20 230 4600 -166.1017 27589.7731 551795.4611<br />
300 440 15 370 5550 -26.1017 681.2985 10219.4772<br />
440 580 8 510 4080 113.8983 12972.8239 103782.5912<br />
580 720 3 650 1950 253.8983 64464.3493 193393.0480<br />
720 860 6 790 4740 393.8983 155155.8747 930935.2485<br />
860 1000 1 930 930 533.8983 285047.4002 285047.4002<br />
1000 1140 1 1070 1070 673.8983 454138.9256 454138.9256<br />
Total 59 23370 2997803.3898<br />
mean= 396.1017 Var= 51686.2269 (=2997803.39/58)<br />
23370/59 Std. Dev.= 225.4112<br />
Mean = 396.1017<br />
Median class is one where the (59+1)/2= 30 th observation lives. If we look at the<br />
frequency column, 30 th observation lies within the class 300-440. So this is the median<br />
class.<br />
Modal class is the one with the highest frequency, i.e., 160-300.<br />
f) Standard deviation is 225.4112 (See above)<br />
We applied the <strong>for</strong>mula <strong>for</strong> standard deviation of the grouped data.


