An Irrigated Area Map of the World - International Water ...
An Irrigated Area Map of the World - International Water ...
An Irrigated Area Map of the World - International Water ...

Create successful ePaper yourself
Turn your PDF publications into a flip-book with our unique Google optimized e-Paper software.
RESEARCH<br />
REPORT<br />
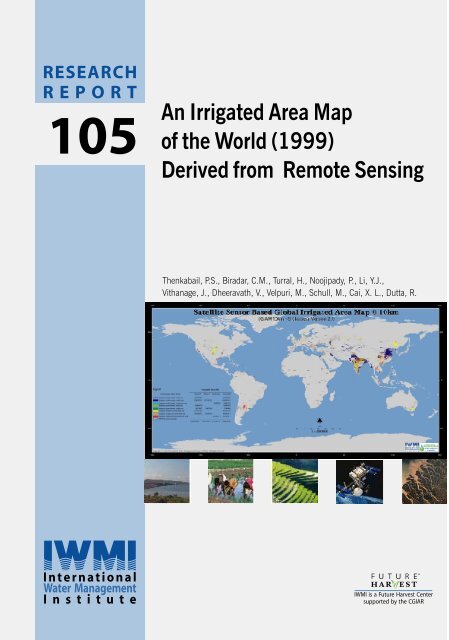
105<br />
<strong>An</strong> <strong>Irrigated</strong> <strong>Area</strong> <strong>Map</strong><br />
<strong>of</strong> <strong>the</strong> <strong>World</strong> (1999)<br />
Derived from Remote Sensing<br />
Thenkabail, P.S., Biradar, C.M., Turral, H., Noojipady, P., Li, Y.J.,<br />
Vithanage, J., Dheeravath, V., Velpuri, M., Schull, M., Cai, X. L., Dutta, R.<br />
<strong>International</strong><br />
<strong>Water</strong> Management<br />
Institute<br />
IWMI is a Future Harvest Center<br />
supported by <strong>the</strong> CGIAR
Research Reports<br />
IWMI’s mission is to improve water and land resources management for food,<br />
livelihoods and nature. In serving this mission, IWMI concentrates on <strong>the</strong> integration<br />
<strong>of</strong> policies, technologies and management systems to achieve workable solutions<br />
to real problems—practical, relevant results in <strong>the</strong> field <strong>of</strong> irrigation and water and<br />
land resources.<br />
The publications in this series cover a wide range <strong>of</strong> subjects—from computer<br />
modeling to experience with water user associations—and vary in content from<br />
directly applicable research to more basic studies, on which applied work ultimately<br />
depends. Some research reports are narrowly focused, analytical and detailed<br />
empirical studies; o<strong>the</strong>rs are wide-ranging and syn<strong>the</strong>tic overviews <strong>of</strong> generic<br />
problems.<br />
Although most <strong>of</strong> <strong>the</strong> reports are published by IWMI staff and <strong>the</strong>ir collaborators,<br />
we welcome contributions from o<strong>the</strong>rs. Each report is reviewed internally by IWMI’s<br />
own staff and Fellows, and by external reviewers. The reports are published and<br />
distributed both in hard copy and electronically (www.iwmi.org) and where possible<br />
all data and analyses will be available as separate downloadable files. Reports may<br />
be copied freely and cited with due acknowledgment.
Research Report 105<br />
<strong>An</strong> <strong>Irrigated</strong> <strong>Area</strong> <strong>Map</strong> <strong>of</strong> <strong>the</strong> <strong>World</strong> (1999)<br />
Derived from Remote Sensing<br />
Thenkabail, P. S., Biradar, C. M., Turral, H., Noojipady, P.,<br />
Li, Y. J., Vithanage, J., Dheeravath, V., Velpuri, M., Schull,<br />
M., Cai, X. L., Dutta, R.<br />
<strong>International</strong> <strong>Water</strong> Management Institute<br />
P O Box 2075, Colombo, Sri Lanka<br />
i
IWMI receives its principal funding from 58 governments, private foundations, and<br />
international and regional organizations known as <strong>the</strong> Consultative Group on<br />
<strong>International</strong> Agricultural Research (CGIAR). Support is also given by <strong>the</strong> Governments<br />
<strong>of</strong> Ghana, Pakistan, South Africa, Sri Lanka and Thailand.<br />
Authors: Prasad S. Thenkabail is a Principal Researcher and Head, Global Research Division;<br />
Chandrashekhar M. Biradar is a PostDoc scientist; Hugh Turral is a Principal Researcher and<br />
Theme Leader; Praveen Noojipady, Yuanjie Li, Jagath Vithanage, Venkateswarlu Dheeravath<br />
and Manohar Velpuri are Research Officers; Cai Xueliang and Rishiraj Dutta are Consultants<br />
from Partner Institutes in China and India, respectively. All authors, except Schull who is from<br />
<strong>the</strong> Boston University, USA, are attached to <strong>the</strong> <strong>International</strong> <strong>Water</strong> Management Institute<br />
A Global <strong>Irrigated</strong> <strong>Area</strong> <strong>Map</strong>ping (GIAM) project <strong>of</strong> this magnitude and complexity can never be<br />
done without substantial and persistent support from many places.<br />
We are very grateful to Pr<strong>of</strong>. Frank Rijsberman, Director General <strong>of</strong> IWMI, for his vision, guidance<br />
and financial support; Dr. David Molden, Principal Researcher at IWMI, was instrumental in<br />
initial funding and guiding GIAM through <strong>the</strong> Comprehensive Assessment (CA). Dr. Sarath<br />
Abayawardana, former Global Research Director (GRD), was instrumental in laying a strong<br />
foundation for <strong>the</strong> RS\GIS laboratory at IWMI and Julie Van der Bliek, <strong>the</strong> present GRD head,<br />
has continued this support and has steered us towards a spatial data policy at IWMI. All<br />
researchers and analysts in <strong>the</strong> RS\GIS unit have helped in one way or ano<strong>the</strong>r; we thank<br />
Aminul Islam for compiling <strong>the</strong> excellent groundtruth data <strong>of</strong> <strong>the</strong> world and <strong>the</strong> rainfall data;<br />
Wasantha Kulawardana for support when needed; Sarath Gunasinge, and Alankara Ranjith<br />
are always <strong>the</strong>re with quiet but strong support in producing maps and flow charts. Jacintha<br />
Navaratne provided outstanding secretarial services, most cheerfully.<br />
IWMI India <strong>of</strong>fice was especially helpful. Thanks to Trent Biggs, Muralikrishna and Parthasarathi.<br />
We would like to thank <strong>the</strong> Food and Agriculture Organization (FAO)/University <strong>of</strong> Frankfurt (UF)<br />
for lively discussions on <strong>the</strong> two Global <strong>Irrigated</strong> <strong>Area</strong> <strong>Map</strong>s (FAO/UF and IWMI). Specifically, we<br />
would like to thank Stefan Siebert and Jippe Hoogeveen.<br />
The NASA Goddard Space Flight Center (GSFC) made available <strong>the</strong> AVHRR time series used<br />
in this work. Special thanks to Dr. Ron Smith and his group. The Landsat data were downloaded<br />
from <strong>the</strong> University <strong>of</strong> Maryland’s Global Land Cover Facility (GLCF). Several data sets such as<br />
<strong>the</strong> GTOPO30 1-km and SRTM 90 meter elevation data were downloaded from <strong>the</strong> USGS\EROS.<br />
The forest cover data were sourced from Dr. Ruth DeFries <strong>of</strong> <strong>the</strong> University <strong>of</strong> Maryland. Rainfall<br />
data were provided by Dr. Tim Mitchell <strong>of</strong> East <strong>An</strong>glica Climate Research Group and <strong>the</strong> JERS<br />
SAR data from Saatchi and <strong>the</strong> group. The volunteer groundtruth data from degree confluence<br />
project were invaluable. The Google Earth data are state <strong>of</strong> <strong>the</strong> art and were widely used.<br />
Without <strong>the</strong>se great data sets, made available free <strong>of</strong> charge, <strong>the</strong> project would not have been<br />
completed. So we are very grateful to <strong>the</strong>se agencies and <strong>the</strong> numerous people behind <strong>the</strong>m.<br />
Thenkabail, P. S.; Biradar, C. M.; Turral, H.; Noojipady, P.; Li, Y. J.; Vithanage, J.; Dheeravath, V.;<br />
Velpuri, M.; Schull, M.; Cai, X. L.; Dutta, R. 2006. <strong>An</strong> irrigated area map <strong>of</strong> <strong>the</strong> world (1999)<br />
derived from remote sensing. Research Report 105. Colombo, Sri Lanka: <strong>International</strong> <strong>Water</strong><br />
Management Institute.<br />
/remote sensing / mapping / irrigated sites / estimation / GIS / assessment/<br />
ISBN 92-9090-646-4<br />
ISBN 978-92-9090-646-9<br />
Copyright © 2006, by IWMI. All rights reserved.<br />
Please send inquiries and comments to: iwmi@cgiar.org
Contents<br />
1 Summary ix<br />
2 Introduction 1<br />
3 Background and rationale 2<br />
3.1 Irrigation development and trends 2<br />
3.2 Estimates <strong>of</strong> irrigated area 3<br />
4. Data used in creating IWMI’s global irrigated area map 5<br />
4.1 Primary remote sensing data sets and masks 7<br />
4.1.1 AVHRR data characteristics 7<br />
4.1.2 SPOT data characteristics 7<br />
4.1.3 Mask data 7<br />
4.1.4 GTOPO 30 1-km DEM 7<br />
4.1.5 CRU precipitation and temperature data 9<br />
4.1.6 Forest cover data 9<br />
4.2 Secondary data sets 9<br />
4.2.1 JERS-1 SAR derived forest cover 9<br />
4.2.2 ESRI Landsat 150-m GeoCover 9<br />
4.2.3 Google Earth data set 9<br />
4.2.4 Groundtruth data 10<br />
4.2.5 Groundtruth at IWMI: Data collected in field campaigns 10<br />
4.2.6 Public domain groundtruth – <strong>the</strong> Degree Confluence Project 10<br />
4.3 O<strong>the</strong>r data sets for comparison purposes 10<br />
5 Methods 11<br />
5.1 Image segmentation 11<br />
iii<br />
iii
5.1.1 Mega-file <strong>of</strong> segments 11<br />
5.2 Classification 11<br />
5.3 Class identification and naming process 11<br />
5.3.1 Spectral matching techniques 14<br />
5.3.2 Qualitativespectral matching 15<br />
5.3.3 Quantitative spectral matching 15<br />
5.4 Google Earth as a resource for class naming 17<br />
5.5 Advanced techniques for class identification 17<br />
5.6 Class-naming convention 18<br />
6 Estimating irrigated areas using three methods 20<br />
6.1 <strong>Irrigated</strong> area fraction (IAF) based on Google Earth estimates 21<br />
6.2 SPA <strong>of</strong> pixels based on high-resolution imagery 21<br />
6.2.1 Classification approach 24<br />
6.2.2 Regression relationships 24<br />
6.2.3 <strong>Irrigated</strong> area fraction coefficient 24<br />
6.3 Sub-pixel decomposition technique 24<br />
7 Accuracy assessment 26<br />
7.1 Groundtruth data sets from <strong>the</strong> Global <strong>Irrigated</strong> <strong>Area</strong><br />
<strong>Map</strong>ping Project 26<br />
7.2 O<strong>the</strong>r goundtruth 26<br />
7.3 Google Earth estimates 26<br />
8 Results 27<br />
8.1 Global irrigated area map version 2.0 (GIAM10 km V2.0) 27<br />
8.2 <strong>Area</strong>s <strong>of</strong> irrigation derived from GIAM10 km map V2.0 27<br />
8.3 <strong>Irrigated</strong> areas <strong>of</strong> continents, countries and river basins 30<br />
8.4 Accuracy assessment <strong>of</strong> <strong>the</strong> GIAM10 km map V2.0<br />
and its comparison 36<br />
8.4.1 Accuracies and errors <strong>of</strong> GIAM10 km map V2.0<br />
using groundtruth 36<br />
8.4.2 Accuracies and errors using Google Earth<br />
groundtruth (GEGT) data for <strong>the</strong> world 36<br />
8.4.3 Accuracies and errors for India in GIAM10 km V2.0 39<br />
8.5 Accuracy assessment discussions 39<br />
8.6 Accuracies and areas 40<br />
iv<br />
iv
9. A discussion on mapping irrigated areas and comparison <strong>of</strong> maps 41<br />
9.1 Major irrigation 41<br />
9.2 Informal irrigation 42<br />
9.3 Comparing global products in India 45<br />
9.4 <strong>Irrigated</strong> area class names 46<br />
10 GIAM10 km V2.0 products and dissemination 49<br />
11 Conclusions 50<br />
12 <strong>An</strong>nexes 53<br />
13 Acronyms and abbreviations 60<br />
14 Literature Cited 62<br />
v<br />
v
Figures<br />
vi<br />
Figure 1. Processing chain for <strong>the</strong> global irrigated area map (GIAM). 6<br />
Figure 2. Mega-file used in GIAM. The mega-file <strong>of</strong> 159 layers <strong>of</strong> data which<br />
consist <strong>of</strong> 144 AVHRR 10-km monthly layers from 3 years, 12 SPOT<br />
monthly layers from year 1999, single layer <strong>of</strong> DEM, mean annual rainfall<br />
for 40 years, and forest cover. 6<br />
Figure 3. Primary and secondary data sets used in <strong>the</strong> mega-file. 7<br />
Figure 4a. Summary <strong>of</strong> analysis to determine irrigation land use classes (part 1). 12<br />
Figure 4b. Summary <strong>of</strong> analysis to determine irrigation land use classes (part 2). 13<br />
Figure 5. Precipitation less than 360 mm segment (PLT360-segment). These arid<br />
or semiarid areas provide distinct contrasts between areas with and<br />
without vegetation. 14<br />
Figure 6a. Time-series AVHRR 10-km pr<strong>of</strong>ile <strong>of</strong> spectral classes is illustrated for <strong>the</strong><br />
AOAW-segment. Initially, <strong>the</strong> AOAW-segment had 350 classes. The plot<br />
<strong>of</strong> some <strong>of</strong> <strong>the</strong>se classes highlights <strong>the</strong> spectral characteristics <strong>of</strong> each<br />
class. A quantitative approach to determine which <strong>of</strong> <strong>the</strong>se classes<br />
match is performed through SCS R 2 (e.g., table 4). 15<br />
Figure 6b. Identifying similar irrigated classes using spectral matching. Spectral<br />
matching in combination with ground truthing and ideal spectra helps group<br />
similar irrigated (shown in dark green, for classes 25, 26, and 27). The<br />
same logic was used to group: forests (sown in light green; class numbers<br />
1, 2, 3, 4 and 5), Savanna/Croplands mix (Orange; class 50, 59, 60, 67,<br />
74), and Barren/Deserts (shown in blue; classes 10 to 15). 16<br />
Figure 7. The process <strong>of</strong> combining classes in spectral matching techniques<br />
(SMTs) is illustrated. First, <strong>the</strong> SCS R 2 -values are determined for a<br />
matrix <strong>of</strong> classes. The time-series spectra <strong>of</strong> classes with high SCS R 2 -<br />
values are <strong>the</strong>n matched. Grouped classes are investigated fur<strong>the</strong>r, using<br />
all o<strong>the</strong>r types <strong>of</strong> information including groundtruth. This leads to distinct<br />
groups such as boreal forests and tropical forests. Finally, <strong>the</strong> classes <strong>of</strong><br />
similar types are color-coded. 16<br />
Figure 8. Google Earth “zoom in” views to identify a class. One preliminary class<br />
is spread out across <strong>the</strong> world. The class was investigated using 50<br />
Google sample points that were randomly chosen. The figure shows <strong>the</strong><br />
spread <strong>of</strong> <strong>the</strong> class across <strong>the</strong> world and Google Earth hi-res image at<br />
two locations: Center pivot groundwater irrigation in <strong>the</strong> USA and surface<br />
irrigation in Sudan. 17<br />
Figure 9. Class naming convention. The standardized class naming convention is<br />
depicted in this figure. At different levels, <strong>the</strong> class naming may or may not<br />
include a particular category such as scale <strong>of</strong> irrigation or <strong>the</strong> intensity. 19<br />
Figure 10. Summary <strong>of</strong> area abstraction from <strong>the</strong> 28 irrigation class map. 20<br />
Figure 11. <strong>Irrigated</strong> area by Google Earth estimate (GEE). For each GIAM10 km-28<br />
classes GEE <strong>of</strong> irrigated area fraction (IAF) were estimated using Google<br />
Earth images. Thirty points were taken for each class and averaged. The<br />
vi
fraction calculation for one class is illustrated. 21<br />
Figure 12. <strong>Irrigated</strong> area fraction from high-resolution imagery (IAF-HRI). For each <strong>of</strong><br />
<strong>the</strong> GIAM10 km-28 classes <strong>the</strong> IAF-HRI were estimated by masking<br />
Landsat images for <strong>the</strong> area occupied by <strong>the</strong> class and <strong>the</strong>n determining<br />
irrigated vs. nonirrigated areas. 22<br />
Figure 13. Sub-pixel decomposition technique (SP-DCT). 22<br />
Figure 14. Relationship between percent irrigated area <strong>of</strong> class 1-20 and <strong>the</strong> AVHRR<br />
NDVI computed using band 1 max<br />
and AVHRR band 2 max<br />
reflectivity. 25<br />
Figure 15. GIAM10 km V2.0 28 class map. 28<br />
Figure 16. GIAM10 km V2.0 8 class map. 29<br />
Figure 17. Trends in irrigated area since 1800. The IWMI estimate (http://<br />
www.iwmigmia.org) at <strong>the</strong> end <strong>of</strong> <strong>the</strong> last millennium considered not only<br />
area irrigated but also <strong>the</strong> intensity (i.e., area irrigated during different<br />
seasons in a 12-month period and informal irrigation (e.g., groundwater,<br />
tanks). This gives an estimate <strong>of</strong> 263 million hectares (Mha) during <strong>the</strong><br />
“main” cropping season (season 1) and a total <strong>of</strong> 480 Mha for three<br />
seasons: first crop (263 Mha), second crop (176 Mha), and continuous<br />
crop (41 Mha). 30<br />
Figure 18. Evaluation <strong>of</strong> <strong>the</strong> GIAM for large-scale, small-scale, informal and supplemental<br />
irrigation. The IWMI GIAM and India’s Central Board <strong>of</strong> Irrigation<br />
and Power (CBIP) irrigated area maps are evaluated for: a) large-scale<br />
irrigation- (figures 18a,b); b) informal irrigation such as groundwater and<br />
tanks (figures 18 c,d); and c) small-scale (e.g., minor reservoirs) irrigation<br />
(figures 18e,f). 41<br />
Figure 19<br />
(a, b and c). Comparison <strong>of</strong> <strong>the</strong> two global irrigated area maps: GIAM10 km V2.0 and<br />
FAO/FU V3.0. 45<br />
Figure 20. Single crop (red) and double crop (cyan) irrigation in <strong>the</strong> lower Ganges. 46<br />
Figure 21. Double crop (left) and single crop (right) irrigation in Zayandeh and Rud. 47<br />
Figure 22. Evaluation <strong>of</strong> GIAM for conjunctive irrigation. The rain-fed class with<br />
significant central pivot supplemental irrigation in <strong>the</strong> Pampas in<br />
Argentina. 48<br />
vii<br />
vii
Tables<br />
Table 1. Characteristics <strong>of</strong> <strong>the</strong> satellite sensor and secondary data sets used in<br />
mapping global irrigated areas. These data sets were compiled into a<br />
159-band layer stack. 8<br />
Table 2. O<strong>the</strong>r data used in conjunction with <strong>the</strong> mega-file. 8<br />
Table 3. Characteristics <strong>of</strong> irrigated areas. Intensity and cropping calendar for <strong>the</strong><br />
GIAM classes in India. 23<br />
Table 4a. <strong>Irrigated</strong> areas <strong>of</strong> <strong>the</strong> world from <strong>the</strong> GIAM10 km-28 classes V2.0 map<br />
using IAF from HRI and SPDT. The irrigated areas <strong>of</strong> <strong>the</strong> world are<br />
calculated from <strong>the</strong> GIAM10 km V2.0 map based on <strong>the</strong> cropping intensity.<br />
Details <strong>of</strong> <strong>the</strong> class-wise irrigated area are shown for GIAM10 km-28<br />
classes. 31<br />
Table 4b. <strong>Irrigated</strong> areas <strong>of</strong> <strong>the</strong> world from <strong>the</strong> GIAM10 km-8 classes V2.0 map<br />
using IAF from HRI and SPDT. The irrigated areas <strong>of</strong> <strong>the</strong> world are<br />
calculated from <strong>the</strong> GIAM10 km V2.0 map based on <strong>the</strong> cropping intensity.<br />
Details <strong>of</strong> <strong>the</strong> class-wise irrigated area are shown for GIAM10 km-28<br />
classes. 32<br />
Table 5a. <strong>Irrigated</strong> areas <strong>of</strong> <strong>the</strong> continents. The GIAM10 km continental areas are<br />
compared with <strong>the</strong> FAO Aquastat and <strong>the</strong> national statistics. 33<br />
Table 5b. <strong>Irrigated</strong> areas <strong>of</strong> <strong>the</strong> countries. The GIAM10 km country areas are<br />
compared with <strong>the</strong> FAO Aquastat and <strong>the</strong> national statistics. 34<br />
Table 5c. <strong>Irrigated</strong> areas <strong>of</strong> <strong>the</strong> river basins. The GIAM10 km river basin areas are<br />
compared with <strong>the</strong> FAO Aquastat and <strong>the</strong> national statistics. 35<br />
Table 6a. Accuracy assessment <strong>of</strong> IWMI GIAM V2.0 Vs. FAO/FU V3.0 vs. CBIP<br />
using groundtruth data. The IWMI global irrigated area map (GIAM) is<br />
compared with <strong>the</strong> a) global irrigated area map <strong>of</strong> <strong>the</strong> FAO/Frankfurt<br />
University and b) <strong>the</strong> irrigated area map <strong>of</strong> India’s CBIP. 37<br />
Table 6b. Accuracy assessment <strong>of</strong> IWMI GIAM V2.0 Vs. FAO/FU V3.0 vs.<br />
CBIP using Google Earth groundtruth (GEGT). The IWMI global<br />
irrigated area map (GIAM) is compared with <strong>the</strong> a) global irrigated area<br />
map <strong>of</strong> <strong>the</strong> FAO/Frankfurt University and b) <strong>the</strong> irrigated area map <strong>of</strong><br />
India’s CBIP. 38<br />
viii
Summary<br />
It is necessary to accurately quantify <strong>the</strong> area and intensity <strong>of</strong> irrigation in <strong>the</strong> world in order to properly<br />
understand its contribution to food production and security, and to estimate its water use, as competition<br />
for water increases with rising urban and industrial needs and <strong>the</strong> recognition <strong>of</strong> environmental water<br />
requirements. Satellite remote sensing <strong>of</strong>fers a relatively cheap, repeatable and accurate technology to<br />
estimate and monitor irrigated areas.<br />
This research report presents <strong>the</strong> results <strong>of</strong> a global analysis <strong>of</strong> multi-temporal time series at<br />
nominal 10 kilometer pixel resolution. Statistics <strong>of</strong> irrigation at country level are derived from <strong>the</strong>se<br />
maps for different seasons and for <strong>the</strong> entire year (annualized) for <strong>the</strong> nominal year <strong>of</strong> 1999. Three<br />
methods <strong>of</strong> area abstraction are used and compared, and three methods <strong>of</strong> accuracy assessment are<br />
applied. The annualized irrigated areas <strong>of</strong> <strong>the</strong> world at <strong>the</strong> end <strong>of</strong> <strong>the</strong> last millennium were about 480<br />
Mha <strong>of</strong> which <strong>the</strong>re were 263 Mha for season 1, 176 Mha for season 2, and 41 Mha for continuous<br />
cropping. Of this, Asia alone accounts for 78 percent (375 Mha) with 59 percent from China and India.<br />
The country statistics are compared with FAO country-level statistics (see <strong>An</strong>nex I). The IWMI GIAM<br />
10 km V2.0 map were tested based on 3 sources <strong>of</strong> independent data resulting in accuracies between<br />
84 and 91 percent with errors <strong>of</strong> omission not exceeding 16 percent and errors <strong>of</strong> commission less than<br />
21 percent. The total area available for irrigation (TAAI; <strong>the</strong> nearest equivalent to FAO’s equipped area)<br />
was 412 Mha.<br />
The global irrigated area mapping (GIAM) products (e.g., maps, statistics, web maps) are made<br />
available through a dedicated web portal (http://www.iwmigiam.org). The detailed methodology is also<br />
made available through <strong>the</strong> web portal. The focus <strong>of</strong> this research report is on <strong>the</strong> results <strong>of</strong> <strong>the</strong> GIAM<br />
mapping effort.<br />
ix
<strong>An</strong> <strong>Irrigated</strong> <strong>Area</strong> <strong>Map</strong> <strong>of</strong> <strong>the</strong> <strong>World</strong> (1999)<br />
Derived from Remote Sensing<br />
Thenkabail, P. S., Biradar, C. M., Turral, H., Noojipady, P., Li, Y. J., Vithanage, J.,<br />
Dheeravath, V., Velpuri, M., Schull, M., Cai, X. L., Dutta, R.<br />
Introduction<br />
This document summarizes <strong>the</strong> materials and<br />
methods used to create a series <strong>of</strong> maps <strong>of</strong><br />
irrigated areas <strong>of</strong> <strong>the</strong> world using remote sensing<br />
approaches. These maps are complementary to<br />
existing statistics (FAO-Aquastat) and <strong>the</strong> GISderived<br />
maps (FAO/University <strong>of</strong> Frankfurt Global<br />
irrigated area map). The document also provides<br />
details <strong>of</strong> how <strong>the</strong> estimates <strong>of</strong> global irrigated<br />
areas in one main season (net) and more than<br />
one season (intensity or annualized) were derived.<br />
The major products were a) 28 class irrigated<br />
area map (GIAM10 km-28 class) comprising<br />
watering method (in this case irrigated), irrigation<br />
type (surface water, groundwater, and conjunctive<br />
use), irrigation intensity (single, double, or<br />
continuous crop) and crop type; b) 8 class<br />
irrigated area map (GIAM10 km-8 class)<br />
comprising watering method, irrigation type and<br />
intensity; and c) 3 class irrigated area map<br />
(GIAM10 km-3 class) comprising surface water,<br />
groundwater, and conjunctive use irrigation. The<br />
estimation <strong>of</strong> seasonal global irrigated areas is<br />
based on <strong>the</strong>se products. The simpler GIAM10<br />
km-8 class and GIAM10 km-3 class maps have<br />
more “practitioner-friendly” classes and are<br />
produced, to allow easier visualization.<br />
The products <strong>of</strong> <strong>the</strong> GIAM10 km-28 class,<br />
GIAM10 km-8 class, and GIAM10 km-3 class are<br />
derived from a generic land use and land cover<br />
(LULC) map <strong>of</strong> <strong>the</strong> world that has 951 classes; a<br />
considerable part <strong>of</strong> <strong>the</strong> methodology is<br />
concerned with <strong>the</strong> development <strong>of</strong> this map and<br />
subsequent definition, naming and aggregation <strong>of</strong><br />
<strong>the</strong>se classes. The work had <strong>the</strong> explicit<br />
intention, as far as possible, to take account <strong>of</strong><br />
<strong>the</strong> effect <strong>of</strong> cropping intensity or irrigated areas<br />
from different seasons within a given year. Timeseries<br />
analysis <strong>of</strong> remote sensing allows <strong>the</strong><br />
basic developmental phenology <strong>of</strong> different crops<br />
to be identified, and <strong>the</strong> number <strong>of</strong> crop seasons<br />
in one year can be determined on aggregate for<br />
any pixel. In this study, we have used multiple<br />
types <strong>of</strong> imagery and masking data at different<br />
scales.<br />
Although <strong>the</strong> analysis has been conducted at<br />
a nominal scale <strong>of</strong> 1-km per pixel, <strong>the</strong> major<br />
source <strong>of</strong> data has been a 20-year time series <strong>of</strong><br />
10-km AVHRR data. This has necessitated <strong>the</strong><br />
use <strong>of</strong> a classical LULC classification approach<br />
that defines LULC classes as a mix <strong>of</strong> land cover<br />
types. Therefore, sub-pixel disaggregation <strong>of</strong> <strong>the</strong><br />
component irrigation areas becomes a major<br />
objective in trying to accurately assess actual<br />
area.<br />
The same processes and data were used to<br />
produce <strong>the</strong> following products:<br />
• Disaggregated 323 class Global <strong>Irrigated</strong> <strong>Area</strong><br />
<strong>Map</strong> (GIAM10 km-323 classes);<br />
• Disaggregated 229 class Global <strong>Map</strong> <strong>of</strong> Rainfed<br />
Cropped <strong>Area</strong>s (GMRCA229);<br />
• Aggregated 22 class map <strong>of</strong> Global <strong>Map</strong> <strong>of</strong><br />
Rain-fed Cropped <strong>Area</strong>s (GMRCA22);<br />
• Disaggregated 76 class Global <strong>Map</strong> <strong>of</strong> LULC<br />
<strong>Area</strong>s (GMLULCA76);<br />
• Aggregated 10 class Global <strong>Map</strong> <strong>of</strong> LULC<br />
<strong>Area</strong>s (GMLULCA10).<br />
1
The work has produced o<strong>the</strong>r significant byproducts<br />
which, along with <strong>the</strong> main maps, are<br />
available via a dedicated website: http://<br />
www.iwmigiam.org<br />
The website includes maps, images, class<br />
characteristics, sub-pixel area (SPA) estimation<br />
approaches, digital photos, groundtruth data,<br />
animations <strong>of</strong> time series and accuracy<br />
assessments. All <strong>the</strong> background documentations<br />
are also provided.<br />
The website contains a daunting amount<br />
<strong>of</strong> information and data, with substantial<br />
improvements and refinements in <strong>the</strong><br />
presently published version 2.0. Aside from<br />
<strong>the</strong> production <strong>of</strong> <strong>the</strong> maps and estimation <strong>of</strong><br />
<strong>the</strong> irrigated areas, <strong>the</strong> intention <strong>of</strong> this work<br />
is to:<br />
• provide repeatable and robust methods and<br />
techniques <strong>of</strong> analysis <strong>of</strong> irrigated areas<br />
• encourage practitioners and researchers with<br />
better local knowledge to improve <strong>the</strong><br />
definition and detail in <strong>the</strong>ir localities and<br />
contribute to fur<strong>the</strong>r refinement <strong>of</strong> <strong>the</strong> map<br />
This report continues with a brief background<br />
(section 3 1 ) to past efforts to assess irrigated areas<br />
and <strong>the</strong> rationale for developing new approaches<br />
using remote sensing at a global scale. In section 4<br />
and its subsections, we present <strong>the</strong> basic remote<br />
sensing and o<strong>the</strong>r data used to produce <strong>the</strong> maps.<br />
In section 5 and its subsections, we provide details<br />
<strong>of</strong> <strong>the</strong> analytical methods applied to define and<br />
refine <strong>the</strong> classes. This is followed by section 6 on<br />
class aggregation and section 7 on area<br />
calculations and sub-pixel decomposition techniques<br />
(SP-DCT). The rest are accuracies in section 8,<br />
results and discussions in sections 9 and 10, class<br />
naming convention in section 11, products in<br />
section 12 and conclusions in section 13.<br />
Background and Rationale<br />
Irrigation Development and Trends<br />
Following <strong>the</strong> end <strong>of</strong> <strong>the</strong> Second <strong>World</strong> War, and<br />
a period <strong>of</strong> decolonization, <strong>the</strong>re was a boom in<br />
irrigation development which coincided with<br />
strongly motivated nation building, particularly in<br />
Asia. <strong>Irrigated</strong> area increased at about 2.6<br />
percent per annum from a modest 95 million<br />
hectares (Mha) in <strong>the</strong> early 1940s to between 250<br />
and 280 Mha in <strong>the</strong> early 1990s (van Schilfgaarde<br />
1994; Siebert et al. 2002; Seckler 2000 et al.).<br />
In this era, a key developmental agenda for<br />
many countries was <strong>the</strong> construction <strong>of</strong> large and<br />
small dams and river diversions to abstract and<br />
store water for agriculture. Over 40,000 large<br />
dams (>15 meter in height) irrigate about 30-40<br />
percent <strong>of</strong> <strong>the</strong> world’s irrigated areas<br />
(www.dams.org) and are complemented by an<br />
estimated 800,000 smaller dams. Since <strong>the</strong><br />
1980s, <strong>the</strong>re has been a progressive decline in<br />
public and international donor funding for<br />
irrigation, which has been replaced in many<br />
countries by <strong>the</strong> private development <strong>of</strong><br />
groundwater irrigation based on <strong>the</strong> availability <strong>of</strong><br />
cheap drilling and pumping technologies. India<br />
now has an estimated 20 million tube-well<br />
irrigators, accounting for as much as 60 percent<br />
<strong>of</strong> <strong>the</strong> irrigated area according to some estimates.<br />
This development has allowed food<br />
production to keep pace with rapidly growing<br />
global populations and an increasingly urban<br />
world. Farmers currently produce enough to feed<br />
1The particular sections and subsections can be found by referring to <strong>the</strong> Contents on p.iii.<br />
2
<strong>the</strong> world, although poverty and malnutrition still<br />
affect more than a fifth <strong>of</strong> <strong>the</strong> global population<br />
due to local shortages and inadequate distribution<br />
and market systems. Although rates <strong>of</strong> population<br />
increase are now slowing and it is expected that<br />
<strong>the</strong> world will continue to be able to feed itself<br />
(Siebert et al. 2002), <strong>the</strong>re will be continued<br />
pressure to ei<strong>the</strong>r expand <strong>the</strong> irrigated area, or<br />
increase crop and livestock productivity or<br />
substitute intensive irrigation with better and more<br />
extensive rain-fed agriculture.<br />
The population <strong>of</strong> <strong>the</strong> world is now<br />
approaching six billion and is expected to near 8<br />
billion by 2025. To meet future food demand,<br />
some estimate that at least ano<strong>the</strong>r 2,000 cubic<br />
kilometers <strong>of</strong> water (equivalent to <strong>the</strong> mean<br />
annual flow <strong>of</strong> 24 additional Nile rivers) will be<br />
needed (Postel 1999). <strong>Water</strong> use for irrigation<br />
varies considerably across <strong>the</strong> globe. It accounts<br />
for 2-4 percent <strong>of</strong> diverted water in Canada,<br />
Germany and Poland but is an impressive 90-95<br />
percent in Iraq, Pakistan, Bangladesh, Sudan,<br />
Kyrgyzstan and Turkmenistan (Merrett 2002).<br />
Globally, <strong>the</strong> irrigated landscape remains very<br />
dynamic. Although <strong>the</strong> annual rate <strong>of</strong> increase <strong>of</strong><br />
irrigated areas has slowed to about 1 percent,<br />
this still represents an increase <strong>of</strong> between 2 Mha<br />
and 3 Mha each year. There is a smaller<br />
corresponding annual loss <strong>of</strong> irrigated area to<br />
salinity and waterlogging as well as to<br />
abandonment <strong>of</strong> uneconomic projects. Countries<br />
such as China and India continue to build large<br />
multipurpose dam projects that also supply water<br />
for irrigation. In sub-Saharan Africa, irrigation is<br />
perennially seen as having an unfulfilled potential.<br />
Elsewhere in <strong>the</strong> world, <strong>the</strong>re are moratoria on<br />
dam building and even <strong>the</strong> decommissioning <strong>of</strong><br />
dams in <strong>the</strong> western USA.<br />
Better technology, advances in agronomy and<br />
crop breeding (including genetically modified<br />
crops) are expected to contribute to increasing<br />
cropland and water productivity. However, both<br />
extensification and intensification are increasingly<br />
questioned by environmental activists and more<br />
ecologically sensitive governments. A key<br />
challenge for <strong>the</strong> irrigation sector lies in using<br />
less water to produce more food, whilst mitigating<br />
negative impacts on <strong>the</strong> environment, particularly<br />
on aquatic ecosystems.<br />
The irrigated landscape <strong>of</strong> <strong>the</strong> world will be<br />
shaped increasingly by <strong>the</strong> effects <strong>of</strong> competition<br />
for water from o<strong>the</strong>r sectors, notably urban and<br />
rural domestic water supply and industrial needs.<br />
It is becoming increasingly common for river<br />
basins to be over-allocated, with negative<br />
downstream effects <strong>of</strong> competitive upstream<br />
development, such as in <strong>the</strong> Krishna basin in<br />
India (Biggs et al. 2006). Similarly, groundwater is<br />
being mined in many places, notably in significant<br />
parts <strong>of</strong> India and in <strong>the</strong> Olgalala aquifer in <strong>the</strong><br />
mid-west <strong>of</strong> <strong>the</strong> USA. Reservation and<br />
reallocation <strong>of</strong> flows for environmental purposes<br />
will, in <strong>the</strong> end, place even greater competing<br />
demands in terms <strong>of</strong> water volumes. Climatic<br />
change will impose additional challenges that will<br />
reshape <strong>the</strong> irrigated landscape through changes<br />
in snowmelt and rainfall.<br />
In summary, irrigation is widely thought to<br />
provide 40 percent <strong>of</strong> <strong>the</strong> world’s food from<br />
around 17 percent <strong>of</strong> <strong>the</strong> cultivated area. Key<br />
questions concerning <strong>the</strong> sector include:<br />
• How much irrigation do we have now?<br />
• How much do we need in <strong>the</strong> future?<br />
• How much do we want in <strong>the</strong> future to<br />
achieve a sustainable balance with <strong>the</strong><br />
environment?<br />
• How much water does it require and will this<br />
be available?<br />
Estimates <strong>of</strong> <strong>Irrigated</strong> <strong>Area</strong><br />
There remains considerable uncertainty about <strong>the</strong><br />
exact extent, area and cropping intensity <strong>of</strong><br />
irrigation in different parts <strong>of</strong> <strong>the</strong> world, due to <strong>the</strong><br />
dynamics referred to above and systematic<br />
problems <strong>of</strong> underreporting and overreporting <strong>of</strong><br />
irrigation in different contexts (e.g., groundwater)<br />
and countries.<br />
Currently, <strong>the</strong>re is one irrigated area map <strong>of</strong><br />
<strong>the</strong> world produced by FAO/University <strong>of</strong>,<br />
Frankfurt (http://www.fao.org/ag/agl/aglw/aquastat<br />
/irrigationmap/index.stm). This map presents<br />
3
areas that are “equipped for irrigation” but not<br />
necessarily irrigated (Siebert et al. 2005; Siebert et<br />
al. 2002; Siebert and Döll 2001; Döll and Siebert<br />
1999, 2000). The map is produced using irrigated<br />
area statistics from various nations. GIS and<br />
national statistics based irrigated area maps are<br />
also available for individual nations such as India’s<br />
CBIP maps which may have following limitations.<br />
First, extrapolating <strong>the</strong> statistical numbers to <strong>the</strong><br />
spatial domain can be a rough approximation <strong>of</strong> <strong>the</strong><br />
actual location <strong>of</strong> <strong>the</strong> irrigated areas. As a result,<br />
we may have an entire state such as Washington<br />
in <strong>the</strong> USA having
high-quality secondary spatial data such as SRTM<br />
digital elevation models, Landsat, SPOT and<br />
ASTER high-resolution data and global time series<br />
<strong>of</strong> precipitation and o<strong>the</strong>r climatic variables.<br />
The <strong>International</strong> <strong>Water</strong> Management Institute<br />
(IWMI) initiated a GIAM project in 2002 (see<br />
Droogers 2002; Turral 2002) supported by <strong>the</strong><br />
Comprehensive Assessment <strong>of</strong> <strong>Water</strong><br />
Management in Agriculture.<br />
The main motivation to develop <strong>the</strong> IWMI map<br />
lies in <strong>the</strong> potential for a wide range <strong>of</strong> increasingly<br />
sophisticated remote sensed images and<br />
techniques to reveal vegetation dynamics that:<br />
• define more precisely <strong>the</strong> actual area and<br />
spatial distribution <strong>of</strong> irrigation in <strong>the</strong> world<br />
• elaborate <strong>the</strong> extent <strong>of</strong> multiple cropping over<br />
a year, particularly in Asia, where two or three<br />
crops may be planted in a year, but cropping<br />
intensities are not accurately known or<br />
recorded in secondary statistics<br />
• develop methods and techniques for<br />
consistent and unbiased estimates <strong>of</strong> irrigation<br />
over space and time for <strong>the</strong> entire world<br />
Data Used in Creating IWMI’s<br />
Global <strong>Irrigated</strong> <strong>Area</strong> <strong>Map</strong><br />
In this analysis, we make use <strong>of</strong> as much<br />
freely available data as possible. AVHRR and<br />
MODIS data are <strong>of</strong> a relatively coarse scale,<br />
with resolutions from 10-km down to 250-m.<br />
Compiling a MODIS data set for <strong>the</strong> world at<br />
500-m or 1-km over time (e.g., 8-day or<br />
monthly for several years) requires enormous<br />
computer storage and extremely high end<br />
processors that are expensive. The longest<br />
multi-temporal series <strong>of</strong> remote sensing data<br />
with global coverage is AVHRR 8-km (reprojected<br />
to 10-km). However, since this<br />
resolution is coarse, we have combined a 3-<br />
year monthly time series <strong>of</strong> AVHRR 10-km from<br />
1997 to 1999 with a 1-km SPOT Végétation<br />
mosaic <strong>of</strong> <strong>the</strong> world for 1999. A summary <strong>of</strong> <strong>the</strong><br />
data used, and its main processing chain are<br />
summarized in figure 1.<br />
The process starts with a number <strong>of</strong> publicly<br />
available data sets, which are processed into one<br />
large 159-layer time series file, known as a megafile.<br />
The time series analysis is conducted on <strong>the</strong><br />
mega-file and is described in sections 4 and 5.<br />
DEM, temperature and rainfall data are combined<br />
into <strong>the</strong> mega-file to allow segmentation <strong>of</strong> a set<br />
<strong>of</strong> masks (figure 1) <strong>of</strong> different characteristic<br />
regions <strong>of</strong> <strong>the</strong> world which are analyzed<br />
separately and <strong>the</strong>n combined into <strong>the</strong> class<br />
naming and area calculation steps. A number <strong>of</strong><br />
o<strong>the</strong>r data sets (figure 1) are used to provide<br />
contextual and detailed information to assist in<br />
identifying, separating and aggregating classes.<br />
The mega-file used for <strong>the</strong> IWMI global<br />
irrigated area map (GIAM) consisted <strong>of</strong> 159 data<br />
layers (figure 1). This consisted <strong>of</strong> 144 AVHRR<br />
10-km layers for 3 years (12 layers from 1 band<br />
per year * 4 bands including an NDVI band * 3<br />
years), 12 SPOT vegetation 1-km layers for 1<br />
year, and single layers <strong>of</strong> digital elevation model<br />
(DEM) 1-km, mean rainfall for 40 years at 50-km,<br />
and AVHRR-derived forest cover at 1 km. The<br />
159-band mega-file data layers were all retained<br />
at a common resolution <strong>of</strong> 1 km by resampling<br />
<strong>the</strong> coarser resolution to 1 km.<br />
Figures 2 and 3 illustrate various types <strong>of</strong><br />
data present in <strong>the</strong> mega-file. The drop-down<br />
menu <strong>of</strong> bands shows how <strong>the</strong> layers are ordered.<br />
The following sections provide a brief description<br />
<strong>of</strong> each <strong>of</strong> <strong>the</strong> data sets, which are summarized<br />
in detail in tables 1 and 2.<br />
5
Figure 1.<br />
Processing chain for <strong>the</strong> global irrigated area map (GIAM).<br />
NASA global<br />
AVHRR 8 km<br />
pathfinder 10<br />
day composite<br />
data 1981-1999<br />
AVHRR<br />
10 km, 1982-<br />
1999 239<br />
band<br />
mega-file<br />
AVHRR, resampled<br />
to<br />
1 km, 1997-<br />
1999<br />
4 bands<br />
JERS 1 Amazon &<br />
Africa forest cover<br />
(100 m)<br />
ESRI 150 m<br />
Global Landsat<br />
GeoCover<br />
SPOT VGT<br />
1 km<br />
monthly<br />
NDVI<br />
1 km 159-<br />
band<br />
MEGA-FILE,<br />
1997-1999<br />
Classification<br />
UMD global<br />
forest<br />
cover 1 km<br />
CRU 50 km<br />
40 year global<br />
climate data<br />
(UEA)<br />
GTOPO 30<br />
1 km DEM<br />
CRU rainfall,<br />
temperature<br />
re-sampled to<br />
1 km<br />
Class<br />
identification<br />
& naming<br />
<strong>Area</strong><br />
calculation<br />
Groundtruth<br />
data<br />
Comparison &<br />
accuracy<br />
assessment<br />
USGS,<br />
GLC2000<br />
FAO/UF<br />
ANALYSIS<br />
IWMI DSP WEB ARCHIVE<br />
www.iwmidsp.org<br />
GMIA Website<br />
www.iwmigmia.org<br />
Figure 2.<br />
Mega-file used in GIAM. The mega-file <strong>of</strong> 159 layers <strong>of</strong> data which consist <strong>of</strong> 144 AVHRR 10-km monthly layers from<br />
3 years, 12 SPOT monthly layers from year 1999, single layer <strong>of</strong> DEM, mean annual rainfall for 40 years, and forest<br />
cover.<br />
AVHRR 10-km<br />
NIR band<br />
20-year,<br />
monthly,<br />
10-day<br />
AVHRR 10-km<br />
Thermal Data<br />
20-year,<br />
monthly,<br />
10-day<br />
AVHRR 10-km<br />
NDVI<br />
20-year,<br />
monthly,<br />
10-day<br />
6
Figure 3.<br />
Primary and secondary data sets used in <strong>the</strong> mega-file.<br />
GTOPO30 Global 1-km DEM Data<br />
One time<br />
Forest Cover<br />
One time<br />
SPOT 1-km NDVI<br />
Monthly,<br />
10-day<br />
possible<br />
Primary Remote Sensing Data Sets<br />
and Masks<br />
AVHRR Data Characteristics<br />
The monthly time-composite NOAA AVHRR 0.1<br />
degree data that included bands 1, 2, 4 and NDVI<br />
are obtained from <strong>the</strong> NASA Goddard DAAC<br />
(www.daac.gsfc.gov/data/data set/AVHRR) (Smith<br />
et al. 1997; Rao 1993a, b; Kidwell 1991;<br />
Campbell 1987; Flieg et al. 1984; Foddy et al.<br />
1996; Hallant et al. 2001; IGBP 1990; Kogan and<br />
Zhu 2001). The monthly maximum value<br />
composite (MVC) data from 1981 to 1999 are<br />
stored in a single mega-file <strong>of</strong> 239 bands. A<br />
subset <strong>of</strong> 3 years <strong>of</strong> <strong>the</strong>se data (1997-1999) was<br />
incorporated into <strong>the</strong> irrigation mapping mega-file.<br />
(0.61-0.68 µm); near-infrared (NIR) (0.78-0.89 µm);<br />
and shortwave infrared (SWIR) (1.58-1.75 µm).<br />
There is a 10-day syn<strong>the</strong>sis <strong>of</strong> SPOT VGT data<br />
that can be downloaded free <strong>of</strong> cost for <strong>the</strong> entire<br />
world (http://free.vgt.vito.be/). A single year<br />
monthly SPOT VGT NDVI data for 1999 were<br />
used in this study.<br />
Mask Data<br />
Secondary data sets in <strong>the</strong> mega-file are used to<br />
segment <strong>the</strong> world into characteristic regions,<br />
based on rainfall, elevation, temperature and<br />
known forest cover. For example, in areas where<br />
temperatures are less than 280 K, it is unlikely<br />
that <strong>the</strong>re is any vegetation and little chance <strong>of</strong><br />
any irrigation.<br />
SPOT Data Characteristics<br />
The SPOT Végétation (SPOT VGT) 1-km data<br />
have 4 wavebands: blue (0.43-0.47 µm); green<br />
GTOPO 30 1-km DEM<br />
The GTOPO30 is derived from eight sources<br />
consisting <strong>of</strong> digital terrain elevation data or<br />
7
Table 1.<br />
Characteristics <strong>of</strong> <strong>the</strong> satellite sensor and secondary data sets used in mapping global irrigated areas. These data sets were compiled into a 159-band layer stack.<br />
Band number 3 Wavelength range Duration 4 Number <strong>of</strong> bands Data final format Range<br />
or primary source and radiometry Z-scale<br />
(#) (µm) (years) (#; one per month) 1 (percent: for reflectance) (percent)<br />
Satellite sensor data<br />
AVHRR 10-km<br />
Band 1 (B1) 0.58 - 0.68 1997-1999 36 reflectance @ ground, 8-bit 0-100<br />
Band 2 (B2) 0.73-1.1 1997-1999 36 reflectance @ ground, 8-bit 0-100<br />
Band 4 (B4) 10.3-11.3 1997-1999 36 brightness temperature 160-340<br />
(top-<strong>of</strong>-atmosphere)<br />
NDVI (B2-B1)/(B2+B1) 1982-2000 36 unitless, 8-bit scaled NDVI -1 to +1<br />
Secondary data<br />
GTOPO30 1-km<br />
one-band DCW, DTM, and o<strong>the</strong>rs 1 time 1 meters, 16-bit -1 to + 1<br />
Rainfall 1-km<br />
one-band Mean <strong>of</strong> monthly 40-years 1961-01 1 mm, 16-bit 0-65536<br />
Forest cover 1-km<br />
one-band None 1992-93 1 class names, 8-bit 0-256<br />
Table 2.<br />
O<strong>the</strong>r data used in conjunction with <strong>the</strong> megafile<br />
1. Band 1, 2, NDVI same as above 1981-2001 239 1<br />
2. SPOT 1-km 2<br />
NDVI (B3-B2)/(B3+B2) 1999 12 unitless, 8-bit scaled NDVI -1 to +1<br />
3. JERS SAR 100-m<br />
one-band L-band;24.5 cm Jan.-Mar 1996 1 unitless, 8-bit 0-256<br />
Oct-Nov 1996 1 unitless, 8-bit 0-256<br />
Note:<br />
1 = animations <strong>of</strong> <strong>the</strong> irrigated area classes were run for <strong>the</strong> entire AVHRR time series to help understand <strong>the</strong> change history <strong>of</strong> <strong>the</strong> class. There were data for 239 months in 19 years (July 1981-<br />
September 2001). September-December 1994 data were not acquired due to failure <strong>of</strong> <strong>the</strong> satellite.<br />
8
DTED (50% <strong>of</strong> global coverage), digital chart <strong>of</strong><br />
<strong>the</strong> world or DCW (29.9%), USGS 1-degree digital<br />
elevation models (6.7%), army service maps<br />
(ASM maps) at 1:1,000,000 scale (1.1%),<br />
international maps <strong>of</strong> <strong>the</strong> world (IMW maps) at<br />
1:1,100,000 scale (4.7%), Peru map at<br />
1:1,000,000 scale (0.1%), New Zealand DEM<br />
(0.2%), and <strong>An</strong>tarctic digital database (8.3%)<br />
(Tucker et al. 2005; Verdin and Greenlee 1996;<br />
Verdin and Jenson 1996; NGDC 1994).<br />
CRU Precipitation and Temperature Data<br />
The 40-year (1961-2000) monthly, 0.5 degree,<br />
interpolated rainfall and temperature data were<br />
obtained from Dr. Tim Mitchell <strong>of</strong> <strong>the</strong> Climate<br />
Research Unit (CRU), University <strong>of</strong> East <strong>An</strong>glia,<br />
UK (Mitchell et al. 2003) (http://<br />
www.cru.uea.ac.uk/~timm/index.html). The data<br />
have been converted to ESRI GRID format at<br />
IWMI and mean monthly precipitation and<br />
temperature for 40 years were computed for each<br />
pixel and added to <strong>the</strong> mega-file.<br />
Forest Cover Data<br />
Forest cover was derived from <strong>the</strong> 1992 AVHRR<br />
1-km data by <strong>the</strong> University <strong>of</strong> Maryland that<br />
used a continuous fields approach (ra<strong>the</strong>r than<br />
discrete number <strong>of</strong> classes) using a linear mixture<br />
model approach (see DeFries et al. 2000a, b).<br />
This data set was used to mask areas <strong>of</strong> very<br />
high forest cover, which implies <strong>the</strong> land is not<br />
available for cultivation or irrigation.<br />
Secondary Data Sets<br />
JERS-1 SAR-Derived Forest Cover<br />
The Japanese Earth Resources Satellite-1 (JERS-<br />
1) Syn<strong>the</strong>tic Aperture Radar is an L-band (24.5-<br />
cm wavelength) imaging radar with initial full<br />
resolution <strong>of</strong> 18-m that is processed to 100-m,<br />
mosaicked and made available for <strong>the</strong> entire<br />
contiguous rain forests <strong>of</strong> Amazonia and Central<br />
Africa (Saatchi et al. 2001; Saatchi and<br />
McDonald 1997; Saatchi and Rignot 1997;<br />
Saatchi et al. 2000; and Saatchi et al. 1997). We<br />
obtained 100-m resolution JERS-1 SAR tiles<br />
(http://southport.jpl.nasa.gov/GRFM/) for South<br />
America and Africa to assist in mapping major<br />
rain-forest areas at higher resolution.<br />
Unfortunately, well-processed JERS SAR images<br />
are not readily available for Asia and hence could<br />
not be used.<br />
ESRI Landsat 150-m GeoCover<br />
ESRI resampled <strong>the</strong> 8,500 ortho-rectified Landsat<br />
ETM+ “GeoCover” tiles that had been produced<br />
by <strong>the</strong> EarthSat Corporation (http://<br />
www.earthsat.com), funded by NASA (Tucker et<br />
al. 2005). The original images are free from <strong>the</strong><br />
USGS EROS data center and <strong>the</strong> University <strong>of</strong><br />
Maryland (http://glcf.umiacs.umd.edu/index.shtml).<br />
The resampled images have a pixel resolution <strong>of</strong><br />
150 m compared with <strong>the</strong> original pan-sharpened<br />
size <strong>of</strong> 15 m. GeoCover is <strong>the</strong> most positionally<br />
accurate image set covering <strong>the</strong> entire globe and<br />
shows maximum greenness and <strong>of</strong>fers a detailed<br />
“zoom-in” view <strong>of</strong> any part <strong>of</strong> <strong>the</strong> world, which is<br />
used to provide contextual information and<br />
pseudo “groundtruth” by geo-linking to <strong>the</strong> class<br />
maps to identify and label classes.<br />
Google Earth Data Set<br />
Google Earth (http://earth.google.com/) contains<br />
increasingly comprehensive image coverage <strong>of</strong><br />
<strong>the</strong> globe at very high resolution <strong>of</strong> 0.61-4 m,<br />
allowing <strong>the</strong> user to zoom into specific areas in<br />
great detail, from a base <strong>of</strong> 30 m resolution data,<br />
based on GeoCover 2000. This assists:<br />
•·<br />
identification and labeling <strong>the</strong> GIAM classes<br />
•· area calculations (section 7)<br />
• accuracy assessment <strong>of</strong> <strong>the</strong> classes<br />
(section 8)<br />
For every identified class, 20-50 sample<br />
locations were cross-checked using Google Earth.<br />
Google Earth data were used as a substitute for<br />
groundtruth and, at times, <strong>the</strong>y were better than<br />
groundtruth data.<br />
9
Groundtruth Data<br />
There are two global archives <strong>of</strong> GT data, one<br />
collected by IWMI and its staff and <strong>the</strong> o<strong>the</strong>r<br />
using public domain data from <strong>the</strong> degree<br />
confluence project (http://www.confluence .org/).<br />
Groundtruth at IWMI: Data Collected in Field<br />
Campaigns<br />
Detailed groundtruth data were collected by IWMI,<br />
specifically for irrigated area mapping (see for<br />
example, http://www.iwmidsp.org and also<br />
Thenkabail et al. 2005a, b; Biggs et al. 2006). At<br />
each location <strong>the</strong> following data were recorded<br />
(Thenkabail et al. 2005a):<br />
• LULC classes: levels I, II and III <strong>of</strong> <strong>the</strong><br />
<strong>An</strong>derson approach<br />
• land cover types (percentage): trees, shrubs,<br />
grasses, built-up area, water, fallow lands,<br />
weeds, different crops, sand, snow, rock and<br />
fallow farms<br />
• crop types, cropping pattern and cropping<br />
calendar for kharif or rabi (winter or dry<br />
season cropping period from November to<br />
March) and interim seasons<br />
• water source: rain-fed, full or supplemental<br />
irrigation; surface water or groundwater<br />
• digital photos “hot linked” to each groundtruth<br />
location<br />
Public-Domain Groundtruth: The Degree<br />
Confluence Project<br />
The Degree Confluence Project (DCP) (http://<br />
www.confluence.org/) is an organized sampling <strong>of</strong><br />
<strong>the</strong> entire world at every 1 degree latitude and<br />
longitude intersection. It is a voluntary effort and<br />
close to 4,000 confluence locations have already<br />
been contributed. The confluence points include<br />
precise latitude, longitude and a digital photo <strong>of</strong><br />
land cover. These were converted to proprietary<br />
GIS formats and added to <strong>the</strong> DSP in a separate<br />
archive to preserve <strong>the</strong>ir identity.<br />
O<strong>the</strong>r Data Sets for Comparison<br />
Purposes<br />
A number <strong>of</strong> existing global LULC products were<br />
used in <strong>the</strong> preliminary class identification and<br />
labeling process. These included USGS LULC<br />
(Loveland et al. 2000), USGS seasonal LULC<br />
(Loveland et al. 2000), GLC2000 (Bartholome´ and<br />
Belward 2005), IGBP (IGBP 1990) and Olson<br />
eco-regions <strong>of</strong> <strong>the</strong> world (Olson 1994a, b). These<br />
data supplemented/complemented <strong>the</strong> groundtruth<br />
data during <strong>the</strong> preliminary class identification and<br />
labeling processes. The characteristics <strong>of</strong> <strong>the</strong>se<br />
LULC classes are briefly mentioned here and for<br />
fur<strong>the</strong>r detail <strong>the</strong> reader is referred to peerreviewed<br />
publications.<br />
The Global Land Cover 2000 (GLC2000,<br />
Agrawal et al. 2004) data set was derived using<br />
data from SPOT 1-km resolution Végétation<br />
Instrument (Bartholome´ and Belward 2005;<br />
Agrawal et al. 2004). The 10-day syn<strong>the</strong>sis data<br />
from November 1, 1999 through December 31,<br />
2000 were used for <strong>the</strong> classification (http://<br />
www.gvm.sai.jrc.it/ glc2000/ Products/). The<br />
Global Land Cover characteristics database was<br />
developed on a continent-by-continent basis using<br />
1-km, 10-day AVHRR data spanning April 1992<br />
through March 1993 (Loveland et al. 2000). The<br />
same primary data were used in <strong>the</strong> Global<br />
USGS LULC, seasonal USGS LULC and IGBP<br />
LULC (http://edcdaac.usgs.gov/ glcc/<br />
globe_int.html).<br />
Olson data provided global 94 unique<br />
ecosystem classes for <strong>the</strong> globe (Olson 1994a, b)<br />
(http://edcdaac.usgs.gov/glcc/globe_int.html). This<br />
approach was developed in <strong>the</strong> mid-1980s and did<br />
not use any remote sensing information. For<br />
convenience, all <strong>the</strong>se land cover products are<br />
made available in standard image processing<br />
formats (e.g., ERDAS Imagine) in IWMIDSP<br />
(http://www.iwmidsp.org).<br />
10
Methods<br />
<strong>An</strong> overall summary <strong>of</strong> <strong>the</strong> methods and<br />
analytical techniques used is shown in figure 4a<br />
and b. The basic process involves segmenting<br />
<strong>the</strong> world into characteristic regions that are<br />
easier to analyze and <strong>the</strong>n performing an<br />
unsupervised classification on each segment,<br />
containing all <strong>the</strong> 159-band information from <strong>the</strong><br />
AVHRR time series and <strong>the</strong> single year <strong>of</strong><br />
SPOT VGT data. Identification <strong>of</strong> <strong>the</strong> resulting<br />
classes is performed using a suite <strong>of</strong> new<br />
techniques to interpret vegetation dynamics in<br />
multi-temporal series, which are explained in<br />
more detail below. A number <strong>of</strong> classes could<br />
not be clearly identified, and so were<br />
subdivided and classified using simple decision<br />
trees and “groundtruth” data sourced from<br />
GeoCover 150-m and o<strong>the</strong>r secondary<br />
information (Tucker et al. 2005). This resulted<br />
in <strong>the</strong> generic class map <strong>of</strong> 951 “unique”<br />
classes. As far as possible, class naming was<br />
harmonized with earlier Global Land Cover<br />
classifications. Irrigation classes were <strong>the</strong>n<br />
derived by aggregation <strong>of</strong> similar irrigated land<br />
use in <strong>the</strong> generic map, resulting in a 28<br />
irrigation class map (GIAM10 km-28 classes).<br />
This map was used to estimate irrigated crop<br />
areas in each <strong>of</strong> <strong>the</strong> three reference seasons<br />
(see section 8). A fur<strong>the</strong>r aggregation <strong>of</strong> this<br />
map into eight broad irrigated area classes <strong>of</strong><br />
<strong>the</strong> world (GIAM10 km-8 Classes) gives a more<br />
visually friendly presentation, with class names<br />
that are more familiar to irrigation pr<strong>of</strong>essionals.<br />
Image Segmentation<br />
Mega-File <strong>of</strong> Segments<br />
The original 159 band mega-file was converted<br />
into a mega-file <strong>of</strong> segments, each with its own<br />
set <strong>of</strong> 159 bands (see figure 1). The seven global<br />
masks created are listed below and illustrated for<br />
one segment in figure 5. The global masks are:<br />
• precipitation less than 360 mm per year<br />
(PLT360)<br />
• precipitation greater than 2,400 mm per year<br />
(PGT2400)<br />
• temperature less than 280 degree Kelvin per<br />
year (TLT280)<br />
• forest cover greater than 75 percent canopy<br />
cover (FGT75)<br />
• special forest SAR (FSAR)<br />
• elevation greater than 1,500 meters<br />
(EGT1500)<br />
• all o<strong>the</strong>r areas <strong>of</strong> <strong>the</strong> world (AOAW)<br />
The segment with less than 360 mm per year<br />
identifies areas where any green vegetation has a<br />
very high likelihood <strong>of</strong> being irrigated, since <strong>the</strong><br />
average evaporation rates <strong>of</strong> 30 mm per month,<br />
however distributed in reality, will be considerably<br />
less than evaporative demand. This segment will<br />
mainly identify arid and semiarid areas and<br />
deserts, as shown in figure 5. In contrast, <strong>the</strong><br />
segment with rainfall <strong>of</strong> over 2,400 mm per year<br />
mainly identifies <strong>the</strong> rain-forest areas <strong>of</strong> <strong>the</strong> world,<br />
although <strong>the</strong>re are considerable areas <strong>of</strong> irrigation<br />
within <strong>the</strong> SE Asian lands. Where <strong>the</strong> temperature<br />
is less than 280 K on average, it is too cold for<br />
agriculture, and irrigation is not likely to be found<br />
<strong>the</strong>re. However, some nor<strong>the</strong>rn hemisphere areas<br />
have a low average temperature but short<br />
summer seasons in which supplemental irrigation<br />
is actually practised.<br />
Classification<br />
Each segment is processed using unsupervised<br />
ISOCLASS K-means classification (Tou and<br />
Gonzalez 1975).<br />
Class Identification and Naming<br />
Process<br />
On completion <strong>of</strong> an unsupervised classification,<br />
it was necessary to identify what <strong>the</strong> classes<br />
were and label <strong>the</strong>m accordingly. In more<br />
localized applications, it was common to<br />
undertake groundtruth after a preliminary<br />
11
Figure 4a.<br />
Summary <strong>of</strong> analysis to determine irrigation land use classes (part 1).<br />
Image Masks<br />
Precipitation<br />
2,400 mm/yr.<br />
PGT 2,400<br />
Temperature<br />
75%<br />
FGT 75<br />
Special Forest<br />
SAR<br />
FSAR<br />
Elevation<br />
>1,500 m<br />
FGT 1,500<br />
All o<strong>the</strong>r areas<br />
<strong>of</strong> <strong>the</strong> world<br />
AOAW<br />
p1<br />
Global Single Mega-File <strong>of</strong> 159 Data Layer<br />
* AVHRR 10 - km Monthly 19 97 – 1999<br />
Band 1 = 36 Bands<br />
Band 2 = 36 Bands<br />
Band4 = 36 Bands<br />
NDVI = 36 Bands<br />
* SPOT 1 k m monthly 1999<br />
NDVI = 12 Bands<br />
* Se condary data<br />
- Precipitation 50 km, 40 years average<br />
- Forest cover 1 km, one time<br />
- Elevation GTOPO 30 1 km, one time<br />
Image Segmentation<br />
PLT 360<br />
segment<br />
159 data la yers<br />
PGT 2400<br />
segment<br />
159 data la yers<br />
TLT 280<br />
segment<br />
159 data la yers<br />
FGT 75<br />
segment<br />
159 data la yers<br />
FS AR<br />
segment<br />
159 data la yers<br />
FGT 1500<br />
segment<br />
159 data la yers<br />
AOAW<br />
segment<br />
159 data la yers<br />
Unsupervised I so-Cla ss Clu stering<br />
Generate Class Spectra<br />
PLT 360 PGT 2,400 TLT 280 FGT 75 FSAR FGT 1,500 AOAW<br />
Spectral Matching Technique (SMT)<br />
SMT Qualitative<br />
SMT Quantitative SMT Ideal<br />
Shape Measure<br />
Spectral Correlation Similarity R .Squared<br />
Value (SCS-R²)<br />
Match Class<br />
Spectra<br />
With Ideal<br />
Spectra<br />
Shape & Magnitude Measure<br />
Spectral Si milari ty Value (SS V )<br />
Ideal Location<br />
12
Figure 4b.<br />
Summary <strong>of</strong> analysis to determine irrigation land use classes (part 2).<br />
Similar Classes are Grouped<br />
Groundtruth (GT) Data<br />
<strong>of</strong> <strong>the</strong> <strong>World</strong> by IWMI<br />
GT Data <strong>of</strong> <strong>the</strong> <strong>World</strong> by<br />
Degree Confluence Project<br />
Class Identification<br />
and<br />
Labeling Process<br />
Multi data Spectral Plots<br />
Geocover Landsat 150 m high-res.<br />
Data <strong>of</strong> <strong>the</strong> world<br />
Google Earth High-Res.<br />
Data <strong>of</strong> <strong>the</strong> <strong>World</strong><br />
Google Panaromia High-Res.<br />
Data <strong>of</strong> <strong>the</strong> <strong>World</strong><br />
Bi-Spectral Plots<br />
Yes<br />
Is <strong>the</strong> Class<br />
Identified?<br />
Mask Image <strong>Area</strong> <strong>of</strong> Mixed<br />
Class from 159 Band Mega-File<br />
Reclassify into 20 Classes<br />
Space-Time Spiral<br />
Curve (ST-SC)<br />
No<br />
Mixed Class<br />
Secondary data from National<br />
system (e. g. Central Board<br />
Of Irrigation and power)<br />
Secondary Data from Global<br />
Source<br />
* USGS Landuse land cover<br />
1 km 1999<br />
Seasonal<br />
One time<br />
* Global land cover 2000 1 km<br />
* Olson landuse land cover 1984<br />
* High resolution data (from MODIS.)<br />
Thenkabail et al 2005<br />
Thenkabail et al 2006<br />
Was <strong>the</strong> Class<br />
Resolved?<br />
Decision<br />
Tree Algorithms<br />
Yes<br />
Spatial Modeling<br />
Using GIS Layers<br />
No<br />
NDVI Threshold in Decision Trees<br />
GTOPO30 zone<br />
<strong>Map</strong> (1 km)<br />
Zone1 2000m<br />
Precipitation<br />
Zone <strong>Map</strong> (50 km)<br />
Zone1 4000mm<br />
Zone1 Super arid<br />
Zone2 Peri arid<br />
Zone3 Arid<br />
Zone4 Semi arid<br />
Zone5 Semi humid<br />
Zone6 Humid<br />
Zone7 Peri humid<br />
Koppen-Ecological<br />
Zone <strong>Map</strong> (1 km)<br />
Zone1Tropical Rainforest<br />
Zone2 Tropical moist deciduous forest<br />
Zone3 Tropical dry forest<br />
Zone4 Tropical shrub land<br />
Zone5 Tropical desert<br />
Zone6 Tropical mountain system<br />
Zone7 Subtropical humid forest<br />
Zone8 Subtropical dry forest<br />
Zone9 Subtropical steppe<br />
Zone10 Subtropical desert<br />
Zone11Subtropical mountain system<br />
Zone12 Temperate oceanic forest<br />
Zone13 Temperate continental system<br />
Zone14 Temperate steppe<br />
Zone15 Temperate desert<br />
Zone16 Temperate mountain system<br />
Zone17 Boreal coniferous forest<br />
Zone18 Boreal tundra woodland<br />
Zone19 Boreal mountain system<br />
Zone20 Polar<br />
Zone21 <strong>Water</strong><br />
Zone22 No data<br />
Mean Monthly Surface<br />
Temperature <strong>Map</strong> (0C)<br />
(10 km)<br />
Zone1 1-4<br />
Zone2 5-8<br />
Zone3 9-12<br />
Zone4 13-16<br />
Zone5 17-20<br />
Zone6 21-24<br />
Zone7 25-28<br />
Zone8 29-32<br />
Zone9 33-36<br />
Zone10 37-40<br />
Zone11 41-44<br />
Zone12 >44<br />
Global Tree Cover<br />
Zone <strong>Map</strong><br />
(% Tree Cover)<br />
(1 km)<br />
Zone1
Figure 5.<br />
Precipitation less than 360 mm segment (PLT360-segment). These arid or semiarid areas provide distinct contrasts<br />
between areas with and without vegetation.<br />
unsupervised classification, which identified<br />
characteristic land units for investigation and this<br />
was done for <strong>the</strong> IWMI field campaigns in India.<br />
However, at global scale this was not possible,<br />
and a combination <strong>of</strong> techniques was employed<br />
to first group classes based on <strong>the</strong> similarity <strong>of</strong><br />
<strong>the</strong>ir time-series behavior, <strong>the</strong>n identified in more<br />
detail what <strong>the</strong>y were through understanding <strong>the</strong><br />
spatial-temporal variations in reflectance and<br />
cross referencing to higher-resolution images<br />
(GeoCover 150; Tucker et al. 2005), existing GIS,<br />
maps and groundtruth data.<br />
Spectral Matching Techniques<br />
Time series <strong>of</strong> NDVI or o<strong>the</strong>r metrics are<br />
analogous to spectra, where time is substituted<br />
for wavelength. Considerable research effort has<br />
been made into hyperspectral imagery analysis<br />
and this yields a number <strong>of</strong> promising avenues,<br />
developed here, for <strong>the</strong> analysis <strong>of</strong> time series.<br />
Spectral Matching Techniques (SMTs) have<br />
mostly been applied to hyperspectral data<br />
analysis <strong>of</strong> minerals (Homayouni and Roux 2003;<br />
Shippert 2001; Tou and Gonzalez 1975; Farrand<br />
and Harsanyi 1997; Granahan and Sweet 2001;<br />
Thenkabail et al. 2005a, b).<br />
The principle in spectral matching is to match<br />
<strong>the</strong> shape or <strong>the</strong> magnitude or (preferably) both to<br />
an ideal or target spectrum (commonly known as<br />
a pure class or “end-member”). The time-series<br />
signatures <strong>of</strong> irrigated crops across <strong>the</strong> globe can<br />
match (tropics) or be out <strong>of</strong> phase (tropics and<br />
<strong>the</strong> sou<strong>the</strong>rn hemisphere).<br />
We also attempted to use Modified Spectral<br />
<strong>An</strong>gle Similarity (MSAS) (Shippert 2001; Homayouni<br />
and Roux 2003; Farrand and Harsanyi 1997;<br />
Schwarz and Staenz 2001; Thenkabail et al. 2006)<br />
which measures <strong>the</strong> hyperspectral angle between<br />
spectra <strong>of</strong> any two classes or between target and<br />
sample class spectra. However, <strong>the</strong> practical<br />
implementation <strong>of</strong> this was troublesome (see also<br />
Thenkabail et al. 2006), <strong>of</strong>ten providing uncertain<br />
results, and so it is not discussed fur<strong>the</strong>r.<br />
14
Qualitative Spectral Matching<br />
Qualitative spectral matching is <strong>of</strong>ten performed<br />
before quantitative approaches (e.g., figure 6a). It<br />
provides a preliminary indication <strong>of</strong> which classes<br />
group toge<strong>the</strong>r and which stand apart. Indeed <strong>the</strong><br />
classes that match up through: a) shape only,<br />
and/or b) magnitude only, and/or c) both shape<br />
and magnitude, are identified visually. When two<br />
classes, such as continuous irrigation and<br />
forests, match and provide high quantitative<br />
correlations, it is essential to plot both classes<br />
with reference to <strong>the</strong>ir spatial location using<br />
groundtruth or ancillary data.<br />
Quantitative Spectral Matching<br />
Two quantitative spectral matching techniques<br />
were used in this study. These were:<br />
• spectral correlation similarity (SCS) R 2<br />
• spectral similarity value (SSV)<br />
The SCS R 2 value has been applied to match<br />
<strong>the</strong> shape <strong>of</strong> any class to <strong>the</strong> selected target<br />
class. The SSV has been used to determine <strong>the</strong><br />
match <strong>of</strong> both shape and magnitude (SAS<br />
Institute 2004). The SMTs are discussed in detail<br />
by Thenkabail et al. (2006).<br />
The process <strong>of</strong> spectral matching is<br />
illustrated beginning with a plot <strong>of</strong> multiple<br />
time series and two selected target series in<br />
figure 6b, which are characteristic <strong>of</strong> two<br />
irrigated crops per year in <strong>the</strong> Indian<br />
subcontinent.<br />
The extraction and geographical location <strong>of</strong><br />
similar classes are shown in a more pictorial way<br />
in figure 7.<br />
Figure 6a.<br />
Time-series AVHRR 10-km pr<strong>of</strong>ile <strong>of</strong> spectral classes is illustrated for AOAW-segment. Initially, <strong>the</strong> AOAW-segment<br />
had 350 classes. The plot <strong>of</strong> some <strong>of</strong> <strong>the</strong>se classes highlights <strong>the</strong> spectral characteristics <strong>of</strong> each class. A quantitative<br />
approach to determine which <strong>of</strong> <strong>the</strong>se classes match is performed through SCS R 2 (e.g., table 4).<br />
15
Figure 6b.<br />
Identifying similar irrigated classes using spectral matching. Spectral matching in combination with ground truthing<br />
and ideal spectra helps group similar irrigated (shown in dark green, for classes 25, 26, and 27). The same logic was<br />
used to group: forests (sown in light green; class numbers 1, 2, 3, 4 and 5), Savanna/Croplands mix (Orange; class<br />
50, 59, 60, 67, 74), and Barren/Deserts (shown in blue; classes 10 to 15).<br />
Figure 7.<br />
The process <strong>of</strong> combining classes in spectral matching techniques (SMTs) is illustrated. First, <strong>the</strong> SCS R 2 -values are<br />
determined for a matrix <strong>of</strong> classes. The time-series spectra <strong>of</strong> classes with high SCS R 2 -values are <strong>the</strong>n matched.<br />
Grouped classes are investigated fur<strong>the</strong>r, using all o<strong>the</strong>r types <strong>of</strong> information including groundtruth. This leads to<br />
distinct groups such as boreal forests and tropical forests. Finally, <strong>the</strong> classes <strong>of</strong> similar types are color-coded.<br />
16
Google Earth as a Resource for Class<br />
Naming<br />
Once <strong>the</strong> classes are grouped by spectral<br />
similarity, each one is investigated by taking 20-<br />
50 sample points on Google Earth spread across<br />
<strong>the</strong> world (figure 8). If <strong>the</strong>re is overwhelming<br />
evidence that <strong>the</strong> class falls into a particular<br />
category, an indicative name is assigned. The<br />
interpretation <strong>of</strong> a class is based on visual<br />
indicators such as shape (e.g., central pivot<br />
circles), size (e.g., reservoir size for large and<br />
small scale), pattern (e.g., contiguous farms) and<br />
texture (e.g., smooth texture <strong>of</strong> a farm compared<br />
to rough texture <strong>of</strong> a forest). The process is<br />
repeated for every class in a group. If <strong>the</strong> Google<br />
Earth sample points for a class indicate a mixed<br />
land use/land cover, <strong>the</strong>n <strong>the</strong> class is fur<strong>the</strong>r<br />
processed ei<strong>the</strong>r through decision trees or is<br />
reclassified, or GIS spatial modeling is applied to<br />
derive homogeneous classes.<br />
Advanced Techniques for Class<br />
Identification<br />
In addition to section 5.1 through 5.4, a rigorous<br />
class identification and labeling process was<br />
followed as follows (see figure 4 and GIAM web<br />
portal: http://www.iwmigiam.org):<br />
• brightness, greenness and wetness for a<br />
single date<br />
• space-time dynamics <strong>of</strong> brightness,<br />
greenness and wetness<br />
• NDVI time series and cropping intensity<br />
• brightness temperature<br />
• class refinement<br />
• rule-based decision trees<br />
• simple decision trees with principal<br />
components<br />
• GIS spatial modeling<br />
Figure 8.<br />
Google Earth “zoom in” views to identify a class. One preliminary class is spread out across <strong>the</strong> world. The class was<br />
investigated using 50 Google sample points that were randomly chosen. The figure shows <strong>the</strong> spread <strong>of</strong> <strong>the</strong> class<br />
across <strong>the</strong> world and Google Earth hi-res image at two locations: Center pivot groundwater irrigation in <strong>the</strong> USA and<br />
surface irrigation in Sudan.<br />
Overall, ~10,726 points (e.g., yellow points also called “place marks” in figure 8) were used in identifying and providing indicative class<br />
labels in <strong>the</strong> generic 951 class GIAM10 km map.<br />
17
Class-Naming Convention<br />
The GIAM work, based on interpretation <strong>of</strong><br />
classes from various segments, leads to 951<br />
dissaggregated classes; each <strong>of</strong> <strong>the</strong>se classes in<br />
turn coming from several o<strong>the</strong>r classes.<br />
Standardized naming <strong>of</strong> classes becomes even<br />
more important when several interpreters are<br />
involved, to avoid interpreter bias. The<br />
standardardized class naming convention involved<br />
watering method, type <strong>of</strong> irrigation, crop type,<br />
scale, intensity, location and type <strong>of</strong> signature<br />
(see figure 9).<br />
• disaggregated 28-class global irrigated area<br />
map (GIAM10 km-28 class)<br />
• aggregated 8-class global irrigated area map<br />
(GIAM10 km-8 classes)<br />
• disaggregated 323-class global irrigated area<br />
map (GIAM10 km-323 class)<br />
The GIAM10 km-28 class irrigated area map<br />
is <strong>the</strong> main irrigated area product, but two<br />
simplified GIAM10 km M-8 class, and GIAM10<br />
km-3 class maps have been produced to ease<br />
visualization and understanding by irrigation<br />
practitioners. The GIAM10 km-3 class map<br />
consists <strong>of</strong> <strong>the</strong> following classes:<br />
• irrigated surface water<br />
• irrigated groundwater<br />
• irrigated conjunctive use<br />
The standardized class-naming convention is<br />
depicted in figure 9. At different levels, <strong>the</strong> class<br />
naming may or may not include a particular category,<br />
such as <strong>the</strong> scale <strong>of</strong> irrigation or <strong>the</strong> intensity.<br />
18
Figure 9.<br />
Class naming convention. The standardized class naming convention is depicted in this figure. At different levels, <strong>the</strong> class naming may or may not include a particular<br />
category such as scale <strong>of</strong> irrigation or <strong>the</strong> intensity.<br />
19
Estimating <strong>Irrigated</strong> <strong>Area</strong>s<br />
Using Three Methods<br />
<strong>An</strong> estimate <strong>of</strong> <strong>the</strong> irrigated areas <strong>of</strong> <strong>the</strong> world<br />
must take account <strong>of</strong> different crop seasons,<br />
cropping patterns and intensity. In this analysis,<br />
we estimate <strong>the</strong> area based on <strong>the</strong> cropping<br />
calendar and <strong>the</strong>n determine whe<strong>the</strong>r <strong>the</strong> crop is<br />
single, double or continuous.<br />
Since pixel sizes are large at 1 km, and<br />
dominated by AVHRR time series at 10 km, it is<br />
important to estimate <strong>the</strong> proportion <strong>of</strong> any one<br />
pixel that is irrigated in each season. The use <strong>of</strong><br />
total pixel area would result in a massive<br />
overestimate. The full pixel areas (FPAs) were<br />
converted to sub-pixel areas (SPAs) using<br />
irrigated area fractions (IAFs). The overall<br />
procedure is shown in figure 10. In order to obtain<br />
reliable estimates <strong>of</strong> sub-pixel areas, we use<br />
three methods:<br />
• Google Earth estimates (GEE) (figure 11;<br />
section 7.1)<br />
• high resolution imagery (HRI) (figure 12;<br />
section 7.2)<br />
• sub-pixel decomposition techniques (SPDT)<br />
(figure 13; section 7.3)<br />
Figure 10.<br />
Summary <strong>of</strong> area abstraction from <strong>the</strong> 28 irrigation class map.<br />
28<br />
Irrigation<br />
Class <strong>Map</strong><br />
Subdivide<br />
Each Class<br />
by 10<br />
280<br />
Irrigation<br />
Classes<br />
Group plots in 2-D<br />
Feature Space<br />
(AVHRR R:NIR).<br />
Surface<br />
<strong>Water</strong> Irrigation<br />
Classes<br />
Ground<strong>Water</strong><br />
Irrigation<br />
Classes<br />
2 Data and<br />
Expert<br />
Opinion<br />
Scale Irrigation<br />
% on Plots for<br />
Each Main Class<br />
(as 10<br />
Subclasses)<br />
<strong>Area</strong><br />
Estimation<br />
Sum <strong>Area</strong> % for<br />
Each Class:<br />
x Total Pixel<br />
<strong>Area</strong> in Each<br />
Reference<br />
Season<br />
Conjunctive<br />
Use Irrigation<br />
Classes<br />
<strong>Area</strong><br />
Proportions<br />
from<br />
Groundtruth<br />
20
Figure 11.<br />
<strong>Irrigated</strong> area by Google Earth estimates (GEE). For each GIAM10 km-28 classes GEE <strong>of</strong> irrigated area fraction (IAF)<br />
were estimated using Google Earth images. Thirty points were taken for each class and averaged. The fraction<br />
calculation for one class is illustrated.<br />
The SPDT (figure 13) and HRI approaches<br />
provide irrigated area intensities for different cropgrowing<br />
seasons (see table 3), whereas <strong>the</strong> GEE<br />
approach provides net irrigated areas without<br />
intensity<br />
<strong>Irrigated</strong> <strong>Area</strong> Fraction (IAF) Based on<br />
Google Earth Estimates<br />
The IAF from Google Earth estimates (GEE)<br />
involves determining percent area irrigated for<br />
every GIAM10 km-28 class by zooming into<br />
Google Earth images (e.g., figure 11). On<br />
average, at least 30 points were randomly<br />
surveyed for every class and <strong>the</strong> IAF determined<br />
as <strong>the</strong> average area irrigated from all <strong>the</strong>se<br />
points. The process is repeated for all classes.<br />
The GEE approach acts as “groundtruth” for <strong>the</strong><br />
class.<br />
SPA <strong>of</strong> Pixels Based on High-<br />
Resolution Imagery<br />
The second method <strong>of</strong> SPA estimation uses<br />
Landsat ETM+ images at 30 m resolution. At<br />
least three high-resolution images are downloaded<br />
per growing season for each <strong>of</strong> <strong>the</strong> 28 irrigation<br />
classes. The Landsat ETM+ grid is overlaid on<br />
<strong>the</strong> GIAM class and images for estimation <strong>of</strong> <strong>the</strong><br />
actual irrigated area within 10 km pixels. If a<br />
class has two seasons, six images are<br />
downloaded and analyzed so that three images<br />
are studied and averaged to determine <strong>the</strong> IAF in<br />
a given season.<br />
21
Figure 12.<br />
<strong>Irrigated</strong> area fraction from high-resolution imagery (IAF-HRI). For each <strong>of</strong> <strong>the</strong> GIAM10 km-28 classes <strong>the</strong> IAF-HRI<br />
were estimated by masking Landsat images for <strong>the</strong> area occupied by <strong>the</strong> class and <strong>the</strong>n determining irrigated vs.<br />
nonirrigated areas.<br />
Landsat ETM+<br />
Unsupervised<br />
classification (10 classes)<br />
<strong>Irrigated</strong> (56%)<br />
Fallow (7%)<br />
O<strong>the</strong>rs (38%)<br />
<strong>Area</strong> outside GIAM masked out<br />
Unsupervised classification map<br />
Figure 13.<br />
Sub-pixel decomposition technique (SP-DCT).<br />
22
Table 3.<br />
Characterization <strong>of</strong> class-wise cropping calender based on <strong>the</strong> AVHRR NDVI (1999).<br />
Class GMIA 28 Classes Single Crop Double Crop Continuous<br />
no. Class Name First Second Crop<br />
1 01 <strong>Irrigated</strong>, surface water, single crop, wheat-corn-cotton Mar-Nov<br />
2 02 <strong>Irrigated</strong>, surface water, single crop, cotton-rice-wheat Apr-Oct<br />
3 03 <strong>Irrigated</strong>, surface water, single crop, mixed-crops Mar-Oct<br />
4 04 <strong>Irrigated</strong>, surface water, double crop, rice-wheat-cotton Mar-Jun Jul-Oct<br />
5 05 <strong>Irrigated</strong>, surface water, double crop, rice-wheat-cotton-corn Jun-Oct Dec-Mar<br />
6 06 <strong>Irrigated</strong>, surface water, double crop, rice-wheat-plantations Jul-Nov Dec-Mar<br />
7 07 <strong>Irrigated</strong>, surface water, double crop, sugarcane Jun-Nov Dec-Feb<br />
8 08 <strong>Irrigated</strong>, surface water, double crop, mixed-crops Jul-Nov Dec-Apr<br />
9 09 <strong>Irrigated</strong>, surface water, continuous crop, sugarcane Jul-May<br />
10 10 <strong>Irrigated</strong>, surface water, continuous crop, plantations Jan-Dec<br />
11 11 <strong>Irrigated</strong>, ground water, single crop, rice-sugarcane Jul-Dec<br />
12 12 <strong>Irrigated</strong>, ground water, single crop, corn-soybean Mar-Oct<br />
13 13 <strong>Irrigated</strong>, ground water, single crop, rice and o<strong>the</strong>r crops Mar-Nov<br />
14 14 <strong>Irrigated</strong>, ground water, single crop, mixed-crops Jul-Dec<br />
15 15 <strong>Irrigated</strong>, ground water, double crop, rice and o<strong>the</strong>r crops Jul-Nov Dec-Mar<br />
16 16 <strong>Irrigated</strong>, conjunctive use, single crop, wheat-corn-soybean-rice Mar-Nov<br />
17 17 <strong>Irrigated</strong>, conjunctive use, single crop, wheat-corn-orchards-rice Mar-Nov<br />
18 18 <strong>Irrigated</strong>, conjunctive use, single crop, corn-soybeans-o<strong>the</strong>r crops Mar-Oct<br />
19 19 <strong>Irrigated</strong>, conjunctive use, single crop, pastures Mar-Dec<br />
20 20 <strong>Irrigated</strong>, conjunctive use, single crop, pasture, wheat, sugarcane Jul-Feb<br />
21 21 <strong>Irrigated</strong>, conjunctive use, single crop, mixed-crops Mar-Nov<br />
22 22 <strong>Irrigated</strong>, conjunctive use, double crop, rice-wheat-sugar cane Jun-Nov Dec-Mar<br />
23 23 <strong>Irrigated</strong>, conjunctive use, double crop, sugarcane-o<strong>the</strong>r crops Apr-Jul Aug-Feb<br />
24 24 <strong>Irrigated</strong>, conjunctive use, double crop, mixed-crops Jul-Nov Dec-Feb<br />
25 25 <strong>Irrigated</strong>, conjunctive use, continuous crop, rice-wheat Mar-Feb<br />
26 26 <strong>Irrigated</strong>, conjunctive use, continuous crop, rice-wheat-corn Jun-May<br />
27 27 <strong>Irrigated</strong>, conjunctive use, continuous crop, sugarcane-orchards-rice Jun-May<br />
28 28 <strong>Irrigated</strong>, conjunctive use, continuous crop, mixed-crops Jun-May<br />
23
Classification Approach<br />
The Landsat images are first “masked” to match<br />
areas defined in <strong>the</strong> global map (see figure 12).<br />
The image is <strong>the</strong>n classified into 10 unsupervised<br />
classes. The irrigated versus nonirrigated areas<br />
are <strong>the</strong>n identified using our class identification<br />
schemes (see figure 4). Then <strong>the</strong> IAF is <strong>the</strong><br />
percent area irrigated compared to total area <strong>of</strong><br />
<strong>the</strong> masked Landsat image. Two o<strong>the</strong>r methods<br />
were assessed (7.2.2 and 7.2.3), but were not as<br />
effective as this technique (7.2.1).<br />
Regression Relationships<br />
The HRI images were also resampled to 10-km to<br />
match with AVHRR pixels and co-registered (see<br />
DeFries and Townshend 1994). 325 AVHRR 10-km<br />
pixels are equivalent to one Landsat image (185 x<br />
170 km). The AVHRR NDVI from <strong>the</strong> 325 pixels<br />
were <strong>the</strong>n plotted against <strong>the</strong> Landsat ETM+NDVI<br />
(“vegetation area fraction”) from <strong>the</strong> resampled 10-<br />
km Landsat data. However, <strong>the</strong> resulting<br />
relationship was not clear as a result <strong>of</strong> pixel size<br />
differences as well <strong>the</strong> problems associated with<br />
precise co-registration. Hence, <strong>the</strong> classification<br />
approach in section 7.3.1 is considered superior<br />
<strong>Irrigated</strong> <strong>Area</strong> Fraction (IAF) Coefficient<br />
At times, a clear regression relationship between<br />
AVHRR NDVI and IAF with high R 2 -value may be<br />
absent. In such a case, it will suffice to<br />
determine IAF for <strong>the</strong> entire class, based on <strong>the</strong><br />
selected Landsat image by digitizing <strong>the</strong> irrigated<br />
versus nonirrigated areas on <strong>the</strong> Landsat image.<br />
However, this approach is tedious and has<br />
limitations <strong>of</strong> visual interpretation.<br />
Sub-Pixel Decomposition Technique<br />
Determination <strong>of</strong> IAFs by sub-pixel<br />
decomposition (SPDT) involves plotting AVHRR<br />
band 1 min<br />
(absorption maxima) versus AVHRR<br />
band 2 max<br />
(reflection maxima) <strong>of</strong> all <strong>the</strong> pixels in<br />
10 subclasses <strong>of</strong> a class and <strong>the</strong>n scaling<br />
percentage across <strong>the</strong>m. The scaling is based<br />
on <strong>the</strong> knowledge base from groundtruth data,<br />
digital photos, high-resolution images, literature<br />
and relative positioning <strong>of</strong> <strong>the</strong> pixels in <strong>the</strong><br />
greenness-wetness-brightness areas in <strong>the</strong> RED<br />
versus NIR plots.<br />
Each <strong>of</strong> <strong>the</strong> 28 irrigation classes is<br />
subdivided into 10 giving a total class number<br />
<strong>of</strong> 280 for area estimation. The AVHRR band<br />
1 max<br />
and AVHRR band 2 max<br />
values for each<br />
subclass are plotted, as for a BGW plot (e.g.,<br />
figure 13), and <strong>the</strong> percentage area irrigated is<br />
determined, based on <strong>the</strong> location <strong>of</strong> <strong>the</strong> point<br />
in 2-d feature space (figure 13). The percentage<br />
<strong>of</strong> irrigation is assigned according to a) percent<br />
irrigated area canopy cover versus AVHRR 10-<br />
km band reflectivity and NDVI relationships<br />
from <strong>the</strong> Krishna and Ganges groundtruth data;<br />
b) percent cover recorded in IWMI groundtruth<br />
data <strong>of</strong> <strong>the</strong> world versus AVHRR 10-km NDVI or<br />
band reflectivity, and c) extensive literature<br />
review (Settle and Drake 1993; Drake et al.<br />
1997; Purevdorj et al. 1998; Xiaoyang et al.<br />
1998; Purevdorj and Tateishi 2001; Li et al.<br />
2003). The actual irrigated area for a given<br />
class is determined as <strong>the</strong> sum <strong>of</strong> <strong>the</strong> total<br />
pixel areas, multiplied by <strong>the</strong> sub-pixel<br />
percentages for each <strong>of</strong> <strong>the</strong> 10 subclasses.<br />
The greater <strong>the</strong> understanding one has <strong>of</strong><br />
percent irrigated area versus band reflectivity, <strong>the</strong><br />
greater <strong>the</strong> reliability <strong>of</strong> <strong>the</strong> resulting area<br />
calculations. In this case, <strong>the</strong> understanding<br />
comes from a combination <strong>of</strong> field and remote<br />
sensing experience and is <strong>the</strong>refore limited by <strong>the</strong><br />
available geographical and farming system<br />
coverage. Figure 13 shows an illustration for 20<br />
classes, each with 10 subclasses, plotted on a 2-<br />
dimentional SPDC plot. Figure 14 shos <strong>the</strong><br />
relationship between percent irrigated area <strong>of</strong> class<br />
1-20 and <strong>the</strong> AVHRR NDVI computed using band<br />
1 max<br />
and AVHRR band 2 max<br />
reflectivity.<br />
24
Figure 14.<br />
Relationship between percent irrigated area <strong>of</strong> class 1-20 and <strong>the</strong> AVHRR NDVI computed using band 1 max<br />
and<br />
AVHRR band 2 max<br />
reflectivity.<br />
<strong>Irrigated</strong> area from sub-pixel decomposition (%)<br />
120.00<br />
100.00<br />
80.00<br />
60.00<br />
40.00<br />
20.00<br />
y = 211.93x - 25.561<br />
R 2 = 0.9508<br />
Pure <strong>Irrigated</strong><br />
Linear (Pure <strong>Irrigated</strong>)<br />
0.00<br />
0.00 0.10 0.20 0.30 0.40 0.50 0.60 0.70<br />
-20.00<br />
NDVI (unitless)<br />
25
Accuracy Assessment<br />
A number <strong>of</strong> different approaches were adopted to<br />
assess accuracies and errors (see Congalton and<br />
Green 1999; Thenkabail et al., 2005c). We<br />
concentrated on <strong>the</strong> irrigated area classes and<br />
point-based accuracy and error estimates were<br />
performed on two data sets based on:<br />
Groundtru<strong>the</strong>d irrigated points classified as irrigated area<br />
Accuracy <strong>of</strong> irrigated area class = ………………………………………………………………...........* 100<br />
Total number <strong>of</strong> groundtru<strong>the</strong>d points for irrigated area class<br />
Nonirrigated groundtruth points falling on irrigated area class<br />
Errors <strong>of</strong> commission for irrigated area = .……………………………………………………………………...* 100<br />
Total number <strong>of</strong> nonirrigated groundtruth points<br />
<strong>Irrigated</strong> groundtruth points falling on nonirrigated area class<br />
Errors <strong>of</strong> omission for irrigated area = ...……………………………………………………………………* 100<br />
Total number <strong>of</strong> irrigated area groundtruth points<br />
Accuracy assessment makes use <strong>of</strong> three<br />
distinct sources <strong>of</strong> reference data, so as to obtain<br />
a robust understanding <strong>of</strong> <strong>the</strong> accuracies <strong>of</strong> <strong>the</strong><br />
GIAM10 km map V2.0 so that it can be<br />
compared to <strong>the</strong> Food and Agricultural<br />
Organization and University <strong>of</strong> Frankfurt (FAO/UF)<br />
map <strong>of</strong> global irrigated area. We also make a<br />
three-way comparison for India, with reference to<br />
<strong>the</strong> Central Board for Irrigation and Power (CBIP).<br />
The distinct sources <strong>of</strong> reference data are listed<br />
in section 4. The GEE data are completely<br />
independent, and are randomly generated. The<br />
degree confluence project (DCP) groundtruth (GT)<br />
data are relatively independent in that <strong>the</strong> DCP<br />
points are independent, but not <strong>the</strong> o<strong>the</strong>r GT<br />
points. The o<strong>the</strong>r GT data were also used in<br />
class identification and labeling.<br />
Groundtruth Data Sets from <strong>the</strong> GIAM<br />
Project<br />
A total <strong>of</strong> 895 GT points were ga<strong>the</strong>red by <strong>the</strong><br />
GIAM project during 2004 and 2005 through a<br />
series <strong>of</strong> groundtruth campaigns that included<br />
missions to all <strong>of</strong> India, and separate missions to<br />
Krishna and Ganges basins, Sri Lanka,<br />
Uzbekistan, South Africa, and Mozambique.<br />
These data are far more refined for accuracy<br />
assessment than <strong>the</strong> second data set because <strong>of</strong><br />
<strong>the</strong>ir exclusive focus on irrigated areas. However,<br />
we do not have broad coverage across <strong>the</strong> world.<br />
O<strong>the</strong>r Groundtruth<br />
A larger set <strong>of</strong> groundtruth data with 1,863 points<br />
is also used for accuracy assessment. This data<br />
set has far better spatial distribution across <strong>the</strong><br />
world. However, <strong>the</strong> data <strong>the</strong>mselves come from<br />
various sources that include a) Degree<br />
Confluence Project (DCP), b) various IWMI<br />
projects (e.g., wetlands, water productivity) and c)<br />
<strong>the</strong> GIAM project.<br />
Google Earth Estimates<br />
Accuracy assessments were also made using 670<br />
locations inspected in Google Earth at 30-m pixel<br />
scale or better. All GIAM irrigated area classes<br />
were combined into a single irrigated class. The<br />
670 sample locations were randomly chosen and<br />
<strong>the</strong>ir land use determined in terms <strong>of</strong> irrigated or<br />
not irrigated. These points were overlaid on <strong>the</strong><br />
irrigated area map and overall accuracy and errors<br />
<strong>of</strong> omission and commission were determined.<br />
26
Results<br />
Global <strong>Irrigated</strong> <strong>Area</strong> <strong>Map</strong> Version 2.0<br />
(GIAM10 km V2.0)<br />
The spatial distribution <strong>of</strong> <strong>the</strong> irrigated area<br />
classes in <strong>the</strong> global irrigated area map (GIAM)<br />
are produced as a disaggregated map (GIAM10<br />
km-28 classes; figure 15) and aggregated maps<br />
(GIAM10 km-8 classes, figure 16). GIAM10 km-<br />
28 classes provide information on irrigation type<br />
(surface water, groundwater and conjunctive<br />
use), irrigation intensity (single, double or<br />
continuous crop) and crop type. The 8 class<br />
map provides watering method, irrigation type<br />
and intensity. The 3 classes in <strong>the</strong> third map are<br />
surface water irrigation, groundwater irrigation<br />
and conjunctive use (surface water and<br />
groundwater) irrigation. The GIAM10 km-28 class<br />
map has a complex set <strong>of</strong> classes and provides<br />
an understanding <strong>of</strong> <strong>the</strong>ir distribution and class<br />
characteristics over time and space (table 3).<br />
The proportion <strong>of</strong> single, double and continuous<br />
cropping allows calculation <strong>of</strong> areas based on<br />
cropping intensities (i.e., single, double,<br />
continuous) leading to annualized areas<br />
(summation <strong>of</strong> areas from different seasons).<br />
The cropping intensities and calendars in table 3<br />
become more accurate if we look at individual<br />
countries or sub-national administrative units.<br />
<strong>Area</strong>s <strong>of</strong> Irrigation Derived from<br />
GIAM10 km <strong>Map</strong> V2.0<br />
The irrigated areas <strong>of</strong> <strong>the</strong> world were estimated<br />
by <strong>the</strong> three methods (section 7) and <strong>the</strong> results<br />
are presented here.<br />
First, <strong>the</strong> areas are determined using irrigated<br />
area fraction from GEE total 401 Mha, without<br />
any specific information on cropping intensity.<br />
The seasonal and annualized irrigated areas<br />
are determined using irrigated area fraction from<br />
<strong>the</strong> high-resolution imagery and sub-pixel<br />
decomposition technique (table 4a). For each <strong>of</strong><br />
<strong>the</strong> 28 classes (figure 15), we used <strong>the</strong> average<br />
IAF coefficients to calculate seasonal and<br />
annualized areas (summed over all seasons). The<br />
estimated total global irrigated areas for <strong>the</strong> 3<br />
seasons are (table 9a): a) 263 Mha for season 1,<br />
b) 176 Mha for season 2, and c) 41 Mha for<br />
season 3. The annualized global irrigated area at<br />
<strong>the</strong> end <strong>of</strong> <strong>the</strong> last millennium was 480 Mha.<br />
The areas have also been summarized for<br />
<strong>the</strong> 8 class map (table 4b).<br />
The major finding <strong>of</strong> <strong>the</strong> IWMI analysis is<br />
that <strong>the</strong> net (401 Mha) and <strong>the</strong> annualized (480<br />
Mha) cropped area under irrigation very<br />
significantly exceeds <strong>the</strong> estimates <strong>of</strong> equipped<br />
area (274 Mha) by FAO, due to <strong>the</strong> extent <strong>of</strong><br />
multiple cropping and private and communitydeveloped<br />
irrigation. The area estimates in <strong>the</strong><br />
map are derived for each characteristic<br />
agricultural system around <strong>the</strong> world (e.g., longseason<br />
winter-sown cereals in <strong>the</strong> nor<strong>the</strong>rn<br />
hemisphere; triple rice cropping in SE Asia; wet<br />
monsoon season (kharif) and dry winter (rabi)<br />
systems in <strong>the</strong> Indian subcontinent). The figure<br />
<strong>of</strong> 412 Mha <strong>of</strong> <strong>the</strong> total area available for<br />
irrigation equates <strong>the</strong> equipped area in FAO and<br />
o<strong>the</strong>r estimates (257 Mha to 274 Mha; see van<br />
Schilfgaarde 1994; Siebert et al. 2002, Siebert et<br />
al. 2005). The development <strong>of</strong> global irrigated<br />
area over <strong>the</strong> last two centuries is summarized<br />
in figure 17, with and without estimates <strong>of</strong><br />
cropping intensity. The presence <strong>of</strong> a large<br />
number <strong>of</strong> classes in GIAM10 km-28 classes<br />
(figure 15) ensures varying seasonality <strong>of</strong><br />
classes by taking more precise cropping<br />
calendars between nor<strong>the</strong>rn and sou<strong>the</strong>rn<br />
hemispheres, <strong>the</strong> tropics, and <strong>the</strong> higher<br />
latitudes. The aggregated map (figure 16 and<br />
table 9b) loses this distinction. The spatial<br />
characteristics <strong>of</strong> <strong>the</strong> GIAM class information<br />
can be visualized using <strong>the</strong> higher- resolution<br />
Landsat ETM+ resampled 150-m images, digital<br />
photographs, and Google Earth images from <strong>the</strong><br />
specific locations (figure 18). The GIAM class<br />
information, presented in this manner is <strong>of</strong><br />
considerable value for <strong>the</strong> user who would like to<br />
have a “visual picture” (figure 18a to f).<br />
27
Figure 15.<br />
GIAM10 km V2.0 28 class map.<br />
28
Figure 16.<br />
GIAM10 km V2.0 8 class map.<br />
29
Figure 17.<br />
Trends in irrigated area since 1800. The IWMI estimate (http://www.iwmigmia.org) at <strong>the</strong> end <strong>of</strong> <strong>the</strong> last millennium<br />
considered not only area irrigated but also <strong>the</strong> intensity (i.e., area irrigated during different seasons in a 12-month<br />
period and informal irrigation (e.g., groundwater, tanks). This gives an estimate <strong>of</strong> 263 million hectares (Mha) during<br />
<strong>the</strong> “main” cropping season (season 1) and a total <strong>of</strong> 480 Mha for three seasons: first crop (263 Mha), second crop<br />
(176 Mha), and continuous crop (41 Mha).<br />
<strong>Irrigated</strong> <strong>Area</strong>s <strong>of</strong> Continents,<br />
Countries and River Basins<br />
<strong>Irrigated</strong> areas were also calculated, based on<br />
combined IAF-HRI and IAF-SPDT, for <strong>the</strong><br />
continents (table 5a), <strong>the</strong> countries (table 5b), and<br />
<strong>the</strong> IWMI and Challenge Program benchmark river<br />
basins (table 5c).<br />
Of <strong>the</strong> 480 Mha annualized irrigated areas in<br />
<strong>the</strong> world, 78 percent (375 Mha) is in Asia, 8<br />
percent in Europe, 7 percent in North America, 4<br />
percent in South America, 2 percent in Africa and<br />
2 percent in Australia. The area distributions for<br />
<strong>the</strong> seasons follow similar trends (table 5a). In<br />
Europe and North America, <strong>the</strong> overwhelming<br />
proportion <strong>of</strong> irrigation is during <strong>the</strong> one main<br />
cropping season. In Asia, 154 Mha are irrigated in<br />
season 2 compared with 195 Mha during<br />
season 1. Surface water irrigation accounts for 61<br />
percent <strong>of</strong> global irrigation, with <strong>the</strong> remaining 39<br />
percent accounting for conjunctive use (surface<br />
water and groundwater) and groundwater. The<br />
surface water is well separated. The groundwater<br />
is <strong>of</strong>ten contained within (and <strong>of</strong>ten dominates)<br />
<strong>the</strong> conjunctive use class.<br />
Of <strong>the</strong> total global irrigated area <strong>of</strong> 480 Mha,<br />
China (31.5%) and India (27.5%) constitute a<br />
total <strong>of</strong> 59 percent (table 5b). The next countries<br />
have comparatively low percentage irrigated<br />
areas: USA (5%), Russia (3.5%) and Pakistan<br />
(3.3%). There are 9 countries (Argentina,<br />
Australia, Bangladesh, Kazakhstan, Myanmar,<br />
Thailand, Turkey, Uzbekistan and Vietnam) with<br />
1 to 2 percent. Brazil is ranked 15th with 0.85<br />
percent (table 5a). All o<strong>the</strong>r countries <strong>of</strong> <strong>the</strong><br />
world have less than 1 percent or less irrigated<br />
area. Forty countries have nearly 96 percent <strong>of</strong><br />
all annualized irrigated areas <strong>of</strong> <strong>the</strong> world (table<br />
5b). Normally, (see Droogers 2002; Postel 1999)<br />
India is considered <strong>the</strong> leading irrigated area<br />
country, closely followed by China. However,<br />
ourestimates show, China has 151 Mha <strong>of</strong><br />
annualized irrigated area with India having 132<br />
Mha. In <strong>the</strong> first season, China has 76 Mha and<br />
India 73 Mha, which is close. However, in <strong>the</strong><br />
30
Table 4a.<br />
<strong>Irrigated</strong> area fractions and irrigated areas from 3 methods. The sub-pixel areas (SPAs) are calculated for GIAM10 km-28 classes using irrigated area fractions (IAFs).<br />
<strong>Irrigated</strong> Total area Season 1 Season 1 Season 2 Season 2 Continuous Continuous <strong>An</strong>nualized<br />
area available for irrigated sub-pixel irrigated sub-pixel irrigated sub-pixel sum subfraction<br />
irrigation area <strong>Irrigated</strong> area irrigated area irrigated -pixel<br />
based on (TAAI) fraction area from fraction area from fraction area from irrigated<br />
Google (FPA* mean based on mean based mean based mean area<br />
Earth <strong>of</strong> IAF-GEE mean IAF-HRI on IAF-HRI on IAF-HRI from<br />
Class Class Full pixel estimate & & HRI + IAF-HRI & IAF-SPDT mean & IAF-SPDT mean & IAF-SPDT mean<br />
No. name area HRI+fallow fallow & IAF-SPDT IAF-HRI IAF-HRI IAF-HRI<br />
(FPA) (IAF-GEE & coefficient & IAF-SPDT & IAF-SPDT & IAF-SPDT<br />
HRI+fallow) coefficient coefficient<br />
coefficient<br />
hectares unitless hectares unitless hectares unitless hectares unitless hectares hectares<br />
1 <strong>Irrigated</strong>, surface water, single crop, wheat-corn-cotton 10679303 0.73 7795588 0.61 6496129 6496129<br />
2 <strong>Irrigated</strong>, surface water, single crop, cotton-rice-wheat 16958834 0.85 14461753 0.55 9378930 9378930<br />
3 <strong>Irrigated</strong>, surface water, single crop, mixed-crops 14225471 0.68 9689678 0.46 6552505 6552505<br />
4 <strong>Irrigated</strong>, surface water, double crop, rice-wheat-cotton 69927583 0.71 49779404 0.53 36762836 0.67 46810689 83573525<br />
5 <strong>Irrigated</strong>, surface water, double crop, rice-wheat-cotton-corn 74107732 0.63 46375254 0.56 41846166 0.52 38313697 80159863<br />
6 <strong>Irrigated</strong>, surface water, double crop, rice-wheat-plantations 51997087 0.72 37554189 0.58 29938425 0.48 24878752 54817177<br />
7 <strong>Irrigated</strong>, surface water, double crop, sugarcane 2661700 0.74 1978644 0.67 1778681 0.53 1422213 3200894<br />
8 <strong>Irrigated</strong>, surface water, double crop, mixed-crops 60653494 0.64 38998678 0.37 22573594 0.37 22339001 44912595<br />
9 <strong>Irrigated</strong>, surface water, continuous crop, sugarcane 116418 0.49 56932 0.42 49302 49302<br />
10 <strong>Irrigated</strong>, surface water, continuous crop, plantations 13537958 0.61 8251981 0.44 5913439 5913439<br />
11 <strong>Irrigated</strong>, ground water, single crop, rice-sugarcane 12896743 0.52 6714206 0.49 6312789 6312789<br />
12 <strong>Irrigated</strong>, ground water, single crop, corn-soybean 5999530 0.70 4182848 0.49 2917041 2917041<br />
13 <strong>Irrigated</strong>, ground water, single crop,rice and o<strong>the</strong>r crops 1573138 0.68 1065690 0.15 241994 241994<br />
14 <strong>Irrigated</strong>, ground water, single crop, mixed-crops 11811268 0.47 5596037 0.38 4522457 4522457<br />
15 <strong>Irrigated</strong>, ground water, double crop, rice and o<strong>the</strong>r crops 3569220 0.73 2594007 0.55 1957442 0.51 1807545 3764986<br />
16 <strong>Irrigated</strong>, conjunctive use, single crop, wheat-corn-soybean-rice 29947111 0.84 25105955 0.47 14007142 14007142<br />
17 <strong>Irrigated</strong>, conjunctive use, single crop, wheat-corn-orchards-rice 10602237 0.68 7218666 0.57 6052474 6052474<br />
18 <strong>Irrigated</strong>, conjunctive use, single crop, corn-soybeans-o<strong>the</strong>r crops 17728042 0.73 12860800 0.51 9075419 9075419<br />
19 <strong>Irrigated</strong>, conjunctive use, single crop, pastures 9151304 0.62 5672903 0.25 2287826 2287826<br />
20 <strong>Irrigated</strong>, conjunctive use, single crop, pasture, wheat, sugarcane 2521554 0.77 1942687 0.46 1162911 1162911<br />
21 <strong>Irrigated</strong>, conjunctive use, single crop, mixed-crops 17399815 0.77 13326514 0.57 9990422 9990422<br />
22 <strong>Irrigated</strong>, conjunctive use, double crop, rice-wheat-sugacane 72276584 0.67 48519345 0.49 35740789 0.43 31299478 67040267<br />
23 <strong>Irrigated</strong>, conjunctive use, double crop, sugarcane-o<strong>the</strong>r crops 1838672 0.69 1265539 0.39 720494 0.50 916271 1636766<br />
24 <strong>Irrigated</strong>, conjunctive use, double crop, mixed-crops 25785480 0.51 13072208 0.48 12477289 0.34 8710295 21187584<br />
25 <strong>Irrigated</strong>, conjunctive use, continuous crop, rice-wheat 15795426 0.51 8125903 0.47 7482989 7482989<br />
26 <strong>Irrigated</strong>, conjunctive use, continuous crop, rice-wheat-corn 16059416 0.69 11006705 0.50 7986163 7986163<br />
27 <strong>Irrigated</strong>, conjunctive use, continuous crop, sugarcane-orchards-rice 13052610 0.76 9938650 0.55 7187415 7187415<br />
28 <strong>Irrigated</strong>, conjunctive use, continuous crop, mixed-crops 23011703 0.81 18582955 0.56 12786104 12786104<br />
605,885,433 411,733,720 262,793,752 176,497,941 41,405,412 480,697,105<br />
31
Table 4b.<br />
<strong>Irrigated</strong> area fractions and irrigated areas from 3 methods. The sub-pixel areas (SPAs) are calculated for GIAM10 km 8 classes using irrigated area fractions (IAFs).<br />
<strong>Irrigated</strong> Total area Season 1 Season 1 Season 2 Season 2 Continuous Continuous <strong>An</strong>nualized<br />
area avaialable <strong>Irrigated</strong> sub-pixel <strong>Irrigated</strong> sub pixel <strong>Irrigated</strong> sub-pixel sum subfraction<br />
for irrigation area irrigated area irrigated area irrigated -pixel<br />
based on (TAAI) fraction area from fraction area from fraction area from irrigated<br />
Google (FPA* mean based mean based mean based mean area<br />
Earth <strong>of</strong> IAF- on IAF-HRI on IAF-HRI on IAF-HRI from<br />
Class Class Full pixel estimate & GEE & HRI + mean & IAF-SPDT mean & IAF-SPDT mean & IAF-SPDT mean<br />
No. name area HRI+fallow fallow IAF-HRI IAF-HRI IAF-HRI IAF-HRI<br />
(FPA) (IAF-GEE & & IAF-SPDT & IAF-SPDT & IAF-SPDT & IAF-SPDT<br />
HRI+fallow) coefficient coefficient<br />
coefficient<br />
hectares unitless hectares unmitless hectares unitless hectares unitless hectares hectares<br />
1 <strong>Irrigated</strong>, surface water, single crop 41863608 0.75 31591365 0.54 22427563 22427563<br />
2 <strong>Irrigated</strong>, surface water, double crop 259347595 0.69 178754813 0.54 132899702 0.51 133764352 266664054<br />
3 <strong>Irrigated</strong>, surface water, continuous crop 13654376 0.55 7500204 0.43 5962740 5962740<br />
4 <strong>Irrigated</strong>, ground water, single crop 32280679 0.59 19118438 0.38 13994279 13994279<br />
5 <strong>Irrigated</strong>, ground water, double crop 3569220 0.73 2594007 0.55 1957442 0.51 1807545 3764986<br />
6 <strong>Irrigated</strong>, conjunctive use, single crop 87350064 0.73 64069644 0.47 42576193 42576193<br />
7 <strong>Irrigated</strong>, conjunctive use, double crop 99900735 0.62 62156597 0.46 48938572 0.42 40926044 89864617<br />
8 <strong>Irrigated</strong>, conjunctive use, continuous crop 67919155 0.69 47013542 0.52 35442671 35442671<br />
605,885,433 412,798,611 262,793,752 176,497,941 41,405,412 480,697,105<br />
32
Table 5a.<br />
<strong>Irrigated</strong> areas <strong>of</strong> continets from GIAM10 km V 2.0 and o<strong>the</strong>r sources.<br />
SPA-HRI/SPDT: IWMI GIAM 10 km V 2.0 (actual irrigated area) 1 Percent <strong>of</strong> FAO/UF V3.0 2 (area<br />
Serial Country Season 1 Season 2 Continuous <strong>An</strong>nualized sum world total 3 equipped for irrigation)<br />
no. (name) (ha) (ha) (ha) (ha) (%) (ha)<br />
1 Africa 5,621,232 3,694,108 1,022,129 10,337,469 2.15 12,236,901<br />
2 Asia 194,567,156 153,788,757 26,312,408 374,668,320 77.94 192,478,089<br />
3 Australia 4 2,991,344 0 1,997,198 4,988,543 1.04 2,056,580<br />
4 Europe 25,757,317 7,717,676 4,644,948 38,119,940 7.93 19,710,263<br />
5 North America 22,334,236 6,456,566 3,093,179 31,883,980 6.63 36,558,227<br />
6 South America 8,066,107 3,367,433 5,612,052 17,045,592 3.55 10,102,130<br />
7 Oceania 68,146 58,034 15,505 141,686 0.03 581,254<br />
Note:<br />
1. Sub-pixel area from combined coefficients <strong>of</strong> high resolution images and sub-pixel decomposition technique.<br />
2. <strong>Area</strong> irrigated obtianed from FAO-Aquastat.(http://www.fao.org/ag/agl/aglw/aquastat/water_use/croppat.htm).<br />
3. <strong>World</strong> total was computed as per table 4a (480 m ha)<br />
4. Australian irrigated area was computed using <strong>the</strong> procedure described in annex 2.<br />
33
Table 5b.<br />
<strong>Irrigated</strong> areas <strong>of</strong> countries from GIAM10 km V 2.0 and o<strong>the</strong>r sources.<br />
Ranking SPA-GEE 1 (total area SPA-HRI/SPDT: IWMI GIAM 10 km V 2.0 (actual irrigated area) 2 Percent <strong>of</strong> FAO/UF V3.0 3 (area<br />
/ Serial Country available for irrigation) Season 1 Season 2 Continuous <strong>An</strong>nualized sum world total 4 equipped for irrigation)<br />
no. (name) (ha) (ha) (ha) (ha) (ha) (%) (ha)<br />
1 China 108,464,668 75,716,724 68,078,042 7,582,798 151,377,564 31.49 53,823,000<br />
2 India 99,758,291 72,661,809 53,728,631 5,961,653 132,352,093 27.53 57,291,407<br />
3 USA 27,593,858 18,187,246 4,009,305 2,122,793 24,319,345 5.06 27,913,872<br />
4 Russia 21,724,537 14,433,390 2,116,702 224,828 16,774,920 3.49 4,878,000<br />
5 Pakistan 13,169,652 7,904,691 7,310,581 761,592 15,976,865 3.32 14,417,464<br />
6 Argentina 8,867,096 3,603,392 1,606,411 3,559,386 8,769,190 1.82 1,437,275<br />
7 Thailand 6,457,890 3,231,776 2,211,410 1,960,171 7,403,357 1.54 4,985,708<br />
8 Bangladesh 5,125,146 3,905,840 3,095,460 207,678 7,208,978 1.50 3,751,045<br />
9 Turkey 5,974,186 2,761,592 1,760,856 2,035,164 6,557,613 1.36 4,185,910<br />
10 Kazakhstan 6,992,104 4,642,545 1,771,090 83,740 6,497,375 1.35 1,855,200<br />
11 Myanmar 4,332,698 3,374,777 2,811,490 148,298 6,334,565 1.32 1,841,320<br />
12 Uzbekistan 3,478,349 2,756,935 2,450,146 136,167 5,343,248 1.11 4,223,000<br />
13 Australia 5 12,491,207 2,991,344 0 1,997,198 4,988,543 1.04 2,056,580<br />
14 Vietnam 4,263,540 1,874,807 1,426,573 1,672,071 4,973,451 1.03 3,000,000<br />
15 Brazil 4,045,823 2,169,411 871,121 1,054,221 4,094,752 0.85 2,656,284<br />
16 Mexico 3,672,395 1,824,156 918,909 875,439 3,618,504 0.75 6,104,956<br />
17 Indonesia 3,042,001 1,226,109 720,339 1,387,312 3,333,760 0.69 4,459,000<br />
18 Egypt 2,086,783 1,635,864 1,492,034 165,802 3,293,700 0.69 3,245,650<br />
19 Spain 3,297,105 1,518,353 684,889 825,576 3,028,818 0.63 3,268,306<br />
20 Germany 2,243,204 1,645,822 1,320,932 40,618 3,007,371 0.63 531,120<br />
21 Canada 2,552,921 1,730,705 1,125,880 21,616 2,878,200 0.60 785,046<br />
22 France 2,392,733 1,253,032 832,465 609,042 2,694,538 0.56 2,000,000<br />
2 3 Italy 2,738,565 1,343,532 540,518 762,720 2,646,771 0.55 2,698,000<br />
24 Iraq 2,069,099 1,242,776 1,255,061 130,080 2,627,917 0.55 3,525,000<br />
25 Iran 2,449,769 1,314,261 680,080 500,407 2,494,749 0.52 6,913,800<br />
26 Japan 2,421,219 1,163,261 661,990 656,204 2,481,455 0.52 3,129,000<br />
27 Ukraine 2,897,304 1,641,055 262,150 493,691 2,396,895 0.50 2,454,000<br />
28 Korea, Dem.Rep 1,416,926 941,017 928,854 194,454 2,064,325 0.43 1,460,000<br />
29 Romania 2,284,667 1,135,323 317,566 609,086 2,061,974 0.43 2,880,000<br />
30 Turkmenistan 1,445,506 1,002,854 914,026 101,577 2,018,457 0.42 1,744,100<br />
31 Sudan 1,655,761 1,185,367 643,653 101,686 1,930,706 0.40 1,946,200<br />
32 Philipines 1,497,696 1,028,455 591,493 176,059 1,796,007 0.37 1,550,000<br />
33 Nepal 1,246,620 695,610 542,955 269,266 1,507,830 0.31 1,168,349<br />
34 Chile 1,406,997 703,642 346,252 396,457 1,446,351 0.30 1,900,000<br />
35 Korea, Rep. 1,158,106 554,327 441,120 337,394 1,332,841 0.28 880,365<br />
36 Morocco 980,306 579,448 460,976 114,810 1,155,234 0.24 1,258,200<br />
37 UK 928,027 812,560 233,964 15,958 1,062,483 0.22 142,687<br />
38 Ne<strong>the</strong>rlands 851,187 694,225 303,472 29,609 1,027,306 0.21 565,000<br />
39 Bulgaria 1,278,137 583,272 63,415 372,702 1,019,389 0.21 800,000<br />
40 Denmark 1,067,861 983,934 3,421 0 987,355 0.21 476,000<br />
Total 381,819,941 248,655,241 169,534,233 38,695,321 456,884,795 244,200,844<br />
34
Table 5c.<br />
<strong>Irrigated</strong> areas <strong>of</strong> river basins from GIAM10 km V 2.0 and o<strong>the</strong>r sources.<br />
SPA-GEE 1 (area SPA-HRI/SPDT: IWMI GIAM 10km V 2.0 (actual irrigated area) 2 <strong>An</strong>nualized FAO/UF V3.03 FAO Aquastat/<br />
Serial River basin available for irrigation) Season 1 Season 2 Continuous <strong>An</strong>nualized sum percent area equipped o<strong>the</strong>r statistics 4<br />
for irrigation irrigated area<br />
no. (name) (ha) (ha) (ha) (ha) (ha) (%) (ha) (ha)<br />
1 Ganges 36,520,277 25,955,033 21,539,002 1,817,605 49,311,641 39.59 24,668,871 26,873,9344a<br />
2 Indus 20,246,388 13,185,514 11,910,069 844,532 25,940,116 20.82 22,617,281 16,640,0004b<br />
3 Yellow 12,559,119 9,816,991 10,218,022 312,617 20,347,631 16.34 8,003,487 7,126,0004c<br />
4 Krishna 8,703,061 5,978,375 3,400,778 956,747 10,335,900 8.30 4,388,049 4,453,3004a<br />
5 Mekong 4,542,048 2,191,840 1,297,229 1,642,728 5,131,797 4.12 3,098,364 3,280,000<br />
6 Nile 3,581,753 2,755,680 1,988,472 219,334 4,963,486 3.98 4,557,015 5,500,000<br />
7 Syr Darya 3,270,329 2,573,307 2,221,862 137,653 4,932,822 3.96 3,105,308 3,461,4604d<br />
8 Rechna-doab 1,465,661 964,884 897,401 24,766 1,887,051 1.51 2,110,794 2,300,0004e<br />
9 São-Francisco 832,723 442,761 397,312 102,661 942,733 0.76 329,166 333,000<br />
10 Karhkeh 198,074 114,515 54,002 23,297 191,814 0.15 421,672 110,000<br />
11 <strong>An</strong>dean 164,080 87,965 47,396 28,116 163,477 0.13 229,285 3,087,000<br />
12 Ruhuna 76,821 38,843 24,417 22,316 85,577 0.07 52,256 N.A.<br />
13 Volta 34,516 8,636 7,165 18,217 34,018 0.03 11,382 N.A.<br />
14 Limpopo 171,078 151,887 9,916 1,293 163,096 0.13 204,224 244,000<br />
15 Olifants 145,644 133,173 0 0 133,173 0.11 57,004 107,0004<br />
Total 92,511,572 64,399,404 54,013,045 6,151,884 124,564,333 100 73,854,159 73,515,694<br />
Note:<br />
1. Sub-pixel area from coefficients <strong>of</strong> Google Earth estimate.<br />
2. Sub-pixel area from combined coefficients <strong>of</strong> high resolution images and sub-pixel decomposition technique.<br />
3. <strong>Area</strong> equipped for irrigation from Food and Agriculture Organization and University <strong>of</strong> Frankfurt Global <strong>Map</strong> <strong>of</strong> <strong>Irrigated</strong> <strong>Area</strong> Version 3.0 (Based on national statistics).<br />
4. <strong>Area</strong> irrigated obtained from FAO-Aquastat and o<strong>the</strong>r national statistics.<br />
4a. Includes surface + groundwater irrigation. Includes irrigated and supplemental. <strong>Area</strong>s are sub-pixel areas (SPA), leading to correct estimates <strong>of</strong> irrigated areas.<br />
The Global map is produced using a combination <strong>of</strong> fused datasets such as AVHRR, SPOT, GTOPO30, and rainfall data (Biggs et al. 2005, Thenkabail et al. 2005).<br />
4b IWMI Working Paper 24.<br />
4c Yellow River Conservancy Commission(YRCC 1990).<br />
4d http://www.cawater-info.net/syrdarya/watermanage_e.htm<br />
4e This is <strong>the</strong> total cultivated area in Rechna doab basin (http://www.iwmi.cgiar.org/benchmark/Rechnadoab.htm).<br />
35
second season China has 68 Mha and India<br />
54 Mha (table 5b). In “summer” <strong>the</strong>re are only<br />
about 7 Mha in China and even less in India<br />
(about 6 Mha). The irrigated area fraction (IAF) for<br />
<strong>the</strong> classes in China was higher leading to greater<br />
sub-pixel area. For example, class 4 (see figure<br />
15), which is mainly in China, has IAFs <strong>of</strong> 0.53<br />
and 0.67. Classes 8 and 24, two <strong>of</strong> <strong>the</strong> classes<br />
with significant map area have low IAFs. Class 8,<br />
for example, has IAFs <strong>of</strong> 0.37 for season 1 and<br />
season 2 bringing <strong>the</strong> sub-pixel area (SPA) down.<br />
Almost all previous irrigated area maps ei<strong>the</strong>r<br />
calculated areas based on FPA or from national<br />
statistics (which also <strong>of</strong>ten ignore fallow areas).<br />
The irrigated areas <strong>of</strong> continents and<br />
countries have been calculated based on <strong>the</strong><br />
cropping calendars and irrigated area fractions<br />
(IAFs) obtained from <strong>the</strong> global map (annexes 1<br />
and 2). Our expectation is that <strong>the</strong> calculation <strong>of</strong><br />
irrigated areas for <strong>the</strong> countries will be much<br />
more precise if cropping calendars are developed<br />
for individual countries and irrigated area fractions<br />
developed separately for every country. For this<br />
<strong>the</strong> GIAM team plans to work with national<br />
partners in 2007. However, we do not expect <strong>the</strong><br />
trends in irrigated areas to change and only small<br />
(probably + 10 percent) adjustments to irrigated<br />
areas (maintaining <strong>the</strong> present trend) are likely,<br />
especially for smaller countries.<br />
The irrigated areas <strong>of</strong> <strong>the</strong> IWMI and CP<br />
benchmark river basins have been reported in table<br />
5c. Maintaining <strong>the</strong> irrigated area trends <strong>of</strong> <strong>the</strong><br />
continents and countries, <strong>the</strong> river basins <strong>of</strong> Asia and<br />
in particular India and China, dominate in irrigated<br />
area percentages (see table 5c). The annualized<br />
areas in <strong>the</strong> Ganges are nearly 50 Mha and in <strong>the</strong><br />
Indus about 26 Mha and in <strong>the</strong> Yellow river about 20<br />
Mha. These are staggering figures, given a basin like<br />
Nile with nearly 6,000 years <strong>of</strong> irrigation history and<br />
only about 5 Mha <strong>of</strong> irrigated area.<br />
Accuracy Assessment <strong>of</strong> <strong>the</strong> GIAM10<br />
km <strong>Map</strong> V2.0 and Its Comparison with<br />
O<strong>the</strong>r <strong>Map</strong>s<br />
The accuracies were determined through two<br />
methods:<br />
• Groundtruth data<br />
• Google Earth data<br />
First, we discuss accuracies assessed using<br />
groundtruth data and follow that with accuracies<br />
determined using Google Earth data. Accuracies<br />
are assessed to determine whe<strong>the</strong>r <strong>the</strong> class<br />
mapped is irrigated or not.<br />
Accuracies and Errors <strong>of</strong> GIAM10 km <strong>Map</strong> V2.0<br />
Using Groundtruth Data<br />
There were two independent groundtruth data sets<br />
used in accuracy assessment: First, an 895 point<br />
groundtruth data collected by <strong>the</strong> GIAM team.<br />
Second, <strong>the</strong> 1,861 point groundtruth data from <strong>the</strong><br />
degree confluence project (DCP).<br />
Based on <strong>the</strong> GIAM team’s 895 points, <strong>the</strong><br />
accuracy <strong>of</strong> irrigated areas mapped as irrigated<br />
areas was 84 percent with a 16 percent error <strong>of</strong><br />
omission and a 21 percent error <strong>of</strong> commission<br />
(table 6a). In comparison, <strong>the</strong> FAO map showed<br />
an accuracy <strong>of</strong> 79 percent with 21 percent for<br />
errors <strong>of</strong> omission and commission (table 6a).<br />
With a DCP <strong>of</strong> 1,861 <strong>the</strong> accuracy reduces to 77<br />
percent but errors <strong>of</strong> omission and commission<br />
stay low at 23 percent. In comparison, <strong>the</strong> FAO/<br />
UF V3.0 map shows an accuracy <strong>of</strong> 70 percent<br />
and errors <strong>of</strong> omission and commission <strong>of</strong> 30<br />
percent (table 6a).<br />
Accuracies and Errors Using Google Earth<br />
Groundtruth (GEGT) Data for <strong>the</strong> <strong>World</strong><br />
The GEGT points are randomly distributed<br />
around <strong>the</strong> world, with a higher density <strong>of</strong><br />
distribution <strong>of</strong> points where irrigated area is<br />
dense. Accuracies using GEGT can be<br />
considered even better than <strong>the</strong> groundtruth data<br />
as a result <strong>of</strong>: a) better distribution <strong>of</strong> points<br />
around <strong>the</strong> world and b) precise spatial view <strong>of</strong><br />
<strong>the</strong> landscape in determining irrigation at 10-km<br />
scale which can <strong>of</strong>ten be unrealistic from <strong>the</strong><br />
ground.<br />
The GEGT determined <strong>the</strong> accuracy <strong>of</strong> GIAM<br />
irrigated area classes to be 92 percent with a<br />
very low error <strong>of</strong> omission <strong>of</strong> 8 percent and a low<br />
error <strong>of</strong> commission <strong>of</strong> 17 percent (table 6b). The<br />
FAO/UF V3.0 map had an accuracy <strong>of</strong> 79 percent<br />
36
Table 6a.<br />
Accuracy assessment <strong>of</strong> IWMI GIAM V2.0 versus FAO/FU V3.0 versus CBIP using groundtruth data. The IWMI global irrigated area map (GIAM) is compared with <strong>the</strong> a)<br />
global irrigated area map <strong>of</strong> <strong>the</strong> FAO/Frankfurt University and b) <strong>the</strong> map <strong>of</strong> India's Central Board <strong>of</strong> Irrigation and Power (CBIP).<br />
Level <strong>of</strong> Total Total Accuracy Errors <strong>of</strong> Errors <strong>of</strong><br />
accuracy groundtruth groundtruth <strong>of</strong> irrigated area omission commission<br />
assessment sample size sample size classes (irrigated GT points (nonirrigated GT points<br />
<strong>of</strong> irrigated and <strong>of</strong> irrigated (irrigated GT points falling on nonirrigated falling on irrigated<br />
nonirrigated areas areas falling on irrigated areas) areas) areas)<br />
(number) (number) (percent) (percent) (percent)<br />
I. Global map accuracy and errors<br />
1. GIAM 895 a 466 84 16 21<br />
1861 aa 726 77 23 23<br />
2. FAO/FU 895 a 436 79 21 29<br />
(>10% irrigated) 1861 aa 665 70 30 31<br />
II. India portion accuracy and errors<br />
3. GIAM for India 1041 b 568 86 14 20<br />
4. CBIP for India 1041 b 400 61 39 23<br />
5. FAO/FU for India 1041 b 500 76 24 26<br />
(>10% irrigated)<br />
Note:<br />
a. Groundtruth (GT) data points <strong>of</strong> <strong>the</strong> world for irrigated and nonirrigated areas collected by IWMI. The same data were used for identification <strong>of</strong> <strong>the</strong> classes. These are not independent data sets. The Google Earth data used in accuracy<br />
(table 6b) were completely independent. The GT data used in this table will provide supporting evidence to <strong>the</strong> completely independent Google Earth data.<br />
aa. GT data points <strong>of</strong> <strong>the</strong> world for irrigated and nonirrigated areas collected by IWMI and from <strong>the</strong> degree confluence project (DCP).<br />
Most <strong>of</strong> <strong>the</strong> points used in accuracy assessment were not used in class identification and labeling process. So this is mostly an independent data set.<br />
b. GT data points <strong>of</strong> <strong>the</strong> world for <strong>the</strong> irrigated areas collected by IWMI.<br />
bb. GT data points <strong>of</strong> <strong>the</strong> world for <strong>the</strong> irrigated areas collected by IWMI and DCP.<br />
37
Table 6b.<br />
Accuracy assessment <strong>of</strong> IWMI GIAM V2.0 Vs. FAO/FU V3.0 vs. CBIP using Google Earth groundtruth (GEGT). The IWMI global irrigated area map (GIAM) is compared with<br />
<strong>the</strong> a) global irrigated area map <strong>of</strong> <strong>the</strong> FAO/Frankfurt University and b) <strong>the</strong> irrigated area map <strong>of</strong> India's CBIP.<br />
Level <strong>of</strong> Total Total Accuracy Errors <strong>of</strong> Errors <strong>of</strong><br />
accuracy groundtruth groundtruth <strong>of</strong> irrigated area omission commission<br />
assessment sample size sample size classes (irrigated GT points (nonirrigated GT points<br />
<strong>of</strong> irrigated and <strong>of</strong> irrigated (irrigated GT points falling on nonirrigated falling on irrigated<br />
nonirrigated areas areas falling on irrigated areas) areas) areas)<br />
(number) (number) (percent) (percent) (percent)<br />
I. Global map accuracy and errors<br />
1. GIAM 670 a 321 91 9 17<br />
2. FAO/FU 670 a 321 79 21 11<br />
(>10% irrigated)<br />
II. India portion accuracy and errors<br />
3. GIAM for India 83 a 55 87 13 11<br />
4. CBIP for India 83 a 55 53 47 24<br />
5. FAO/FU for India 83 a 55 76 24 11<br />
(>10% irrigated)<br />
Note:<br />
a. groundtruth (GT) data points <strong>of</strong> <strong>the</strong> world for irrigated and nonirrigated areas collected by IWMI. The same data were used for identification <strong>of</strong> <strong>the</strong> classes. These are not independent data sets. The Google Earth data used in accuracy<br />
(table 6b) were completely independent. The GT data used in this table will provide supporting evidence to <strong>the</strong> completely independent Google Earth data.<br />
aa. GT data points <strong>of</strong> <strong>the</strong> world for irrigated and nonirrigated areas collected by IWMI and from <strong>the</strong> degree confluence project (DCP).<br />
Most <strong>of</strong> <strong>the</strong> points used in accuracy assessment were not used in class identification and labeling process. So this is mostly an independent data set.<br />
38
with higher errors <strong>of</strong> omission with 21 percent<br />
but lower errors <strong>of</strong> commission with 11 percent<br />
(table 6b).<br />
Accuracies and Errors for India in<br />
GIAM10 km V2.0 for India<br />
The accuracies and errors <strong>of</strong> <strong>the</strong> irrigated area<br />
classes were also determined for India for two<br />
main reasons: a) <strong>the</strong> groundtruth data for India<br />
are dense and well distributed as a result <strong>of</strong><br />
several GT missions, at various times, by <strong>the</strong><br />
GIAM team; and b) India is one <strong>of</strong> <strong>the</strong> two largest<br />
irrigating nations in <strong>the</strong> world. Accuracies and<br />
errors were determined for <strong>the</strong> IWMI GIAM10 km<br />
V2.0 India portion and compared with: a) FAO/UF<br />
V3.0 map and b) India’s CBIP map.<br />
The accuracy <strong>of</strong> GIAM V2.0 map in India<br />
was 86 percent with errors <strong>of</strong> omission <strong>of</strong> 14<br />
percent and errors <strong>of</strong> commission <strong>of</strong> 20 percent.<br />
In comparison <strong>the</strong> FAO/UF V3.0 map and India’s<br />
CBIP map have substantially low accuracies and<br />
higher errors <strong>of</strong> omission and commission (table<br />
6a). In comparison, <strong>the</strong> FAO/UF V3.0 map had<br />
an accuracy <strong>of</strong> 76 percent with 24 percent errors<br />
<strong>of</strong> omission and 26 percent errors <strong>of</strong><br />
commission. The CBIP map had a much lower<br />
accuracy at 61 percent and much higher errors<br />
<strong>of</strong> omission (39%) and errors <strong>of</strong> commission<br />
(23%). This is because <strong>the</strong> CBIP irrigated area<br />
map for India almost completely ignores<br />
groundwater irrigation, conjunctive (surface water<br />
plus groundwater) use within irrigated areas and<br />
<strong>the</strong> supplemental irrigated area as its focus is<br />
almost completely on large-scale surface water<br />
irrigated areas with some medium to small-scale<br />
surface water irrigated areas.<br />
The trends in accuracies and errors between<br />
GIAM V2.0, FAO/UF V3.0 and CBIP using <strong>the</strong><br />
Google Earth groundtruth (GEGT) remain <strong>the</strong><br />
same, with higher accuracies and lower errors in<br />
GIAM V2.0 (see table 6b).<br />
Accuracy Assessment Discussions<br />
Overall, <strong>the</strong> results show that <strong>the</strong> accuracies<br />
<strong>of</strong> <strong>the</strong> IWMI GIAM V2.0 were about 7 to 12<br />
percent higher than in FAO/UF V3.0. The<br />
errors <strong>of</strong> omission and commission were only<br />
slightly better in GIAM. The area calculations<br />
in <strong>the</strong> two maps differ significantly since IWMI<br />
GIAM uses: a) intensity <strong>of</strong> irrigation to obtain<br />
irrigated areas based on seasons, and b) subpixel<br />
decomposition techniques to obtain <strong>the</strong><br />
irrigated fraction within a pixel. The areas are<br />
reported directly from country statistics and<br />
<strong>the</strong> spatial distribution <strong>of</strong> irrigation is “adjusted”<br />
to fit <strong>the</strong> country statistics, using known<br />
extents <strong>of</strong> surface irrigation and o<strong>the</strong>r<br />
secondary information. India’s CBIP<br />
underestimates irrigation since, largely, it<br />
ignores informal (e.g., groundwater) irrigation.<br />
For <strong>the</strong> India portion GIAM10 km V2.0 map<br />
accuracies and errors were significantly better<br />
statistically than those <strong>of</strong> FAO/UF V3.0 and<br />
CBIP (table 6a and 6b), which is to be<br />
expected given <strong>the</strong> extent <strong>of</strong> groundtruth data<br />
collected. Especially, <strong>the</strong> errors <strong>of</strong> omission<br />
and commission were much better, among<br />
o<strong>the</strong>r things indicating that IWMI GIAM is<br />
picking <strong>the</strong> informal (e.g., small reservoirs,<br />
tanks, groundwater) irrigation better.<br />
There are fundamental issues related to<br />
accuracy assessments at such large scales as 1-<br />
km or 10-km resolution pixel size. There are<br />
considerable difficulties in groundtruthing and<br />
establishing <strong>the</strong> exact percent <strong>of</strong> area irrigated in<br />
a 1-km x 1-km (100 ha) and, especially, at 10 km<br />
x 10 km (or 10,000 ha) resolutions. For example,<br />
when GT data are collected in a portion <strong>of</strong> a pixel<br />
that has land cover o<strong>the</strong>r than irrigation and has<br />
irrigation in patches (say 25% <strong>of</strong> pixel area), we<br />
may not even see irrigated portions during GT<br />
data collection. This will lead to <strong>the</strong> pixel being<br />
labeled “o<strong>the</strong>r LULC” in GT data whereas in reality<br />
it has 25 percent irrigation. Satellite sensors<br />
capture <strong>the</strong> average reflectivity from <strong>the</strong> pixel and<br />
hence are influenced by both <strong>the</strong> irrigated as well<br />
as nonirrigated components within <strong>the</strong> pixel<br />
leading to an average spectrum for <strong>the</strong> pixel.<br />
Whereas satellite data distinctly show <strong>the</strong><br />
difference in a pixel with zero irrigation and one<br />
with 25 percent irrigation, GT data <strong>of</strong>ten fail to do<br />
so. This will lead to situations such as, for<br />
example: a) rain-fed GT points falling on a pixel<br />
39
mapped as o<strong>the</strong>r LULC (errors <strong>of</strong> omission). This<br />
can lead to somewhat higher omission and<br />
commission errors. The phenomenon is acute when<br />
dealing with pixels <strong>of</strong> low percent (
A Discussion on <strong>Map</strong>ping<br />
<strong>Irrigated</strong> <strong>Area</strong>s and Comparison<br />
<strong>of</strong> <strong>Map</strong>s<br />
<strong>Irrigated</strong> area maps <strong>of</strong> IWMI GIAM10 km V2.0,<br />
Food and Agricultural Organization\University <strong>of</strong><br />
Frankfurt (FAO/UF) V3.0, and India’s CBIP maps<br />
are compared and discussed. We shall begin with<br />
detailed illustrations <strong>of</strong> comparisons in India<br />
where we have detailed groundtruth data collected<br />
by <strong>the</strong> GIAM team and very reliable and detailed<br />
maps from <strong>the</strong> CBIP. The extensive groundtruth<br />
data collected during <strong>the</strong> field campaigns were<br />
invaluable in <strong>the</strong>se comparisons.<br />
Major Irrigation<br />
First, we shall illustrate a comparison <strong>of</strong> maps for<br />
major irrigation. The CBIP map, basically,<br />
represents major irrigated areas (leaving out<br />
informal irrigation) and is considered accurate for<br />
major command area irrigation. For <strong>the</strong> purpose <strong>of</strong><br />
comparison we took five random groundtruth (GT)<br />
points falling within <strong>the</strong> CBIP map (figure 18b)<br />
and overlaid <strong>the</strong>m on <strong>the</strong> IWMI GIAM10 km V2.0<br />
for India (figure 18a) and CBIP irrigated area map<br />
for India (figure 18b). According to GT data, two<br />
were informal (tank, groundwater) irrigation, one<br />
was major irrigation, one naturally irrigated and<br />
one rain-fed. The GIAM10 km classes (figure<br />
18a) showed three informal (two conjunctive and<br />
one groundwater) and two surface water. The<br />
CBIP (figure 18b) showed all points as major<br />
irrigation. These results clearly implied that <strong>the</strong><br />
GIAM10 km has a closer match with ground<br />
reality in terms <strong>of</strong> type <strong>of</strong> irrigation.<br />
Figure 18.<br />
Evaluation <strong>of</strong> <strong>the</strong> GIAM for large-scale, small-scale, informal and supplemental irrigation. The IWMI GIAM and India’s<br />
Central Board <strong>of</strong> Irrigation and Power (CBIP) irrigated area maps are evaluated for: a) large-scale irrigation- (figures<br />
18a,b); b) informal irrigation such as groundwater and tanks (figures 18 c,d); and c) small-scale (e.g., minor reservoirs)<br />
irrigation (figures 18e,f).<br />
41
Informal Irrigation<br />
Next, we illustrate how well <strong>the</strong> informal irrigation<br />
(e.g., small reservoirs, tanks, groundwater) is<br />
captured between maps. For this purpose, we<br />
randomly selected five GT points with informal<br />
irrigation. The CBIP map missed all <strong>the</strong> randomly<br />
selected groundwater check points (figure 18c).<br />
The GIAM10 km V2.0 identified all <strong>of</strong> <strong>the</strong>m—<br />
three as conjunctive and one as groundwater<br />
irrigation (figures 18c and 18d). This is very close<br />
to groundtruth data which also had three<br />
supplemental irrigated area classes. Finally,<br />
identification <strong>of</strong> small-scale irrigation from minor<br />
reservoirs and groundwater is illustrated in figure<br />
18e for CBIP and figure 18f for IWMI GIAM10 km<br />
V2.0. Of <strong>the</strong> five randomly chosen GT points (two<br />
irrigated small scale, one irrigated large scale and<br />
two rain-fed) CBIP missed all (figure 18e)<br />
whereas GIAM mapped three as conjunctive and<br />
two outside. It actually mapped two correctly as<br />
informal irrigation, and one rain-fed correctly as<br />
“outside” irrigated areas. Of <strong>the</strong> o<strong>the</strong>r two points,<br />
it mapped a rain-fed class as informal irrigation,<br />
and informal irrigation as “outside irrigated area,”<br />
leading to some errors <strong>of</strong> omission and<br />
commission. However, as we see in figure 18a<br />
through 18f, informal irrigation is well captured in<br />
GIAM10 km.<br />
42
Comparing Global Products in India<br />
The comparison between FAO/UF global irrigated<br />
area map and GIAM10 km V2.0 highlights <strong>the</strong><br />
distinct features <strong>of</strong> areas where <strong>the</strong> two maps: a)<br />
perfectly match (e.g., figure 19a in <strong>the</strong> Upper<br />
Ganges basin), b) broadly match (e.g., figure 19b<br />
in <strong>the</strong> Cauvery delta), and c) do not match at all<br />
(e.g., figure 19c in <strong>the</strong> Ganges delta). This<br />
illustration is a “representative” comparison <strong>of</strong> <strong>the</strong><br />
two global irrigated area maps as we see similar<br />
trends in o<strong>the</strong>r places <strong>of</strong> <strong>the</strong> world.<br />
Figure 19 (a, b and c).<br />
Comparison <strong>of</strong> <strong>the</strong> two global irrigated area maps: GIAM10 km V2.0 and FAO/FU V3.0.<br />
45
<strong>Irrigated</strong> <strong>Area</strong> Class Names<br />
At this stage it is useful to discuss <strong>the</strong> issues<br />
involved in final class labeling and <strong>the</strong> approach<br />
used in IWMI GIAM10 km V2.0. Classes were<br />
named based on a set protocol and rigorous<br />
methods (see figure 4) that had a clear classnaming<br />
convention (figure 9). In addition, <strong>the</strong> final<br />
class labeling (see figures 15 and 16) was also<br />
based on consultation with irrigation experts so<br />
that <strong>the</strong> class names represent <strong>the</strong> commonly<br />
understood meaning <strong>of</strong> a particular irrigation type.<br />
More generic and detailed names are provided in<br />
GIAM10 km-28 classes (figure 15), and simpler<br />
and broadly understood names are provided in<br />
GIAM10 km-8 classes (figure 16).<br />
The final class labeling was categorized<br />
under <strong>the</strong> following groups:<br />
• irrigated, surface water, single crop, crop type<br />
or dominance<br />
• irrigated, surface water, double crop, crop<br />
type or dominance<br />
• irrigated, surface water, continuous crop, crop<br />
type or dominance<br />
The watering method (irrigated or rain-fed) and<br />
irrigation type (surface water, groundwater or<br />
conjunctive use) are determined based on <strong>the</strong><br />
protocols and methods (see figure 4 and sections<br />
4, 5 and 6). The single, double or continuous crop<br />
is determined based on <strong>the</strong> spectral signature for<br />
every class based on time-series satellite<br />
imagery (see example for class 1 and 4 in figure<br />
20). The same classes 1 and 4 also occur in Iran<br />
showing somewhat different signature<br />
characteristics (in magnitude and timing <strong>of</strong> peaks<br />
and lows). Indeed, it is possible to get a cropping<br />
calendar for every pixel <strong>of</strong> irrigated area classes<br />
by simply clicking on any point on irrigated area<br />
class and looking through <strong>the</strong> time-series imagery<br />
<strong>of</strong> a mega-file as we have done in figures 20 and<br />
Figure 20.<br />
Single crop (red) and double crop (cyan) irrigation in <strong>the</strong> lower Ganges.<br />
46
21. The final variable (crop type or dominance) in<br />
naming is based on groundtruth data and<br />
literature.<br />
This convention is repeated for groundwater<br />
and conjunctive use irrigation.<br />
In figure 15, classes 1-10 are surface water<br />
irrigation, classes 11-15 are groundwater irrigation,<br />
and classes 16-28 are conjunctive use irrigation.<br />
These classes were combined appropriately to<br />
produce <strong>the</strong> simplified eight-class irrigated area<br />
map (see figure 16).<br />
The class labeling process <strong>of</strong> one class has<br />
been discussed in detail. First, we go through a<br />
normal protocol (figure 8), methods (sections 5<br />
and 6), and class naming convention (figure 9). In<br />
addition, <strong>the</strong> detailed approach to name a class is<br />
illustrated below for one class. Class 28 (figure<br />
22) was labeled “irrigated, conjunctive use,<br />
continuous crop, mixed crop” in GIAM10 km-28<br />
class map (figure 15). It occurs mainly in <strong>the</strong><br />
Pampas <strong>of</strong> Argentina, which is predominantly<br />
rain-fed. However, different degrees <strong>of</strong><br />
Figure 21.<br />
Double crop (left) and single crop (right) irrigation in Zayandeh and Rud.<br />
47
Figure 22.<br />
Evaluation <strong>of</strong> GIAM for conjunctive irrigation. The rain-fed class with significant central pivot supplemental irrigation<br />
in <strong>the</strong> Pampas in Argentina.<br />
supplemental groundwater irrigation (e.g., pivots,<br />
drip) and some pumping from rivers also exist.<br />
Center-pivot irrigation is used in humid plains <strong>of</strong><br />
Pampas to supplement rainfall (Maletta 1998,<br />
1999).<br />
The spectral characteristics <strong>of</strong> <strong>the</strong> class<br />
show near continuous cropping, with AVHRR<br />
NDVI greater than 0.35 or more throughout <strong>the</strong><br />
year (figure 22). Rainfall during May-September is<br />
low, averaging less than 40 mm per month (see<br />
figure 22) and is insufficient to sustain such high<br />
vegetation in an agricultural belt. The Pampas is<br />
a humid plain, which is very flat and is poorly<br />
drained. This and man-made obstacles such as<br />
roads and railroad embankments lead to flooding<br />
and waterlogging for months, favoring growth <strong>of</strong><br />
weeds and natural pasture in <strong>the</strong> vicinity even<br />
during relatively dry spells (Maletta personnel<br />
communication). The long period <strong>of</strong> deficit rainfall<br />
and continuously high NDVI strongly imply some<br />
degree <strong>of</strong> irrigation.<br />
Evidence (Maletta personal communication)<br />
from <strong>the</strong> field suggests that center-pivot<br />
irrigation in <strong>the</strong> Pampas is mostly used for<br />
complementary irrigation while drip irrigation is<br />
used for horticulture. Maletta summarizes <strong>the</strong><br />
situation: “There is indeed a need to irrigate<br />
more, as witnessed by <strong>the</strong> fact that average<br />
yields (especially for maize) are quite below<br />
potential. But a) massive use <strong>of</strong> irrigation is not<br />
yet happening, b) aquifers may not support such<br />
an extensive use <strong>of</strong> underground water, and c)<br />
gravity irrigation is in general difficult due to very<br />
flat land, thus requiring pumping (which is not<br />
generally done) from <strong>the</strong> many streams flowing<br />
through <strong>the</strong> plains.” The data from <strong>the</strong><br />
Government administration (http://<br />
www.indec.mecon.ar/) show nearly 1.4 Mha are<br />
48
irrigated. These do not account for an occasional<br />
irrigation (e.g., one or two irrigations during <strong>the</strong><br />
cropping period, during deficit rainfall periods) or<br />
informal (individual farmers irrigating without<br />
governmental knowledge mainly through<br />
groundwater pumping). Overall, <strong>the</strong> Pampas<br />
region depends on rainfall, but has a significant<br />
proportion <strong>of</strong> irrigated land (pivots, drip, river<br />
pumps), humid flat waterlogged regions and<br />
scattered informal irrigation. These<br />
characteristics lead <strong>the</strong> class to be named<br />
“conjunctive use.” In <strong>the</strong> past, irrigated area<br />
maps only included areas with formal canal<br />
networks and major works such as reservoirs or<br />
barrages. But many parts <strong>of</strong> <strong>the</strong> world have<br />
various levels <strong>of</strong> irrigation that need to be<br />
accounted for, to obtain a realistic estimate <strong>of</strong><br />
actual irrigated areas.<br />
GIAM10 km V2.0 Products and<br />
Dissemination<br />
The IWMI GIAM10 km V2.0 data and products<br />
are distributed via a dedicated web page at http://<br />
www.iwmigiam.org. The web page consists <strong>of</strong><br />
GIAM10 km V2.0 products at global level mapped<br />
at 1-10 km and include maps, images, class<br />
characteristics, area calculations, snapshots<br />
(high-resolution images) and photos, animations,<br />
and accuracies. The products are made available<br />
at nominal resolution <strong>of</strong> approximately 1 km since<br />
all data were resampled and analyzed at 1-km<br />
scale. However, we urge <strong>the</strong> users to treat it as a<br />
nominal 10 km 2 since <strong>the</strong> overwhelming proportion<br />
<strong>of</strong> <strong>the</strong> data used in analysis were at this scale.<br />
But it must be noted that a significant proportion<br />
<strong>of</strong> <strong>the</strong> mega data used in <strong>the</strong> analysis included<br />
SPOT time series for 1999 and GTOPO30 at 1-<br />
km. The GIAM10 km map was also available for<br />
Google Earth. Please download GIAMv2.kmz file<br />
from <strong>the</strong> home page <strong>of</strong> GIAM main site (http://<br />
www.iwmigiam.org)<br />
The primary GIAM10 km V2.0 products are:<br />
• GIAM10 km V2.0 28 class map (GIAM10 km-<br />
28 classes)<br />
• GIAM10 km V2.0 8 class map (GIAM10 km-8<br />
classes)<br />
• GIAM10 km V2.0 3 class map (GIAM10 km-3<br />
classes)<br />
The website contains three o<strong>the</strong>r global<br />
agricultural products and <strong>the</strong>ir associated<br />
documentation:<br />
• Global map <strong>of</strong> rain-fed cropped areas<br />
(GMRCA)<br />
• Disaggregated 273 class map<br />
• Aggregated 22 and 8 class map<br />
• Global map <strong>of</strong> all land use/land cover (LULC)<br />
areas (GMLULCA)<br />
• Disaggregated 73 class map<br />
• Aggregated 12 class map<br />
• Global IWMI generic 951 class map (Generic-<br />
IWMI-951)<br />
49
Conclusions<br />
IWMI has produced a global irrigated area map at<br />
10-km scale (GIAM10 km V2.0) for <strong>the</strong> end <strong>of</strong> <strong>the</strong><br />
last millennium, using remote sensing data. The<br />
total annualized irrigated areas <strong>of</strong> <strong>the</strong> world are<br />
480 Mha. Globally, <strong>the</strong> total area available for<br />
irrigation is 412 Mha (nearest equivalent <strong>of</strong> FAO’s<br />
equipped area for irrigation). <strong>An</strong>nualized area<br />
takes into consideration irrigated areas during<br />
different seasons over <strong>the</strong> same areas within a<br />
given year. Of <strong>the</strong> total annualized area <strong>of</strong> 480<br />
Mha, a total <strong>of</strong> 75 percent (375 Mha) <strong>of</strong> all<br />
irrigated areas <strong>of</strong> <strong>the</strong> world is in Asia, followed by<br />
Europe with 8 percent, North America with 7<br />
percent, South America 4 percent, Africa 2<br />
percent and Australia 2 percent. The irrigated<br />
areas that spread across <strong>the</strong> season are: a) 263<br />
Mha for season 1, b) 176 Mha for season 2, and<br />
c) 41 Mha for continuous.<br />
Two countries, China and India, toge<strong>the</strong>r have<br />
a staggering 59 percent (284 Mha) <strong>of</strong> all <strong>the</strong><br />
global annualized irrigated areas. Of <strong>the</strong> 59<br />
percent, China has 31.5 percent and India 27.5<br />
percent. China has an annualized area <strong>of</strong> 151<br />
Mha and India 132 Mha. The first or <strong>the</strong> major<br />
cropping seasonal areas follow a pattern similar<br />
to annualized areas. China and India have<br />
extensive double cropping. In <strong>the</strong> first season,<br />
China has 76 Mha irrigated, followed by 68 Mha<br />
in <strong>the</strong> second season. In India, <strong>the</strong> area irrigated<br />
is 73 Mha in <strong>the</strong> first season and 54 Mha in <strong>the</strong><br />
second season. The next leading irrigated area<br />
countries (as a percentage <strong>of</strong> <strong>the</strong> global<br />
annualized sum <strong>of</strong> 480 Mha) are USA (5%),<br />
Russia (3.5%) and Pakistan (3.3%). There are<br />
nine countries (Argentina, Australia, Bangladesh,<br />
Kazakhstan, Myanmar, Thailand, Turkey,<br />
Uzbekistan and Vietnam) having between 1 and 2<br />
percent. Every o<strong>the</strong>r country in <strong>the</strong> world,<br />
individually, has less than 1 percent area<br />
irrigated. The 40 leading irrigated area countries<br />
have nearly 96 percent <strong>of</strong> all irrigation in <strong>the</strong><br />
world. Surface-water irrigation is 61 percent and<br />
<strong>the</strong> rest (39%) is conjunctive (surface water and<br />
groundwater) or pure groundwater.<br />
There are two global irrigated area<br />
mapsproduced by <strong>the</strong> GIAM team: GIAM10 km<br />
28 class map and GIAM10 km 8 class map. The<br />
classes represent a) irrigation by surface water,<br />
groundwater and conjunctive use; b) cropping<br />
intensity (e.g., single crop, double crop and<br />
continuous crop) is provided for every class; and<br />
c) crop type or dominance. The accuracy <strong>of</strong><br />
mapping irrigated areas was determined using<br />
three independent data sets—two groundtruth<br />
data sets and one Google Earth estimate data<br />
set. The accuracies varied between 84 and 91<br />
percent, <strong>the</strong> errors <strong>of</strong> omission less than 16<br />
percent, and errors <strong>of</strong> commission less than 21<br />
percent. The results <strong>of</strong> our study were compared<br />
with <strong>the</strong> irrigated area map statistics <strong>of</strong> <strong>the</strong> Food<br />
and Agricultural Organization <strong>of</strong> <strong>the</strong> United<br />
Nations (FAO) and <strong>the</strong> University <strong>of</strong> Frankfurt<br />
(UF) version 3.0 (FAO/UF V3.0). The FAO/UF<br />
used national statistics and GIS techniques to<br />
derive irrigated areas. FAO/UF V3.0 determined<br />
“area equipped for irrigation” (but not necessarily<br />
irrigated) for <strong>the</strong> world as 274 Mha which is quite<br />
different from GIAM10 km V2.0 TAAI <strong>of</strong> 412<br />
Mha.<br />
The key achievements <strong>of</strong> <strong>the</strong> GIAM10 km<br />
V2.0 work have been:<br />
1. Methodology development. A comprehensive<br />
set <strong>of</strong> methods and techniques for mapping<br />
irrigated areas <strong>of</strong> <strong>the</strong> world using remote<br />
sensing data at various scales or where pixel<br />
resolution has been developed; see also work<br />
by Thenkabail, et al. (2005a, 2006) and<br />
Biggs et al. (2006):<br />
1.1 Advances in approaches and data sets.<br />
Mega-file compositions through fusion <strong>of</strong><br />
multi-resolution time-series imagery.<br />
1.2 Advances in methods. Hyper-spectral<br />
techniques for multispectral time-series<br />
mega-file imagery. The methods include<br />
spectral matching techniques (SMTs)<br />
and space-time spiral curves.<br />
1.3 Class identification and labeling.<br />
Rigorous strategies for class<br />
identification and labeling have been<br />
developed. Strategies for resolving<br />
50
mixed classes through GIS modeling, in<br />
which a wide array <strong>of</strong> secondary data<br />
sets have been used, have been<br />
established.<br />
1.4 Sub-pixel areas (SPAs) and irrigated<br />
area fractions (IAFs). Innovative subpixel<br />
area (SPA) calculation methods<br />
using irrigated area fractions (IAF) have<br />
been developed. Three IAF methods<br />
were developed: a) IAF, based on GEE,<br />
b) IAF, based on high-resolution imagery<br />
(HRI), and c) IAF, based on <strong>the</strong> subpixel<br />
decomposition technique.<br />
Generally, <strong>the</strong> areas calculated from<br />
remote sensing are, almost always,<br />
reported as full pixel areas (FPAs). But<br />
<strong>the</strong> correct areas can be obtained only<br />
through SPA. This is especially true in<br />
coarser resolution imagery. Development<br />
<strong>of</strong> practical methods to obtain SPAs<br />
through IAFs is, <strong>the</strong>reby, a highly<br />
significant achievement.<br />
2. <strong>An</strong>nualized areas (or intensity <strong>of</strong> irrigation) and<br />
irrigated area fractions (IAFs). The study<br />
determined and provided IAFs through three<br />
methods. The irrigated area fractions from <strong>the</strong><br />
Google Earth estimate (IAF-GEE) when used to<br />
multiply <strong>the</strong> full pixel areas (FPAs) provide total<br />
area available for irrigation (TAAI). The IAF from<br />
high resolution imagery (IAF-HRI) and sub-pixel<br />
decomposition technique (IAF-SPDT) can be<br />
obtained for different seasons (e.g., season 1<br />
crops, season 2 crops and so on). The<br />
seasonal IAF coefficients helped determine<br />
irrigated areas <strong>of</strong> every class for season 1,<br />
season 2, and continuous. <strong>An</strong>nualized (or<br />
intensity) is summation <strong>of</strong> season 1, season 2,<br />
and continuous. The coefficients <strong>of</strong> IAF-HRI<br />
and IAF-SPDC were combined to provide more<br />
robust SPAs. The annualized areas are unique.<br />
The ability to determine annualized areas has<br />
huge implications for <strong>the</strong> intensity <strong>of</strong> irrigation in<br />
a given land and <strong>the</strong> implications in determining<br />
<strong>the</strong> quantum <strong>of</strong> food production and water<br />
consumption.<br />
3. Informal irrigation. The GIAM10 km<br />
demonstrated <strong>the</strong> ability to map informal<br />
irrigation (i.e., irrigation from minor reservoirs,<br />
tanks and groundwater) well. This is<br />
especially crucial given <strong>the</strong> quantum <strong>of</strong><br />
informal irrigation in <strong>the</strong> world, especially from<br />
millions <strong>of</strong> tube wells.<br />
4. Crop characteristics. Every class (or for that<br />
matter every pixel within a class) will have its<br />
own characteristics in terms <strong>of</strong> its vegetation<br />
dynamics and seasonality. GIAM10 km<br />
product is not just a map. It is a dynamic<br />
tool from which one can study variables such<br />
as cropping calendars, crop growth stages,<br />
biomass levels and fraction <strong>of</strong> areas irrigated.<br />
5. Precise location <strong>of</strong> irrigated areas. Most<br />
irrigated area maps provide areas without<br />
showing precise location <strong>of</strong> irrigated areas.<br />
For example, an entire state or country is<br />
<strong>of</strong>ten shown to have a certain percentage<br />
area irrigated without showing where exactly it<br />
is. The GIAM10 km map provides precise<br />
location with errors <strong>of</strong> omission (less than<br />
16%) and commission (less than 21%).<br />
6. Product line. GIAM data and products are<br />
made accessible online free <strong>of</strong> charge as a<br />
global public good (GPG) from anywhere in<br />
<strong>the</strong> world (http://www.iwmigiam.org). The<br />
products consist <strong>of</strong>, for example, irrigated<br />
area maps, statistics, 20-year every month<br />
animations, snapshots <strong>of</strong> higher-resolution<br />
imagery to help visualization <strong>of</strong> classes,<br />
class characteristics, irrigated area fractions<br />
for area calculations, methods and data sets.<br />
Particular strengths <strong>of</strong> this work are in: a)<br />
establishing seasonal and annualized irrigated<br />
areas (or intensity <strong>of</strong> irrigation), b) mapping<br />
informal irrigation (e.g., small reservoirs, tanks,<br />
groundwater) in addition to conventional surface<br />
water irrigation, c) determining irrigated crop<br />
calendar, d) studying historical (e.g., last 20<br />
years, every month) biomass dynamics for every<br />
irrigated area class and for every pixel within that<br />
class. By-products <strong>of</strong> GIAM include global maps<br />
<strong>of</strong> rain-fed agriculture and land use/land cover.<br />
51
Within <strong>the</strong> scope <strong>of</strong> <strong>the</strong> GIAM project,<br />
irrigated areas are also mapped at 500-m<br />
resolution for India, as a start, and 30-m<br />
resolution for <strong>the</strong> Ruhuna basin in Sri Lanka and<br />
Krishna basin in India.<br />
Currently, IWMI is in <strong>the</strong> process <strong>of</strong> developing<br />
a joint vision and strategy with FAO/UF on GIAM.<br />
We are also developing partnerships and<br />
collaborations with <strong>the</strong> national governments and<br />
institutes. To that end, work continues on <strong>the</strong><br />
development <strong>of</strong> techniques to map and test <strong>the</strong><br />
accuracy <strong>of</strong> classification across <strong>the</strong> full extent <strong>of</strong><br />
<strong>the</strong> Indian subcontinent (Pakistan, India,<br />
Bangladesh) and Sri Lanka, covering a range <strong>of</strong><br />
agro-ecologies and degrees <strong>of</strong> difficulty for remote<br />
sensing (in terms <strong>of</strong> cloud cover, heterogeneity and<br />
scale <strong>of</strong> landscapes and land use). The work is<br />
expected to be expanded to China and o<strong>the</strong>r<br />
countries. A Consortium for <strong>Irrigated</strong> <strong>Area</strong> <strong>Map</strong>ping<br />
and Assessment (CIAMA) is expected to be set<br />
up, with an array <strong>of</strong> international partners, during<br />
<strong>the</strong> GIAM2006 <strong>International</strong> Workshop to be held<br />
in Colombo, Sri Lanka.<br />
The team seeks feedback from all users,<br />
readers and interested parties, and continues to<br />
harvest groundtruth data to verify and upgrade <strong>the</strong><br />
map. The team welcomes any feedback on <strong>the</strong><br />
methods and results, and actively seeks to<br />
expand <strong>the</strong> available groundtruth in order to build<br />
a global groundtruth database within <strong>the</strong><br />
IWMIDSP (http://www.iwmidsp.org). All <strong>the</strong><br />
imagery and documentation associated with<br />
GIAM are made available through <strong>the</strong> dedicated<br />
portal: http://www.iwmigiam.org. The products<br />
consist <strong>of</strong> maps, images, class characteristics,<br />
area calculations, snapshots, animations, and<br />
accuracies. It is our hope that <strong>the</strong>se products<br />
will, in time, be a useful resource for <strong>the</strong> remote<br />
sensing and water management community, both<br />
for researchers and practitioners.<br />
52
<strong>An</strong>nexure<br />
<strong>An</strong>nex 1 Table 1.<br />
<strong>Irrigated</strong> areas <strong>of</strong> countries from GIAM10km V 2.0 and o<strong>the</strong>r sources<br />
Ranking SPA-GEE 1 (total area SPA-HRI/SPDT: IWMI GIAM 10 km V 2.0 (actual irrigated area) 2 FAO/UF V3.0 3 (area<br />
/ Serial Country available for irrigation) Season 1 Season 2 Continuous <strong>An</strong>nualized sum equipped for irrigation)<br />
no. (name) (ha) (ha) (ha) (ha) (ha) (ha)<br />
1 China 108,464,668 75,716,724 68,078,042 7,582,798 151,377,564 53,823,000<br />
2 India 99,758,291 72,661,809 53,728,631 5,961,653 132,352,093 57,291,407<br />
3 United States 27,593,858 18,187,246 4,009,305 2,122,793 24,319,345 27,913,872<br />
4 Russia 21,724,537 14,433,390 2,116,702 224,828 16,774,920 4,878,000<br />
5 Pakistan 13,169,652 7,904,691 7,310,581 761,592 15,976,865 14,417,464<br />
6 Argentina 8,867,096 3,603,392 1,606,411 3,559,386 8,769,190 1,437,275<br />
7 Thailand 6,457,890 3,231,776 2,211,410 1,960,171 7,403,357 4,985,708<br />
8 Bangladesh 5,125,146 3,905,840 3,095,460 207,678 7,208,978 3,751,045<br />
9 Turkey 5,974,186 2,761,592 1,760,856 2,035,164 6,557,613 4,185,910<br />
10 Kazakhstan 6,992,104 4,642,545 1,771,090 83,740 6,497,375 1,855,200<br />
11 Myanmar(Burma) 4,332,698 3,374,777 2,811,490 148,298 6,334,565 1,841,320<br />
12 Uzbekistan 3,478,349 2,756,935 2,450,146 136,167 5,343,248 4,223,000<br />
13 Australia 5 12,491,207 2,991,344 0 1,997,198 4,988,543 2,056,580<br />
14 Vietnam 4,263,540 1,874,807 1,426,573 1,672,071 4,973,451 3,000,000<br />
15 Brazil 4,045,823 2,169,411 871,121 1,054,221 4,094,752 2,656,284<br />
16 Mexico 3,672,395 1,824,156 918,909 875,439 3,618,504 6,104,956<br />
17 Indonesia 3,042,001 1,226,109 720,339 1,387,312 3,333,760 4,459,000<br />
18 Egypt 2,086,783 1,635,864 1,492,034 165,802 3,293,700 3,245,650<br />
19 Spain 3,297,105 1,518,353 684,889 825,576 3,028,818 3,268,306<br />
20 Germany 2,243,204 1,645,822 1,320,932 40,618 3,007,371 531,120<br />
21 Canada 2,552,921 1,730,705 1,125,880 21,616 2,878,200 785,046<br />
22 France 2,392,733 1,253,032 832,465 609,042 2,694,538 2,000,000<br />
23 Italy 2,738,565 1,343,532 540,518 762,720 2,646,771 2,698,000<br />
24 Iraq 2,069,099 1,242,776 1,255,061 130,080 2,627,917 3,525,000<br />
25 Iran 2,449,769 1,314,261 680,080 500,407 2,494,749 6,913,800<br />
26 Japan 2,421,219 1,163,261 661,990 656,204 2,481,455 3,129,000<br />
27 Ukraine 2,897,304 1,641,055 262,150 493,691 2,396,895 2,454,000<br />
28 Korea, Dem. Rep. 1,416,926 941,017 928,854 194,454 2,064,325 1,460,000<br />
29 Romania 2,284,667 1,135,323 317,566 609,086 2,061,974 2,880,000<br />
30 Turkmenistan 1,445,506 1,002,854 914,026 101,577 2,018,457 1,744,100<br />
31 Sudan 1,655,761 1,185,367 643,653 101,686 1,930,706 1,946,200<br />
32 Philippines 1,497,696 1,028,455 591,493 176,059 1,796,007 1,550,000<br />
53
<strong>An</strong>nex 1 Table 1—Continued<br />
33 Nepal 1,246,620 695,610 542,955 269,266 1,507,830 1,168,349<br />
34 Chile 1,406,997 703,642 346,252 396,457 1,446,351 1,900,000<br />
35 Korea, Rep. 1,158,106 554,327 441,120 337,394 1,332,841 880,365<br />
36 Morocco 980,306 579,448 460,976 114,810 1,155,234 1,258,200<br />
37 United Kingdom 928,027 812,560 233,964 15,958 1,062,483 142,687<br />
38 Ne<strong>the</strong>rlands 851,187 694,225 303,472 29,609 1,027,306 565,000<br />
39 Bulgaria 1,278,137 583,272 63,415 372,702 1,019,389 800,000<br />
40 Denmark 1,067,861 983,934 3,421 0 987,355 476,000<br />
41 Cambodia 720,137 484,187 333,182 130,837 948,207 284,172<br />
42 Afghanistan 947,542 407,380 220,990 302,120 930,489 3,199,070<br />
43 South Africa 784,336 576,713 207,303 47,075 831,090 1,270,000<br />
44 Azerbaijan 799,114 443,714 219,278 162,853 825,845 1,453,318<br />
45 Sri Lanka 952,459 170,126 111,959 529,747 811,831 570,000<br />
46 Venezuela 858,551 500,989 94,309 214,156 809,455 570,219<br />
47 Kyrgyzstan 677,822 454,213 252,222 75,962 782,396 1,075,040<br />
48 Greece 903,007 274,386 107,522 393,260 775,167 1,422,000<br />
49 Czech Republic 530,117 381,198 322,088 245 703,531 24,000<br />
50 Taiwan, Province <strong>of</strong> China 478,783 283,242 314,976 81,017 679,235 525,528<br />
51 Cuba 472,586 343,565 269,846 25,386 638,797 870,319<br />
52 Syria 530,763 303,170 235,858 60,399 599,428 1,266,900<br />
53 Colombia 520,214 337,011 176,585 79,445 593,042 900,000<br />
54 Saudi Arabia 633,218 143,566 89,075 319,015 551,655 1,730,767<br />
55 Belgium 339,050 298,109 207,725 8,293 514,127 40,000<br />
56 Tajikistan 379,993 285,599 162,341 15,504 463,444 719,200<br />
57 Poland 358,917 269,367 186,154 779 456,300 100,000<br />
58 Somalia 362,273 162,650 118,095 123,533 404,279 200,000<br />
59 Mongolia 409,334 266,498 110,864 0 377,362 57,300<br />
60 Peru 340,094 189,812 113,944 71,243 374,999 1,195,228<br />
61 Uruguay 385,666 312,476 25,694 22,431 360,602 181,200<br />
62 Guinea 303,231 154,644 96,324 71,445 322,412 92,880<br />
63 Portugal 347,119 133,746 54,648 126,582 314,976 632,000<br />
64 Senegal 205,909 151,324 131,809 13,213 296,345 71,400<br />
65 Ecuador 272,538 128,255 85,158 68,145 281,558 863,370<br />
66 Malaysia 250,224 124,916 67,419 85,408 277,743 362,600<br />
67 Serbia 170,062 141,236 92,620 1,910 235,766 57,000<br />
68 Moldova 285,993 164,373 20,450 48,490 233,313 307,000<br />
69 Albania 222,984 118,384 55,931 53,745 228,060 340,000<br />
70 Nigeria 194,048 103,263 61,984 51,069 216,317 300,350<br />
71 Libya 216,115 67,172 60,075 82,771 210,018 360,500<br />
72 Hungary 226,338 167,588 15,320 5,162 188,070 210,000<br />
73 Bolivia 210,739 28,854 9,777 124,402 163,033 128,240<br />
54
<strong>An</strong>nex 1 Table 1—Continued<br />
74 Ethiopia 179,682 62,157 25,604 75,047 162,809 160,785<br />
75 Guinea-Bissau 109,103 86,441 68,305 4,076 158,821 17,115<br />
76 Georgia 127,484 97,552 46,535 2,907 146,994 300,000<br />
77 New Zealand 120,277 68,146 58,034 15,505 141,686 577,882<br />
78 Algeria 138,198 91,202 35,104 11,759 138,065 555,500<br />
79 Macedonia 178,927 113,304 9,663 8,814 131,781 55,000<br />
80 Armenia 104,091 75,467 38,389 8,089 121,945 286,027<br />
81 Laos 106,678 80,672 22,460 8,562 111,694 295,535<br />
82 Israel 100,739 40,098 37,233 32,025 109,356 183,408<br />
83 Kenya 83,045 53,136 37,446 14,303 104,886 66,610<br />
84 Guyana 91,488 61,989 31,006 10,253 103,249 150,134<br />
85 Cote d’Ivoire 94,620 79,734 20,856 1,742 102,332 72,750<br />
86 Tunisia 104,157 30,355 23,664 46,628 100,647 384,943<br />
87 Austria 116,114 70,292 19,415 10,670 100,377 46,000<br />
88 Swaziland 143,177 97,323 0 0 97,323 67,400<br />
89 Guatemala 66,888 47,948 40,864 2,726 91,538 129,803<br />
90 Dominican Republic 68,524 45,574 25,957 8,335 79,866 269,710<br />
91 Yemen 84,925 43,244 16,073 20,203 79,521 388,000<br />
92 Honduras 66,580 51,243 21,117 5,623 77,984 73,210<br />
93 Slovakia 101,600 72,363 1,094 2,671 76,128 174,000<br />
94 Madagascar 70,356 41,957 19,277 14,634 75,869 1,087,000<br />
95 Ghana 60,614 28,560 24,306 19,395 72,261 6,374<br />
96 Finland 122,773 72,205 0 0 72,205 64,000<br />
97 Sweden 77,749 70,806 1,173 0 71,979 115,000<br />
98 United Arab Emirates 87,658 10,249 4,867 55,486 70,602 280,341<br />
99 Thegambia 39,778 36,530 29,693 0 66,222 0<br />
100 Mali 58,389 38,220 26,101 1,559 65,879 191,470<br />
101 Rwanda 67,983 64,918 0 0 64,918 4,000<br />
102 Belarus 79,442 61,047 195 0 61,243 115,000<br />
103 Mozambique 53,332 39,384 16,703 4,539 60,627 116,715<br />
104 Haiti 52,310 30,563 15,657 8,491 54,710 91,502<br />
105 Jordan 68,752 718 710 51,622 53,050 76,912<br />
106 Cameroon 53,793 35,752 5,990 10,944 52,686 20,970<br />
107 Tanzania 47,976 34,289 7,852 5,467 47,609 150,000<br />
108 Croatia 35,690 29,150 15,898 1,225 46,273 3,000<br />
109 Panama 47,954 22,418 6,552 16,803 45,772 34,626<br />
110 Lithuania 54,132 41,892 0 0 41,892 9,000<br />
111 Switzerland 30,375 21,175 15,939 0 37,114 25,000<br />
112 <strong>An</strong>gola 22,810 16,672 14,371 3,116 34,159 75,000<br />
55
<strong>An</strong>nex 1 Table 1—Continued<br />
113 Sierra Leone 22,071 17,160 13,408 213 30,781 29,360<br />
114 Uganda 31,372 27,004 3,447 183 30,634 9,120<br />
115 Oman 17,486 15,335 14,962 0 30,297 72,630<br />
116 Qatar 36,633 0 0 27,975 27,975 12,520<br />
117 Chad 24,686 15,986 8,070 3,747 27,803 14,020<br />
118 Kuwait 35,695 0 0 27,259 27,259 6,968<br />
119 Mauritania 18,780 12,287 12,462 877 25,625 49,200<br />
120 Paraguay 28,575 13,331 1,754 10,499 25,584 67,000<br />
121 Lebanon 23,421 11,313 8,234 5,943 25,490 117,113<br />
122 Togo 21,917 9,886 7,583 6,892 24,361 7,008<br />
123 Nicaragua 16,054 12,314 10,070 614 22,998 61,365<br />
124 Suriname 19,581 14,680 5,070 1,159 20,909 51,180<br />
125 Congo, Dem. Rep. 22,666 19,326 191 773 20,291 10,500<br />
126 Costa Rica 12,273 9,730 5,448 613 15,791 103,084<br />
127 Benin 15,192 4,492 3,897 7,283 15,671 10,236<br />
128 Burkina Faso 14,684 4,539 4,420 5,702 14,661 24,331<br />
129 Estonia 24,053 14,521 0 0 14,521 4,000<br />
130 Bosnia and Herzegovina 10,670 6,697 5,445 2,062 14,204 2,000<br />
131 Montenegro 10,611 7,048 5,704 1,417 14,169 0<br />
132 Eritrea 16,190 11,749 2,309 0 14,058 28,124<br />
133 Puerto Rico 11,350 7,181 1,689 2,588 11,457 37,079<br />
134 El Salvador 11,262 7,887 2,508 54 10,448 44,993<br />
135 Namibia 10,041 7,508 1,795 0 9,303 6,142<br />
136 Burundi 11,548 880 36 8,005 8,921 14,400<br />
137 Gaza Strip 6,990 4,144 4,161 375 8,680 0<br />
138 Latvia 12,647 7,395 65 0 7,460 20,000<br />
139 Niger 4,622 3,822 1,836 0 5,659 66,480<br />
140 Cyprus 6,851 2,787 165 1,983 4,934 55,813<br />
141 Jamaica 4,767 3,113 492 1,006 4,611 25,214<br />
142 Botswana 5,363 3,794 590 0 4,384 1,381<br />
143 East Timor 3,885 3,312 850 0 4,162 14,000<br />
144 Mauritius 5,024 2,381 0 1,528 3,910 17,500<br />
145 Lesotho 5,431 3,681 0 0 3,681 2,722<br />
146 Belize 3,507 2,977 306 286 3,568 3,000<br />
147 Zimbabwe 4,505 3,234 299 0 3,533 116,577<br />
148 <strong>An</strong>tigua and Barbuda 2,453 1,635 965 384 2,984 130<br />
149 French Guyana 2,956 2,264 351 254 2,869 2,000<br />
56
<strong>An</strong>nex 1 Table 1—Continued<br />
150 West Bank 3,036 682 675 1,444 2,801 0<br />
151 Malawi 3,275 2,794 0 0 2,794 28,000<br />
152 Equatorial guinea 3,005 2,691 0 0 2,691 0<br />
153 Guadeloupe 1,910 1,498 342 183 2,022 2,000<br />
154 Trinidad and Tobago 2,096 1,822 46 48 1,916 3,600<br />
155 Bhutan 1,305 1,073 831 0 1,904 38,734<br />
156 Norway 2,257 1,458 130 0 1,589 127,000<br />
157 St. Kitts and Nevis 1,508 1,314 84 48 1,445 18<br />
158 Virgin Islands 859 611 403 91 1,105 0<br />
159 Central African Republic 1,213 1,086 0 0 1,086 135<br />
160 Brunei 780 481 369 152 1,002 1,000<br />
161 San Marino 1,268 0 0 903 903 0<br />
162 Reunion 661 517 329 0 846 12,000<br />
163 Comoros 415 381 349 0 730 130<br />
164 Djibouti 866 587 0 0 587 407<br />
165 Zambia 748 0 0 536 536 46,400<br />
166 Slovenia 468 293 217 0 510 2,000<br />
167 Liberia 442 302 142 53 497 2,100<br />
168 <strong>An</strong>guilla 414 404 0 0 404 0<br />
169 Montserrat 130 101 129 0 231 0<br />
170 Turks and Caicos Islands 192 117 0 53 170 0<br />
171 Papua New Guinea 68 56 46 0 102 0<br />
172 Luxembourg 66 48 42 0 89 0<br />
173 St. Pierre and Miquelon 59 59 0 0 59 0<br />
174 Cayman Islands 60 55 0 0 55 0<br />
175 Monaco 75 0 0 53 53 0<br />
Note:<br />
1. Sub-pixel area from coefficients <strong>of</strong> Google Earth estimate<br />
2. Sub-pixel area from combined coeficients <strong>of</strong> high resolution images and sub-pixel decomposition technique<br />
3. <strong>Area</strong> equipped for irrigation from Food and Agricultural Organization and University <strong>of</strong> Frankfurt Global <strong>Map</strong> <strong>of</strong> <strong>Irrigated</strong> <strong>Area</strong> Version 3.0 (based on national statistics)<br />
4. <strong>Area</strong> irrigated obtianed from FAO-Aquastat and Earth trends (http://faostat.fao.org/faostat / http://earthtrends.wri.org/country_pr<strong>of</strong>iles/)<br />
5. Wold total was computed as per table 9a (480 m ha)<br />
6. Australian irrigated area was computed using <strong>the</strong> procedure described in annex 2<br />
57
<strong>An</strong>nex 2<br />
The crop calendars <strong>of</strong> <strong>the</strong> classes for Australia differ significantly from those <strong>of</strong> <strong>the</strong> rest <strong>of</strong> <strong>the</strong> world. Hence, <strong>the</strong> Australian area was calculated<br />
based on <strong>the</strong> country crop calendar. However, we have retained <strong>the</strong> same irrigated area fractions as global, except for class 19 for which <strong>the</strong> fraction<br />
was 0.10. Based on this approach, <strong>the</strong> country area for Australia is shown in table A2 below.<br />
<strong>An</strong>nex 2 Table 1.<br />
<strong>Irrigated</strong> areas <strong>of</strong> Australia, based on GIAM 10-km.<br />
<strong>Irrigated</strong> Sub pixel Season 1 Season 1 Season 2 Season 2 Continuous Continuous <strong>An</strong>nualized sum<br />
area fraction <strong>Irrigated</strong> <strong>Irrigated</strong> sub pixel <strong>Irrigated</strong> sub pixel <strong>Irrigated</strong> sub pixel sub pixel<br />
based on area from area fraction <strong>Irrigated</strong> area fraction <strong>Irrigated</strong> area fraction <strong>Irrigated</strong> <strong>Irrigated</strong><br />
Google earth Google Eye based on area from based on area from based on area from area from Class<br />
Class Full pixel estimate Estimates Mean Mean Mean Mean Mean<br />
No. name area (IAF-GEE) (SPA-GEE) IAF-HRI IAF-HRI IAF-HRI IAF-HRI IAF-HRI<br />
(FPA) & IAF-SPDT & IAF-SPDT & IAF-SPDT & IAF-SPDT & IAF-SPDT & IAF-SPDT & IAF-SPDT<br />
coefficient coefficient coefficient coefficient<br />
hectares unitless hectares unitless hectares unitless hectares unitless hectares hectares<br />
1 <strong>Irrigated</strong>, surface water, single crop, wheat-corn-cotton 2,323,345 0.61 1409496 0.61 1,413,271 1,413,271<br />
2 <strong>Irrigated</strong>, surface water, single crop, cotton-rice-wheat 0 0.82 0 0<br />
3 <strong>Irrigated</strong>, surface water, continuous crop, mixed-crops 154,806 0.62 95438 0.46 28,575 28,575<br />
4 <strong>Irrigated</strong>, surface water, double crop, rice-wheat-cotton 1,101,872 0.68 744131 0.53 579,284 579,284<br />
5 <strong>Irrigated</strong>, surface water, double crop, rice-wheat-cotton-corn 374,332 0.62 230339 0.56 211,373 211,373<br />
6 <strong>Irrigated</strong>, surface water, double crop, rice-wheat-plantations 0 0.71 0 0<br />
7 <strong>Irrigated</strong>, surface water, double crop, sugarcane 0 0.70 0 0<br />
8 <strong>Irrigated</strong>, surface water, double crop, mixed-crops 927,486 0.60 551854 0.37 343,170 343,170<br />
9 <strong>Irrigated</strong>, surface water, continuous crop, sugarcane 14,757 0.49 7168 0.42 6,250 6,250<br />
10 <strong>Irrigated</strong>, surface water, continuous crop, plantations 158,568 0.57 90701 0.44 69,263 69,263<br />
11 <strong>Irrigated</strong>, ground water, continuous crop, rice-sugarcane 1,095,506 0.55 598877 0.49 536,236 536,236<br />
12 <strong>Irrigated</strong>, ground water, single crop, corn-soybean 675 0.69 463 0.49 328.27 328<br />
13 <strong>Irrigated</strong>, ground water, single crop,rice and o<strong>the</strong>r crops 0 0.78 0 0<br />
14 <strong>Irrigated</strong>, ground water, continuous crop, mixed-crops 22,859 0.42 9572 0.38 3,015 3,015<br />
15 <strong>Irrigated</strong>, ground water, single crop, rice and o<strong>the</strong>r crops 4,147 0.71 2945 0.55 2,275 2,275<br />
16 <strong>Irrigated</strong>, conjunctive use, single crop, wheat-corn-soy 396,998 0.82 326472 0.47 185,688 185,688<br />
bean-rice<br />
17 <strong>Irrigated</strong>, conjunctive use, continuouscrop, wheat-corn-orc 33,855 0.62 20964 0.57 10,596 10,596<br />
hards-rice<br />
18 <strong>Irrigated</strong>, conjunctive use, continuous crop, corn-soybeans 175,158 0.77 135017 0.51 33,672 33,672<br />
-o<strong>the</strong>r crops<br />
58
<strong>An</strong>nex 2 Table 1—Continued<br />
19 <strong>Irrigated</strong>, conjunctive use, continuous crop, pastures 8,545,969 0.74 6341109 0.05 427,298 427,298<br />
20 <strong>Irrigated</strong>, conjunctive use, single crop, pasture, wheat, 404,811 0.74 299560 0.46 186,694 186,694<br />
sugarcane<br />
21 <strong>Irrigated</strong>, conjunctive use, continuous crop, mixed-crops 743,262 0.73 540930 0.57 240,337 240,337<br />
22 <strong>Irrigated</strong>, conjunctive use,continuous crop, rice-wheat- 273,153 0.69 187793 0.49 67,470 67,470<br />
sugacane<br />
23 <strong>Irrigated</strong>, conjunctive use, double crop, sugarcane- 0 0.64 0 0<br />
o<strong>the</strong>r crops<br />
24 <strong>Irrigated</strong>, conjunctive use, continuous crop, mixed-crops 65,684 0.53 34484 0.48 14,073 14,073<br />
25 <strong>Irrigated</strong>, conjunctive use, continuous crop, rice-wheat 37,231 0.48 17899 0.47 17,638 17,638<br />
26 <strong>Irrigated</strong>, conjunctive use, continuous crop, rice- 342,888 0.67 228153 0.50 170,514 170,514<br />
wheat-corn<br />
27 <strong>Irrigated</strong>, conjunctive use, continuous crop, sugarcane- 358,996 0.77 277531 0.55 197,681 197,681<br />
orchards-rice<br />
28 <strong>Irrigated</strong>, conjunctive use, continuous crop, mixed-crops 438,858 0.78 340244 0.56 243,845 243,845<br />
17,995,215 12,491,139 2,991,344 1,997,198 4,988,543<br />
During <strong>the</strong> next phase, <strong>the</strong> irrigated areas will be computed based on a) country-wise crop calendar, and b) country-wise crop coefficient.<br />
59
Acronyms and Abbreviations<br />
2d-FS<br />
2-Dimensional Feature Space<br />
AOAW<br />
All O<strong>the</strong>r <strong>Area</strong>s <strong>of</strong> <strong>the</strong> <strong>World</strong> Segment<br />
AVHRR<br />
Advanced Very High Resolution Radiometer<br />
BGW<br />
Brightness-Greenness-Wetness<br />
CRU<br />
Climatic Research Unit<br />
CBIP<br />
Central Board <strong>of</strong> Irrigation and Power<br />
DAAC<br />
Distributed Active Archive Centers<br />
DCP<br />
Degree Confluence Project<br />
DTED<br />
Digital Terrain Elevation Data<br />
DEM<br />
Digital Elevation Model<br />
EDC<br />
EROS Data Center<br />
EGT1500 Elevation Greater than 1,500 m Segment<br />
ERDAS<br />
Earth Resources Digital <strong>An</strong>alysis System<br />
EROS<br />
Earth Resources Observation Systems<br />
ETM+<br />
Enhanced Thematic mapper plus<br />
FAO<br />
Food and Agriculture Organization <strong>of</strong> <strong>the</strong> UN<br />
FGT75<br />
Forest Cover Greater than 75 Percent<br />
Generic-IWMI-628 Generic IWMI 628 Class <strong>Map</strong><br />
GIS<br />
Geographic Information System<br />
GLC2000 Global Land Cover Classification for <strong>the</strong> Year 2000<br />
GIAM<br />
Global <strong>Irrigated</strong> <strong>Area</strong> <strong>Map</strong><br />
GMRCA<br />
Global <strong>Map</strong> <strong>of</strong> Rain-fed Cropland <strong>Area</strong>s<br />
GMLULCA Global <strong>Map</strong> <strong>of</strong> Land Use/Land Cover <strong>Area</strong>s<br />
GPS<br />
Global Positioning System<br />
GSFC<br />
Goddard Space Flight Center<br />
GTOPO30 Global Digital Elevation Model (DEM) with a Horizontal Grid Spacing <strong>of</strong> 30 Arc-<br />
Seconds (Approximately 1 km)<br />
IGBP<br />
<strong>International</strong> Geosphere Biosphere Program<br />
IMW<br />
<strong>International</strong> <strong>Map</strong> <strong>of</strong> <strong>the</strong> <strong>World</strong><br />
IWMI<br />
<strong>International</strong> <strong>Water</strong> Management Institute<br />
IWMI-DSP <strong>International</strong> <strong>Water</strong> Management Institute Data Storehouse Pathway<br />
ISOCLASS Statistical Clustering Algorithm in ERDAS<br />
JERS-SAR Japanese Earth Resources Satellite-Syn<strong>the</strong>tic Aperture Radar<br />
JPEG2000 Joint Photographic Experts Group New Imaging Compression Standard<br />
LULC<br />
Land Use/Land Cover<br />
MODIS<br />
Moderate Resolution Imaging Spectroradiometer<br />
NPOESS National Polar Operational Environmental Satellite System<br />
MIR<br />
Mid-Infrared<br />
MODIS<br />
Moderate-Resolution Imaging Spectro-Radiometer<br />
MVC<br />
Maximum Value Composite<br />
NASA<br />
National Aeronautics and Space Administration<br />
NDVI<br />
Normalized Difference Vegetation Index<br />
NESDIS<br />
National Environmental Satellite Data and Information System<br />
NIR<br />
Near-Infrared<br />
NGDC<br />
National Geophysical Data Center<br />
60
NOAA<br />
National Oceanic and Atmospheric Agency<br />
NPOESS National Polar Operational Environmental Satellite System<br />
PCA<br />
Principal Component <strong>An</strong>alysis<br />
PGT2400 Precipitation Greater than 2400<br />
RFSAR<br />
Rain Forest Syn<strong>the</strong>tic Aperture Radar<br />
SCS<br />
Spectral Correlation Similarity<br />
SMT<br />
Spectral Matching Technique<br />
SP-DCT<br />
Sub-Pixel Decomposition Technique<br />
SSV<br />
Spectral Similarity Value<br />
SPOT<br />
Satellites Pour l’Observation de la Terre or Earth-Ubserving Satellites<br />
SPOT VGT SPOT Végétation Sensor<br />
ST-SC’s<br />
Space Time Spiral Curves<br />
TAAI<br />
Total <strong>Area</strong> Available for Irrigation<br />
Terra<br />
Earth Observing System (EOS) Satellite-NASA Flagship Satellite under Earth<br />
System Enterprise<br />
TLT280<br />
Temperature Less than 280 Degree Kelvin<br />
USGS<br />
United States Geological Survey<br />
UTM<br />
Universal Transverse Mercator<br />
VNIR<br />
Visible and Near-Infrared<br />
VIIRS<br />
Visible and Infrared Imaging Radiometer Suite<br />
WGS84 <strong>World</strong> Geodetic System 1984<br />
61
Literature Cited<br />
Agrawal, S.; Joshi, P.K.; Shukla, Y. and Roy, P.S. 2004. Spot-vegetation multi temporal data for classifying vegetation<br />
in South Central Asia. Current Science 84(11): 1440-1448.<br />
Bartholome´, E. and Belward, A.S. 2005. GLC2000: A new approach to global land cover mapping from earth<br />
observation data. <strong>International</strong> Journal <strong>of</strong> Remote Sensing 26(9): 1959-1977.<br />
Biggs, T.; Thenkabail, P.; Krishna, M.G.; Scott, C.; Parthasaradhi, G.R. and Turral, H. 2006. Vegetation phenology and<br />
irrigated area mapping using combined MODIS time-series, ground surveys, and agricultural census data in<br />
Krishna river basin, India. <strong>International</strong> Journal <strong>of</strong> Remote Sensing (in review).<br />
Campbell, J.B. 1987. Introduction to Remote Sensing. New York: The Guilford Press. pp. 551.<br />
Congalton, R.G. and Green, K. 1999. Assessing <strong>the</strong> accuracy <strong>of</strong> remotely sensed data: principles and practices.<br />
New York: Lewis Publishers.<br />
DeFries, R.; Hansen, M.; Townshend, J.R.G.; Janetos, A.C. and Loveland, T.R.. 2000a. Continuous fields 1 km tree<br />
cover. College Park, Maryland: The Global Land Cover Facility.<br />
DeFries, R.; Hansen, M.; Townshend, J.R.G.; Janetos, A.C. and Loveland, T.R. 2000b. A new global 1km data set <strong>of</strong><br />
percent tree cover derived from remote sensing. Global Change Biology 6: 247-255.<br />
DeFries, R. S. and Townshend, J. R. G. 1994. Global land cover: Comparison <strong>of</strong> groundbased data sets to classifications<br />
with AVHRR data. In Environmental remote sensing from regional to global scales, ed. G. M. Foody and P. J.<br />
Curran. New York: Wiley. pp. 84–110.<br />
DeFries, R.; Hansen, M. and Townshend, J. 1995. Global discrimination <strong>of</strong> land cover types from metrics derived from<br />
AVHRR Pathfinder data. Remote Sensing <strong>of</strong> Environment 54: 209–222.<br />
DeFries, R.; Hansen, M.; Townsend, J. G. R. and Sohlberg, R. 1998. Global land cover classifications at 8 km<br />
resolution: The use <strong>of</strong> training data derived from Landsat imagery in decision tree classifiers. <strong>International</strong> Journal<br />
<strong>of</strong> Remote Sensing 19: 3141– 3168.<br />
Döll, P. and Siebert, S. 1999. A digital global irrigated area map. Kassel <strong>World</strong> <strong>Water</strong> Series 1. Germany: Center for<br />
Environmental Systems Research, University <strong>of</strong> Kassel, Germany, 23 pp + Appendix. [Download pdf,]. Version 2:<br />
Update for Latin America and Europe; new methodology to combine statistical and geographical information<br />
Döll, P. and Siebert, S. 2000. A digital global irrigated area map. ICID Journal 49(2): 55-66<br />
Drake, N.A.; Mackin, S. and Settle. J.J. 1997. Spectral matching and mixture modelling <strong>of</strong> SWIR AVIRIS imagery. In<br />
Proceedings <strong>of</strong> <strong>the</strong> 23rd <strong>An</strong>nual Conference <strong>of</strong> <strong>the</strong> Remote Sensing Society: RSS’97 Observations & Interactions,<br />
Reading, 410-415<br />
Droogers, P. 2002. Global irrigated area mapping: Overview and recommendations. Working Paper 36. Colombo, Sri<br />
Lanka: <strong>International</strong> <strong>Water</strong> Management Institute. pp. 54.<br />
Farrand, W.H. and Harsanyi, J.C. 1997. <strong>Map</strong>ping <strong>the</strong> distribution <strong>of</strong> mine tailings in <strong>the</strong> Coeur d’Alene river valley,<br />
Idaho, through <strong>the</strong> use <strong>of</strong> a constrained energy minimization technique. Remote Sensing <strong>of</strong> Environment 59: 64-<br />
76.<br />
Fleig, A. J.; Heath, D. F.; Klenk, K.F.; Oslik, N.; Lee, K. D.; Park, H.; Bartia, P. K. and Gordon, D. 1984. User’s guide for<br />
<strong>the</strong> Solar Backscattered Ultraviolet (SBUV) and <strong>the</strong> Total Ozone <strong>Map</strong>ping Spectrometer (TOMS) RUT-S and RUT-<br />
T data sets: October 31, 1978 to November 1980. NASA Reference Publication 1112.<br />
Foody, G. M.; Boyd, D. S. and Curran, P. J. 1996. Relations between tropical forest biophysical properties and data<br />
acquired in AVHRR channels 1± 5. <strong>International</strong> Journal <strong>of</strong> Remote Sensing 17: 1341± 1355.<br />
Granahan, J. C. and Sweet J. N. 2001. <strong>An</strong> evaluation <strong>of</strong> atmospheric correction techniques using <strong>the</strong> spectral<br />
similarity scale, IEEE 2001. <strong>International</strong> Geoscience and Remote Sensing Symposium, 2001. 5: 2022-2025.<br />
Hallant, L. H. J.; Ian, P.P.; Chris, M. and Priestley, G. 2001. Prediction <strong>of</strong> sheet and rill erosion over <strong>the</strong> Australian<br />
continent: Incorporating monthly soil loss distribution. Technical Report 13/01. Canberra, Australia: CSIRO Land<br />
and <strong>Water</strong>.<br />
62
Homayouni, S. and Roux, M. 2003. Material mapping from hyperspectral images using spectral matching in urban<br />
area. Submitted to IEEE Workshop in Honour <strong>of</strong> Pr<strong>of</strong>. Landgrebe, Washington, D.C., USA Oct. 2004.<br />
IGBP (<strong>International</strong> Geosphere-Biosphere Programme). 1990. Global change. Report No. 12. Stockholm, Sweden.<br />
Kidwell, K. 1991. NOAA Polar Orbiter data user’s guide. NCDC/SDSD. Washington, D.C.: National Climatic Data<br />
Center.<br />
Kogan, F.N. and Zhu, X. 2001. Evolution <strong>of</strong> long-term errors in NDVI time series: 1985-1999. Advances in Space<br />
Research 28 (1): 149-154.<br />
Li, X. B.; Chen, Y. H.; Shi, P. J. and Chen, J. 2003. Detecting vegetation fractional coverage <strong>of</strong> typical steppe in<br />
nor<strong>the</strong>rn China-based on multi-scale remotely sensed data. Acta Botanica Sinica 45 (10): 1146-1156.<br />
Loveland, T.R.; Reed, B.C.; Brown, J.F.; Ohlen, D.O.; Zhu, J.; Yang, L. and Merchant, J.W. 2000. Development <strong>of</strong> a<br />
global land cover characteristics database and IGBP DISCover from 1-km AVHRR data. <strong>International</strong> Journal <strong>of</strong><br />
Remote Sensing v. 21 (6/7): 1,303-1,330.<br />
Maletta, H. 1998. Irrigation in Brazil: Overview and policies. Inter-American Development Bank - NOMISMA Spa,<br />
Brazil - Agricultural Sector Review, Bologna (Italy).<br />
Maletta, H. 1999. Thematic study: Irrigation - Latin American paper - Draft 1 - Date: 31/10/1999. <strong>World</strong> commission on<br />
Dams.<br />
Merrett, S. 2002. <strong>Water</strong> for agriculture: Irrigation agriculture in international perspectives. Spon’s Environmental<br />
Science and Engineering Series. Pp. 235. New York, NY, USA: Taylor and Francis.<br />
Mitchell, T.D.; Carter, T.R.; Jones, P.D.; Hulme, M. and New, M. 2003. A comprehensive set <strong>of</strong> high-resolution grids <strong>of</strong><br />
monthly climate for Europe and <strong>the</strong> globe: The observed record (1901-2000) and 16 scenarios (2001-2100).<br />
Journal <strong>of</strong> Climate (submitted).<br />
NGDC (National Geophysical Data Center). 1994. 5 Minute gridded world elevation. Boulder: NGDC Data<br />
<strong>An</strong>noucement DA 93-MGG-01.<br />
Olson, J.S. 1994a. Global ecosystem framework: Definitions. USGS EROS Data Center Internal Report, Sioux Falls,<br />
SD, 37 p.<br />
Olson, J.S. 1994b. Global ecosystem framework: Translation strategy. USGS EROS Data Center Internal Report, 39<br />
p.<br />
Postel, S., 1999. Pillars <strong>of</strong> sand: Can <strong>the</strong> irrigation miracle last? New York: W.W. Norton.<br />
Purevdorj, T.; Tateishi, R.; Ishiyama, T. and Honda, Y. 1998. Relationships between percent vegetation cover and<br />
vegetation indices. Int. J. Remote Sensing 19 (18): 3519- 3535.<br />
Purevdorj, T. and Tateishi, D. 2001. Estimation <strong>of</strong> percent vegetation cover <strong>of</strong> grassland in Mongolia using NOAA<br />
AVHRR data. GIS development. ACRS 1997, Poster presentation 1.<br />
Rao, C. R. N. 1993a. Nonlinearity corrections for <strong>the</strong> <strong>the</strong>rmal infrared channels <strong>of</strong> <strong>the</strong> Advanced Very High Resolution<br />
Radiometer: Assessment and recommendations. NOAA Technical Report NESDIS-69. NOAA/NESDIS. Washington,<br />
D.C.<br />
Rao, C. R. N. 1993b. Degradation <strong>of</strong> <strong>the</strong> visible and near-infrared channels <strong>of</strong> <strong>the</strong> Advanced Very High Resolution<br />
Radiometer on <strong>the</strong> NOAAP9 spacecraft: Assessment and recommendations for corrections. NOAA Technical<br />
Report NESDIS-70. NOAA/NESDIS. Washington, D.C.<br />
Saatchi, S.; Agosti, D.; Alger, K.; Delabie, J. and Musinsky, J. 2001. Examining fragmentation and loss <strong>of</strong> primary forest<br />
in <strong>the</strong> sou<strong>the</strong>rn Bahian Atlantic Forest <strong>of</strong> Brazil with radar imagery. Conservation Biology 15: 867-875.<br />
Saatchi, S.S. and McDonald, K.C. 1997. Coherent effects in microwave backscattering models for forest canopies.<br />
IEEE Transactions on Geoscience and Remote Sensing 35: 1032-1045.<br />
Saatchi, S.S. and Rignot, E. 1997. Classification <strong>of</strong> boreal forest cover types using SAR images. Remote Sensing <strong>of</strong><br />
Environment 60: 270-281.<br />
63
Saatchi, S.S.; Nelson, B.; Podest, E. and Holt, J. 2000. <strong>Map</strong>ping land cover types in <strong>the</strong> Amazon basin using 1 km<br />
JERS-1. <strong>International</strong> Journal <strong>of</strong> Remote Sensing 21: 1201-1235.<br />
Saatchi, S.S.; Soares, J.V. and Alves, D.S. 1997. <strong>Map</strong>ping deforestation and land use in Amazon rainforest by using<br />
SIR-C imagery. Remote Sensing <strong>of</strong> Environment 59: 191-202.<br />
SAS Institute. 2004. SAS/STAT user’s guide and s<strong>of</strong>tware release, version 8.2, ed. Cary, N. C. SAS Institute.<br />
Schwarz, J. and Staenz, K. 2001. Adaptive threshold for spectral matching <strong>of</strong> hyperspectral data. Canadian Journal<br />
<strong>of</strong> Remote Sensing 27 (3): 216-224.<br />
Seckler, D.; Amarasinghe, U.; de Fraiture, C.; Keller, A.; Molden, D. and Sakthivadivel, R., eds. 2000. <strong>World</strong> water<br />
supply and demand: 1995 to 2025. Colombo, Sri Lanka: <strong>International</strong> <strong>Water</strong> Management Institute.<br />
Settle, J.J. and Drake, N.A. 1993. Linear mixing and <strong>the</strong> estimation <strong>of</strong> ground cover proportions. <strong>International</strong> Journal<br />
<strong>of</strong> Remote Sensing 14: 1159-1177.<br />
Shippert, P. 2001. Spectral and hyperspectral analysis with ENVI. ASPRS ENVI user’s group notes. April 22-28,<br />
<strong>An</strong>nual meeting <strong>of</strong> <strong>the</strong> American Society <strong>of</strong> Photogrammetry and Remote Sensing, St. Louis, Missouri, USA.<br />
Siebert, S. and Döll, P. 2001. A digital global irrigated area map – <strong>An</strong> update for Latin America and Europe. Kassel<br />
<strong>World</strong> <strong>Water</strong> Series 4, Center for Environmental Systems Research, University <strong>of</strong> Kassel, Germany, 14 pp +<br />
Appendix. [Download pdf, 0.7 MB] . Version 2.1: Update for Africa and Australia, using <strong>the</strong> map generation method<br />
described in Siebert and Döll (2001)<br />
Siebert, S.; Döll, P. and Hoogeveen, J. 2002. Global irrigated area map version 2.1. Center for Environmental<br />
Systems Research, University <strong>of</strong> Kassel, Germany, and FAO, Rome, Italy. Online documentation and download <strong>of</strong><br />
5 min map <strong>of</strong> irrigated area version 2.1.<br />
Siebert, S., Döll, P., Hoogeveen, J., Faures, J., Frenken, K. and Feick, S. 2005. Development and validation <strong>of</strong> <strong>the</strong><br />
global map <strong>of</strong> irrigation areas. Hydrology and Earth System Sciences, 9, 535–547.<br />
Siebert, S., Döll, P., Feick, S., and Hoogeveen, J. 2005, Global map <strong>of</strong> irrigated areas version 3.0 Johann Wolfgang Goe<strong>the</strong><br />
University, Frankfurt am Main, Germany / Food and Agriculture Organization <strong>of</strong> <strong>the</strong> United Nations, Rome, Italy.<br />
Smith, P.M.; Kalluri, S.N.V.; Prince, S.D. and DeFries, R.S. 1997. The NOAA/NASA Pathfinder AVHRR 8-km land data<br />
set. Potogrammetric Engineering and Remote Sensing 63:12-31.<br />
Thenkabail, P.S.; GangadharaRao, P.; Biggs, T.; Krishna, M. and Turral, H. 2006. Spectral matching techniques to<br />
determine historical Land Use/Land Cover (LULS) and irrigated areas using time-series AVHRR pathfinder data<br />
sets in <strong>the</strong> Krishna river basin, India. Photogrammetric Engineering and Remote Sensing (in press).<br />
Thenkabail, P.S.; Schull, M. and Turral, H. 2005a. Ganges and Indus river basin Land Use/Land Cover (LULC) and<br />
irrigated area mapping using continuous streams <strong>of</strong> MODIS data. Remote Sensing <strong>of</strong> Environment 95(3): 317-341.<br />
Thenkabail, P.S.; Enclona, E.A.; Ashton, M.S.; Legg, C. and Jean De Dieu, M. 2005b. Hyperion, IKONOS, ALI, and<br />
ETM+ sensors in <strong>the</strong> study <strong>of</strong> African rainforests. Remote Sensing <strong>of</strong> Environment 90:23-44.<br />
Thenkabail, P.S.; Enclona, E.A.; Ashton, M.S. and Van Der Meer, V. 2005c. Accuracy assessments <strong>of</strong> hyperspectral<br />
waveband performance for vegetation analysis applications. Remote Sensing <strong>of</strong> Environment 91(2-3): 354-376.<br />
Thenkabail, P.S.; Stucky, N.; Griscom, B.W.; Ashton, M.S.; Diels, J.; Van Der Meer, B. and Enclona, E. 2005d. Biomass<br />
estimations and carbon stock calculations in <strong>the</strong> oil palm plantations <strong>of</strong> African derived savannas using IKONOS<br />
data. <strong>International</strong> Journal <strong>of</strong> Remote Sensing 25(23):5447-5472.<br />
Thenkabail, P.S.; Gamage, N. and Smakhin, V. 2005e. The use <strong>of</strong> remote sensing data for drought assessment and<br />
monitoring in south west Asia. IWMI Research Report # 85. Pp. 25. Colombo, Sri Lanka: <strong>International</strong> <strong>Water</strong><br />
Management Institute.<br />
Tou, J.T. and Gonzalez, R. C. 1975. Pattern recognition principles. Reading, Massachusetts: Addison-Wesley<br />
Publishing Company.<br />
Tucker, C.J.; Grant, D.M. and Dykstra, J.D. 2005. NASA’s Global Orthorectified Landsat data set. Photogrammetric<br />
Engineering & Remote Sensing 70(3): 313-322.<br />
64
Turral, H. 2002. Global irrigated area-working document. Colombo, Sri Lanka: <strong>International</strong> <strong>Water</strong> Management<br />
Institute. U.S. Geological Survey. 1994. Digital elevation models, data user guide 5. Virginia: Reston. 50 p.<br />
van Schilfgaarde, Jan. 1994. Irrigation-A blessing or a curse. Agricultural <strong>Water</strong> Management 25: 203-219.<br />
Verdin, K. and Jenson, S. 1996, Development <strong>of</strong> continental scale DEMs and extraction <strong>of</strong> hydrographic features,<br />
Proceedings <strong>of</strong> <strong>the</strong> Third Conference on GIS and Environmental Modeling, Santa Fe, New Mexico, NCGIA.<br />
Verdin, K.L. and Greenlee, S.K. 1996. Development <strong>of</strong> continental scale digital elevation models and extraction <strong>of</strong><br />
hydrographic features. In Proceedings, Third <strong>International</strong> Conference/Workshop on Integrating GIS and<br />
Environmental Modeling.<br />
Xiaoyang Z; Drake, N. and Wainwright, J. 1998. Downscaling land surface parameters for global soil erosion estimation<br />
using no ancillary data.<br />
65
Research Reports<br />
90. Working Wetlands: Classifying Wetland Potential for Agriculture. Mat<strong>the</strong>w P.<br />
McCartney, Mutsa Masiyandima and Helen A. Houghton-Carr. 2005.<br />
91. When “Conservation” Leads to Land Degradation: Lessons from Ban Lak Sip,<br />
Laos. Guillaume Lestrelin, Mark Giordano and Bounmy Keohavong. 2005.<br />
92. How Pro-Poor are Participatory <strong>Water</strong>shed Management Projects?—<strong>An</strong> Indian<br />
Case Study. Ma<strong>the</strong>w Kurian and Ton Dietz. 2005.<br />
93. Adoption and Impacts <strong>of</strong> Microirrigation Technologies: Empirical Results from<br />
Selected Localities <strong>of</strong> Maharashtra and Gujarat States <strong>of</strong> India. Regassa E. Namara,<br />
Bhawana Upadhyay and R. K. Nagar. 2005.<br />
94. Balancing Irrigation and Hydropower: A Case Study from Sou<strong>the</strong>rn Sri Lanka. François<br />
Molle, Priyantha Jayakody, Ranjith Ariyaratne and H.S. Somatilake. 2005.<br />
95. Irrigation and <strong>Water</strong> Policies in <strong>the</strong> Mekong Region: Current Discourses and<br />
Practices. François Molle. 2005.<br />
96. Locating <strong>the</strong> Poor: Spatially Disaggregated Poverty <strong>Map</strong>s for Sri Lanka. Upali A.<br />
Amarasinghe, Madar Samad and Markandu <strong>An</strong>puthas. 2006.<br />
97. Strategies to Mitigate Secondary Salinization in <strong>the</strong> Indus Basin <strong>of</strong> Pakistan: A<br />
Selective Review. M. Aslam and S. A. Prathapar. 2006.<br />
98. Multiple-Use <strong>Water</strong> Services to Advance <strong>the</strong> Millennium Development Goals.<br />
Barbara van Koppen, Patrick Moriarty and Eline Boelee. 2006.<br />
99. Irrigation and Schistosomiasis in Africa: Ecological Aspects. Eline Boelee and<br />
Henry Madsen. 2006.<br />
100. The Reliability Improvement in irrigation Services: Application <strong>of</strong> Rotational <strong>Water</strong><br />
Distribution to Tertiary Canals in Central Asia. Iskandar Abdullaev, Mehmood Ul<br />
Hassan, Herath Manthrithilake and Murat Yakubov. 2006.<br />
101. Carbon, Land and <strong>Water</strong>: A Gobal <strong>An</strong>alysis <strong>of</strong> <strong>the</strong> Hydrologic Dimensions <strong>of</strong><br />
Climate Change Mitigation through Afforestation/Reforestation. Robert J. Zomer,<br />
<strong>An</strong>tonio Trabucco, Oliver van Straaten and Deborah A. Bossio. (not published<br />
yet) 2006.<br />
102. Informal Irrigation in Urban West Africa: <strong>An</strong> Overview. Pay Drechsel, Sophie Graefe,<br />
Moise Sonou and Olufunke O. C<strong>of</strong>ie. (not published yet) 2006.<br />
103. Title: Malaria Mosquito Resistance to Agricultural Insecticides: Risk <strong>Area</strong> <strong>Map</strong>ping<br />
in Thailand. Hans. J. Overgaard. (not published yet) 2006.<br />
104. Use <strong>of</strong> a Hydrological Model for Environmental Management <strong>of</strong> <strong>the</strong> Usangu<br />
Wetlands, Tanzania. Japhet J. Kashaigili, Mat<strong>the</strong>w P. McCartney, Henry F. Mahoo,<br />
Bruce A. Lankford, Boniface P. Mbilinyi, Daniel K. Yawson, and Siza D. Tumbo.<br />
(not published yet) 2006.
SM<br />
Postal Address<br />
P O Box 2075<br />
Colombo<br />
Sri Lanka<br />
Location<br />
127, Sunil Mawatha<br />
Pelawatta<br />
Battaramulla<br />
Sri Lanka<br />
Telephone<br />
+94-11-2787404<br />
Fax<br />
+94-11-2786854<br />
E-mail<br />
iwmi@cgiar.org<br />
Website<br />
http://www.iwmi.org<br />
<strong>International</strong><br />
<strong>Water</strong> Management<br />
Institute<br />
IWMI is a Future Harvest Center<br />
supported by <strong>the</strong> CGIAR<br />
ISBN 92-9090-646-4<br />
ISBN 978-92-9090-646-9