2005 Annual Report - JB Hi Fi
2005 Annual Report - JB Hi Fi
2005 Annual Report - JB Hi Fi

Create successful ePaper yourself
Turn your PDF publications into a flip-book with our unique Google optimized e-Paper software.
NOTES TO THE FINANCIAL STATEMENTS<br />
for the financial year ended 30 June <strong>2005</strong><br />
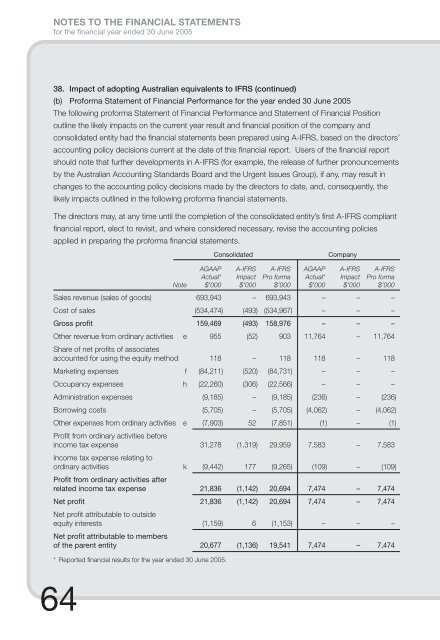
38. Impact of adopting Australian equivalents to IFRS (continued)<br />
(b) Proforma Statement of <strong>Fi</strong>nancial Performance for the year ended 30 June <strong>2005</strong><br />
The following proforma Statement of <strong>Fi</strong>nancial Performance and Statement of <strong>Fi</strong>nancial Position<br />
outline the likely impacts on the current year result and fi nancial position of the company and<br />
consolidated entity had the fi nancial statements been prepared using A-IFRS, based on the directors’<br />
accounting policy decisions current at the date of this fi nancial report. Users of the fi nancial report<br />
should note that further developments in A-IFRS (for example, the release of further pronouncements<br />
by the Australian Accounting Standards Board and the Urgent Issues Group), if any, may result in<br />
changes to the accounting policy decisions made by the directors to date, and, consequently, the<br />
likely impacts outlined in the following proforma fi nancial statements.<br />
The directors may, at any time until the completion of the consolidated entity’s fi rst A-IFRS compliant<br />
fi nancial report, elect to revisit, and where considered necessary, revise the accounting policies<br />
applied in preparing the proforma fi nancial statements.<br />
Consolidated<br />
Company<br />
AGAAP A-IFRS A-IFRS AGAAP A-IFRS A-IFRS<br />
Actual* Impact Pro forma Actual* Impact Pro forma<br />
Note $’000 $’000 $’000 $’000 $’000 $’000<br />
Sales revenue (sales of goods) 693,943 – 693,943 – – –<br />
Cost of sales (534,474) (493) (534,967) – – –<br />
Gross profit 159,469 (493) 158,976 – – –<br />
Other revenue from ordinary activities e 955 (52) 903 11,764 – 11,764<br />
Share of net profi ts of associates<br />
accounted for using the equity method 118 – 118 118 – 118<br />
Marketing expenses f (84,211) (520) (84,731) – – –<br />
Occupancy expenses h (22,260) (306) (22,566) – – –<br />
Administration expenses (9,185) – (9,185) (236) – (236)<br />
Borrowing costs (5,705) – (5,705) (4,062) – (4,062)<br />
Other expenses from ordinary activities e (7,903) 52 (7,851) (1) – (1)<br />
Profi t from ordinary activities before<br />
income tax expense 31,278 (1,319) 29,959 7,583 – 7,583<br />
Income tax expense relating to<br />
ordinary activities k (9,442) 177 (9,265) (109) – (109)<br />
Profit from ordinary activities after<br />
related income tax expense 21,836 (1,142) 20,694 7,474 – 7,474<br />
Net profit 21,836 (1,142) 20,694 7,474 – 7,474<br />
Net profi t attributable to outside<br />
equity interests (1,159) 6 (1,153) – – –<br />
Net profit attributable to members<br />
of the parent entity 20,677 (1,136) 19,541 7,474 – 7,474<br />
* <strong>Report</strong>ed fi nancial results for the year ended 30 June <strong>2005</strong>.<br />
64